Modernizing Georgia's Transportation System: TRIP ...
←
→
Page content transcription
If your browser does not render page correctly, please read the page content below
Modernizing Georgia’s
                    Transportation System:
                 Progress and Challenges in Providing Safe, Efficient and
                     Well-Maintained Roads, Highways and Bridges

Founded in 1971, TRIP ® of Washington, DC, is a nonprofit organization that researches, evaluates and distributes economic and
technical data on surface transportation issues. TRIP is sponsored by insurance companies, equipment manufacturers, distributors
and suppliers; businesses involved in highway and transit engineering and construction; labor unions; and organizations concerned
with efficient and safe surface transportation.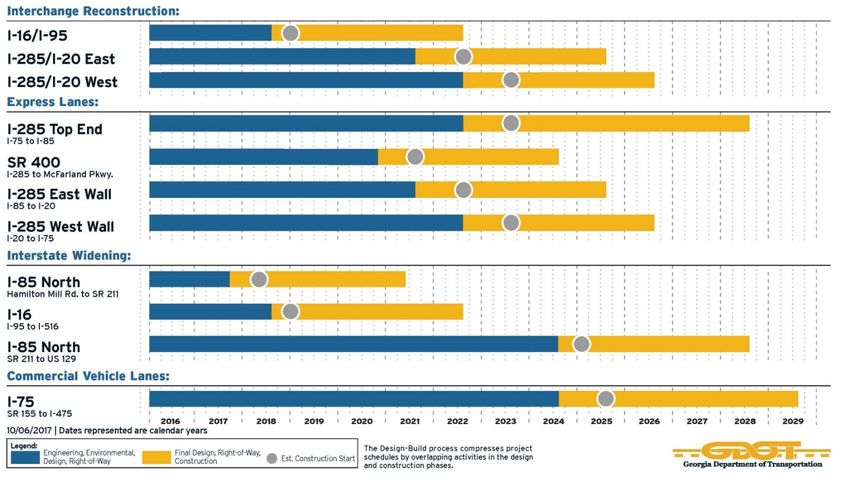
Modernizing Georgia’s Transportation System

                                            Executive Summary

       Three years ago, faced with inadequate investment in the state’s transportation system to support a
growing population and quality of life, the Georgia legislature approved a long-term increase in
transportation funding.
       The 2015 Transportation Funding Act (TFA) provided a significant boost in transportation funding in
Georgia, allowing the state to address many of its critical transportation challenges. Approval of the TFA
has allowed the state to increase its investment in road, highway and bridge repairs and roadway safety
improvements. It has also enabled the acceleration of numerous highway improvements, including the
Major Mobility Investment Program, to relieve traffic congestion and support economic development
opportunities in the Peach State.
       With an economy based largely on agriculture, manufacturing, industry and tourism, and with
Atlanta serving as the chief distributor of goods and the communications and transportation center for the
Southeast, the quality of Georgia’s transportation system plays a vital role in the state’s economic growth
and quality of life. An efficient, safe and well-maintained transportation system provides economic and
social benefits by affording individuals access to employment, housing, healthcare, education, goods and
services, recreation, entertainment, family, and social activities. It also provides businesses access to
suppliers, markets and employees, all critical to a business’ level of productivity and ability to expand.
Reduced accessibility and mobility - as a result of traffic congestion, a lack of adequate capacity, or
deteriorated roads, highways, bridges and transit facilities - diminishes a region’s quality of life by reducing
economic productivity and limiting opportunities for economic, health or social transactions and activities.
       While approval of the TFA greatly improves Georgia’s ability to fund needed roadway repairs and
improvements, with Georgia’s population anticipated to increase by 2.5 million people over the next two
decades, the state will continue to face transportation challenges. From continuing to maintain its aging
transportation system to further improving roadway safety and making additional transportation
improvements to serve the future needs of its growing economy, Georgia will need additional increases in
reliable transportation funding from local, state and federal governments. Achieving the state’s goals for a
modern, well-maintained and safe transportation system will require staying the course with Georgia’s
current transportation program and achieving additional increases in transportation investment.
Modernizing Georgia’s Transportation System                     2

TRANSPORTATION FUNDING AND NEEDED TRANSPORTATION PROJECTS
Transportation funding provided by the 2015 Transportation Funding Act will allow for the completion of
numerous projects throughout the state to improve road and bridge conditions, relieve traffic congestion,
and improve traffic safety. While the additional transportation funding will allow dozens of needed
projects to proceed, many other transportation projects still lack adequate funding.

    •    The 2015 Transportation Funding Act (HB 170) replaced the existing gasoline tax with an excise tax of
         26 cents per gallon on gasoline and 29 cents on diesel (which will be indexed on the Consumer Price
         Index and Georgia CAFE Standards), added a $200 fee on personal electric vehicles and a $300 fee for
         commercial electric vehicles, instated a $5 per night hotel room tax, and included a heavy truck
         impact fee of between $50 and $100 depending on the weight of the vehicle.

    •    The legislation is expected to provide an additional $5.4 billion for transportation from 2016 to 2021,
         an average of approximately $900 million per year.

    •    The chart below details anticipated additional funds that will be made available each year through
         2021 due to the passage of the TFA.
                                                 Additional Funds Available Due To
                                                 2015 Transportation Funding Act
                                                    2016           $       765,114,468
                                                    2017           $       845,629,709
                                                    2018           $       909,160,509
                                                    2019           $       933,198,709
                                                    2020           $       958,896,609
                                                    2021           $       984,938,609

    •    Proceeds from the TFA will allow for increased funding for maintenance, preservation,
         reconstruction, capacity expansion and local projects. The chart below details recent and projected
         expenditures by the Georgia Department of Transportation (GDOT) for maintenance, preservation,
         reconstruction, highway and bridge capacity expansion, and local projects from 2015 through 2021.

                                  2015              2016              2017              2018              2019              2020              2021
Maintenance                 $ 229,307,807     $ 439,212,982     $ 435,507,607     $ 457,707,607     $ 407,807,607     $ 407,807,607     $ 409,557,607
Preservation                $ 149,498,149     $ 540,428,310     $ 402,757,327     $ 435,000,000     $ 445,000,000     $ 351,000,000     $ 384,533,496
Reconstruction              $ 386,008,730     $ 596,765,332     $ 768,475,712     $ 769,970,171     $ 680,834,971     $ 877,955,322     $ 537,497,117
Highway & Bridge Capacity   $ 806,645,330     $ 969,440,861     $ 871,036,192     $ 950,181,206     $ 1,065,279,411   $ 1,399,129,477   $ 1,129,079,630
Local Projects              $ 228,870,489     $ 258,202,963     $ 287,306,796     $ 305,015,382     $ 257,215,147     $ 310,125,453     $ 213,073,980
TOTAL EXPENDITURES          $ 1,800,330,506   $ 2,804,050,449   $ 2,765,083,635   $ 2,917,874,367   $ 2,856,137,135   $ 3,346,017,859   $ 2,673,741,830
HB 170 REVENUE                    N/A         $ 765,114,468     $ 845,629,709     $ 909,160,509     $ 933,198,709     $ 958,896,609     $ 984,938,609

    •    The charts below detail transportation projects in the state’s largest urban areas and statewide that
         will be underway by 2021, partially as a result of increased transportation funding.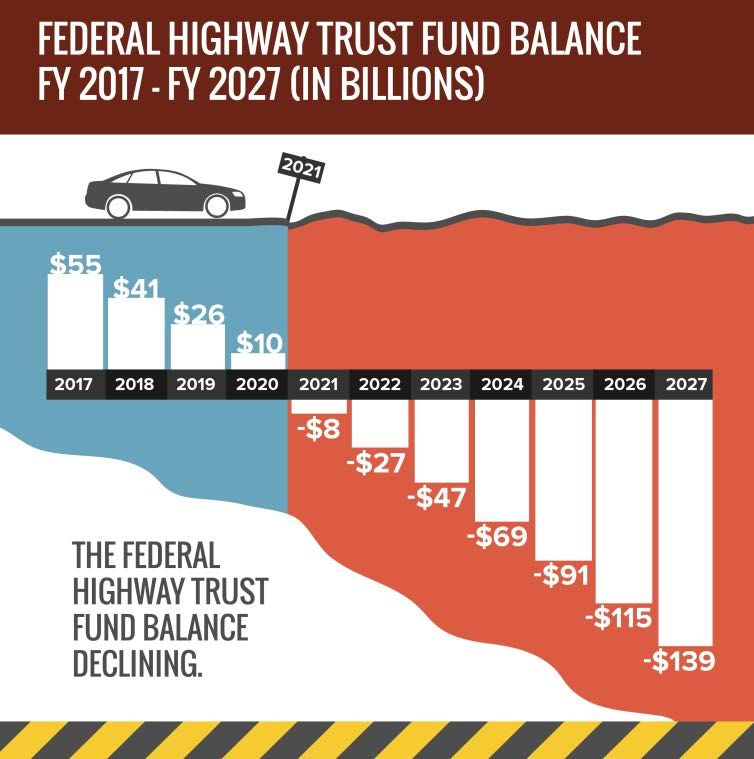
Modernizing Georgia’s Transportation System                                      3

                       Project Description                        County/Counties               Improvement           Year       Cost               Benefit of Project
                                                                        Atlanta Urban Area
I-20 FROM COLUMBIA DR TO PANOLA RD - MOVABLE BARRIERS        DeKalb                      Barriers                     2020     $18.4M     Congestion Relief
I-75 NB CD SYSTEM FROM SR 331 TO I-285                       Clayton                     Ramp                         2018     $41.8M     Congestion Relief
SR 3/US 19/US 41 FROM S OF TARA RD TO S OF SR 54             Clayton                     Widening                     2019     $30.4M     Congestion Relief
WEST WINDER BYP-CR 325/MATTHEWS SCHL RD TO SR 211- PH I      Barrow                      Widening                     2018     $38.3M     Congestion Relief, Safety
SR 316 @ SR 81, @ SR 11, & @ SR 53                           Barrow                      Interchanges (3)             2018     $47.0M     Congestion Relief, Safety
SR 20-SHARON CHURCH RD TO BRAND RD; 3 INTERSECTIONS          Gwinnett, Walton            Widening                    2020-21   $47.6M     Congestion Relief, Safety
SR 92-SR 3/US 41 TO GLADE RD                                 Cobb                        Widening                     2019     $31.8M     Congestion Relief, Safety
SR 9-WINDWARD PKWY TO FORSYTH CO LINE                        Fulton                      Widening                     2021     $31.5M     Congestion Relief, Safety
SR 9-FULTON CO LINE TO SR 141                                Forsyth                     Widening                     2021     $55.8M     Congestion Relief, Safety
SR 20- I-575 TO NORTH CORNERS PKWY                           Cherokee, Forsyth           Widening                    2019-21   $91.0M     Congestion Relief, Safety
MLK JR DRIVE @ RICH'S PARKING LOT IN ATLANTA                 Fulton                      Bridges                      2019     $44.0M     Replace Outdated Bridge
I-75-CHATTAHOOCHEE RVR TO ALLGOOD ROAD                       Cobb                        Resurfacing & Maintenance    2018     $32.0M     Preservation
I-20 FROM SR 5 TO SWEETWATER CREEK                           Douglas                     Resurfacing & Maintenance    2019     $31.7M     Preservation
                                                                        Augusta Urban Area
I-20 @ SAVANNAH RIVER                                        Richmond                    Bridges                      2019     $72.2M     Congestion Relief, Safety
SR 10-FORT GORDON NEW ACP/GATE 6 TO SR 223                   Richmond                    Widening                     2018     $16.2M     Congestion Relief, Military Access
SR 4/US 25BU-SAVANNAH RIVER AT SC STATE LINE                 Richmond                    Bridges                      2021     $16.2M     Replace Outdated Bridge
SR 388- I-20 TO SR 232                                       Columbia                    Widening                     2019     $8.1M      Congestion Relief
SR 4 -MILLEDGEVILLE RD TO GOVERNMENT ST                      Richmond                    Widening                     2020     $5.0M      Congestion Relief
                                                                       Columbus Urban Area
SR 219 -SCHLEY CREEK NW OF COLUMBUS                          Muscogee                    Bridges                      2020     $2.2M      Replace Outdated Bridge
SR 520/US 280 EB & WB - BAGLEY CREEK 2 MI SE OF CUSSETA      Chattahoochee               Bridges                      2020     $2.3M      Replace Outdated Bridge
SR 85/US 27 ALT SB & NB - CR 1660/MILLER RD IN COLUMBUS      Muscogee                    Bridges                      2021     $4.8M      Replace Outdated Bridge
SR 22/US 80 - KENDALL CREEK IN COLUMBUS                      Muscogee                    Bridges                      2020     $1.7M      Replace Outdated Bridge
SR 22/US 80 - FLATROCK CREEK IN COLUMBUS                     Muscogee                    Bridges                      2021     $3.0M      Replace Outdated Bridge
                                                                        Macon Urban Area
I-16 EB FROM I-75 TO WALNUT CREEK - PHASE IV                 Bibb                        Bridges                      2021     $128.7M    Bottleneck Relief; Congestion Relief
I-16 WB FROM I-75 TO WALNUT CREEK - PHASE V                  Bibb                        Bridges                      2021     $97.2M     Bottleneck Relief; Congestion Relief
I-16 EB & WB - OCMULGEE RIVER OVERFLOW                       Bibb                        Bridges                      2021     $10.8M     Bottleneck Relief; Congestion Relief
SR 11/SR 49 -ROCKY CRK & TOBESOFKEE CRK &OVFLW               Bibb                        Bridges                      2019     $16.3M     Replace Outdated Bridge
SR 11/SR 49/US 41 - 1.4 MI S OF MACON                        Bibb                        Bridges                      2020     $3.8M      Econ. Dev.
                                                                       Savannah Urban Area
I-16 FROM I-95 TO I-516                                      Chatham                     Widening                    2018-21   $130.2M    Bottleneck & Congestion Relief
I-16 - I-95 INTERCHANGE RECONSTRUCTION                       Chatham                     Interchange                 2018-21   $125.4M    Bottleneck & Congestion Relief
CR 787/ISLANDS EXPWY - WILMINGTON RVR/BASCULE BRIDGE         Chatham                     Bridges                      2018     $56.0M     Replace Outdated Bridges
JIMMY DELOACH PXWY EXT - I-16 TO SR 26/US 80                 Chatham                     New location roadway         2018     $26.3M     Freight Bottleneck & Congestion Relief
BRAMPTON RD FROM SR 21/SR 25 TO SR 21 SPUR                   Chatham                     New location roadway         2019     $43.3M     Freight Bottleneck & Congestion Relief
                                                                       Other Areas in Georgia
MCCAYSVILLE BYPASS FROM SR 5 TO TN STATE LINE                Fannin                      New location roadway         2020      $31.3M    Congestion relief; Econ. Dev.
SR 5 - SR 2/BLUE RIDGE N TO PROP MCCAYSVILLE BYP NR CR 138   Fannin                      Widening                     2020      $61.0M    Congestion relief; Econ. Dev.
SR 133 - S OF SR 35/US 319 TO N OF CR540 HOLLY DR            Colquitt, Worth, Dougherty Widening                     2019-20    $185.7M   Econ.Dev.; Freight corridor
SR 24/US 441 - PUTNAM CO LN TO N OF CS 646/PIERCE DAIRY RD   Morgan                      Widening                     2021      $32.6M    Econ.Dev.; Freight corridor
SR 4/US 1- N OF WILLIAMS CK TO GREEN OAK RD                  Toombs                      Widening                    2020-21    $145.4M   Econ.Dev.; Freight corridor
SE ROME BYP - SR 101 NE ON NEW LOC TO US 411                 Floyd                       Roadway Project              2019      $61.9M    Congestion relief; Econ. Dev.
EFFINGHAM PKWY- CR 156/BLUE JAY/EFFINGHAM TO SR 30/CHATHAM Effingham                     New Location Roadway         2020      $29.4M    Congestion relief; Econ. Dev.
SR 4/US 1 -N OF NIMROD RD TO LOUISVILLE BPS                  Jefferson                   Widening                     2021      $31.1M    Econ. Dev.
SPOUT SPRINGS RD - I-985 TO UNION CIRCLE - PHASE I           Hall                        Widening                     2019      $39.5M    Congestion Relief
CR 274/CS 1078/LAKE PARK BELLVILLE RD - SR 7 TO I-75         Lowndes                     Widening                     2021      $32.3M    Congestion Relief; Econ. Dev.
SR 515/US 76 FM YOUNG HARRIS ST/UNION TO TIMBERLINE DR/TOWNS Towns, Union                Widening                     2020     $65.5M     Congestion Relief; Econ. Dev.
SR 67 FM I-16 TO STATESBORO BYPASS                           Bulloch                     Widening                     2019     $24.2M     Congestion Relief; Econ. Dev.
SR 1/US 27/LAGRANGE FM AUBURN ST TO SR 219/MORGAN ST         Troup                       Widening                     2019     $10.9M     Congestion Relief

     •    Despite the additional funding, many needed projects will still lack sufficient funding to proceed. The
          below charts detail needed projects in the state’s largest urban area and statewide that lack
          sufficient funding to proceed prior to 2022.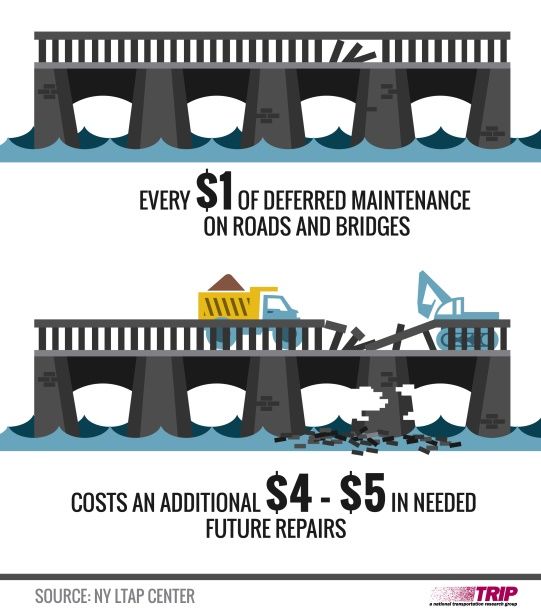
Modernizing Georgia’s Transportation System                      4

                      Project Description                             County        Improvement            Cost              Project Benefit
                                                                  Atlanta Urban Area
PANOLA RD @ I-20 - FAIRINGTON RD TO SNAPFINGER WOODS DR       DeKalb               Interchange            $26.7M Ops of Inch/Mainline - RW Phase
 SR 92 -NEBO RD TO PICKETTS MILL PL                           Cobb, Paulding       Widening               $30.2M Congestion Relief
I-85 - SR 74/SENOIA RD                                        Fulton               Interchange            $35.0M Ops of Inch/Mainline - RW Phase
I-20 @ SR 138/SR 20 INTCH RECON & WIDENING                    Rockdale             Interchange            $36.4M Congestion Relief
SR 42 - DOWNTOWN MCDONOUGH TO SR 138                          Henry                Widening               $21.9M Congestion Relief; RW phase
WEST WINDER BYP @ SR 316 - NEW INTERCHANGE - PH III           Barrow               Interchange            $19.6M New Location; Access to Corridor
SR 9 - N OF SR 141 TO N OF SR 20                              Forsyth              Widening               $18.1M Congestion Relief
I-285/BOULDERCREST RD INTCH                                   DeKalb               Interchange            $35.1M Congestion Relief; Ops of Inch/Mainline
SR 166 - OLD LOWER RIVER ROD/DOUGLAS TO SR 70/FULTON          Douglas, Fulton      Widening               $19.1M Congestion Relief; RW phase
SR 20 - CR 762/UNION HILL RD TO E OF CS 579/N CORNERS PKWY    Cherokee, Forsyth    Widening              $183.9M Congestion Relief, Safety
JONESBORO RD - W OF SR 3/US 41/CLAYTON TO I-75/HENRY          Clayton, Henry       Widening               $51.7M Congestion Relief
SR 6 - I-20 WB TO SR 6 SPUR - TRUCK FRIENDLY LANES            Cobb, Douglas        Minor Widen & Resurf. $35.7M Congestion Relief
SR 61 - S OF CR 467/DALLAS NEBO RD TO SR 6                    Paulding             Widening               $41.0M Congestion Relief
SR 371 - SR 9 TO CR 5/KELLY MILL RD                           Forsyth              Widening               $41.0M Congestion Relief
                                                                  Augusta Urban Area
I-20 - MCDUFFIE CO LINE TO SR 383                             Columbia             Widening               $98.3M Congestion Relief
CR 102/HEREFORD FARM ROAD FROM SR 232 TO SR 383               Columbia             Widening               $32.1M Congestion Relief
                                                                 Columbus Urban Area
SR 520/US 280 @ CHATTAHOOCHEE RVR IN COLUMBUS                 Muscogee             Bridge                 $10.8M Replace Outdated Bridge
                                                                  Macon Urban Area
I-75 - I-16 TO CR 478/PIERCE AVE - PHASE VI                   Bibb                 Widening               $65.0M Bottleneck Relief; Congestion Relief
                                                                 Savannah Urban Area
SR 144 EB - S OF CR 100 TO S OF CR 154                        Bryan                Widening               $14.3M Economic Development
SR 26/US 80 @ BULL RVR & @ LAZARETTO CRK                      Chatham              Bridge                 $74.2M Widen & Raise Bridge, Rd to Tybee Isl.
ISLANDS EXPWY - GEN MCINTOSH BLVD TO TRUMAN PKWY              Chatham              Widening               $30.4M Improved Connectivity
I-16 - CS 565/POOLER PKWY TO I-95                             Chatham              Widening               $14.0M Congestion Relief; Freight Movement
                                                                Other Areas in Georgia
I-85 - N OF SR 211 TO SR 11/US 129                            Barrow               Widening              $274.7M Congestion Relief; Freight Movement
SR 85 - S OF CR 126/BERNHARD RD TO OLD SR 92/F'VILLE          Fayette              Widening               $32.4M Congestion Relief
SR 166 BYPASS - E OF BIG INDIAN CREEK TO CS 1158/HAYS MILL RD Carroll              Widening               $68.6M Congestion Relief
SR 24 FM MADISON BPS/MORGAN TO N OF APALACHEE RVR/OCONEE Morgan, Oconee            Widening               $48.4M Congestion relief; Econ. Dev.
SR 40 - E OF ST MARYS RIVER TRIB TO E OF CR 66/COLERAIN RD    Camden, Charlton     Widening               $41.0M Congestion relief; Econ. Dev.
S ROME BYP/US 27 - SR 1 ALONG BOOZE MTN RD TO SR 101 @CR 96 Floyd                  Roadway Project        $80.7M Congestion relief; Econ. Dev.
SR 113/OLD ALA RD RELOC FM SR 113 -PUMPKINVINE CK- TO CR 699 Bartow                Widening               $63.6M Congestion Relief
ROME-CARTERSVILLE DEVELOPMENT CORRIDOR                        Bartow               Roadway Project        $71.9M Congestion relief; Econ. Dev.
SR 15 - CR 67/RIDGE RD TO EAST SPARTA BYPS                    Hancock, Washington Widening               $155.7M Economic Development
SR 44 - CR 54/LINGER LONGER RD TO E GREENSBORO BYPS           Greene               Widening               $51.9M Economic Development
SR 1 - CR 329 TO N OF CR 325 @ SR 1/US 27                     Chattooga            Widening               $63.9M Economic Development
SR 15/US 441 - NORTH CL/CLAYTON TO NC STATE LINE              Rabun                Widening               $54.5M Economic Development
I-85 - N OF SR 11 TO SC STATE LINE                            Jackson              Widening                $1.2B Congestion Relief; Freight Movement

MAJOR MOBILITY INVESTMENT PROGRAM
Approval of the TFA will allow the Georgia DOT to advance the Major Mobility Investment Program
(MMIP), which will include 11 major mobility projects throughout the state to be completed between
2021 and 2029 to relieve traffic congestion, improve the movement of freight and enhance safety.
    •    The projects, which are in the Atlanta, North Georgia, Macon and Savannah areas, include three
         interchange reconstructions, four express lane projects, the widening of three portions of Interstate
         highways and the construction of commercial vehicle lanes on a portion of 1-75 between Atlanta and
         Macon.

    •    The MMIP includes four projects to expand the Georgia Express Lanes system, which will offer a
         choice for drivers to pay a toll to bypass congestion in the Atlanta area and will provide more reliable
         trips for transit, carpools and vanpools.
Modernizing Georgia’s Transportation System 5
• When completed, the widenings of I-85 from Hamilton Mill to SR-211 and from SR-211 to US 129 in
Northeastern Georgia will reduce delays by 56 percent and 69 percent respectively; and the widening
of I-16 in Savannah from I-516 to I-95 will reduce delays by 32 percent.
• These projects require various forms of finance, so public-private partnership procurement will be
utilized. Most all projects are Design-Build-Finance or Design-Build-Finance-Operate-Maintain. GDOT
does not have sufficient funding to advance these as traditional Design-Bid-Build or Design-Build
projects. Contractor availability payments will be utilized to pay for these projects.
POPULATION, ECONOMIC AND TRAVEL TRENDS IN GEORGIA
The rate of population and economic growth in Georgia have resulted in increased demands on the state’s
major roads and highways, leading to increased wear and tear on the transportation system. Vehicle
travel in Georgia has been increasing at the second highest rate nationally since 2013.
• Georgia’s population reached approximately 10.3 million residents in 2016, a 26 percent increase
since 2000. Georgia’s population is expected to increase by another 2.5 million people by 2040, to
12.8 million. Georgia had seven million licensed drivers in 2016.
• From 2000 to 2016, Georgia’s gross domestic product, a measure of the state’s economic output,
increased by 24 percent, when adjusted for inflation.
• Vehicle miles traveled (VMT) in Georgia increased by 17 percent from 2000 to 2016 –from 105 billion
VMT in 2000 to 123 billion VMT in 2016. The rate of vehicle travel growth in Georgia has accelerated
significantly since 2013, increasing by 12 percent between 2013 and 2016, the second highest rate of
growth nationally during that period.
• By 2040, vehicle travel in Georgia is projected to increase another 40 percent.Modernizing Georgia’s Transportation System 6
GEORGIA ROAD CONDITIONS
The additional transportation funding provided by the TFA will allow GDOT to reduce the share of state-
maintained roads in poor or bad condition. However, it is not adequate to prevent the share of state
roads and highways in excellent or good condition from declining.
• Additional funding provided by the TFA has allowed GDOT to increase the annual number of road
miles that are resurfaced by two-and-a-half times. An average of 1,277 miles were resurfaced
annually from 2011 to 2015, while an average of 3,527 miles will be resurfaced annually between
2016 and 2020.
• The share of state-maintained roads in bad or poor condition is projected to fall from 13 percent in
2016 to zero by 2019, due to accelerated maintenance and repairs provided by funds from the TFA.
• Despite additional funding, the share of state-maintained roads in excellent or good condition is
projected to decline dramatically, falling from 49 percent in 2016 to just 15 percent in 2024. While
the increased funding provided by the TFA has been helpful, it is not sufficient to address the rate of
deterioration on Georgia’s major roads and highways.
PAVEMENT CONDITION ON STATE-MAINTAINED ROADS
Year Excellent Good Fair Poor Bad
2014 26% 24% 22% 19% 9%
2015 28% 23% 30% 13% 6%
2016 26% 23% 38% 9% 4%
2017 25% 22% 46% 5% 2%
2018 23% 21% 53% 2% 1%
2019 20% 20% 60% 0% 0%
2020 15% 19% 66% 0% 0%
2021 11% 17% 72% 0% 0%
2022 8% 14% 78% 0% 0%
2023 6% 12% 82% 0% 0%
2024 5% 10% 86% 0% 0%
BRIDGE CONDITIONS IN GEORGIA
One-in-twenty locally and state-maintained bridges in Georgia show significant deterioration and are
rated structurally deficient. This includes all bridges that are 20 feet or more in length.
• Statewide, five percent of Georgia’s bridges are structurally deficient. A bridge is structurally
deficient if there is significant deterioration of the bridge deck, supports or other major components.
Structurally deficient bridges are often posted for lower weight or closed to traffic, restricting or
redirecting large vehicles, including commercial trucks and emergency services vehicles.
• Additional funding provided by the TFA has allowed GDOT to increase by three-and-a-half times the
annual number of bridges it is able to repair, reconstruct or replace. An average of 67 bridges were
repaired, replaced or reconstructed each year from 2011 to 2015, while an average of 232 bridges
will be repaired, replaced or reconstructed each year between 2016 and 2020.Modernizing Georgia’s Transportation System 7
GEORGIA TRAFFIC CONGESTION
Increasing levels of traffic congestion cause significant delays in Georgia, particularly in its larger urban
areas, choking commuting and commerce. Traffic congestion robs commuters of time and money and
imposes increased costs on businesses, shippers and manufacturers, which are often passed along to the
consumer.
• The chart below details the number of hours lost to congestion annually for the average driver in the
state’s largest urban areas. It also includes the cost of congestion per motorist, in the form of lost
time and wasted fuel.
Urban Cost to Hours
Area Motorists Lost
Atlanta $1,226 56
Augusta $749 33
Savannah $697 32
Macon $372 17
Columbus $348 16
• Increasing levels of congestion add significant costs to consumers, transportation companies,
manufacturers, distributors and wholesalers, and can reduce the attractiveness of a location when a
company is considering expansion or where to locate a new facility.
• The average daily commute to work for Georgia residents is 27.2 minutes, the ninth longest among
all states.
TRAFFIC SAFETY AND FATALITY RATES IN GEORGIA
Improving safety features on Georgia’s roads and highways would likely result in a decrease in the number
of traffic fatalities and serious crashes. Traffic fatalities on Georgia’s roads and highways increased by one
third over the last two years.
• A total of 6,876 people were killed in Georgia traffic crashes from 2013 to 2017, an average of 1,375
fatalities per year.
• After decreasing slightly between 2013 and 2014 (from 1,179 to 1,164) the number of Georgia traffic
fatalities increased by 25 percent between 2014 and 2017 (from 1,164 to 1,549).
• Georgia’s overall traffic fatality rate of 1.27 fatalities per 100 million vehicle miles of travel in 2016
was higher than the national average of 1.18.
• The fatality rate on Georgia’s non-interstate rural roads in 2016 was nearly two-and-a-half times
higher than on all other roads in the state (2.41 fatalities per 100 million vehicle miles of travel vs.
1.01).Modernizing Georgia’s Transportation System 8
• The chart below details the average annual number of fatalities in the state’s largest urban areas
from 2014-2016.
Urban Ave. Fatalities
Area 2014-16
Atlanta 392
Augusta 83
Columbus 50
Macon 47
Savannah 61
• Roadway features that impact safety include the number of lanes, lane widths, lighting, lane
markings, rumble strips, shoulders, guard rails, other shielding devices, median barriers and
intersection design. The cost of serious crashes includes lost productivity, lost earnings, medical costs
and emergency services.
• Several factors are associated with vehicle crashes that result in fatalities, including driver behavior,
vehicle characteristics and roadway features. TRIP estimates that roadway features are likely a
contributing factor in approximately one-third of fatal traffic crashes.
• Where appropriate, highway improvements can reduce traffic fatalities and crashes while improving
traffic flow to help relieve congestion. Such improvements include removing or shielding obstacles;
adding or improving medians; improved lighting; adding rumble strips, wider lanes, wider and paved
shoulders; upgrading roads from two lanes to four lanes; and better road markings and traffic signals.
• Investments in rural traffic safety have been found to result in significant reductions in serious traffic
crashes. A 2012 report by the Texas Transportation Institute (TTI) found that improvements
completed recently by the Texas Department of Transportation that widened lanes, improved
shoulders and made other safety improvements on 1,159 miles of rural state roadways resulted in
133 fewer fatalities on these roads in the first three years after the improvements were completed
(as compared to the three years prior). TTI estimates that the improvements on these roads are likely
to save 880 lives over 20 years.
FEDERAL TRANSPORTATION FUNDING IN GEORGIA
Investment in Georgia’s roads, highways and bridges is funded by local, state and federal governments.
The current five-year federal surface transportation program includes modest funding increases and
provides states with greater funding certainty, but falls far short of providing the level of funding needed
to meet the nation’s highway and transit needs. The bill does not include a long-term and sustainable
revenue source.
• Most federal funds for highway and transit improvements in Georgia are provided by federal
highway user fees, largely an 18.4 cents-per-gallon tax on gasoline and a 24.4 cents-per-gallon tax on
diesel fuel. Since 2008 revenue into the federal Highway Trust Fund has been inadequate to support
legislatively set funding levels so Congress has transferred approximately $53 billion in general funds
and an additional $2 billion from a related trust fund into the federal Highway Trust Fund.Modernizing Georgia’s Transportation System 9
• Signed into law in December 2015, the Fixing America’s Surface Transportation Act (FAST Act),
provides modest increases in federal highway and transit spending. The five-year bill also provides
states with greater funding certainty and streamlines the federal project approval process. But, the
FAST Act does not provide adequate funding to meet the nation’s need for highway and transit
improvements and does not include a long-term and sustainable funding source.
• President Trump released an infrastructure investment plan in February 2018 that would provide
$200 billion in new federal grants and loans over 10 years to leverage $1.5 trillion in total project
spending nationwide on infrastructure, including surface transportation. The Trump administration’s
funding proposal would rely on state and local governments to raise the additional $1.3 trillion to
access the increased federal funding. Boosting federal surface transportation spending will require
that Congress provide a long-term and sustainable source of funding to support the federal Highway
Trust Fund.
TRANSPORTATION AND ECONOMIC GROWTH IN GEORGIA
The efficiency of Georgia’s transportation system, particularly its highways, is critical to the state’s
economy. Businesses rely on an efficient and dependable transportation system to move products and
services. A key component in business efficiency and success is the level and ease of access to customers,
markets, materials and workers.
• Annually, $790 billion in goods are shipped to and from sites in Georgia, mostly by truck.
• Seventy-nine percent of the goods shipped annually to and from sites in Georgia are carried by trucks
and another 12 percent are carried by courier services or multiple mode deliveries, which include
trucking.
• Increasingly, companies are looking at the quality of a region’s transportation system when deciding
where to re-locate or expand. Regions with congested or poorly maintained roads may see
businesses relocate to areas with a smoother, more efficient and more modern transportation
system.
• Highway accessibility was ranked the number one site selection factor in a 2016 survey of corporate
executives by Area Development Magazine. The availability of skilled labor, which is also impacted
by a site's level of accessibility, rated second.
• The Federal Highway Administration estimates that each dollar spent on road, highway and bridge
improvements results in an average benefit of $5.20 in the form of reduced vehicle maintenance
costs, reduced delays, reduced fuel consumption, improved safety, reduced road and bridge
maintenance costs and reduced emissions as a result of improved traffic flow.
Sources of information for this report include the Federal Highway Administration (FHWA), the Georgia Department of
Transportation (GDOT), the American Association of State Highway and Transportation Official (AASHTO), the Bureau
of Transportation Statistics (BTS), the U. S. Census Bureau, the Congressional Budget Office (CBO), the Texas
Transportation Institute (TTI) and the National Highway Traffic Safety Administration (NHTSA). All data used in the
report are the most recent available.Modernizing Georgia’s Transportation System 10
Introduction
Georgia’s roads, highways and bridges form vital transportation links for the state’s residents, visitors
and businesses, providing daily access to homes, jobs, shopping, natural resources and recreation.
Modernizing Georgia’s transportation system is critical to quality of life and economic competitiveness in the
Peach State.
Supporting quality of life and a robust economy in Georgia requires that the state provide a safe,
efficient and well-maintained transportation system. Inadequate transportation investment, which will
result in deteriorated transportation facilities and diminished access and safety, will negatively affect
economic competitiveness and quality of life in Georgia.
The 2015 Transportation Funding Act (HB 170) (TFA) provided a significant boost in funds available in
Georgia for the maintenance and improvement of the state’s transportation system. This increased funding
will allow Georgia to accelerate the repaving and maintenance of the state’s roads, highways and bridges,
provide additional roadway safety improvements, and fund numerous projects to relieve traffic congestion
and improve the movement of goods. The funding will also advance the state’s Major Mobility Investment
Program. However, despite the increased funding made available by approval of the TFA, Georgia still lacks
adequate funding to proceed with many transportation improvements needed to address the state’s
continued population growth or to address fully the state’s transportation challenges.
To maintain its level of economic competitiveness and achieve further economic growth, Georgia will
need to maintain and modernize its roads, highways and bridges by improving the physical condition of the
transportation network and enhancing the system’s ability to provide efficient, reliable and safe mobility for
residents, visitors and businesses. Making needed improvements to Georgia’s roads, highways, bridges and
transit systems could also provide a significant boost to the state’s economy by creating jobs in the short
term and stimulating long-term economic growth as a result of enhanced mobility and access.Modernizing Georgia’s Transportation System 11
This report examines the impact of approval of the TFA in 2015, the condition, use and safety of
Georgia’s roads, highways and bridges, and the future transportation needs of the state. Sources of
information for this report include the Georgia Department of Transportation (GDOT), the Federal Highway
Administration (FHWA), the Bureau of Labor Statistics (BLS), the American Association of State Highway and
Transportation Officials (AASHTO), the Bureau of Transportation Statistics (BTS), the U.S. Census Bureau, the
Texas Transportation Institute (TTI), and the National Highway Traffic Safety Administration (NHTSA).
Population, Travel and Economic Trends in Georgia
Georgia residents and businesses require a high level of personal and commercial mobility.
Population increases and economic growth in the state have resulted in an increase in vehicle miles of travel
(VMT) and an increase in the demand for mobility . To foster quality of life and spur continued economic
growth in Georgia, it will be critical that the state provide a safe and modern transportation system that can
accommodate future growth in population, tourism, business, recreation and vehicle travel.
Georgia’s population grew to approximately 10.3 million residents in 2016, a 26 percent increase
since 2000. 1 Georgia had seven million licensed drivers in 2016. 2
From 2000 to 2016, Georgia’s gross domestic product (GDP), a measure of the state’s economic
output, increased by 24 percent, when adjusted for inflation. U.S. GDP increased 30 percent during this
period.
From 2000 to 2016, annual VMT in Georgia increased by 17 percent, from 105 billion miles traveled
annually to 123 billion miles traveled annually. 3 The rate of vehicle travel growth in Georgia has accelerated
significantly since 2013, increasing by 12 percent between 2013 and 2016. This is the second highest rate of
growth nationally during that period. 4Modernizing Georgia’s Transportation System 12
Condition of Georgia’s Roads
The life cycle of Georgia’s roads is greatly affected by the state and local governments’ ability to
perform timely maintenance and upgrades to ensure that road and highway surfaces last as long as possible.
Additional funding provided by the TFA has allowed GDOT to increase by more than two-and-a-half
times the miles of roads resurfaced annually. An average of 1,277 miles were resurfaced annually from 2011
to 2015, while an average of 3,527 miles will be resurfaced annually between 2016 and 2020. 5
This additional funding will allow GDOT to reduce and even eliminate the share of state-
maintained roads in poor or bad condition. According to GDOT, the share of state-maintained roads in bad
or poor condition is projected to fall from 13 percent in 2016 to zero by 2019, due to accelerated
maintenance and repairs provided by funds from the 2015 Transportation Funding Act. 6
However, despite the additional funding, the share of state-maintained roads in excellent or good
condition is projected to decline significantly, falling from 49 percent in 2016 to just 15 percent in 2024. 7
While the increased funding has been helpful, it is not sufficient to address the rate of deterioration on the
transportation system.
The chart below details the share of state-maintained roads in excellent, good, fair, poor and bad
condition each year from 2014 through 2024.Modernizing Georgia’s Transportation System 13
Chart 1. Share of state-maintained roads in excellent, good, fair, poor and bad condition, 2014-2024.
PAVEMENT CONDITION ON STATE-MAINTAINED ROADS
Year Excellent Good Fair Poor Bad
2014 26% 24% 22% 19% 9%
2015 28% 23% 30% 13% 6%
2016 26% 23% 38% 9% 4%
2017 25% 22% 46% 5% 2%
2018 23% 21% 53% 2% 1%
2019 20% 20% 60% 0% 0%
2020 15% 19% 66% 0% 0%
2021 11% 17% 72% 0% 0%
2022 8% 14% 78% 0% 0%
2023 6% 12% 82% 0% 0%
2024 5% 10% 86% 0% 0%
Source: GDOT response to TRIP survey.
Pavement failure is caused by a combination of traffic, moisture and climate. Moisture often works
its way into road surfaces and the materials that form the road’s foundation. Road surfaces at intersections
are even more prone to deterioration because the slow-moving or standing loads occurring at these sites
subject the pavement to higher levels of stress. It is critical that roads are fixed before they require major
repairs because reconstructing roads costs approximately four times more than resurfacing them. 8 As roads
and highways continue to age, they will reach a point of deterioration where routine paving and
maintenance will not be adequate to keep pavement surfaces in good condition and costly reconstruction of
the roadway and its underlying surfaces will become necessary.Modernizing Georgia’s Transportation System 14
Chart 2. Pavement Condition Cycle Time with Treatment and Cost
Source: North Carolina Department of Transportation (2016). 2016 Maintenance Operations and Performance
Analysis Report
Long-term repair costs increase significantly when road and bridge
maintenance is deferred, as road and bridge deterioration
accelerates later in the service life of a transportation facility and
requires more costly repairs. A report on maintaining pavements
found that every $1 of deferred maintenance on roads and bridges
costs an additional $4 to $5 in needed future repairs. 9
Bridge Conditions in Georgia
Georgia’s bridges form key links in the state’s highway system, providing communities and
individuals access to employment, schools, shopping and medical facilities, and facilitating commerce and
access for emergency vehicles.Modernizing Georgia’s Transportation System 15
Five percent of Georgia’s locally and state maintained bridges are rated as structurally deficient. 10 A
bridge is structurally deficient if there is significant deterioration of the bridge deck, supports or other major
components. Bridges that are structurally deficient may be posted for lower weight limits or closed if their
condition warrants such action. Deteriorated bridges can have a significant impact on daily life. Restrictions
on vehicle weight may cause many vehicles – especially emergency vehicles, commercial trucks, school
buses and farm equipment – to use alternate routes to avoid posted bridges. Redirected trips also lengthen
travel time, waste fuel and reduce the efficiency of the local economy.
Additional funding provided by the TFA has allowed GDOT to increase the annual number of bridges
it is able to repair, reconstruct or replace by approximately three-and-a-half times, from an average of 67
bridges repaired, reconstructed or replaced each year from 2011 to 2015 to an annual average of 232
bridges between 2016 and 2020. 11
The service life of bridges can be extended by performing routine maintenance such as resurfacing
decks, painting surfaces, insuring that a facility has good drainage and replacing deteriorating components.
But, most bridges will eventually require more costly reconstruction or major rehabilitation to remain
operable.
Traffic Congestion in Georgia
Increasing levels of traffic congestion cause significant delays in Georgia, particularly in its larger
urban areas, choking commuting and commerce. Traffic congestion robs commuters of time and money and
imposes increased costs on businesses, shippers and manufacturers, which are often passed along to the
consumer.
The chart below details the number of hours lost to congestion annually for the average driver in theModernizing Georgia’s Transportation System 16
state’s largest urban areas. It also includes the cost per motorist of congestion in the form of lost time and
wasted fuel.
Chart 3. Annual hours lost to congestion and congestion costs for the average driver in Georgia’s largest
urban areas.
Urban Cost to Hours
Area Motorists Lost
Atlanta $1,226 56
Augusta $749 33
Savannah $697 32
Macon $372 17
Columbus $348 16
Source: TRIP Estimate Based on Analysis of Texas Transportation Institute and Federal Highway
Administration data.
Increasing levels of congestion add significant costs to consumers, transportation companies,
manufacturers, distributors and wholesalers and can reduce the attractiveness of a location when a
company is considering expansion or where to locate a new facility.
The average daily commute to work for Georgia residents is 27.2 minutes, the ninth longest among
all states. 12
Traffic Safety in Georgia
A total of 6,876 people were killed in Georgia traffic crashes from 2013 to 2017, an average of 1,375
fatalities per year. 13 After decreasing slightly between 2013 and 2014 (from 1,179 to 1,164) the number of
Georgia traffic fatalities increased by 25 percent between 2014 and 2017 (from 1,164 to 1,549). 14Modernizing Georgia’s Transportation System 17
Chart 4. Traffic Fatalities in Georgia from 2013 – 2017.
Year Fatalities
2013 1,179
2014 1,164
2015 1,430
2016 1,554
2017 1,549
TOTAL 6,876
Source: National Highway Traffic Safety Administration.
Three major factors are associated with fatal vehicle crashes: driver behavior, vehicle characteristics
and roadway features. It is estimated that roadway features are likely a contributing factor in approximately
one-third of fatal traffic crashes. Roadway features that impact safety include the number of lanes, lane
widths, lighting, lane markings, rumble strips, shoulders, guard rails, other shielding devices, median barriers
and intersection design.
Georgia’s overall traffic fatality rate of 1.27 fatalities per 100 million vehicle miles of travel in 2016 is
higher than the national average of 1.18. 15 The traffic fatality rate on the state’s rural roads is
disproportionately high. The fatality rate on Georgia’s non-interstate rural roads in 2016 was nearly two-
and-a-half times that on all other roads in the state (2.41 fatalities per 100 million vehicle miles of travel vs.
1.01). 16
The chart below details the average annual number of fatalities in each of the state’s largest urban
areas from 2013-2016.
Chart 5. Average annual fatalities in Georgia’s largest urban areas 2014-2016.
Urban Ave. Fatalities
Area 2014-16
Atlanta 392
Augusta 83
Columbus 50
Macon 47
Savannah 61
Source: National Highway Traffic Safety Administration.Modernizing Georgia’s Transportation System 18
Improving safety on Georgia’s roadways can be achieved through further improvements in vehicle
safety; improvements in driver, pedestrian, and bicyclist behavior; and a variety of improvements in
roadway safety features.
The severity of serious traffic crashes could be reduced through roadway improvements, where
appropriate, such as adding turn lanes, removing or shielding obstacles, adding or improving medians,
widening lanes, widening and paving shoulders, improving intersection layout, and providing better road
markings and upgrading or installing traffic signals. Roads with poor geometry, with insufficient clear
distances, without turn lanes, having inadequate shoulders for the posted speed limits, or poorly laid out
intersections or interchanges, pose greater risks to motorists, pedestrians and bicyclists.
Investments in rural traffic safety have been found to result in significant reductions in serious traffic
crashes. A 2012 report by TTI found that improvements completed recently by TxDOT that widened lanes,
improved shoulders and made other safety improvements on 1,159 miles of rural state roadways resulted in
133 fewer fatalities on these roads in the first three years after the improvements were completed (as
compared to the three years prior). 17 TTI estimates that the improvements on these roads are likely to save
880 lives over 20 years. 18
Transportation Funding Increases in Georgia and Needed Projects
Additional transportation funding provided by the 2015 Transportation Funding Act (HB 170) will
allow for the completion of numerous needed projects throughout Georgia including projects included in the
Major Mobility Investment Program.
The 2015 Transportation Funding Act replaced the existing gasoline tax with an excise tax of 26 cents
per gallon on gasoline and 29 cents on diesel (which will be indexed on the Consumer Price Index and
Georgia CAFE standards), added a $200 fee on personal electric vehicles and $300 fee for commercialModernizing Georgia’s Transportation System 19
electric vehicles, instated a $5 per night hotel room tax, and included a heavy truck impact fee of between
$50 and $100 depending on the weight of the vehicle.
The legislation is expected to provide an additional $5.4 billion for transportation from 2016 to 2021,
an average of approximately $900 million per year. 19 The chart below details anticipated additional funds
that will be made available each year through 2021 due to the passage of the 2015 Transportation Funding
Act.
Chart 6. Additional funds available due to 2015 Transportation Funding Act.
Additional Funds Available Due To
2015 Transportation Funding Act
2016 $ 765,114,468
2017 $ 845,629,709
2018 $ 909,160,509
2019 $ 933,198,709
2020 $ 958,896,609
2021 $ 984,938,609
Source: GDOT response to TRIP survey.
Proceeds from the 2015 TFA will allow for increased funding for maintenance, preservation,
reconstruction, capacity expansion and local projects. The chart below details expenditures by GDOT for
maintenance, preservation, reconstruction, highway and bridge capacity expansion, and local projects from
2015 through 2021.
Chart 7. GDOT expenditures for maintenance, preservation, reconstruction, highway and bridge capacity
expansion, and local projects from 2015 through 2021.
2015 2016 2017 2018 2019 2020 2021
Maintenance $ 229,307,807 $ 439,212,982 $ 435,507,607 $ 457,707,607 $ 407,807,607 $ 407,807,607 $ 409,557,607
Preservation $ 149,498,149 $ 540,428,310 $ 402,757,327 $ 435,000,000 $ 445,000,000 $ 351,000,000 $ 384,533,496
Reconstruction $ 386,008,730 $ 596,765,332 $ 768,475,712 $ 769,970,171 $ 680,834,971 $ 877,955,322 $ 537,497,117
Highway & Bridge Capacity $ 806,645,330 $ 969,440,861 $ 871,036,192 $ 950,181,206 $ 1,065,279,411 $ 1,399,129,477 $ 1,129,079,630
Local Projects $ 228,870,489 $ 258,202,963 $ 287,306,796 $ 305,015,382 $ 257,215,147 $ 310,125,453 $ 213,073,980
TOTAL EXPENDITURES $ 1,800,330,506 $ 2,804,050,449 $ 2,765,083,635 $ 2,917,874,367 $ 2,856,137,135 $ 3,346,017,859 $ 2,673,741,830
HB 170 REVENUE N/A $ 765,114,468 $ 845,629,709 $ 909,160,509 $ 933,198,709 $ 958,896,609 $ 984,938,609
Source: GDOT response to TRIP survey.
The charts below detail transportation projects in the state’s largest urban areas as well as statewide
that will be underway by 2021, partially as a result of increased transportation funding.Modernizing Georgia’s Transportation System 20
Chart 8. Projects that will be underway by 2021, partially as a result of increased transportation funding.
Project Description County/Counties Improvement Year Cost Benefit of Project
Atlanta Urban Area
I-20 FROM COLUMBIA DR TO PANOLA RD - MOVABLE BARRIERS DeKalb Barriers 2020 $18.4M Congestion Relief
I-75 NB CD SYSTEM FROM SR 331 TO I-285 Clayton Ramp 2018 $41.8M Congestion Relief
SR 3/US 19/US 41 FROM S OF TARA RD TO S OF SR 54 Clayton Widening 2019 $30.4M Congestion Relief
WEST WINDER BYP-CR 325/MATTHEWS SCHL RD TO SR 211- PH I Barrow Widening 2018 $38.3M Congestion Relief, Safety
SR 316 @ SR 81, @ SR 11, & @ SR 53 Barrow Interchanges (3) 2018 $47.0M Congestion Relief, Safety
SR 20-SHARON CHURCH RD TO BRAND RD; 3 INTERSECTIONS Gwinnett, Walton Widening 2020-21 $47.6M Congestion Relief, Safety
SR 92-SR 3/US 41 TO GLADE RD Cobb Widening 2019 $31.8M Congestion Relief, Safety
SR 9-WINDWARD PKWY TO FORSYTH CO LINE Fulton Widening 2021 $31.5M Congestion Relief, Safety
SR 9-FULTON CO LINE TO SR 141 Forsyth Widening 2021 $55.8M Congestion Relief, Safety
SR 20- I-575 TO NORTH CORNERS PKWY Cherokee, Forsyth Widening 2019-21 $91.0M Congestion Relief, Safety
MLK JR DRIVE @ RICH'S PARKING LOT IN ATLANTA Fulton Bridges 2019 $44.0M Replace Outdated Bridge
I-75-CHATTAHOOCHEE RVR TO ALLGOOD ROAD Cobb Resurfacing & Maintenance 2018 $32.0M Preservation
I-20 FROM SR 5 TO SWEETWATER CREEK Douglas Resurfacing & Maintenance 2019 $31.7M Preservation
Augusta Urban Area
I-20 @ SAVANNAH RIVER Richmond Bridges 2019 $72.2M Congestion Relief, Safety
SR 10-FORT GORDON NEW ACP/GATE 6 TO SR 223 Richmond Widening 2018 $16.2M Congestion Relief, Military Access
SR 4/US 25BU-SAVANNAH RIVER AT SC STATE LINE Richmond Bridges 2021 $16.2M Replace Outdated Bridge
SR 388- I-20 TO SR 232 Columbia Widening 2019 $8.1M Congestion Relief
SR 4 -MILLEDGEVILLE RD TO GOVERNMENT ST Richmond Widening 2020 $5.0M Congestion Relief
Columbus Urban Area
SR 219 -SCHLEY CREEK NW OF COLUMBUS Muscogee Bridges 2020 $2.2M Replace Outdated Bridge
SR 520/US 280 EB & WB - BAGLEY CREEK 2 MI SE OF CUSSETA Chattahoochee Bridges 2020 $2.3M Replace Outdated Bridge
SR 85/US 27 ALT SB & NB - CR 1660/MILLER RD IN COLUMBUS Muscogee Bridges 2021 $4.8M Replace Outdated Bridge
SR 22/US 80 - KENDALL CREEK IN COLUMBUS Muscogee Bridges 2020 $1.7M Replace Outdated Bridge
SR 22/US 80 - FLATROCK CREEK IN COLUMBUS Muscogee Bridges 2021 $3.0M Replace Outdated Bridge
Macon Urban Area
I-16 EB FROM I-75 TO WALNUT CREEK - PHASE IV Bibb Bridges 2021 $128.7M Bottleneck Relief; Congestion Relief
I-16 WB FROM I-75 TO WALNUT CREEK - PHASE V Bibb Bridges 2021 $97.2M Bottleneck Relief; Congestion Relief
I-16 EB & WB - OCMULGEE RIVER OVERFLOW Bibb Bridges 2021 $10.8M Bottleneck Relief; Congestion Relief
SR 11/SR 49 -ROCKY CRK & TOBESOFKEE CRK &OVFLW Bibb Bridges 2019 $16.3M Replace Outdated Bridge
SR 11/SR 49/US 41 - 1.4 MI S OF MACON Bibb Bridges 2020 $3.8M Econ. Dev.
Savannah Urban Area
I-16 FROM I-95 TO I-516 Chatham Widening 2018-21 $130.2M Bottleneck & Congestion Relief
I-16 - I-95 INTERCHANGE RECONSTRUCTION Chatham Interchange 2018-21 $125.4M Bottleneck & Congestion Relief
CR 787/ISLANDS EXPWY - WILMINGTON RVR/BASCULE BRIDGE Chatham Bridges 2018 $56.0M Replace Outdated Bridges
JIMMY DELOACH PXWY EXT - I-16 TO SR 26/US 80 Chatham New location roadway 2018 $26.3M Freight Bottleneck & Congestion Relief
BRAMPTON RD FROM SR 21/SR 25 TO SR 21 SPUR Chatham New location roadway 2019 $43.3M Freight Bottleneck & Congestion Relief
Other Areas in Georgia
MCCAYSVILLE BYPASS FROM SR 5 TO TN STATE LINE Fannin New location roadway 2020 $31.3M Congestion relief; Econ. Dev.
SR 5 - SR 2/BLUE RIDGE N TO PROP MCCAYSVILLE BYP NR CR 138 Fannin Widening 2020 $61.0M Congestion relief; Econ. Dev.
SR 133 - S OF SR 35/US 319 TO N OF CR540 HOLLY DR Colquitt, Worth, Dougherty Widening 2019-20 $185.7M Econ.Dev.; Freight corridor
SR 24/US 441 - PUTNAM CO LN TO N OF CS 646/PIERCE DAIRY RD Morgan Widening 2021 $32.6M Econ.Dev.; Freight corridor
SR 4/US 1- N OF WILLIAMS CK TO GREEN OAK RD Toombs Widening 2020-21 $145.4M Econ.Dev.; Freight corridor
SE ROME BYP - SR 101 NE ON NEW LOC TO US 411 Floyd Roadway Project 2019 $61.9M Congestion relief; Econ. Dev.
EFFINGHAM PKWY- CR 156/BLUE JAY/EFFINGHAM TO SR 30/CHATHAM Effingham New Location Roadway 2020 $29.4M Congestion relief; Econ. Dev.
SR 4/US 1 -N OF NIMROD RD TO LOUISVILLE BPS Jefferson Widening 2021 $31.1M Econ. Dev.
SPOUT SPRINGS RD - I-985 TO UNION CIRCLE - PHASE I Hall Widening 2019 $39.5M Congestion Relief
CR 274/CS 1078/LAKE PARK BELLVILLE RD - SR 7 TO I-75 Lowndes Widening 2021 $32.3M Congestion Relief; Econ. Dev.
SR 515/US 76 FM YOUNG HARRIS ST/UNION TO TIMBERLINE DR/TOWNS Towns, Union Widening 2020 $65.5M Congestion Relief; Econ. Dev.
SR 67 FM I-16 TO STATESBORO BYPASS Bulloch Widening 2019 $24.2M Congestion Relief; Econ. Dev.
SR 1/US 27/LAGRANGE FM AUBURN ST TO SR 219/MORGAN ST Troup Widening 2019 $10.9M Congestion Relief
Source: GDOT response to TRIP survey.
While the increased funding will allow for the acceleration or completion of numerous needed
projects, it is not sufficient to fully address the needs of the system, or to allow the state to provide many
other transportation improvements that are needed to support economic growth.
The following charts detail needed projects in the state’s largest urban areas and statewide that lack
sufficient funding to proceed prior to 2022.Modernizing Georgia’s Transportation System 21
Chart 9. Needed projects that lack sufficient funding to proceed
Project Description County Improvement Cost Project Benefit
Atlanta Urban Area
PANOLA RD @ I-20 - FAIRINGTON RD TO SNAPFINGER WOODS DR DeKalb Interchange $26.7M Ops of Inch/Mainline - RW Phase
SR 92 -NEBO RD TO PICKETTS MILL PL Cobb, Paulding Widening $30.2M Congestion Relief
I-85 - SR 74/SENOIA RD Fulton Interchange $35.0M Ops of Inch/Mainline - RW Phase
I-20 @ SR 138/SR 20 INTCH RECON & WIDENING Rockdale Interchange $36.4M Congestion Relief
SR 42 - DOWNTOWN MCDONOUGH TO SR 138 Henry Widening $21.9M Congestion Relief; RW phase
WEST WINDER BYP @ SR 316 - NEW INTERCHANGE - PH III Barrow Interchange $19.6M New Location; Access to Corridor
SR 9 - N OF SR 141 TO N OF SR 20 Forsyth Widening $18.1M Congestion Relief
I-285/BOULDERCREST RD INTCH DeKalb Interchange $35.1M Congestion Relief; Ops of Inch/Mainline
SR 166 - OLD LOWER RIVER ROD/DOUGLAS TO SR 70/FULTON Douglas, Fulton Widening $19.1M Congestion Relief; RW phase
SR 20 - CR 762/UNION HILL RD TO E OF CS 579/N CORNERS PKWY Cherokee, Forsyth Widening $183.9M Congestion Relief, Safety
JONESBORO RD - W OF SR 3/US 41/CLAYTON TO I-75/HENRY Clayton, Henry Widening $51.7M Congestion Relief
SR 6 - I-20 WB TO SR 6 SPUR - TRUCK FRIENDLY LANES Cobb, Douglas Minor Widen & Resurf. $35.7M Congestion Relief
SR 61 - S OF CR 467/DALLAS NEBO RD TO SR 6 Paulding Widening $41.0M Congestion Relief
SR 371 - SR 9 TO CR 5/KELLY MILL RD Forsyth Widening $41.0M Congestion Relief
Augusta Urban Area
I-20 - MCDUFFIE CO LINE TO SR 383 Columbia Widening $98.3M Congestion Relief
CR 102/HEREFORD FARM ROAD FROM SR 232 TO SR 383 Columbia Widening $32.1M Congestion Relief
Columbus Urban Area
SR 520/US 280 @ CHATTAHOOCHEE RVR IN COLUMBUS Muscogee Bridge $10.8M Replace Outdated Bridge
Macon Urban Area
I-75 - I-16 TO CR 478/PIERCE AVE - PHASE VI Bibb Widening $65.0M Bottleneck Relief; Congestion Relief
Savannah Urban Area
SR 144 EB - S OF CR 100 TO S OF CR 154 Bryan Widening $14.3M Economic Development
SR 26/US 80 @ BULL RVR & @ LAZARETTO CRK Chatham Bridge $74.2M Widen & Raise Bridge, Rd to Tybee Isl.
ISLANDS EXPWY - GEN MCINTOSH BLVD TO TRUMAN PKWY Chatham Widening $30.4M Improved Connectivity
I-16 - CS 565/POOLER PKWY TO I-95 Chatham Widening $14.0M Congestion Relief; Freight Movement
Other Areas in Georgia
I-85 - N OF SR 211 TO SR 11/US 129 Barrow Widening $274.7M Congestion Relief; Freight Movement
SR 85 - S OF CR 126/BERNHARD RD TO OLD SR 92/F'VILLE Fayette Widening $32.4M Congestion Relief
SR 166 BYPASS - E OF BIG INDIAN CREEK TO CS 1158/HAYS MILL RD Carroll Widening $68.6M Congestion Relief
SR 24 FM MADISON BPS/MORGAN TO N OF APALACHEE RVR/OCONEE Morgan, Oconee Widening $48.4M Congestion relief; Econ. Dev.
SR 40 - E OF ST MARYS RIVER TRIB TO E OF CR 66/COLERAIN RD Camden, Charlton Widening $41.0M Congestion relief; Econ. Dev.
S ROME BYP/US 27 - SR 1 ALONG BOOZE MTN RD TO SR 101 @CR 96 Floyd Roadway Project $80.7M Congestion relief; Econ. Dev.
SR 113/OLD ALA RD RELOC FM SR 113 -PUMPKINVINE CK- TO CR 699 Bartow Widening $63.6M Congestion Relief
ROME-CARTERSVILLE DEVELOPMENT CORRIDOR Bartow Roadway Project $71.9M Congestion relief; Econ. Dev.
SR 15 - CR 67/RIDGE RD TO EAST SPARTA BYPS Hancock, Washington Widening $155.7M Economic Development
SR 44 - CR 54/LINGER LONGER RD TO E GREENSBORO BYPS Greene Widening $51.9M Economic Development
SR 1 - CR 329 TO N OF CR 325 @ SR 1/US 27 Chattooga Widening $63.9M Economic Development
SR 15/US 441 - NORTH CL/CLAYTON TO NC STATE LINE Rabun Widening $54.5M Economic Development
I-85 - N OF SR 11 TO SC STATE LINE Jackson Widening $1.2B Congestion Relief; Freight Movement
Source: GDOT response to TRIP survey.
Major Mobility Investment Program
Approval of the TFA will allow GDOT to advance the Major Mobility Investment Program (MMIP),
which will include 11 major mobility projects throughout the state to be completed between 2021 and 2029
to relieve traffic congestion, improve the movement of freight and enhance safety.
These projects require various forms of finance, so public-private partnership procurement will be
utilized. Most all projects are Design-Build-Finance or Design-Build-Finance-Operate-Maintain. GDOT doesModernizing Georgia’s Transportation System 22
not have sufficient funding to advance these as traditional Design-Bid-Build or Design-Build projects.
Contractor availability payments will be utilized to pay for these projects. 20
The projects, which are in the Atlanta, North Georgia, Macon and Savannah areas, include three
interchange reconstructions, four express lane projects, the widening of three portions of Interstate
highways and the construction of commercial vehicle lanes on a portion of 1-75 between Atlanta and
Macon.
The MMIP includes four projects to expand the Georgia Express Lanes system, which will offer a
choice for drivers to pay a toll to bypass congestion in the Atlanta area and will provide more reliable trips
for transit, carpools and vanpools.
When completed, the widenings of I-85 from Hamilton Mill to SR-211 and from SR-211 to US 129 in
Northeastern Georgia will reduce delays by 56 percent and 69 percent respectively; and the widening of I-
16 in Savannah from I-516 to I-95 will reduce delays by 32 percent. 21
Chart 10. Major Mobility Investment Program
Source: GDOTModernizing Georgia’s Transportation System 23
Federal Transportation Funding
Investment in Georgia’s roads, highways and bridges is funded by local, state and federal
governments. A lack of sufficient funding at all levels will make it difficult to adequately maintain and
improve the state’s existing transportation system.
The federal government is a critical source of funding for Georgia’s roads, highways, bridges and
transit systems and provides a significant return in road and bridge funding based on the revenue generated
in the state by the federal motor fuel tax.
Most federal funds for highway and
transit improvements in Georgia are provided by
federal highway user fees, largely an 18.4 cents- per-
gallon tax on gasoline and a 24.4 cents-per-gallon tax
on diesel fuel. Since 2008 revenue into the
federal Highway Trust Fund has been inadequate to
support legislatively set funding levels so
Congress has transferred approximately $53
billion in general funds and an additional $2
billion from a related trust fund into the federal Highway Trust Fund. 22
Signed into law in December 2015, the Fixing America’s Surface Transportation Act (FAST Act),
provides modest increases in federal highway and transit spending. The five-year bill also provides states
with greater funding certainty and streamlines the federal project approval process. But, the FAST Act does
not provide adequate funding to meet the nation’s need for highway and transit improvements and does
not include a long-term and sustainable funding source.You can also read