Californians & Their Government
←
→
Page content transcription
If your browser does not render page correctly, please read the page content below
PPIC STATEWIDE SURVEY                                              MARCH 2021

                        Californians
                        & Their
                        Government
                        Mark Baldassare Dean Bonner Rachel Lawler Deja Thomas

                        CONTENTS
                        Press Release                                            3
                        State Issues                                             6
                        National Issues                                         13
                        Regional Map                                            20
                        Methodology                                             21
                        Questionnaire and Results                               23
                        Supported with funding from the Arjay and Frances F. Miller
                        Foundation, the James Irvine Foundation, and the PPIC Donor
                        Circle
The PPIC Statewide Survey provides a voice for the public and likely voters— informing policymakers, encouraging discussion, and raising awareness on critical issues of the day. © 2021 Public Policy Institute of California The Public Policy Institute of California is dedicated to informing and improving public policy in California through independent, objective, nonpartisan research. PPIC is a public charity. It does not take or support positions on any ballot measures or on any local, state, or federal legislation, nor does it endorse, support, or oppose any political parties or candidates for public office. Short sections of text, not to exceed three paragraphs, may be quoted without written permission provided that full attribution is given to the source. Research publications reflect the views of the authors and do not necessarily reflect the views of our funders or of the staff, officers, advisory councils, or board of directors of the Public Policy Institute of California.
PPIC STATEWIDE SURVEY                                                                                   MARCH 2021

                                                                                                        CONTACT
                                                                                      Steven Bliss 415-291-4412
                                                                                       Abby Cook 415-291-4436

News Release
EMBARGOED: Do not publish or broadcast until 9:00 p.m. PT on Tuesday, March 30, 2021.
Para ver este comunicado de prensa en español, por favor visite nuestra página de internet:
www.ppic.org/press-release/

PPIC STATEWIDE SURVEY: CALIFORNIANS AND THEIR GOVERNMENT

Four in Ten Support Newsom Recall, Job Approval Holds Steady
OVERWHELMING MAJORITY SAY THE WORST OF THE PANDEMIC IS BEHIND US; STRONG MAJORITIES
ACROSS PARTY LINES APPROVE OF PATH TO CITIZENSHIP FOR UNDOCUMENTED IMMIGRANTS

SAN FRANCISCO, March 30, 2021—With signature-gathering complete for potentially placing a
gubernatorial recall on the ballot, four in ten likely voters say they would vote yes on removing
Governor Newsom in a special recall election. Just over half of Californians approve of the governor’s
job performance, similar to ratings in January. Three in four Californians now say the worst of the
coronavirus pandemic is behind us. As federal policymakers consider immigration reform, there is
strong bipartisan support for creating a path to citizenship for undocumented immigrants. These are
among the key findings of a statewide survey released today by the Public Policy Institute of California.
(Note: As a companion piece to the new survey, PPIC is publishing a blog post from President and CEO
Mark Baldassare, Five Takeaways on the 2021 Governor’s Recall.)
If a special election to recall Governor Newsom were held today, 40 percent of likely voters say they
would vote yes on removing Newsom, while 56 percent would vote no and 5 percent are unsure. Views
break along party lines: Republicans (79%) are far more likely than independents (42%) and Democrats
(15%) to say they would vote yes. Across regions, support for removing Newsom is highest in the
Central Valley (49%) and Inland Empire (47%) and lowest in the San Francisco Bay Area (27%, 41%
Orange/San Diego, 40% Los Angeles).
“Forty percent would vote yes to remove Newsom if a special election to recall the governor were held
today, with Republicans far more likely to vote yes,” said Mark Baldassare, PPIC president and CEO.
“The share who would now vote to remove the governor is similar to the 38 percent who did not vote
for Newsom in the fall of 2018.”
Newsom’s approval rating has held steady so far in 2021. Just over half of Californians (54% adults, 53%
likely voters) approve of how he is handling his job as governor, essentially unchanged from January
(54% adults, 52% likely voters). This is similar to the share approving in February 2020, before the
governor issued COVID-19 stay-at-home orders (53% adults, 52% likely voters). Peak approval for
Governor Newsom so far was in May 2020, when 65 percent of adults and 64 percent of likely voters
said they approved of his performance.

Most Californians Say the Worst of the Pandemic Is Behind Us
With the number of new cases down nationally, an overwhelming majority of Californians (74%) say
that the worst of the coronavirus pandemic is behind us. This is an increase of 16 percentage points
from January (58%). One in five (21%) say the worst is yet to come, compared with more than one in
three (37%) who held this view in January. Solid majorities across regions and demographic groups say
that the worst is behind us with the pandemic.

PPIC.ORG/SURVEY                                                               Californians and Their Government   3
PPIC STATEWIDE SURVEY MARCH 2021 At the same time that Californians express growing optimism about the national pandemic, concerns about getting the coronavirus have declined. Less than half of Californians say they are either very concerned (18%) or somewhat concerned (29%) about getting the virus and needing hospitalization—a drop of 13 percentage points since January (25% very concerned; 35% somewhat concerned). However, there are racial and economic disparities in COVID-19 concerns. Across racial/ethnic groups, African Americans (35%), Latinos (25%), and Asian Americans (19%) are more likely than whites (9%) to be very concerned about getting the coronavirus and requiring hospitalization. Californians with annual household incomes of under $40,000 (24%) and $40,000 to under $80,000 (22%) are much more likely than higher-income Californians (9% $80,000 or more) to be very concerned. Sixty-one percent of Californians say they have already received the vaccine (33%) or that they will definitely get it (28%), up from 48 percent in January (5% already received, 43% will definitely get it). About one in five continue to say that they will either probably not (7%, down from 11% in January) or definitely not (14%, similar to 13% in January) get the vaccine. Across racial/ethnic groups, African Americans remain the most likely to say they will probably or definitely not get the vaccine (29%, down from 55% in January); 22 percent of Latinos (unchanged), 20 percent of whites (down from 25%), and 5 percent of Asian Americans (down from 8%) say they will probably not or definitely not get the vaccine. “Three in four Californians now believe that the worst is behind us with the COVID-19 crisis, while about one in five continue to say they will definitely not or probably not take the vaccine,” Baldassare said. About half of Californians say the state is doing an excellent (14%) or good (38%) job of distributing the COVID-19 vaccine, while four in ten say the state is doing a fair (29%) or poor (15%) job. The share giving the state positive marks has increased 16 percentage points since January (7% excellent, 29% good, 31% fair, 26% poor). Overwhelming Majorities Approve of State, Federal COVID Aid At both the state and federal levels, policymakers recently enacted major legislation that provides economic aid to address the pandemic’s impact; both of these have strong support among Californians. Seven in ten (75% adults, 70% likely voters) support the $7.6 billion COVID-19 relief package signed by Governor Newsom in late February, with views breaking along party lines: 90 percent of Democrats, 71 percent of independents, and 37 percent of Republicans favor it. Support is highest in the San Francisco Bay Area (81%) and Los Angeles (78%); 71 percent in the Central Valley and 69 percent in both the Inland Empire and Orange/San Diego are in favor. Strong majorities (73% adults, 68% likely voters) approve of the $1.9 trillion federal relief package, though also with a deep partisan divide: 92 percent of Democrats, 68 percent of independents, and 34 percent of Republicans approve. Here, too, support is somewhat higher in the San Francisco Bay Area (78%) and Los Angeles (76%) than in other parts of the state (71% Orange/San Diego, 69% Central Valley, 69% Inland Empire). “Californians overwhelmingly favor the COVID relief packages that were recently passed by the state government and the federal government,” Baldassare said. Support for Path to Citizenship Cuts across Party Lines; Most Support Health Care Coverage for Undocumented Immigrants As federal policymakers consider comprehensive immigration reform, an overwhelming majority of Californians (85%) say there should be a path to citizenship for undocumented immigrants, provided they meet certain requirements—similar to the share since PPIC started asking this question in 2013. Strong majorities across partisan lines hold this view: 93 percent of Democrats, 81 percent of independents, and 68 percent of Republicans. Across racial/ethnic groups, 92 percent of both African Americans and Latinos, 80 percent of whites, and 79 percent of Asian Americans are supportive. PPIC.ORG/SURVEY Californians and Their Government 4
PPIC STATEWIDE SURVEY                                                                                MARCH 2021

Asked about providing health care coverage for undocumented immigrants—an idea now under
consideration by state lawmakers—66 percent of Californians approve, up from 54 percent in 2015 (the
last time PPIC asked this question). Support is far higher among Democrats (82%) and independents
(57%) than among Republicans (20%). Overwhelming majorities of Latinos (83%), African Americans
(77%), and Asian Americans (70%) are in favor, as are a slim majority of whites (51%).
“Strong majorities of Californians across party lines favor a path to citizenship for undocumented
immigrants,” Baldassare said. “After the year-long COVID crisis, two in three residents favor providing
health care coverage for undocumented immigrants in California.”

Most Approve of President Biden’s Performance, while Less than Half
Approve of California’s US Senators
Solid majorities of Californians (65% adults, 60% likely voters) approve of how Joe Biden is handling his
job as president, similar to the share as Biden was taking office in January (70% adults, 65% likely
voters). Strong majorities of African Americans (84%), Latinos (73%), and Asian Americans (69%)
approve of Biden, as do 56 percent of whites. Nationally, 54 percent of adults approve of Biden
according to a recent Gallup poll.
Asked about California’s US senators, less than half approve. Forty-seven percent of adults and 44
percent of likely voters approve of Dianne Feinstein, with wide variation among racial/ethnic groups: 74
percent of African Americans, 58 percent of Latinos, 43 percent of Asian Americans, and 35 percent of
whites approve. Alex Padilla, who took office this past January, has the approval of 44 percent of adults
and 42 percent of likely voters. However, about one in three (36% adults, 33% likely voters) either say
they haven’t heard enough to have an opinion or don’t know. Here, too, approval varies across
racial/ethnic groups: 67 percent of African Americans, 58 percent of Latinos, 38 percent of Asian
Americans, and 33 percent of whites approve.
“A solid majority of Californians approve of President Biden, and Senator Feinstein’s approval rating
today at 47 percent is similar to last year,” Baldassare said. “The first approval rating of recently
appointed Senator Alex Padilla stands at 44 percent, though with many still undecided.”

Four in Ten Say Race Relations in the US Have Worsened in Past Year
Asked about race relations in the US, 43 percent of Californians say things are worse than a year ago,
while a third (36%) say about the same and one in five (19%) say better. The share saying things are
worse than a year ago has decreased 16 percentage points since prior to the election (59% in
September 2020). Asian Americans (50%), whites (48%), and African Americans (44%) are much more
likely than Latinos (32%) to say race relations are worse than a year ago.
“A plurality say that race relations in the US today are worse than they were a year ago, including half
of Asian Americans in the wake of recent reports of racially motived hate crimes,” Baldassare said.

Overwhelming Majority Say Housing Affordability Is a Problem
Ninety percent of Californians say that housing affordability is a big problem (61%) or somewhat of a
problem (29%) in their part of the state, similar to February 2020 (63% big, 25% somewhat). Forty-
three percent of Californians say that housing costs are making them seriously consider moving—
including 33 percent who say they are considering moving out of the state. Across regions, residents of
the San Francisco Bay Area (49%) are most likely to say they’re considering moving due to housing
costs (44% Orange/San Diego, 43% Los Angeles, 39% Inland Empire, 37% Central Valley).
“Six in ten Californians say that housing affordability is a big problem in their region, and one in three
are seriously considering moving out of the state because of the cost of housing,” Baldassare said.

PPIC.ORG/SURVEY                                                            Californians and Their Government   5
PPIC STATEWIDE SURVEY MARCH 2021
State Issues
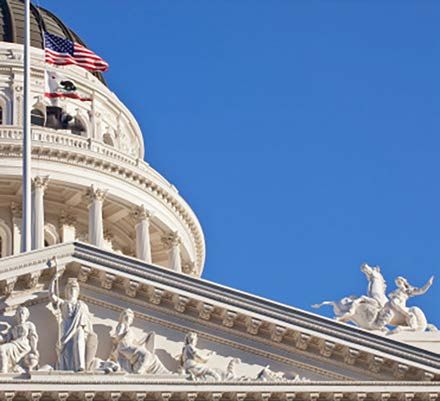
Key Findings Approval ratings of state elected officials
Fifty-four percent of Californians approve of 100 Governor Newsom
the way that Governor Gavin Newsom is California Legislature
handling his job, 52 percent approve of the 80
state legislature, and 53 percent approve of
Percent all adults
the legislators representing their own 60 54
51
assembly and senate districts. (page 7) 49
52
40 44 47
Among California likely voters, 40 percent
would vote yes to remove Newsom if a 20
special election to recall the governor were
held today, with Republicans far more likely
0
to vote yes. (page 8)
Nov-19
Nov-20
Sep-19
Sep-20
Jan-19
Jan-20
Jan-21
May-19
May-20
Mar-19
Mar-20
Mar-21
Jul-19
Jul-20
Most Californians think that California is
currently in an economic recession. Three in Support for state's COVID-19 relief package
four Californians favor the state’s $7.6 billion 100
COVID-19 relief package, with partisans 85
deeply divided. (page 9) 83
77
80 75
Californians are divided on whether or not 65
the state and local tax system is fair. Nearly 60
half of Californians (46%) think the state’s tax
Percent
burden per capita ranks near the top
40
compared to other states. (page 10)
When asked to name the highest priority for 20
state government funding, about four in ten
Californians say health and human services, 0
and four in ten say K–12 education. Fifty-two All adults African Asian Latinos Whites
Americans Americans
percent of Californians say they would prefer
Concern about having enough money to pay
to pay higher taxes and have a state rent or mortgage
government that provides more services. 100
Somewhat concerned
(page 11) Very concerned
Six in ten Californians say that housing 80
affordability is a big problem in their part of 30
Percent
the state; about four in ten say they have 60
seriously considered moving away from their 30
part of California. About half of Californians 40
25
say the state has done just enough (36%) or 41
more than enough (16%) to help renters 18
20 25
during the pandemic and most lower-income 24
adults are concerned about having enough 9
money to pay rent or mortgage. (page 12) 0
All Under $40,000 to $80,000
adults $40,000 under $80,000 or more
PPIC.ORG/SURVEY Californians and Their Government 6PPIC STATEWIDE SURVEY MARCH 2021
Approval of State Elected Officials
With signature gathering now completed by recall election proponents, Governor Newsom has an
approval rating of 54 percent among adults and 53 percent among likely voters. Approval was similar in
January (54% adults, 52% likely voters) and last February (53% adults, 52% likely voters), before the
governor issued COVID-19 stay-at-home orders. Today, his approval rating is 73 percent among
Democrats, 46 percent among independents, and 18 percent among Republicans. Approval is highest in
the San Francisco Bay Area (65%), followed by Los Angeles (53%), Orange/San Diego (51%), the Central
Valley (50%), and the Inland Empire (48%). Solid majorities of African Americans (71%), Asian Americans
(62%), and Latinos (60%) approve, compared to 44 percent of whites.
“Overall, from what you know so far, do you approve or disapprove of the way that Gavin Newsom is
handling his job as governor of California?”
Approve Disapprove Don’t know
All adults 54% 36% 10%
Likely voters 53 42 5
Democrats 73 20 7
Party Republicans 18 78 4
Independents 46 42 12
Central Valley 50 38 12
Inland Empire 48 42 10
Region Los Angeles 53 39 8
Orange/San Diego 51 36 13
San Francisco Bay Area 65 25 11
In the early weeks of the 2021–22 legislative session, 52 percent of adults and 48 percent of likely voters
approve of the way the California legislature is handling its job. Approval ratings were similar last
February (51% adults, 49% likely voters). Today, 66 percent of Democrats say they approve, compared to
47 percent of independents and 18 percent of Republicans. Solid majorities in the San Francisco Bay Area
(62%), about half in Los Angeles (52%), the Inland Empire (51%), and the Central Valley (49%), and 45
percent in Orange/San Diego say they approve of the state legislature.
Adults (53%) and likely voters (51%) are similarly likely to say they approve of how the legislators who
represent their assembly and senate districts are doing their jobs at this time. Approval was similar last
February (53% adults, 52% likely voters). Today, 65 percent of Democrats, 50 percent of independents, and
24 percent of Republicans approve of their own legislators. Majorities in the San Francisco Bay Area (65%),
Los Angeles (56%), and the Central Valley (52%), and more than four in ten in other regions, approve.
“Overall, do you approve or disapprove of …?”
All Party Likely
adults voters
Dem Rep Ind
Approve 52% 66% 18% 47% 48%
the way that the California
Legislature is handling Disapprove 36 25 72 40 42
its job
Don't know 12 9 10 12 9
the job that the state Approve 53 65 24 50 51
legislators representing
your assembly and Disapprove 34 25 66 36 40
senate districts are doing
at this time Don't know 13 10 10 14 9
PPIC.ORG/SURVEY Californians and Their Government 7PPIC STATEWIDE SURVEY MARCH 2021
Recall of Governor Newsom
Proponents appear to have collected the signatures needed to qualify for a recall election, and about six
in ten California likely voters are closely (20% very, 43% fairly) following the news about the effort to
recall Governor Newsom from office. If officials held a special election today to recall Governor
Newsom, 40 percent of California likely voters say they would vote yes to remove him, while 56 percent
would vote no to keep Newsom as governor; 5 percent are unsure. Notably, the share of likely voters
supporting the recall (40%) is similar to the 38 percent who did not vote for him in November 2018.
About eight in ten Republicans (79%) would vote yes to remove Newsom as governor, compared to 42
percent of independents and 15 percent of Democrats. Fewer than half across regions would vote to
remove Newsom as governor; support for removal is higher in inland regions (49% Central Valley, 47%
Inland Empire) than coastal regions (41% Orange/San Diego, 40% Los Angeles, 27% San Francisco Bay
Area). Fewer than half across all age, education, homeownership, income, and racial/ethnic groups
would vote yes to remove Newsom as governor. Men (50%) are much more likely than women (31%) to
say they would vote yes to remove Newsom. Eighty-seven percent of those who disapprove of
Newsom, and 4 percent of those who approve of Newsom, would vote yes to remove him.
“There is an effort underway to remove Governor Gavin Newsom from office in a recall election. If a
special election to recall Governor Newsom were held today, would you vote yes to remove Newsom
as governor or no to keep Newsom as governor?”
Vote yes to Vote no to
Likely voters only Don’t know
remove Newsom keep Newsom
All likely voters 40% 56% 5%
Democrats 15 79 6
Party Republicans 79 19 2
Independents 42 53 4
Central Valley 49 48 3
Inland Empire 47 49 4
Region Los Angeles 40 57 3
Orange/San Diego 41 52 7
San Francisco Bay Area 27 67 6
Men 50 46 4
Gender
Women 31 64 5
A slim majority of California likely voters (52%) think the current effort to recall the governor is an
appropriate use of the recall process. About three in four Republicans (77%) and 54 percent of
independents say this is an appropriate use, compared to 35 percent of Democrats. About half or more
across regions say this is an appropriate use. Men are much more likely than women to say it is
appropriate (61% to 45%). Eighty-five percent of those who disapprove of Newsom, and 28 percent of
those who approve of Newsom, say the current effort is an appropriate use of the recall process.
“Do you think the current effort to recall the governor is an appropriate use of the recall process or not?”
Party Gender
Likely
Likely voters only
voters
Dem Rep Ind Men Women
Yes 52% 35% 77% 54% 61% 45%
No 42 58 19 41 33 49
Don’t know 6 7 4 5 6 6
PPIC.ORG/SURVEY Californians and Their Government 8PPIC STATEWIDE SURVEY MARCH 2021
Economic Situation
About half of Californians (49% adults, 54% likely voters) say that California is in an economic
recession, with one in four believing the state is in a serious recession rather than a moderate or mild
one. Slightly more residents felt the state was in a serious recession in January (32% adults, 35% likely
voters) and in September (31% adults, 34% likely voters) and May (34% adults, 38% likely voters) of last
year. Today, Republicans (36%) are somewhat more likely than independents (29%) and much more
likely than Democrats (20%) to say California is in a serious recession. Across regions, Los Angeles
residents (30%) are the most likely to say this. Across racial/ethnic groups, one in four or more African
Americans (31%), whites (28%), and Latinos (25%) think the recession is serious compared to 16
percent of Asian Americans. About three in ten or fewer across education, homeownership, and income
groups say the state is in a serious recession; shares holding this view increase with rising age.
“Would you say that California is in an economic recession, or not? If yes: do you think it is in a serious,
a moderate, or a mild recession?”
Region
All San Likely
adults Central Inland Los Orange/ voters
Francisco
Valley Empire Angeles San Diego
Bay Area
Yes, serious recession 25% 23% 22% 30% 22% 25% 26%
Yes, moderate recession 24 23 28 22 24 25 28
Yes, mild recession 10 9 15 9 10 11 9
Yes, don’t know (volunteered) 2 1 2 2 3 1 2
Not in a recession 34 40 27 32 32 34 32
Don’t know 5 4 6 5 8 3 3
On February 23, Governor Newsom signed a $7.6 billion COVID-19 relief package. After being read a
brief description, 75 percent of adults and 70 percent of likely voters are in favor of the package.
Overwhelming majorities of Democrats (90%) and independents (71%) are in favor, while 55 percent
of Republicans are opposed. Across racial/ethnic groups, solid majorities of Latinos (85%), African
Americans (83%), Asian Americans (77%), and whites (65%) are in favor. Strong majorities of two in
three or more across regions and across gender, education, and homeownership groups favor it.
Although majorities are still in favor, support declines with rising age (82% 18 to 34, 74% 35 to 54,
69% 55 and older) and income levels (86% under $40,000, 75% $40,000 to under $80,000, 66%
$80,000 or more).
“Recently, the California Legislature passed and Governor Newsom signed into law a $7.6 billion COVID
relief package…. Do you favor or oppose this relief package?”*
Favor Oppose Don’t know
All adults 75% 20% 5%
Likely voters 70 26 4
Democrats 90 8 3
Party Republicans 37 55 8
Independents 71 21 8
Central Valley 71 25 4
Inland Empire 69 24 7
Region Los Angeles 78 17 5
Orange/San Diego 69 24 7
San Francisco Bay Area 81 15 4
*
For complete question text, see p. 24.
PPIC.ORG/SURVEY Californians and Their Government 9PPIC STATEWIDE SURVEY MARCH 2021
State and Local Tax System
With the deadline for filing income taxes extended to May 17, how do Californians perceive their
current state and local tax system? Half say the current system is very fair (8%) or moderately fair
(43%), while a plurality say it is not fair (24% not too, 21% not at all). Likely voters hold similar views. In
March 2019, Californians were similarly likely to call the system fair (7% fair, 37% moderately fair).
Today, lower-income adults (61% under $40,000) are much more likely than more affluent adults (48%
$40,000 to under $80,000, 46% $80,000 or more) to say it is very fair or moderately fair. Six in ten
Democrats (62%) hold this view, compared to fewer independents (44%) and Republicans (31%).
About half of adults (46%) and likely voters (53%) say that California ranks near the top in per capita
state and local tax burden compared to other states. Similar shares ranked California near the top in
March 2019 (48% adults, 55% likely voters) and in March 2018 (49% adults, 58% likely voters). Today,
the shares holding this view increase as income levels rise (34% under $40,000, 48% $40,000 to under
$80,000, 59% $80,000 or more). Republicans (65%) are more likely than independents (54%) and
Democrats (42%) to hold this view. Pluralities across regions say California ranks near the top, while
across racial/ethnic groups, whites (55%) and Asian Americans (50%) are much more likely than Latinos
(33%) and African Americans (32%) to say this. The public’s perceptions are somewhat in line with fiscal
facts: California’s state and local tax collections per capita in 2017 were the tenth highest in the nation
(Tax Policy Center, April 2020).
“Where do you think California currently ranks in state and local tax burden per capita? Compared to
other states, is California's tax burden per capita near the top, above average, average, below average,
or near the bottom?”
Household income
All Likely
adults $40,000 to $80,000 or voters
Under $40,000
under $80,000 more
Near the top 46% 34% 48% 59% 53%
Above average 24 24 26 23 27
Average 16 23 14 8 10
Below average 4 6 1 3 3
Near the bottom 3 3 3 3 2
Don’t know 8 10 8 4 5
About six in ten Californians say that they pay more taxes to state and local governments than they feel
they should (adults: 30% much more and 27% somewhat more; likely voters: 31% much more and 29%
somewhat more). More felt they were paying much more than they should in March 2019 (39% adults,
40% likely voters). Majorities across regions and across age, gender, racial/ethnic, education, and
homeownership groups say they pay more than they should. The shares holding this view increase as
income rises. Republicans (48%) are much more likely than independents (33%)—and far more likely
than Democrats (19%)—to say they are paying much more than they should.
“When you combine all of the taxes you pay to state and local governments, do you feel that you pay
much more than you should, somewhat more than you should, about the right amount, or less than
you should?”
Household income
All Likely
adults $40,000 to under voters
Under $40,000 $80,000 or more
$80,000
Much more than you should 30% 22% 29% 37% 31%
Somewhat more than you should 27 25 33 27 29
About the right amount 36 45 32 32 35
Less than you should 4 5 3 4 4
Don’t know 3 2 2 – 1
PPIC.ORG/SURVEY Californians and Their Government 10PPIC STATEWIDE SURVEY MARCH 2021
State Budget and Taxes
In January, Governor Newsom released a budget proposal that includes $165 billion in General Fund
spending. Since then, state revenues have been increasing beyond initial projections. About 90 percent
of General Fund spending in the proposed budget is allocated for K–12 public education (36%, $59.7
billion), health and human services (33%, $54.4 billion), higher education (11%, $17.9 billion), and
corrections and rehabilitation (8%, $13 billion). When asked to choose the highest priority for state
spending, Californians are equally likely to mention health and human services (40% adults, 37% likely
voters) or K–12 public education (39% adults, 44% likely voters); fewer name higher education (12%
adults, 10% likely voters) or prisons and corrections (6% adults, 6% likely voters). Similar shares of
Californians prioritized each of these spending areas in January 2020, before the COVID-19 pandemic
began. Democrats (48%) are most likely to say health and human services should have the highest
priority, while Republicans (47%) and independents (42%) name K–12 education. Across regions,
residents in Los Angeles (43%) and the Central Valley (43%) are most likely to prioritize health and
human services (39% San Francisco Bay Area, 37% Inland Empire, 34% Orange/San Diego). Across
racial/ethnic groups, Asian Americans (46%) are the most likely and African Americans (35%) are the
least likely to hold this view. As education and income levels rise, the shares prioritizing health and
human services decline; the shares prioritizing health and human services vary across age groups (45%
18 to 34, 35% 35 to 54, 39% 55 and older).
“Thinking about these four areas of state spending, I’d like you to name the one you think should have
the highest priority when it comes to state government spending.”
Party Race/Ethnicity
All
adults African Asian
Dem Rep Ind Latinos Whites
Americans Americans
Health and
40% 48% 28% 35% 35% 46% 42% 37%
human services
K–12 public
39 37 47 42 43 27 38 44
education
Higher education 12 13 8 13 17 18 14 8
Prisons and
6 2 11 8 4 8 4 7
corrections
Don’t know 3 1 5 3 1 1 2 5
Fifty-two percent of adults and likely voters say they would rather pay higher taxes and have a state
government that provides more services; fewer would prefer to pay lower taxes and have fewer
services (44% adults, 44% likely voters). Preferences for higher taxes and more services were similar in
January 2020 (53% adults, 53% likely voters). Today, Democrats (75%) are far more likely than
independents (48%) and Republicans (14%) to prefer higher taxes and more services. Regionally,
majorities in the San Francisco Bay Area (60%) and Los Angeles (55%) say this, while residents
elsewhere are divided. Majorities across racial/ethnic groups hold this view, except for whites (46%).
Women (58%) are more likely than men (46%) to hold this view. This fiscal preference is similar across
education groups and declines as age and income levels rise.
“In general, which of the following statements do you agree with more—I’d rather pay higher taxes and
have a state government that provides more services, or I’d rather pay lower taxes and have a state
government that provides fewer services?”
Party Race/Ethnicity
All
adults African Asian
Dem Rep Ind Latinos Whites
Americans Americans
Higher taxes and
52% 75% 14% 48% 67% 60% 56% 46%
more services
Lower taxes and
44 22 83 45 31 33 40 50
fewer services
Don’t know 4 4 4 7 2 7 4 4
PPIC.ORG/SURVEY Californians and Their Government 11PPIC STATEWIDE SURVEY MARCH 2021
Housing Affordability
An overwhelming majority of Californians say that housing affordability is a big problem (61%) or
somewhat of a problem (29%) in their part of California. Similar shares held these views in February
2020 (63% big, 25% somewhat). Majorities across demographic groups say housing affordability is a big
problem. Across racial/ethnic groups, African Americans (69%) are the most likely to hold this view
followed by whites (67%), Asian Americans (60%), and Latinos (54%). More than six in ten in the San
Francisco Bay Area (72%), Los Angeles (68%), and Orange/San Diego (64%) say housing affordability is
a big problem; fewer than half in the Central Valley (44%) and the Inland Empire (44%) hold this view.
A plurality of Californians (43%) and likely voters (41%) say the cost of their housing makes them seriously
consider moving away from the part of California they live in now. In February 2020, a similar share of
adults (44%) and likely voters (38%) seriously considered a move. A majority of Republicans (54%) say
they are seriously considering moving, compared to fewer independents (43%) and Democrats (34%).
Younger Californians (53% 18 to 34) are more likely than older Californians (44% 35 to 54, 34% 55 and
older), and renters (50%) are much more likely than homeowners (36%), to consider moving. Among
those who say this, most say they would move outside of California.
“Does the cost of your housing make you and your family seriously consider moving away from the
part of California you live in now? If yes: does it make you consider moving elsewhere in California,
or outside of the state?”
Region
All Likely
adults Central Inland Los Orange/ San Francisco voters
Valley Empire Angeles San Diego Bay Area
Yes 43% 37% 39% 43% 44% 49% 41%
Elsewhere
8 3 5 10 5 13 6
in California
Outside the state 33 33 33 32 34 33 33
Other 2 1 1 1 5 3 2
No 56 63 60 55 54 50 58
Majorities of adults and likely voters say that the state government has done more than enough (16%
adults, 18% likely voters) or just enough (36% adults, 34% likely voters) to assist those who are unable
to pay some or all of their rent during the pandemic. A plurality of adults (40%) and likely voters (41%)
say the government hasn’t done enough. Half of Democrats (51%) say the state has not done enough,
compared to four in ten independents and one in four Republicans. Across racial/ethnic groups, African
Americans are the most likely—and whites the least likely—to say not enough has been done.
“In general, do you think the state government has done more than enough, just enough, or not enough
to assist those unable to pay some or all of their rent during the pandemic?*
Party Race/Ethnicity
All
adults African Asian
Dem Rep Ind Latinos Whites
Americans Americans
More than enough 16% 8% 34% 19% 8% 17% 13% 19%
Just enough 36 36 32 33 32 32 44 32
Not enough 40 51 24 41 56 45 40 35
Don’t know 8 5 10 8 5 6 3 13
*
For complete question text, see p. 25.
Half of Californians say they are very (25%) or somewhat concerned (25%) about not having enough
money to pay for their rent or mortgage. Californians were more likely to be concerned the last time we
asked this question in October 2010 (39% very 23% somewhat) at the height of the Great Recession.
Renters (32% very, 29% somewhat) are much more likely than homeowners (15% very, 20% somewhat)
to be very concerned. Californians with incomes under $40,000 (41%) are much more likely than those
with higher incomes to be very concerned (24% $40,000 to under $80,000, 9% $80,000 or more).
PPIC.ORG/SURVEY Californians and Their Government 12PPIC STATEWIDE SURVEY MARCH 2021
National Issues
Key Findings Approval ratings of federal elected officials
Sixty-five percent of Californians approve 100
Approve
of the way that President Biden is handling Disapprove
his job, 42 percent approve of the US 80
Congress, and 55 percent approve of their 65
own US House representative. (page 14)
Percent all adults
60 55
51
Forty-seven percent of Californians 42
approve of Senator Dianne Feinstein and 40
30 31
44 percent approve of Senator Alex Padilla,
with Democrats far more likely to approve. 20
(page 15)
0
Seventy-three percent of Californians favor President
Biden
US
Congress
Respondent's
representative
the $1.9 trillion federal stimulus package,
with partisans deeply divided. Nearly half Support for the federal COVID-19 relief package
of Californians say the amount of spending 100
is about right, 23 percent say it is too much, 87
and 26 percent say it is too little. (page 16) 83 83
80 73
Three in four Californians now say the 61
worst of the coronavirus outbreak is behind 60
us. About one in five say they definitely will
Percent
not or probably will not get the COVID-19
40
vaccine. About half of Californians say the
state government is doing an excellent or
good job distributing the COVID-19 20
vaccine. (page 17)
0
Overwhelming majorities of Californians— All adults African Asian
Americans Americans
Latinos Whites
including strong majorities across parties—
favor a path to citizenship for Plans to get vaccinated against COVID-19
undocumented immigrants in the US if
they meet certain requirements. Two in 100 Definitely
not get
14
three favor providing health care coverage 20
13
Probably
for undocumented immigrants in 80 11
7
not get
California. (page 18) 20
18 Probably
Percent all adults
60 25 get
Californians remain divided on the Definitely
prospects that Americans of different 31
28 get
40
political views can come together and work Already got
the vaccine
out their differences. A plurality (43%) 43 (vol)
think race relations have gotten worse in 20
33
26
the past year. (page 19)
0 5
October 2020 January 2021 March 2021
PPIC.ORG/SURVEY Californians and Their Government 13PPIC STATEWIDE SURVEY MARCH 2021
Approval of Federal Elected Officials
Amid a flurry of executive orders and the passage of major legislation, 65 percent of adults and 60
percent of likely voters approve of the way that Joe Biden is handling his job as president. Approval of
the president was similar after he entered office in January (70% adults, 65% likely voters). Today, 85
percent of Democrats and 60 percent of independents approve, compared to 20 percent of
Republicans. Majorities in the San Francisco Bay Area (81%), the Central Valley (61%), Los Angeles
(61%), Orange/San Diego (60%), and the Inland Empire (59%) approve. Strong majorities of African
Americans (84%), Latinos (73%), and Asian Americans (69%), and a majority of whites (56%), approve.
In a recent Gallup poll, 54 percent of adults nationwide approved of President Biden’s job performance.
“Overall, do you approve or disapprove of the way that Joe Biden is handling his job as president?”
Approve Disapprove Don’t know
All adults 65% 30% 5%
Likely voters 60 38 2
Democrats 85 13 3
Party Republicans 20 78 2
Independents 60 33 7
Central Valley 61 34 5
Inland Empire 59 36 5
Region Los Angeles 61 32 7
Orange/San Diego 60 34 7
San Francisco Bay Area 81 18 2
Forty-two percent of adults and 33 percent of likely voters approve of the way the US Congress is
handling its job. Approval of Congress was similar last February (38% adults, 32% likely voters). Today,
48 percent of Democrats, 35 percent of independents, and 18 percent of Republicans approve. About
four in ten approve across regions (45% San Francisco Bay Area, 43% Los Angeles, 43% Orange/San
Diego, 40% Central Valley, 39% Inland Empire). Majorities of Latinos (61%) and African Americans
(52%) approve, compared to fewer Asian Americans (40%) and whites (27%). In a recent Gallup poll, 36
percent of adults nationwide approved of Congress.
By contrast, majorities of adults (55%) and likely voters (54%) approve of their own representative in
the US House. Approval was similar last February (55% adults, 57% likely voters). Today, overwhelming
majorities of Democrats (70%) approve of their own representative, compared to 48 percent of
independents and 31 percent of Republicans. Majorities in the San Francisco Bay Area (64%), Los
Angeles (59%), and the Central Valley (54%), and about half in other regions (49% Inland Empire, 47%
Orange/San Diego), approve of their own representative. Majorities of African Americans (66%),
Latinos (66%), and Asian Americans (57%) approve of their own representative, compared to 46
percent of whites.
“Overall, do you approve or disapprove of …?”
All Party Likely
adults Dem Rep Ind voters
Approve 42% 48% 18% 35% 33%
the way the US Congress
Disapprove 51 48 79 60 63
is handling its job
Don't know 6 4 2 6 3
the way your own Approve 55 70 31 48 54
representative to the US
House of Representatives Disapprove 31 22 60 40 37
in Congress is handling
his or her job Don't know 13 9 10 12 9
PPIC.ORG/SURVEY Californians and Their Government 14PPIC STATEWIDE SURVEY MARCH 2021
Approval of US Senators
As the 117th Congress begins its work, US Senator Dianne Feinstein has approval from 47 percent of
adults and 44 percent of likely voters. Approval was similar last September (44% adults, 46% likely
voters) and last February (51% adults, 50% likely voters). Today, a solid majority of Democrats (63%)
approve, compared to 42 percent of independents and 17 percent of Republicans. About half in the San
Francisco Bay Area (52%), Central Valley (48%), and Los Angeles (47%) approve, compared to about
four in ten in other regions (43% Inland Empire, 40% Orange/San Diego). Majorities of African
Americans (74%) and Latinos (58%) approve, compared to fewer Asian Americans (43%) and whites
(35%). Women (55%) are much more likely than men (38%) to say they approve of Senator Feinstein.
“Overall, do you approve or disapprove of the way that Dianne Feinstein is handling her job as
US senator?”
Approve Disapprove Don’t know
All adults 47% 36% 18%
Likely voters 44 47 9
Democrats 63 27 10
Party Republicans 17 73 10
Independents 42 42 16
Central Valley 48 42 11
Inland Empire 43 38 19
Region Los Angeles 47 35 19
Orange/San Diego 40 35 25
San Francisco Bay Area 52 33 15
California Secretary of State Alex Padilla was appointed by Governor Newsom to fill the US Senate seat
vacated by Vice President Kamala Harris and to serve the remainder of her term, which ends in 2022.
Forty-four percent of adults and 42 percent of likely voters approve of the way that Alex Padilla is
handling his job as US senator. Given his short time in office since January, about one in three adults
(36%) say they don’t know or volunteer that they have not heard enough to have an opinion. Sixty
percent of Democrats approve, compared to 39 percent of independents and 18 percent of
Republicans. Approval is highest in Los Angeles (48%) and lowest in Orange/San Diego (38%).
Majorities of African Americans (67%) and Latinos (58%) approve, compared to 38 percent of Asian
Americans and 33 percent of whites. Women (53%) are much more likely than men (35%) to say they
approve of Senator Padilla.
“Overall, do you approve or disapprove of the way that Alex Padilla is handling his job as US senator?”
Have not heard
Approve Disapprove enough to have Don’t know
an opinion (vol)
All adults 44% 19% 23% 13%
Likely voters 42 25 22 11
Democrats 60 11 19 10
Party Republicans 18 42 32 8
Independents 39 23 22 16
Central Valley 45 20 21 14
Inland Empire 44 22 25 9
Region Los Angeles 48 20 21 10
Orange/San Diego 38 21 21 20
San Francisco Bay
45 15 26 14
Area
PPIC.ORG/SURVEY Californians and Their Government 15PPIC STATEWIDE SURVEY MARCH 2021
National Economic Recovery Policies
An overwhelming share of Californians (73%) favor the $1.9 trillion federal stimulus package that
provides economic aid to businesses, individuals, and state and local governments. About two in three
likely voters are in favor. However, there is a deep partisan divide, with about nine in ten Democrats in
favor compared to one in three Republicans. Among independents, about two in three are in favor.
More than two in three across regions and more than six in ten across demographic groups favor the
stimulus bill. Despite majority support, differences do emerge. Across racial/ethnic groups, more than
eight in ten African Americans (87%), Asian Americans (83%), and Latinos (83%) are in favor, compared
to 61 percent of whites. Majority support for the stimulus package decreases sharply with rising
incomes (86% under $40,000, 73% $40,000 to under $80,000, 63% $80,000 or more) and is higher
among younger Californians (81% 18 to 34, 74% 35 to 54, 66% 55 and older).
“As you may know, in response to the coronavirus outbreak Congress passed and President Biden
signed into law a bill that would provide $1.9 trillion in economic aid to businesses, individuals, and
state and local governments. All in all, do you favor or oppose this bill?”
Favor Oppose Don’t know
All adults 73% 25% 2%
Likely voters 68 31 1
Democrats 92 6 2
Party Republicans 34 64 2
Independents 68 30 2
Central Valley 69 31 1
Inland Empire 69 29 2
Region Los Angeles 76 20 4
Orange/San Diego 71 28 1
San Francisco Bay Area 78 18 3
While most Californians are in favor of the economic aid package, there is less agreement regarding its
size. A plurality of Californians (47%) think the spending is about right, one in four (26%) say it is too
little, and another one in four (23%) say it is too much. Views among likely voters are similar. Just over
half of Democrats say the spending is about right, while just over half of Republicans say it is too much.
Four in ten independents say the spending is about right. At least a plurality of Californians across
regions and demographic groups say the spending is about right.
“Do you think this spending in the coronavirus economic aid package is too much, too little, or about
right?”
Too much Too little About right Don’t know
All adults 23% 26% 47% 4%
Likely voters 28 25 43 3
Democrats 7 35 55 3
Party Republicans 56 15 23 6
Independents 29 24 42 4
Central Valley 31 20 46 4
Inland Empire 22 20 52 6
Region Los Angeles 19 35 43 4
Orange/San Diego 24 26 45 4
San Francisco Bay
18 27 51 4
Area
PPIC.ORG/SURVEY Californians and Their Government 16PPIC STATEWIDE SURVEY MARCH 2021
Coronavirus
As the number of coronavirus cases continue to fall, most Californians (74%) say the worst of the
outbreak is behind us, while one in five (21%) say the worst is yet to come. The share saying the worst is
behind us has risen 16 points since January (58% worst behind us, 37% worst yet to come). Today, more
than six in ten across regions and demographic groups say this. Fewer than half of Californians are very
(18%) or somewhat (29%) concerned that they will get the virus and require hospitalization. This marks
a 13-point drop since January (25% very, 35% somewhat). Despite this decline, some groups are more
likely than others to be very concerned. Across racial/ethnic groups, African Americans, Latinos, and
Asian Americans are much more likely than whites to say they are very concerned. Californians making
less than $80,000 are much more likely than those making more to say they are very concerned.
“How concerned, if at all, are you that you will get the coronavirus and require hospitalization? Are you
very concerned, somewhat concerned, not too concerned, or not at all concerned?”
Household income Race/Ethnicity
All
adults Under $40,000 to $80,000 or African Asian
Latinos Whites
$40,000 under $80,000 more Americans Americans
Very concerned 18% 24% 22% 9% 35% 19% 25% 9%
Somewhat concerned 29 30 29 28 23 41 32 24
Not too concerned 24 21 19 29 20 30 21 25
Not at all concerned 28 23 29 34 20 10 22 40
Have already been
1 1 1 1 2 1 1 1
hospitalized (vol)
About half of Californians now say the state is doing an excellent (14%) or good (38%) job distributing
the vaccine, while about four in ten say it is doing a fair (29%) or poor (15%) job. The share rating the
state positively has increased 16 points since January (7% excellent, 29% good, 31% fair, 26% poor).
The share of Californians saying they have either already received the vaccine or will definitely get the
vaccine continues to increase. Sixty-one percent of Californians say they have already received the
vaccine (33%) or will definitely get the vaccine (28%), up from 48 percent in January (43% definitely get
it, 5% already received it), and 18 percent say they will probably get the vaccine, down from 25 percent
in January. About one in five say they will either probably not (7%, down from 11%) or definitely not
(14%, similar to 13%) get the vaccine. Despite a large shift in opinion, African Americans remain the
most likely across racial/ethnic groups to say they will probably or definitely not get the vaccine (29%,
down from 55%); 22 percent of Latinos (unchanged from 22%), 20 percent of whites (down from 25%),
and 5 percent of Asian Americans (down from 8%) say they will not get the vaccine. Republicans remain
most likely to say they will probably or definitely not get the vaccine (39%, down from 43%), while
fewer Democrats (10%, down from 14%) and independents (19%, down from 26%) say this.
“When it becomes available to you, will you definitely get the coronavirus vaccine, probably get it,
probably not get it, or definitely not get it?”
Household income Race/Ethnicity
All
$40,000 to
adults Under $80,000 or African Asian
under Latinos Whites
$40,000 more Americans Americans
$80,000
Definitely get the vaccine 28% 32% 26% 29% 28% 34% 29% 26%
Probably get the vaccine 18 21 16 14 6 21 24 12
Probably not get the
7 7 10 6 12 3 6 7
vaccine
Definitely not get the
14 13 12 15 17 2 16 13
vaccine
Already got the vaccine 33 25 35 35 36 40 22 41
Don’t know 1 2 1 – – – 2 –
PPIC.ORG/SURVEY Californians and Their Government 17PPIC STATEWIDE SURVEY MARCH 2021
Immigration Policy
On Inauguration Day, President Biden released the details of the US Citizenship Act of 2021—his
comprehensive immigration reform bill. In mid-February, the bill was introduced in Congress. The plan
would, among other things, provide a path to citizenship for undocumented immigrants.
When asked about providing a path to citizenship for undocumented immigrants in the United States if
they meet certain requirements, including a waiting period, paying fines and back taxes, and passing
criminal background checks, overwhelming majorities of Californians—including majorities across
parties—are in favor. Support today is similar to support during President Obama’s second term, when
between 80 and 86 percent were in favor each of the five times we asked this question. Today, more
than two in three across parties and more than three in four across regions and demographic groups
say they favor a path to citizenship for undocumented immigrants.
“Would you favor or oppose providing a path to citizenship for undocumented immigrants in the US if
they met certain requirements including a waiting period, paying fines and back taxes, and passing
criminal background checks?”
Party Race/Ethnicity
All
adults African Asian
Dem Rep Ind Latinos Whites
Americans Americans
Favor 85% 93% 68% 81% 92% 79% 92% 80%
Oppose 13 6 31 14 8 16 7 17
Don’t know 3 1 1 5 – 5 1 3
Since 2016, California has allowed low-income children to participate in Medi-Cal regardless of
immigration status, and since 2020, young low-income adults age 18 to 25 have been allowed to
participate regardless of their immigration status. Currently, there are two separate bills in the
legislature, one that would expand Medi-Cal eligibility to low-income seniors age 65 and older
regardless of their immigration status and the other that would expand eligibility to low-income adults
age 26 to 64 regardless of their immigration status. In general, two in three Californians favor the idea
of providing health care coverage for undocumented immigrants in the state. This marks a 12-point
increase since we last asked the question in December 2015 (54% favor, 42% oppose) and a 23-point
increase since the first time we asked this question in March 2007 (43% favor, 53% oppose).
While there is broad support for providing health care coverage for undocumented immigrants in
California, there are differences across subgroups. Notably, while about eight in ten Democrats favor
this idea, just two in ten Republicans are in favor. Fifty-seven percent of independents are supportive.
There are also differences across racial/ethnic groups with at least seven in ten Latinos, African
Americans, and Asian Americans in favor, compared to half of whites. Support for providing health care
coverage to undocumented immigrants is much higher among younger Californians (83% 18 to 34, 68%
35 to 54, 49% 55 and older) and among lower-income Californians (78% under $40,000, 68% $40,000 to
$80,000, 57% $80,000 or more).
Among those who favor a path to citizenship, 74 percent also favor health care coverage for
undocumented immigrants. Among those who oppose a path to citizenship, 79 percent oppose health
care coverage for undocumented immigrants.
“Do you favor or oppose providing health care coverage for undocumented immigrants in California?”
Party Race/Ethnicity
All
adults African Asian
Dem Rep Ind Latinos Whites
Americans Americans
Favor 66% 82% 20% 57% 77% 70% 83% 51%
Oppose 31 15 77 39 22 26 16 45
Don’t know 3 3 2 4 2 5 1 4
PPIC.ORG/SURVEY Californians and Their Government 18PPIC STATEWIDE SURVEY MARCH 2021
Political and Racial Divisions
Californians are divided about whether Americans of different political views can come together and
work out their differences (49% optimistic, 46% pessimistic). This division remains roughly unchanged
from September 2020, during the lead up to the presidential election (47% optimistic, 49% pessimistic).
Today, Republicans (61%) are more likely than Democrats (50%) and independents (55%) to have
pessimistic views. Across racial/ethnic groups, a majority of whites (60%) and half of Asian Americans
(50%) are pessimistic, compared to smaller shares of African Americans (45%) and Latinos (30%).
“These days, do you feel optimistic or pessimistic that Americans of different political views can still
come together and work out their differences?”
Party Race/Ethnicity
All
adults African Asian
Dem Rep Ind Latinos Whites
Americans Americans
Optimistic 49% 47% 37% 42% 54% 45% 64% 37%
Pessimistic 46 50 61 55 45 50 30 60
Don't know 5 3 2 3 1 5 6 3
When it comes to race relations in the United States, 43 percent of Californians say things are worse
than they were a year ago, about a third (36%) say things are about the same, and two in ten (19%) say
things are better. The share saying things are worse has decreased 16 points since prior to the election
(59%, September 2020).Today, six in ten Republicans say things are worse, compared to pluralities of
Democrats and independents (45% each). Asian Americans (50%), whites (48%), and African Americans
(44%) are much more likely than Latinos (32%) to say race relations are worse now than they were a
year ago.
A majority of Californians (58%) say people not seeing racial discrimination where it really does exist is
a bigger problem for the country today than people seeing racial discrimination where it really does not
exist (38%). About half or more across demographic groups share this view. African Americans (83%)
and Asian Americans (74%) are much more likely than whites (56%) and Latinos (50%) to say this.
Democrats (81%) and independents (56%) are far more likely than Republicans (29%) to say the bigger
problem is people not seeing racial discrimination where it does exist. A similar share of adults across
the nation shared this view, according to a Pew Research Center survey fielded from January 22–
February 5, 2019.
“When it comes to racial discrimination, which do you think is the bigger problem for the country
today—people seeing racial discrimination where it really does not exist or people not seeing racial
discrimination where it really does exist?”
Party Race/Ethnicity
All
adults African Asian
Dem Rep Ind Latinos Whites
Americans Americans
People seeing racial
discrimination where it really 38% 18% 67% 39% 16% 23% 44% 41%
does not exist
People not seeing racial
discrimination where it really 58 81 29 56 83 74 50 56
does exist
Don't know 4 1 5 5 1 2 5 4
A majority of Californians say police in their community treat all racial and ethnic groups fairly almost
always (25%) or most of the time (29%). The shares with this view have remained similar from
September 2020, amid nationwide protests over police brutality and systemic racism (24% almost
always, 29% most of the time). Today, only 18 percent of African Americans say police treat all
racial/ethnic groups fairly almost always or most of the time, compared to far more whites (59%), Asian
Americans (55%), and Latinos (52%) who hold this view. Across partisan groups, an overwhelming
majority of Republicans (82%) and half of independents (49%) hold this view, compared to about four in
ten Democrats (38%).
PPIC.ORG/SURVEY Californians and Their Government 19PPIC STATEWIDE SURVEY MARCH 2021 Regional Map PPIC.ORG/SURVEY Californians and Their Government 20
PPIC STATEWIDE SURVEY                                                                              MARCH 2021

Methodology
The PPIC Statewide Survey is directed by Mark Baldassare, president and CEO and survey director at
the Public Policy Institute of California. Associate survey director and research fellow Dean Bonner was
the project manager for this survey. Co-authors of this report include survey analyst Rachel Lawler and
survey analyst Deja Thomas. The Californians and Their Government series is supported with funding
from the Arjay and Frances F. Miller Foundation, the James Irvine Foundation, and the PPIC Donor
Circle. The PPIC Statewide Survey invites input, comments, and suggestions from policy and public
opinion experts and from its own advisory committee, but survey methods, questions, and content are
determined solely by PPIC’s survey team.
Findings in this report are based on a survey of 1,706 California adult residents, including 1,269
interviewed on cell phones and 437 interviewed on landline telephones. The sample included 510
respondents reached by calling back respondents who had previously completed an interview in PPIC
Statewide Surveys in the last six months. Interviews took an average of 19 minutes to complete.
Interviewing took place on weekend days and weekday nights from March 14–23, 2021.
Cell phone interviews were conducted using a computer-generated random sample of cell phone
numbers. All cell phone numbers with California area codes were eligible for selection. After a cell
phone user was reached, it was verified that this person was age 18 or older, a resident of California,
and in a safe place to continue the survey (e.g., not driving). Cell phone respondents were offered a
small reimbursement to help defray the cost of the call. Cell phone interviews were conducted with
adults who have cell phone service only and with those who have both cell phone and landline service in
the household.
Landline interviews were conducted using a computer-generated random sample of telephone
numbers that ensured that both listed and unlisted numbers were called. All landline telephone
exchanges in California were eligible for selection. After a household was reached, an adult respondent
(age 18 or older) was randomly chosen for interviewing using the “last birthday method” to avoid biases
in age and gender.
For both cell phones and landlines, telephone numbers were called as many as eight times. When no
contact with an individual was made, calls to a number were limited to six. Also, to increase our ability
to interview Asian American adults, we made up to three additional calls to phone numbers estimated
by Survey Sampling International as likely to be associated with Asian American individuals.
Live landline and cell phone interviews were conducted by Abt Associates in English and Spanish,
according to respondents’ preferences. Accent on Languages, Inc., translated new survey questions
into Spanish, with assistance from Renatta DeFever.
Abt Associates uses the US Census Bureau’s 2015–2019 American Community Survey’s (ACS) Public
Use Microdata Series for California (with regional coding information from the University of
Minnesota’s Integrated Public Use Microdata Series for California) to compare certain demographic
characteristics of the survey sample—region, age, gender, race/ethnicity, and education—with the
characteristics of California’s adult population. The survey sample was closely comparable to the ACS
figures. To estimate landline and cell phone service in California, Abt Associates used 2019 state-level
estimates released by the National Center for Health Statistics—which used data from the National
Health Interview Survey (NHIS) and the ACS. The estimates for California were then compared against
landline and cell phone service reported in this survey. We also used voter registration data from the
California Secretary of State to compare the party registration of registered voters in our sample to
party registration statewide. The landline and cell phone samples were then integrated using a frame
integration weight, while sample balancing adjusted for differences across regional, age, gender,
race/ethnicity, education, telephone service, and party registration groups.

PPIC.ORG/SURVEY                                                          Californians and Their Government   21
You can also read