Investor presentation - Q1 2019 - Qiagen

Page created by Louis Goodwin
 
CONTINUE READING
Investor presentation - Q1 2019 - Qiagen
Center for Biomarker Research, Graz, Austria

                           Investor presentation
                           Q1 2019

     Sample to Insight
                           Investor presentation Q1 2019   1
Investor presentation - Q1 2019 - Qiagen
Disclaimer

Safe Harbor Statement: This presentation contains both historical and forward-looking statements. All statements other than statements of historical fact are, or may be deemed to be forward looking
statements within the meaning of Section 27A of the U.S. Securities Act of 1933, as amended, and Section 21E of the U.S. Securities Exchange Act of 1934, as amended. These statements are based on
current expectations of future events. If underlying assumptions prove inaccurate or unknown risks or uncertainties materialize, actual results could vary materially from our own expectations and projections.
Some of the factors that could cause actual results to differ include, but are not limited, to the following: general industry conditions and competition; risks associated with managing growth and international
operations (including the effects of currency fluctuations, regulatory processes and dependence on logistics), variability of operating results and allocations between customer classes, and the commercial
development of markets for our products to customers in academia, pharma, applied testing and molecular diagnostics; changing relationships with customers, suppliers and strategic partners; competition;
rapid or unexpected changes in technologies; fluctuations in demand for QIAGEN's products (including factors such as general economic conditions, the level and timing of customers' funding, budgets and
other factors); our ability to obtain regulatory approval of our products; technological advances of our competitors and related legal disputes; difficulties in successfully adapting QIAGEN's products to
integrated solutions and producing such products; the ability of QIAGEN to identify and develop new products and to differentiate and protect our products from competitor products; market acceptance of
QIAGEN's new products and the integration of acquired technologies and businesses. For further information, please refer to “Risk Factors” section of reports that QIAGEN has filed with, or furnished to, the
U.S. Securities and Exchange Commission (SEC). We undertake no obligation, and do not intend, to update these forward-looking statements as a result of new information or future events or developments
unless and to the extent required by law.

Regulation G: QIAGEN reports adjusted results, as well as results on a constant exchange rate (CER) basis, and other non-U.S. GAAP figures (generally accepted accounting principles), to provide
additional insight on performance. In this presentation, adjusted results include adjusted net sales, adjusted operating expenses, adjusted EBITDA, adjusted diluted EPS and free cash flow. Adjusted results
are non-GAAP financial measures QIAGEN believes should be considered in addition to reported results prepared in accordance with GAAP, but should not be considered as a substitute. QIAGEN believes
certain items should be excluded from adjusted results when they are outside of its ongoing core operations, vary significantly from period to period, or affect the comparability of results with its competitors
and its own prior periods. Please see the Appendix provided in this presentation “Reconciliation of Non-GAAP to GAAP Measures” for reconciliations of historical non-GAAP measures to comparable GAAP
measures and the definitions of terms used in the presentation. QIAGEN does not reconcile forward-looking non-GAAP financial measures to the corresponding GAAP measures due to the high variability
and difficulty in making accurate forecasts and projections that are impacted by future decisions and actions. Accordingly, reconciliations of these forward-looking non-GAAP financial measures to the
corresponding GAAP measures are not available without unreasonable effort. However, the actual amounts of these excluded items will have a significant impact on QIAGEN’s GAAP results.

GeneReader NGS System: The QIAGEN GeneReader® NGS System is intended for Research Use Only. This product is not intended for the diagnosis, prevention or treatment of a disease. QIAGEN
Clinical Insight® is an evidence-based decision support software intended as an aid in the interpretation of variants observed in genomic sequencing data. The software evaluates genomic variants in the
context of published biomedical literature, professional association guidelines, publicly available databases and annotations, drug labels and clinical-trials. Based on this evaluation, the software proposes a
classification and bibliographic references to aid in the interpretation of observed variants. The software is not intended as a primary diagnostic tool by physicians or to be used as a substitute for professional
healthcare advice. Each laboratory is responsible for ensuring compliance with applicable international, national and local clinical laboratory regulations and other accreditation requirements.

Sample to Insight
                    Investor presentation Q1 2019                                                                                                                                                                  2
Investor presentation - Q1 2019 - Qiagen
Agenda

                                                    Introducing QIAGEN

                                                    Portfolio review

                                                    Full-year 2018 results

                                                    Q4 2018 results

                                                    Appendix

Sample to Insight
                    Investor presentation Q1 2019                            3
Investor presentation - Q1 2019 - Qiagen
THE BUILDING BLOCKS OF LIFE:                                  CUSTOMERS RELY ON QIAGEN FOR
DNA AND RNA                                                   MOLECULAR TESTING SOLUTIONS

                                                                      Sample            Assay
                                                                                                       Bioinformatics
                                                                   technologies      technologies
                                                                                  Automation systems
                                                                                  Sample to Insight

         QIAGEN: World leader in molecular testing solutions that advance science and improve outcomes for patients

Sample to Insight
                    Investor presentation Q1 2019                                                                       4
Investor presentation - Q1 2019 - Qiagen
ADDRESSING THE WORLD’S
MOST PRESSING CHALLENGES

               Academia
               How can we achieve scientific breakthroughs even faster?

               Pharma
               How can we develop better and safer drugs?

               Applied Testing
               How can we improve public safety?

               Molecular Diagnostics
               How can we further improve outcomes for patients?

         Expanding range of customers want to benefit from the value of molecular insights

Sample to Insight
                    Investor presentation Q1 2019                                            5
Investor presentation - Q1 2019 - Qiagen
QIAGEN customer classes                                            Product portfolio                                      Global presence
9M 2018 net sales (% of total QIAGEN sales)                        9M 2018 net sales (% of total QIAGEN sales)            9M 2018 net sales (% of total QIAGEN sales)

 Molecular                                          Academia
Diagnostics                                                                                                                        Americas                       Europe /
                                      ~22%                                                                                                                        Middle East /
                                                                                                                                                                  Africa
                                                                                                                                                          ~32%
            ~49%                                         Life
                                                       Sciences                     ~12%               ~88%                               ~48%
                                           ~20%                                                                  Consumables
                                                                   Instruments
                                                      Pharma                                                  and bioinformatics
                                                                  (capital sales)
                               ~9%                                                                             (recurring sales)
                                                                                                                                                     ~20%        Asia-Pacific /
                                                                                                                                                                 Japan / ROW
                         Applied Testing

                                          A most trusted brand found in virtually every lab worldwide
                                          True hybrid across continuum from Life Sciences to Molecular Diagnostics
                                          Netherlands holding company, listed on NYSE and Frankfurt Stock Exchange
                                          ~5,000 employees in over 35 countries

         World leader in molecular testing enabling customers to transform biological samples into valuable insights

Sample to Insight
                    Investor presentation Q1 2019                                                                                                                             6
Investor presentation - Q1 2019 - Qiagen
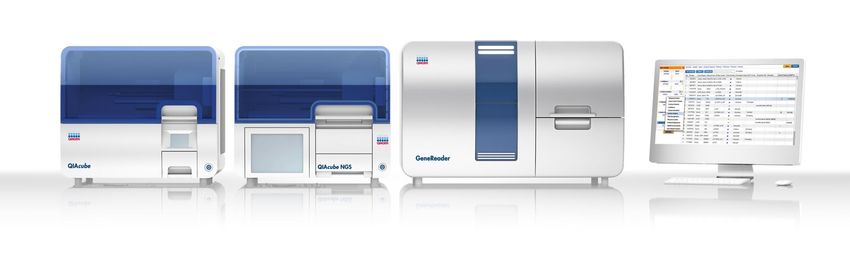
Sales by customer class
(As % of annual net sales)
                                                                 2016-2020 target:
                                                                ~+7-9% CER CAGR

                       100%                              100%
                                                                                           Academia
                                                                       45%
                         26%                             23%
                                                                                           Pharma

                                                         19%
                         21%                                                               Applied Testing

                          6%                             10%
                                                          2%                               U.S. HPV
                         22%                                           55%
                                                                                           MDx core portfolio
                                                         46%
                         25%

                         2009                            2017          2020

         QIAGEN going through transformation to focus on attractive growth opportunities
                    CAGR – Compound annual growth rate
Sample to Insight
                    Investor presentation Q1 2019                                                               7
Investor presentation - Q1 2019 - Qiagen
2020 ambitions

                           Net sales                             Adjusted EPS              Operating cash flow

                                        ~+7-9% CER                         ≥12% CER
                                           CAGR                              CAGR                        ~$600 m

        $1,338 m
        +6% CER
                                                         $1.11
                                                                                         $340 m

            2016                                 2020    2016                    2020    2016              2020
                                                target                          target                    target

           2020 ambitions: Strong growth in sales, adjusted EPS and cash flow

Sample to Insight
                    Investor presentation Q1 2019                                                                  8
Investor presentation - Q1 2019 - Qiagen
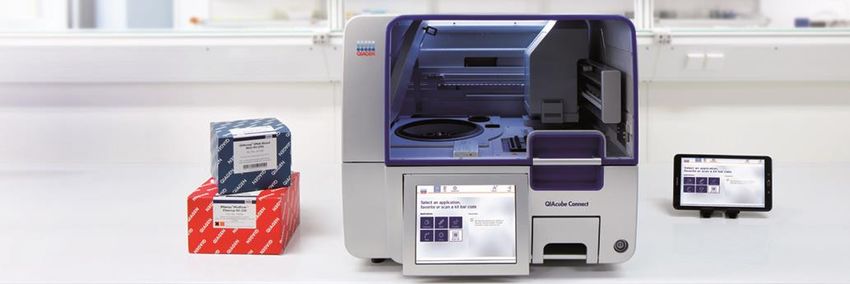
Reinvest for organic growth
                                                            Capture more value from our Sample to Insight portfolio
                                                              New products
                                                              Geographic expansion

                                                           Increase returns
          Disciplined
                                                            Returned $300 million in 2017
        capital allocation
                                                            New commitment in 2018 to return $200 million via repurchases

                                                           Targeted M&A / licensing
                                                            Continuing our strategy
                                                              Novel technologies
                                                              Molecular test content
                                                              Geographic expansion

         Supporting our business expansion while increasing returns to shareholders

Sample to Insight
                    Investor presentation Q1 2019                                                                            9
Investor presentation - Q1 2019 - Qiagen
+        Maximize sales growth
            Multiple drivers

                                                +        Deliver operating leverage
                                                                                                Greater
                                                +        Optimize balance sheet                  value
                                                                                                creation
                                                +        Strong governance and top talent

                                                =        Adjusted EPS growth and high returns

           Committed to higher returns and greater value creation as differentiated leader

Sample to Insight
                               Investor presentation Q1 2019                                               10
Agenda

                                                    Introducing QIAGEN

                                                    Portfolio review

                                                    Full-year 2018 results

                                                    Q4 2018 results

                                                    Appendix

Sample to Insight
                    Investor presentation Q1 2019                            11
Sample to Insight portfolio

Key highlight areas: QIAGEN’s Sample to Insight portfolio
                                                                          Life Sciences   Molecular Diagnostics

                                            QuantiFERON                                           ✓
                                            QIAstat-Dx                                            ✓
                                            NeuMoDx                                               ✓
                                            Next-generation sequencing        ✓                   ✓
                                            QIAsymphony                       ✓                   ✓
       Life Sciences

                                            Precision Medicine                                    ✓
                                            Differentiated Technologies       ✓
                Multiple growth opportunities across our Sample to Insight portfolio

Sample to Insight
                       Investor presentation Q1 2019                                                              12
QuantiFERON

2018 highlights                                                   Full automation sets new standard for TB testing

 Achieved goal for 21% CER full-year sales growth                   QFT Gold Plus

 Strong guideline expansion driving modern blood test adoption                             +

 Hamilton and DiaSorin partnerships for automated TB testing
   Launch of CE-marked DiaSorin read-out test on LIAISON in Q3

                                                                    Single tube          Hamilton           DiaSorin                 Test
                                                                  blood collection    Microlab STAR       LIAISON XL                results
                                                                                     (Liquid handling)   (Test read-out)

2019 catalysts                                                    QuantiFERON-TB Access (QFT Access)

 DiaSorin partnership U.S. launch in 2019 and China in 2020       No continuous power                         No computer
                                                                      supply needed                              needed
 Developing QuantiFERON-TB Access
                                                                                                                             No cold chain for
   Benefits of QFT-Plus for low-resource, high-burden regions                                                                consumables
   Clinical trials in 2019, launch planned for 2020

         QuantiFERON-TB: On track to achieve 2020 goal of $300 million of annual sales

Sample to Insight
                    Investor presentation Q1 2019                                                                                             13
QuantiFERON

Tuberculin skin test (TST)                                                                                                                 QuantiFERON-TB (QFT)

   Manual placement, reading, data entry                                                                                                     Can be fully automated
   Affected by BCG vaccine and NTM                                                                                                           Highly specific
   Two patient visits required                                                                                                               Results with one patient visit
   Significant inter-reader variability                                                                                                      No inter-reader variability
   Poor surveillance tool                                                                                                                    Electronic results
   Often no quality control after training                                                                                                   Quality-assured laboratory test(1)

           QuantiFERON-TB: Leading IGRA with significant clinical and workflow benefits
                    BCG – Bacillus Calmette-Guerin vaccine   NTM – Non-tuberculosis mycobacteria   IGRA – Interferon-gamma release assay
                    (1) Not available in all markets
Sample to Insight
                    Investor presentation Q1 2019                                                                                                                                   14
QuantiFERON

Expanding QuantiFERON-TB benefits
                                                                                                                                                       Total
                                                                                                                                                    convertible
                                                            2020 target: >$300 million sales
                                                                                                                                                   LTBI market:
                                                             Intensify commercial activities in strategic markets
                                                             Automation upgrades to improve workflow                                               ~70 million
                                                             Continue menu expansion                                                             tests annually
    North America
     Market: ~20 million LTBI tests
     FDA approval of QFT-Plus in 2017                                                                                            China
     Commercial power: Adding reps                                                                                                Market: ~15 million LTBI tests
                                                                                                                                   Build networks and
                                                                                                                                    drive clinical demand
                                                                                                                                   Support LTBI guidelines

                    Latin America                                                                                               Japan
                     Market: ~8 million LTBI tests                                                                              Market: ~7 million LTBI tests
                     Support public health                                                                                      Launch QFT-Plus in Feb 2018
                      guidelines                                                                                                 Develop commercial partner network

                                                                                                     Asia-Pacific
                                                      Europe / Middle East / Africa                     Market: ~15 million LTBI tests
                                                       Market: ~5 million LTBI tests                   Highest TB burden region
                                                       Dubai hub to expand                             Go direct in attractive markets
                                                        regional activities                             Influence guidelines

           QuantiFERON-TB: Drive commercial success through targeted global actions

Sample to Insight
                    Investor presentation Q1 2019                                                                                                                      15
QIAGEN’s footprint in the Molecular Diagnostics market

Addressing the majority of the ~4.8 billion Molecular Diagnostics market in 2018

                                                                  Single-plex PON   Arrays

                                                    Benchtop NGS
                                                     GeneReader
                                                      NGS System

                                                                                             Real-time PCR
                                    Syndromic testing                                        Fully integrated sample
                                     QIAstat-Dx                                             and assay technologies
                                                                                              NeuMoDx 96 and 288

                                                     Real-time PCR
                                                     Modular sample and
                                                     assay technologies
                                                     QIAsymphony RGQ

            Since 2015: QIAGEN created a comprehensive automation portfolio addressing MDx key segments

Sample to Insight
                    Investor presentation Q1 2019                                                                      16
QIAstat-Dx

2018 highlights                                                                                       QIAstat-Dx

 Addressing ~$800 million market opportunity in syndromic testing
 Over 300 placements following 2018 launch with two panels
 Differentiation: Ease of use, PCR-based system and cost efficiency
 U.S. submission done in Q4, plan for 2019 U.S. launch

2019 catalysts
                                                                                      Blood culture
                                                                                       Pneumonia
                                                                 Meningitis            Meningitis
Selected                                     CLIA Resp.          CLIA Resp.            CLIA Resp.
U.S. assay                                   Respiratory         Respiratory           Respiratory
menu plans                                     Gastro              Gastro                Gastro                                       QIAstat-Dx     Comp. B     Comp. G
                           2018                 2019                2020                 2021
                                                                                      Blood culture   Real-time PCR quantification                     No           No
                                                                                       Pneumonia      Display of curves / Ct values                    No           No
                                                                  Oncology              Oncology
Selected                                                                                              Time to result                    ~1 hour      ~1 hour    ~1.5 hours
                                             Meningitis          Meningitis            Meningitis
CE-IVD assay
                       Respiratory           Respiratory         Respiratory           Respiratory    Reagent reconstitution          Not required   Required   Not required
menu plans
                         Gastro                Gastro              Gastro                Gastro
                                                                                                      Hands-free sample preparation                    No           No
                          2018                      2019                2020               2021
                          2018                  2019                2020                  2021

         QIAstat-Dx: Next-generation system for reliable, fast and cost-effective diagnosis of complex syndromes
                    CLIA - Clinical Laboratory Improvement Amendments      Resp. – Respiratory
Sample to Insight
                    Investor presentation Q1 2019                                                                                                                              17
NeuMoDx

2018 highlights                                                                                                            NeuMoDx 96 / 288

 Entering ~$2.7 billion fully-integrated PCR market segment
 Late 2018 launch, complements QIAsymphony (modular segment)
 Differentiation: Speed, random access, walk-away, on-board storage
 Contingent full acquisition of NeuMoDx: Mid-2019 to mid-2020(1)

2019 catalysts

Selected CE-IVD assay menu plans                                     Trich + MG
                                                                         HIV
                                                                                                                                                                         NeuMoDx       Comp. R      Comp. H
                                                                    FluA / B-RSV
                                                                         HPV                                                 True random access                                           No           No
                                                                         EBV
                                                                         GAS                                                 Time to result                                40 min
NeuMoDx

NeuMoDx platform key features

                                                                Specification         NeuMoDx N288       NeuMoDx N96
          Rapid turnaround time
                                                    Sample throughput:                High-throughput   Mid-throughput
                                                     Samples per 8-hour shift            Up to 340         Up to 150
          Best ease-of-use
                                                     Maximal sample loading                 288               96
          Greater workflow versatility              Walk-away capability                 ~7 hours          ~5 hours
                                                    Turn-around time                    40 to 80 min      40 to 80 min
          Cost efficiency                           True random access                Up to 30 assays   Up to 20 assays
                                                    Footprint                         183 cm x 109 cm   136 cm x 108 cm
          Compact design
                                                    Onboard refrigeration necessary         No                No

         NeuMoDx N96 and N288: Two novel platforms with identical consumables and same core technology

Sample to Insight
                    Investor presentation Q1 2019                                                                         19
Next-generation sequencing

2018 highlights                                                                                                               GeneReader NGS System

 Exceeded $140 million target for NGS sales
       2019 target of ~$190 million
 GeneReader NGS System
   Gaining share in ~$300 m global benchtop oncology NGS market
   Offering full menu of cancer gene panels

 Universal NGS
   Launch of QIAseq FastSelect: Breakthrough for RNA sequencing

2019 catalysts
                                                                                                                                                                      GeneReader              Comp. I                 Comp. T
GeneReader NGS System:                                                                   NIPT
Selected RUO assay menu                            TMB                                   TMB                                  Fully integrated workflow                                          No                    Partly
                                            Lung LB Monitoring                    Lung LB Monitoring                          Integrated bioinformatics                                          No                    Partly
          Myeloid DNA UMI                    Myeloid DNA UMI                       Myeloid DNA UMI
           BRCA Adv UMI                       BRCA Adv UMI                          BRCA Adv UMI                              Scalable, flexible throughput                                      No                     No
            AIT DNA UMI                        AIT DNA UMI                           AIT DNA UMI                              Price per insight                                                  No                     No
           Custom Panel                       Custom Panel                          Custom Panel
                                                                                                                              Continuous loading                                                 No                     No
               2018                                   2019                                  2020
                2018                                 2019                                   2020

            GeneReader NGS System: Unique NGS solution targeting growing oncology gene panels segment
                    RUO – Research-use only         NIPT – Non-invasive pre-natal testing     TMB – Tumor mutational burden     LB – Liquid biopsy   UMI – Unique molecular index   AIT – Actionable Insights Tumor
Sample to Insight
                    Investor presentation Q1 2019                                                                                                                                                                               20
GeneReader NGS System

                                Ease of use                   Unique automation           Reliable results                 Data interpretation

                          QIAcube®                           GeneRead QIAcube®            GeneReader™                      Bioinformatics portfolio

         1                                              2                         3                              4                                     5

First complete                                      Predictable              Actionable                       Expertise                          Flexibility to
NGS workflow                                           costs                  insights                       and service                          fit needs

             The world’s first complete Sample to Insight NGS solution for actionable results

Sample to Insight
                    Investor presentation Q1 2019                                                                                                                 21
GeneReader NGS System

                                                                                           QIAGEN                         Target customer requirements                            Comp. I      Comp. T
                             (1)
         Actionability                                                                      100%                                      100%                                         70%          80%
                                                                                                                                       Minimum                   Optimum
            Integration of bioinformatics                                                    100%                                                                                   70%         80%

            Strength of Knowledge Base, # publications                                        >30k                                                                               Third party    >1k

            Actionable variants detected in panel                                            >700                                                                                   500         600

         Analytical performance                                                              100%                                           100%                                    70%         80%
                                                                                                                           Minimum                               Optimum
                                                                                         >35 to >60
            Accuracy (Q-score)                                                              UMI                                                                                      30          25

            Read length (base pairs)                                                          150                                                                                  2x300        600

            Integration and in-process controls                                              100%                                                                                   70%         80%

         Throughput range of tumor panel(2)                                               200-3,000                                     250-1,500                                300-1,000     ≥1,000
                                                                                                                      Minimum           Optimum
            Data output (gigabases)                                                             6                                                                                    15          15

            Sample to result turnaround time (days)                                             5                                                                                    4           3

            Time to go live (months)                                                            1                                                                                   3-9          3-9

           Meeting and exceeding target requirements with strong competitive position
                    (1) Based on 2 use case scenarios: a) QIAact AIT vs. AmpliSeq Hotspot vs. Tumor 15; b) QIAact Lung vs. Oncomine Lung vs. Tumor 15
                    (2) Based on price per sample analysis incl. consumables, hardware and software (no service) for use-case a): QIAact AIT vs. AmpliSeq Hotspot vs. Tumor 15
                    UMI – Unique Molecular Indices
Sample to Insight
                    Investor presentation Q1 2019                                                                                                                                                        22
GeneReader NGS System

NGS market by application                                                                                                 Clinical research market throughput(1)
                                      Share of                                    Large                WES /                                                                        Majority of use is
                                                             Panels

                                                                                                                                  No. of laboratories
                                       market                                     panels               WGS                                                                          in the mid to low
                                                                                                                                                                                          throughput

Research                                  80%                  20%                  40%                  40%
                                                                                                                                                                            Average
Clinical research                                                                                                                                                          throughput
                                          20%                 70%                  20%                  10%
and diagnostics
                                                                                                                                                        0         250         500        750        1,000       1,500   2,000   2,500
                                                                                                                                                                                                 Samples per year

Throughput per small benchtop system ($150                                                                               throughput needs of panel
                                                                                                                                                                        market very well

                                                                                                                            Panels panels WES
                                             Higher consumable
                                               pull-through for                                                                                                                                     Comp. T

                                                                                                                                   Large
                            ~$40                clinical labs                                                                                                                Comp. I

                                                                            Clinical                                                                                                    GeneReader
                          Research
                          Research                                           Clinical research
                                                                                      research
                                                                            and diagnostics
                                                                              and diagnostics                                                               Low                           Medium                        High
                                                                                                                                                                                         Throughput

           GeneReader targeting a distinct and highly attractive market segment
                    (1)   Including pathology market (2) Based on price per sample analysis incl. consumables, hardware and software (no service) for use-case:
                          QIAact AIT vs. AmpliSeq Hotspot vs. Tumor 15    WES – Whole exome sequencing           WGS – Whole genome sequencing
Sample to Insight
                    Investor presentation Q1 2019                                                                                                                                                                                  23
Natera and QIAGEN collaboration

GeneReader NGS System

 Long-term partnership for development of cutting-edge genetic testing assays
       Joint development of NGS-based cell-free NIPT assay
       Designed for GeneReader NGS System
       Powerful bioinformatics integrating Natera’s Constellation cloud platform and QIAGEN’s QCI (QIAGEN Clinical Insight)
 Fully integrated GeneReader workflow designed to make new NIPT assay accessible for any lab around the world
       Building on Natera’s expertise in reproductive genetics and non-invasive cell-free DNA testing
       Providing access to genetic testing across several applications, including prenatal screening
       Fully integrated workflow based on a simple blood sample
 Broadening value and utility of GeneReader beyond current oncology focus
 QIAGEN and Natera to establish and fully validate GeneReader solution

         Natera’s leading test portfolio to be added to QIAGEN’s fully integrated Sample to Insight NGS workflow
                    Transaction details include QIAGEN paying $40 m in upfront licensing fees and prepaid royalties in Q1 2018 as well as up to $10 m in future milestone payments
Sample to Insight
                    Investor presentation Q1 2019                                                                                                                                    24
Natera and QIAGEN collaboration

Clinical molecular testing market by application(1)                                                                     QIAGEN              Partnership          Natera
(In $ billions)
                                                                          3.4
                                      2.1                2.7
      1.4             1.6                                                                                                Liquid biopsy                        Cell-free DNA
                                                                         2.2               Oncology                 platform technologies                     NIPT expertise

                                                         2.1              2.5
      0.8             1.0              1.6
                                                                         2.4               NIPT                           NGS assay                          Panorama assay
                                                                                                                    platform technologies                      Test design

      0.5             0.5              0.5               0.6              0.6              Rare
                                                                                           diseases                 Fully integrated NGS                        NIPT / NGS
                                                                                                                           workflow                              Expertise
      1.3             1.4              1.5               1.7              1.9              Virology /
                                                                                           Genotyping
                                                                          4.6                                                                                    Panorama
                                       3.0               3.7                                                             Informatics
      2.1             2.4                                                                  Sexually-transmitted /                                               informatics
                                                                                           Infectious diseases
                                                                         13.0
                                                        10.8                                                               IVD                                    IVD
                                      8.7                                                                              manufacturing                          manufacturing
      6.1             6.9                                                                  Molecular
                                                                                           testing
                                                                                                                           Global                         Studies, validations and
                                                                          5.3
                                                                                                                         distribution                        clinical marketing
     2015            2016            2018               2020             2022
   Current technologies               Next-generation sequencing

            Joining forces to provide customers with actionable and potentially life-changing clinical insights
                    (1) Source: QIAGEN analysis     NIPT – Non-invasive prenatal testing
Sample to Insight
                    Investor presentation Q1 2019                                                                                                                                25
Assay roadmap

Selected assay roadmap (2018-2021)
                                                    2018                                              2019                                                2020                 2021
                                      Respiratory                                    Respiratory                                              Meningitis              Positive Blood Culture
                                      Gastrointestinal                               Gastrointestinal                                         Oncology                Pneumonia
     QIAstat-Dx
                                                                                     Meningitis                                                                       Positive Blood Culture
                                                                                 CLIA Waiver Respiratory                                                              Pneumonia
                                      GBS                                               CMV             FluA&B/RSV
                                      CT/NG                                             GAS             HIV
     NeuMoDx(1)
                                      HBV                                               EBV             Trichomonas + MG
                                      HCV                                               HPV

                                      DiaSorin workflow                                 QuantiFERON Monitor                                   QuantiFERON-TB Access
   QuantiFERON                                                                          QuantiFERON CMV
                                                                                        Hamilton workflow

                                    Custom Panels                                      Lung Liquid Biopsy Monitoring                         NIPT panel (Natera)
    GeneReader                      QIAact AIT DNA UMI                                 Comprehensive Cancer
    NGS System                      QIAact BRCA Adv. UMI                               TMB panel
                                    QIAact Myeloid DNA UMI

    Launched                CE submission                  FDA submission            Research use only

         Significant assay menu expansion underway to address large market opportunities
                    (1) NeuMoDx is responsible for menu development and U.S. commercialization.
                    UMI – Unique molecular index      AIT – Actionable Insights Tumor     TMB – Tumor mutational burden   NIPT – Non-invasive prenatal testing
Sample to Insight
                    Investor presentation Q1 2019                                                                                                                                              26
Precision Medicine

2018 highlights                                                                                                     N-of-One clinical interpretation services

 Novartis partnership: CDx for PIK3CA-mutated breast cancers
 Day One launch readiness with leading clinical laboratories
   NeoGenomics (U.S.) and SRL (Japan)

 Strong momentum in immuno-oncology (I-O)
   Launch of QIAseq TMB panel featuring Digital NGS technology

 N-of-One acquisition to strengthen clinical NGS interpretation
   Adds 125,000 anonymous patient files with real-world evidence
   Complementary to QIAGEN’s software and content solutions

                                                                                                                     Genomics England / NHS Partnership
2019 catalysts
 Continuing expansion of Pharma partnerships including I-O                                                           QCI bioinformatics partnership with Genomics England and NHS
 Companion diagnostics launches tied to drug regulatory approvals                                                         Genomic medicine project analyzing 5 million genomes
                                                                                                                            over the next 5 years
                                                                                                                           QCI gold-standard enabling large-scale precision medicine

         Delivering decision-support insights across growing range of diseases and platforms
                    CDx – Companion diagnostics     TMB – Tumor mutational burden   QCI – QIAGEN Clinical Insight
Sample to Insight
                    Investor presentation Q1 2019                                                                                                                                       27
Life Sciences technologies

QIAcube Connect                                                                                                                 QIAcube Connect
 New generation of automation for sample processing
   Based on proven QIAGEN spin columns and chemistry
   Builds on >8,000 first-generation QIAcube placements
   Over 3,000 protocols for automation of over 80 kits
   Digital connections for remote access and monitoring

2020 entry into digital PCR market                                                                                               New QIAGEN digital PCR platforms
 Acquisition of digital PCR technology from Formulatrix(1)
   New instrument range in late-stage development by QIAGEN
   Commercialization planned for 2020

 Fully integrated microplate-based platform series
   Fast protocols: 300 minutes
   Higher multiplexing: 5-plex vs. current 2-plex
   Significant throughput flexibility

         New instruments set to accelerate Life Science portfolio and provide access to fast-growing markets
                    (1) On January 7, 2019, QIAGEN announced plans to acquire digital PCR assets from Formulatrix, Inc., for $125 million in cash and up to about $135 million in future milestones. Closing is expected by mid-2019.
Sample to Insight
                    Investor presentation Q1 2019                                                                                                                                                                                       28
Agenda

                                                    Introducing QIAGEN

                                                    Portfolio review

                                                    Full-year 2018 results

                                                    Q4 2018 results

                                                    Appendix

Sample to Insight
                    Investor presentation Q1 2019                            29
FY 2018: Consolidated Statements of Income (unaudited)

                                                                                                  Twelve months ended    Twelve months ended
            (In $ thousands, except share data)                                                   December 31, 2018       December 31, 2017
            Net sales                                                                                       1,501,848              1,417,536
            Cost of sales                                                                                     500,888                494,975
            Gross profit                                                                                    1,000,960                922,561
            Operating expenses:
                  Research and development                                                                    161,852                154,084
                  Sales and marketing                                                                         392,281                375,562
                  General and administrative, restructuring, integration and other                            141,214                200,098
                  Acquisition-related intangible amortization                                                  39,032                 39,398
            Total operating expenses                                                                          734,379                769,142
            Income from operations                                                                            266,581                153,419
               Adjusted income from operations                                                                403,315                371,461
            Other income (expense):
                  Interest income                                                                              20,851                 10,645
                  Interest expense                                                                            (67,293)               (49,685)
                  Other income (expense), net                                                                   5,598                     (4)
            Total other expense, net                                                                          (40,844)               (39,044)
            Income before income taxes                                                                        225,737                114,375
               Adjusted income before income taxes                                                            385,450                358,359
            Income taxes                                                                                       35,357                 73,981
               Adjusted income tax                                                                             73,560                 63,067
            Net income                                                                                        190,380                 40,394
               Adjusted net income                                                                            311,891                295,292
            Diluted net income per common share                                                                $0.82                   $0.17
               Adjusted diluted net income per common share                                                    $1.34                   $1.27
            Diluted shares used in computing diluted net income per common share (in thousands)               233,456                233,009

Sample to Insight
                    Investor presentation Q1 2019                                                                                               30
2018: Quarterly and full-year income statement summary

            (In $ millions, unless indicated)
            (Diluted EPS in $ per share)                                                               Q1 2018                    Q2 2018                    Q3 2018        Q4 2018           2018
            Net sales                                                                                     343.6                     377.2                      377.9          403.2          1,501.8
            Net sales (CER)                                                                               327.3                     370.5                      387.7          415.0          1,500.5
            Gross profit                                                                                  225.7                     253.8                      256.8          264.8          1,001.0
              Gross profit margin                                                                         66%                        67%                        68%            66%             67%
            Adjusted gross profit                                                                         240.6                     269.9                      270.3          281.3          1,062.0
              Adjusted gross profit margin                                                                70%                        72%                        72%            70%             71%
            Operating income                                                                              47.9                       53.3                       77.0           88.3           266.6
              Operating margin                                                                            14%                        14%                        20%            22%             18%
            Adjusted operating income                                                                     77.2                      101.0                      105.6          119.5           403.3
              Adjusted operating margin                                                                   22%                        27%                        28%            30%             27%
            Tax rate                                                                                      17%                        20%                        16%            11%             16%
            Adjusted tax rate                                                                             20%                        20%                        19%            18%             19%
            Net income                                                                                    32.3                       36.8                       60.3           60.9           190.4
            Adjusted net income                                                                           59.6                       77.2                       81.5           93.7           311.9
            Diluted EPS                                                                                   0.14                       0.16                       0.26           0.26            0.82

            Adjusted diluted EPS (CER) ($ per share)                                                 0.26 (0.25)                0.33 (0.33)                0.35 (0.36)      0.40   (0.41)   1.34      (1.35)

            Diluted shares outstanding for EPS calculation                                                232.5                     233.8                      235.2          232.4           233.5

                    CER - Constant exchange rates   Table may have rounding differences. Refer to accompanying tables for reconciliation of reported to adjusted figures.
Sample to Insight
                    Investor presentation Q1 2019                                                                                                                                                              31
2018: Total net sales overview

            Net sales by customer class
            (In $ millions at actual rates /
                                                                             Q1 2018                          Q2 2018                            Q3 2018                    Q4 2018                    2018
            change in actual, CER rates)
                                                                    Sales      Act.       CER        Sales       Act.      CER         Sales       Act.       CER   Sales     Act.       CER   Sales    Act.     CER
            Molecular Diagnostics                                    161       14%        9%          187       11%        10%             189      5%        9%    194        1%        5%    732      7%       8%

              Of which: U.S. HPV test sales                           4         2%        2%            5       -33%       -33%            6       -24%    -24%      4        -58%    -58%      19     -33%      -33%

              MDx excl. U.S. HPV test sales                          157       14%        9%          182       13%        12%             183      6%        10%   191        3%        7%    713      9%       10%

            Applied Testing                                           31        5%        0%           33        -1%        -3%            35      -1%        1%     39       -1%        1%    137      0%       0%

            Pharma                                                    71       12%        8%           74        6%         4%             71       3%        5%     74        3%        5%    291      6%       5%

            Academia                                                  81       10%        3%           83        8%         4%             83       4%        5%     95        4%        6%    342      6%       5%

            Net sales by region
            (In $ millions at actual rates /
                                                                            Q1 2018(1)                       Q2 2018(1)                          Q3 2018(1)                 Q4 2018(1)                 2018(1)
            change in actual, CER rates)
                                                                    Sales      Act.       CER        Sales       Act.      CER         Sales       Act.       CER   Sales     Act.       CER   Sales    Act.     CER

            Americas                                                 159       12%        11%         180       10%        10%             186      8%        9%    169       -4%        -4%   693      6%       6%

            Europe / Middle East / Africa                            116       15%        4%          120        7%         4%             111     -5%        1%    143        7%        13%   490      6%       6%

            Asia-Pacific / Japan                                      68        5%        0%           77        4%         1%             80       8%        11%    91        5%        8%    315      6%       5%

                    (1) Rest of World contributed less than 1% of net sales in Q1 2018 to Q4 2018 and YTD 2018
                    Tables may contain rounding differences    Does not exclude sales of products affected by business portfolio changes
Sample to Insight
                    Investor presentation Q1 2019                                                                                                                                                                       32
Consolidated Balance Sheets

                                                     December 31,     December 31,                                                              December 31,      December 31,
(In $ thousands, except par value)                       2018            2017         (In $ thousands, except par value)                            2018             2017
Assets                                                (unaudited)                     Liabilities and Equity                                     (unaudited)
Current assets:                                                                       Current liabilities:
  Cash and cash equivalents                               1,159,079         657,714    Current portion of long-term debt                              503,116                —
                                                                                       Accounts payable                                                69,415           59,205
  Short-term investments                                   234,606          359,198
                                                                                       Derivative liabilities                                         106,594             2,424
  Accounts receivable, net                                 351,612          329,138
                                                                                       Accrued and other current liabilities                          263,017          241,690
  Income taxes receivable                                   34,936           39,509
                                                                                       Income taxes payable                                            30,047           21,473
  Inventories, net                                         162,912          155,927
                                                                                      Total current liabilities                                       972,189          324,792
  Derivative assets                                        102,754            7,480
                                                                                       Long-term liabilities:
  Prepaid expenses and other current assets                109,161           99,007                                                                  1,671,090        1,758,258
                                                                                       Long-term debt
Total current assets                                      2,155,060       1,647,973    Deferred income taxes                                           63,411           76,727
Long-term assets:                                                                      Derivative liabilities                                         317,393          253,389
  Property, plant and equipment, net                       511,659          494,321    Other long-term liabilities                                     89,279           84,354
  Goodwill                                                2,108,536       2,012,904   Total long-term liabilities                                    2,141,173        2,172,728
  Intangible assets, net                                   475,043          499,318   Equity:
  Deferred income taxes                                     42,896           39,353    Common shares, EUR 0.01 par value:
                                                                                       Authorized – 410,000 shares                                       2,702            2,702
  Derivative assets                                        295,364          224,398    Issued – 230,829
  Other long-term assets                                   159,774          120,249    Additional paid-in capital                                    1,742,191        1,630,095
Total long-term assets                                    3,593,272       3,390,543    Retained earnings                                             1,379,624        1,247,945
Total assets                                              5,748,332       5,038,516    Accumulated other comprehensive loss                           (310,644)        (220,759)
                                                                                       Less treasury shares at cost – 5,320 shares (2018) and
                                                                                       4,272 shares (2017)                                            (178,903)        (118,987)
                                                                                      Total equity                                                   2,634,970        2,540,996
                                                                                      Total liabilities and equity                                   5,748,332        5,038,516

Sample to Insight
                     Investor presentation Q1 2019                                                                                                                            33
Consolidated Statements of Cash Flows
                                                                                Twelve months ended                                                                                                          Twelve months ended
                                                                            December 31, December 31,                                                                                                    December 31,   December 31,
(In $ thousands)                                                                2018           2017                          (In $ thousands)                                                                2018           2017
                                                                             (unaudited)                                                                                                                  (unaudited)
Cash flows from operating activities:                                                                                        Cash flows from financing activities:
Net income                                                                           190,380                  40,394          Proceeds from long-term debt,
                                                                                                                              net of issuance costs                                                                       −               329,875
Adjustments to reconcile net income to net cash provided by                                                                   Proceeds from issuance of cash convertible notes,
operating activities, net of effects of businesses acquired:                                                                  net of issuance costs                                                               494,879                 394,391
  Depreciation and amortization                                                      206,436                 216,448          Purchase of call option related to cash
                                                                                                                              convertible notes                                                                    (97,277)               (73,646)
   Non-cash impairments                                                               17,020                    5,137         Proceeds from issuance of warrants, net of issuance costs                             72,406                 45,396
   Deferred income taxes                                                             (23,272)                 60,176          Capital repayment                                                                          −               (243,945)
   Other items, net including fair value changes in                                                                            Principal payments on capital leases                                                 (1,308)                 (1,402)
   derivatives                                                                        64,091                  52,480
                                                                                                                               Proceeds from issuance of common shares                                               4,412                   6,075
   Change in operating assets                                                       (118,985)                (77,829)
                                                                                                                               Purchase of treasury shares                                                       (104,685)                (60,970)
   Change in operating liabilities                                                    23,826                 (10,027)
                                                                                                                               Other financing activities                                                           (8,019)                 (8,587)
Net cash provided by operating activities                                            359,496                 286,779
                                                                                                                             Net cash provided by financing activities                                            360,408                 387,187
Cash flows from investing activities:                                                                                        Effect of exchange rate changes on cash and cash
  Purchases of property, plant and equipment                                        (109,773)                (90,081)        equivalents                                                                            (7,183)                  8,832
  Proceeds from sale of equipment                                                          −                      42
                                                                                                                             Net increase in cash and cash equivalents                                            501,365                 218,534
  Purchases of intangible assets                                                     (40,990)                (34,324)
  Purchases of investments                                                            (9,398)                 (4,777)        Cash and cash equivalents, beginning of period                                       657,714                 439,180
  Cash paid for acquisitions, net of cash acquired                                  (172,832)                (50,549)
                                                                                                                             Cash and cash equivalents, end of period                                           1,159,079                 657,714
  Purchases of short-term investments                                               (568,002)               (450,564)
  Proceeds from redemptions of short-term investments                                691,765                 189,006         Reconciliation of Free Cash Flow(1)
  Cash paid for collateral asset                                                       (3,461)               (20,707)        Net cash provided by operating activities                                            359,496                 286,779
  Other investing activities                                                            1,335                  (2,310)       Purchases of property, plant and equipment                                          (109,773)                (90,081)

Net cash used in investing activities                                               (211,356)               (464,264)        Free Cash Flow                                                                       249,723                 196,698

                    (1)   Free cash flow is a non-GAAP financial measure and is calculated from cash provided by operations reduced by purchases of property, plant and equipment. QIAGEN believes this is a common financial measure useful to
                          further evaluate the results of operations.
Sample to Insight
                    Investor presentation Q1 2019                                                                                                                                                                                                 34
Agenda

                                                    Introducing QIAGEN

                                                    Portfolio review

                                                    Full-year 2018 results

                                                    Q4 2018 results

                                                    Appendix

Sample to Insight
                    Investor presentation Q1 2019                            35
Q4 and FY 2018: Overview

  1     Achieved 2018 target for net sales, exceeded on adjusted EPS                                                              Q4 and FY net sales                                       Q4 and FY adjusted EPS(1)
          +6% net sales growth (+6% CER vs. ~+6-7% CER outlook)                                                                 (In $ millions, at actual rates)                           (In $ per share)
          $1.34 adjusted EPS ($1.35 CER vs. ~$1.33-1.34 CER outlook)
          27% adjusted operating income margin up one percentage point vs. 2017                                                                                    +6% CER

          Operating cash flow rises 25% to $359.5 million in 2018
                                                                                                                                                                  1,417.5 1,501.8
                                                                                                                                                                                                                  1.27   1.34

  2 Delivering growth from unique, focused Sample to Insight portfolio                                                                   +5% CER
          QuantiFERON-TB: 21% growth, full automation launched (DiaSorin, front end)
                                                                                                                                                                                                0.43       0.40
          NGS: Exceeded 2018 goal of $140 m, 2019 goal ~$190 m                                                                       396.9      403.2

          QIAsymphony: Exceeded 2018 goal of 2,300 instruments, 2019 target of >2,500
                                                                                                                                        Q4        Q4                FY     FY                   Q4         Q4      FY     FY
          QIAstat-Dx: Very promising start in Europe, U.S. entry planned for 2019                                                   Fourth Quarter
                                                                                                                                      2017 2018
                                                                                                                                                                    Full Year
                                                                                                                                                                   2017 2018                  Fourth
                                                                                                                                                                                               2017 Quarter
                                                                                                                                                                                                     2018         2017   2018
          NeuMoDx: First placements in Europe with very positive feedback
          Digital PCR: Preparing for 2020 launch of new integrated systems                                                         Outlook – As of February 4, 2019
                                                                                                                                                                                              Q1 2019              FY 2019

  3                                                                                                                                 Net sales growth (CER)                                     ~ +5-6%             ~ +7-8%
        2019 outlook: Faster sales growth, increasing adjusted EPS
                                                                                                                                     Anticipated currency impact(2)                            ~ −4 p.p.           ~ −1 p.p.
          ~+7-8% CER outlook for 2019 full-year net sales growth
          ~$1.45-1.47 CER outlook for 2019 full-year adjusted EPS                                                                  Adj. diluted EPS (CER)                                   ~$0.26-0.27          ~$1.45-1.47

              Includes $0.03 CER dilution for digital PCR investments                                                               Anticipated currency impact(2)                            ~ −$0.01            ~ −$0.01

                    Refer to accompanying tables for reconciliation of reported to adjusted figures.
                    (1) Weighted number of diluted shares (Q4 2018: 232.4 million, Q4 2017: 231.8 million; FY 2018: 233.5 million, FY 2017: 233.0 million).
                    (2) Based on currency rates as of January 31, 2019.
                    CER – Constant exchange rates        p.p. – percentage points         PCR – Polymerase chain reaction      NGS – Next-generation sequencing      UNGS – Universal NGS
Sample to Insight
                    Investor presentation Q1 2019                                                                                                                                                                               36
Q4 and FY 2018: Product type and customer class

                                                                                  Q4 2018 net sales: $403.2 million                                                          FY 2018 net sales: $1,501.8 million
                                                                     Sales                   %                    % CER                   %                     Sales                  %                   % CER                    %
                                                                    (In $ m)               change                 change               of sales                (In $ m)              change                change                of sales
Consumables and related revenues                                      $344                   +1%                   +4%                   85%                     $1,315                +6%                     +6%                 88%

Instruments                                                            $59                   +3%                   +5%                   15%                       $186                +7%                     +6%                 12%

  Molecular Diagnostics(1)                                            $194                   +1%                   +5%                   48%                       $732                +7%                     +8%                 49%

  Applied Testing                                                      $39                   -1%                   +1%                   10%                       $137                  0%                     0%                   9%

  Pharma                                                               $74                   +3%                   +5%                   18%                       $291                +6%                     +5%                 19%

  Academia                                                             $95                   +4%                   +6%                   24%                       $342                +6%                     +5%                 23%

  Molecular Diagnostics                                         Applied Testing                                                Pharma                                                        Academia
  Q4 2018: High-single-digit CER growth                         Q4 2018: Results include adverse                               Q4 2018: Double-digit CER growth in                            Q4 2018: Solid expansion in
  excluding U.S. HPV test sales, led by                         impact of veterinary testing assays                            instruments, but single-digit CER                              instrument sales at double-digit CER
  QuantiFERON-TB at 21% CER growth,                             divestment in April 2018 and changes                           growth in consumables below recent                             pace, and mid-single-digit CER gains
  but instrument sales hampered by drop                         to a third-party R&D project,                                  quarterly trends                                               in consumables
  in instrument services revenues                               overshadow underlying mid-single-digit
                                                                CER growth

         FY 2018: Gains in Molecular Diagnostics, Pharma and Academia customer classes drive 6% CER growth
                    (1) CDx co-development sales (Q4 2018: $19 million, +4%, +8% CER; FY 2018: $58 million, +36%, +34% CER); U.S. HPV sales (Q4 2018: $4 million vs. Q4 2017: $8 million; FY 2018: $19 million vs. FY 2017: $28 million).
                    Sales figures and sales contributions at actual FX rates Tables may contain rounding differences   CDx – Companion diagnostics
Sample to Insight
                    Investor presentation Q1 2019                                                                                                                                                                                           37
Q4 and FY 2018: Geographic regions

                                                                                 Q4 2018 net sales: $403.2 million                                                       FY 2018 net sales: $1,501.8 million
                                                                    Sales                 %                   % CER                    %                     Sales                     %       % CER              %
                                                                   (In $ m)             change                change                of sales                (In $ m)                 change    change          of sales
Americas                                                           $169                    -4%                   -4%                  42%                       $693                 +6%        +6%             46%

Europe / Middle East / Africa                                      $143                   +7%                 +13%                    35%                       $490                 +6%        +6%             33%

Asia-Pacific / Japan                                                 $91                  +5%                   +8%                   23%                       $315                 +6%        +5%             21%

Americas                                                                       Europe / Middle East / Africa                                                       Asia-Pacific / Japan
Q4 2018: Improving CER growth trends in Latin                                  Q4 2018: Improving growth trends in key West European                               Q4 2018 : High-single-digit CER growth led by China
American region and Canada; strong underlying U.S.                             countries and Middle East. Significant CER growth in                                and Japan; improving CER trends in South Korea after
trends reduced by decline in instrument service                                France, Italy, Belgium and Turkey but weakness in                                   2017 QuantiFERON-TB tender benefits
revenues and volatility in CDx revenues                                        Germany

         FY 2018: EMEA region (+13% CER) and top 7 emerging markets (+14% CER) lead geographic performance
                    Top 7 EGM (Q4 2018: +3% / +14% CER / 18% of sales; FY 2018: +5% / +11% CER / 16% of sales); Rest of the world (Q4 2018 and FY 2018: Less than 1% of net sales)
                    Sales figures and sales contributions at actual FX rates Tables may contain rounding differences    CDx – Companion Diagnostics
Sample to Insight
                    Investor presentation Q1 2019                                                                                                                                                                         38
Q4 and FY 2018: Balance sheet and cash flow

Balance sheet data
(As of December 31 )                                            2018               2017                 Leverage ratio(1)
Group liquidity (In $ millions)                                1,394               1,017

Net debt (In $ millions)                                        781                 743
                                                                                                                            3.3
Shareholder equity ratio                                        46%                50%

Leverage ratio(1)                                               1.4x                1.5x
                                                                                                                                           2.2
                                                                                                                                                                                                 1.6           1.5
                                                                                                                                                                                          1.3                         1.4
                                                                                                                                                                                   1.1                  1.2
Cash flow                                                                                                                                                            0.9    0.9
(In $ millions)                                              FY 2018            FY 2017                                                            0.4
Net cash provided by                                                                                                  0.2
                                                               359.5               286.8                                                                  -0.1
operating activities(2)
Purchases of property,
                                                              -109.8               -90.1                       2006                  2008                     2010          2012          2014          2016          2018
plant and equipment

Free cash flow(2)(3)                                           249.7               196.7
                                                                                                                          2007                   2009                2011          2013          2015          2017

         FY 2018: Operating cash flow rises 25% to $359.5 million and free cash flow rises 27% to $249.7 million
                    (1)   Leverage ratio is calculated on trailing four quarters as net debt / adjusted EBITDA.
                    (2)   Net cash provided by operating activities for FY 2018 included $30 million payment for pre-paid royalties for Natera partnership.
                    (3)   Quarterly free cash flow (Q4 2018: $73.1 million vs. Q4 2017: $50.6 million)
Sample to Insight
                    Investor presentation Q1 2019                                                                                                                                                                            39
Q4 and FY 2018: Reconciliation adjusted results

            In $ millions (Except EPS)                                        Net      Gross          Operating     Pretax    Income      Tax       Net     Diluted
            (unaudited)                                                      sales     profit          income      income       tax       rate    income     EPS
            Fourth quarter 2018
            Reported results                                                  403.2       264.8             88.3       68.4       -7.5      11%      60.9       0.26
            Adjustments
             Business integration, acquisition and restructuring-related
                                                                                            3.4              8.6        8.6       -2.4                6.3       0.03
             items (including litigation)
             Purchased intangibles amortization                                            13.1             22.5       22.5       -5.8               16.7       0.07
             Non-cash interest expense charges                                                                         10.7                          10.7       0.04
             Other special income and expense                                                     4

                                                                                                                        4.1        -5.0              -0.9       0.00
            Total adjustments                                                              16.5             31.1       46.0      -13.2               32.8       0.14
            Adjusted results                                                  403.2       281.3            119.4      114.4       -20.7     18%      93.7       0.40

            Full-year 2018
            Reported results                                                 1,501.8    1,001.0            266.6      225.7      -35.4      16%     190.4       0.82
            Adjustments
               Business integration, acquisition and restructuring-related       0.1        4.3             41.0       41.0      -11.0               29.9       0.13
               items (including litigation)
               Purchased intangibles amortization                                          56.7             95.8       95.8      -24.8               71.0       0.30
               Non-cash interest expense charges                                                                       35.6                          35.6       0.15
               Other special income and expense                                                                       -12.6       -2.4              -15.0      -0.06
            Total adjustments                                                    0.1       61.0            136.7      159.8      -38.2              121.5       0.52
            Adjusted results                                                 1,501.9    1,062.0            403.3      385.5      -73.6      19%     311.9       1.34

                    Table may have rounding differences.
Sample to Insight
                    Investor presentation Q1 2019                                                                                                                      40
Q4 and FY 2018: Currency impact

                                                                                             Net sales                     Net sales       Currency exposure       Change
                                                                                           (In $ millions)                    (CER)        (As % of CER sales)   (In $ millions)

            Fourth quarter 2018
            U.S. dollar                                                                         141.6                         141.6               34%                 0.0
            Euro                                                                                106.8                         109.6               26%                 2.8
            British pound                                                                        33.4                          33.8               8%                  0.4
            Japanese yen                                                                         15.7                          15.7               4%                  0.0
            Other currencies                                                                    105.7                         114.3               28%                 8.6
            Total net sales                                                                     403.2                         415.0              100%                 11.8

            Full-year 2018
            U.S. dollar                                                                         588.6                         588.6               39%                 0.0
            Euro                                                                                365.0                         353.4               23%                -11.6
            British pound                                                                       117.1                         115.1               8%                  -2.0
            Japanese yen                                                                         54.9                          54.0               4%                  -0.9
            Other currencies                                                                    376.3                         389.5               26%                 13.2
            Total net sales                                                                    1,501.8                       1,500.5             100%                 -1.3

                    CER - Constant exchange rates
                    Other currencies include CAD, DKK, TRY, SEK, CHF, AUD, BRL, CNY, MYR, SGD, KRW, HKD, MXN, INR, TWD, RUB, THB and ZAR
Sample to Insight
                    Investor presentation Q1 2019                                                                                                                                  41
Q1 and FY 2019: Outlook and assumptions

As of February 4, 2019                                                                                                           Q1 2019 outlook                                                                   FY 2019 outlook
                                                                                                                                                ~+5-6% CER                                                                            ~+7-8% CER
Adjusted net sales
                                                                                                                                       (Prior year: $343.6 m)                                                              (Prior year: $1,501.8 m)
                                                                                                                                             ~$0.26-0.27 CER                                                                        ~$1.45-1.47 CER
Adjusted EPS(1)                                                                                                                             (Prior year: $0.26)                                                                    (Prior year: $1.34)

Adjustments to operating income (in $ millions):

    Amortization of acquired intellectual property                                                                                                         ~$27 m                                                                               ~$105 m

    Restructuring-related items                                                                                                                             ~$2 m                                                                                  ~$7 m

    Business integration and acquisition-related items                                                                                                      ~$7 m                                                                                 ~$26 m

Adjusted tax rate (In %)                                                                                                                                 ~21-22%                                                                               ~21-22%

Weighted average number of diluted shares outstanding
                                                                                                                                                     ~234 million                                                                          ~233 million
(Based on $38.00 share price for Q1 2019)

CER – Constant exchange rates
(1) QIAGEN reports adjusted results, as well as results on a constant exchange rate (CER) basis, and other non-U.S. GAAP figures to provide additional insight into its performance. These results include adjusted gross profit, adjusted operating income,
    adjusted net income attributable to owners of QIAGEN N.V. and adjusted diluted EPS. Adjusted results are non-GAAP financial measures that QIAGEN believes should be considered in addition to reported results prepared in accordance with GAAP,
    but should not be considered as a substitute. QIAGEN believes certain items should be excluded from adjusted results when they are outside of ongoing core operations, vary significantly from period to period, or affect the comparability of results with
    competitors and its own prior periods. Furthermore, QIAGEN uses non-GAAP and constant currency financial measures internally in planning, forecasting and reporting, as well as to measure and compensate employees. QIAGEN also uses adjusted
    results when comparing current performance to historical operating results, which have consistently been presented on an adjusted basis.
Every $1.00 change in market price per share of common stock above / below $38 share price results in an increase / decrease of ~600,000 in dilutive shares due to call-spread overlay (CSO) related to 2019 and 2021 convertible notes. For the 2023
convertible notes every $1.00 change above $50.97 share price results in increase of ~200,000 in dilutive shares and for the 2024 convertible notes every $1.00 change above $52.16 share price results in an increase of ~200,000 in dilutive shares.

Sample to Insight
                       Investor presentation Q1 2019                                                                                                                                                                                                         42
Agenda

                                                    Introducing QIAGEN

                                                    Portfolio review

                                                    Full-year 2018 results

                                                    Q4 2018 results

                                                    Appendix

Sample to Insight
                    Investor presentation Q1 2019                            43
Global reach into the most attractive geographic markets

                                                                              Aarhus
                                                                 Manchester
                                                                                       Hilden
                                                                               Venlo

                                                       Waltham
                    Redwood City                    Germantown

                                                                                                                       Shanghai

                                                                                                                  Shenzhen

                                                                                                Hilden, Germany
                                                                                                     Europe

                           Germantown, Maryland
                                Americas                                                                                 Shanghai
                                                                                                                        Asia-Pacific

Sample to Insight
                    Investor presentation Q1 2019                                                                                      44
Executive Committee

                                                          CEO                                                     Commercial Operations

                                                          Peer Schatz                                             Manuel O. Méndez
                Executive Committee

                                                          Molecular Diagnostics                                   CFO

                                                          Thierry Bernard                                         Roland Sackers

                                                         Life Science                                             Bioinformatics

                                                         Thomas Schweins                                           Jonathan Sheldon

                                                          Human Resources                                          Global Operations

                                                          Annette Koch                                             Barthold Piening
            Development(1)

                                                          Business Development
              Business

                                                          Jean-Pascal Viola

         Solid leadership team with experience and an effective structure
                                      1) Business Development is a strategic function reporting directly to CEO, but not included in EC.
Sample to Insight
                                      Investor presentation Q1 2019                                                                        45
Employees as of December 31, 2018

                                                                                                    Europe /                            Asia Pacific /                     Total                   Total
                                                                  Americas                                                                                                                                  Change
                                                                                               Middle East / Africa                     Japan / ROW                       Q4 2018                 Q4 2017
          Production                                                  277                                  656                                 134                          1,067                   1,020    5%

          R&D                                                         231                                  775                                  50                          1,056                    985     7%

          Sales                                                       559                                  762                                 669                          1,990                   1,883    6%

          Marketing                                                    77                                  155                                  76                            308                    278     11%

          Administration                                               86                                  322                                 123                            531                    491     8%

          Total                                                      1,230                               2,670                                1,052                         4,952                   4,657    6%

                    Headcount information is made using certain assumptions regarding role and function. During 2018, these assumptions were updated and their classifications were changed accordingly.
Sample to Insight
                    Investor presentation Q1 2019                                                                                                                                                                    46
Your contacts

                                                                                                                              Download the QIAGEN IR App

        John Gilardi                                   Dr. Sarah Fakih                  Alexandra Koenig
        Vice President                                 Director                         Coordinator
        Corporate Communications and IR                Investor Relations               Investor Relations
        Phone: +49 2103 29 11711                       Phone: +49 2103 29 11457         Phone: +49 2103 29 11709
                +1 240 686 2222                        Mobile: +49 152 018 11457        Mobile: +49 152 018 11709
        Mobile: +49 152 018 11711
        E-mail: john.gilardi@qiagen.com                E-mail: sarah.fakih@qiagen.com   E-mail: alexandra.koenig@qiagen.com

        E-mail: ir@qiagen.com                         www.linkedin.com/company/qiagen       twitter.com/QIAGEN
        Internet: ir.qiagen.com                       www.facebook.com/QIAGEN               www.youtube.com/user/QIAGENvideos

       Share information                                                                     Calendar
       NYSE:                    QGEN                                                         Q1 2019 results              May 2019

       Frankfurt:               QIA                                                          Annual General Meeting       June 2019

       ISIN / CUSIP:            NL0012169213 / N72482 123                                    Q2 2019 results              July 2019

       WKN:                     A2D KCH                                                      Q3 2019 results              November 2019

Sample to Insight
                    Investor presentation Q1 2019                                                                                                          47
You can also read