Delivering Results - Auckland ...
←
→
Page content transcription
If your browser does not render page correctly, please read the page content below
2016 Investor Presentation

Delivering
     Results
  Investor presentation 2016
2016 Investor Presentation

Adrian Littlewood
Chief Executive
Philip Neutze
Chief Financial Officer
2016 Investor Presentation

Investment
Story
2016 Investor Presentation

   International Gateway to New Zealand

• New Zealand is an island nation and arrival by
  road and rail is impossible. Sea transport is
  unattractive for most overseas travellers
• Auckland Airport is the only commercial airport in
  New Zealand’s largest city
• Approximately 2 million people (40% of NZ’s
  population) live within a two hour drive of Auckland
                                                              * 2012 Population Estimate
  Airport. 75% of international visitors arrive or            Per Statistics New Zealand.
                                                              Catchment data per
  depart from Auckland Airport, and 94% of long               Property Economics (2012)

  haul arrivals (excluding Australia)
                                                                                            Holiday/Vacation
• No curfew, operating 24 hours a day                                                       24.0%

                                                                                            Visit friends/relatives
• Auckland is New Zealand’s centre for commercial,                                          16.8%
  industrial, residential and migration growth
                                                                                            Business/Conference
• High barriers to competitive entry of another                                             12.9%

  airport in Auckland                                                                       Education/Medical
                                                                                            2.3%
• New Zealand’s largest listed company providing
                                                                                            Other (incl. not
  ideal platform for exposure to buoyant local                                              stated/not captured)
  economy and very strong tourism sector                 Annual Report – 30 June 2015
                                                                                            44.0%
                                                                                                                      4
2016 Investor Presentation

     Aeronautical assets

• Single 3,535m runway and associated taxiways and
  aprons can accommodate all current aircraft types,
  including A380 and Boeing 787 Dreamliner

• Main taxiway can function as a standby runway in
  emergencies

• Existing and planned northern runway 2,150m (parallel
  to main runway) will meet Auckland’s aviation
  requirements for the foreseeable future

• International Terminal Building with 14 airbridge stands
  (3 A380 capable) and 10 remote stands

• Domestic Terminal Buildings with 8 airbridge stands
  and 19 remote stands

                                                             5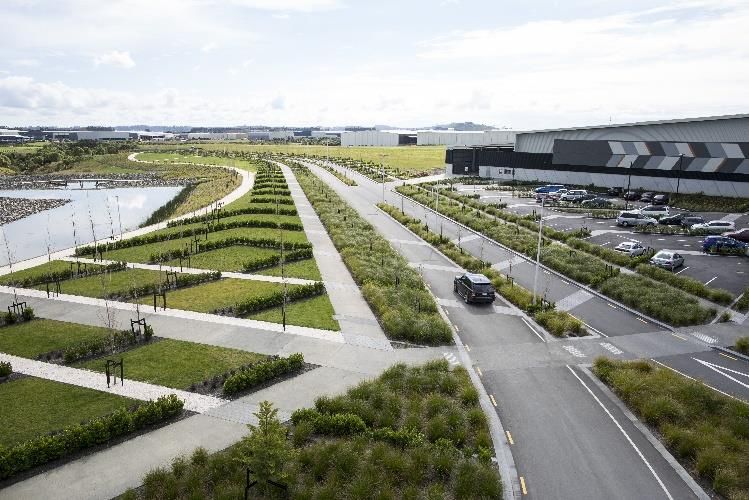
2016 Investor Presentation

                        New Zealand’s busiest airport and our
                        international gateway

    • Auckland Airport is the largest and busiest airport in New Zealand in terms of
      passenger movements and revenue

    • International passengers represented 51% of total passenger movements in the year to
      30 June 2015, the highest proportion of all Australasian airports

    • Third highest number of international passengers in Australasia (behind Sydney and
      Melbourne)
                              Total passengers – New Zealand airports                                        Comparison of international vs. domestic passengers
                     18,000
                     16,000                                                                      Brisbane         5,078                               16,957
Passengers (000's)

                     14,000                                                                   Christchurch         1,447                              4,479
                     12,000
                     10,000                                                                    Melbourne           8,373                              23,820
                      8,000                                                                         Perth           4,194                               9,790
                      6,000
                      4,000                                                                       Sydney             13,327                              25,555
                      2,000                                                                      Auckland                    8,124                              7,199
                         -
                                Auckland      Christchurch     Wellington        Queenstown                  0%            20%         40%            60%          80%   100%

                                 Domestic       International (Excl. Transits)                                       International (Excl. Transits)     Domestic

                      Source: Passenger information is from each airport’s monthly traffic update (via their individual websites) or from
                      ACI Statistics for the 12 month period ending 30 June 2015

                                                                                                                                                                                6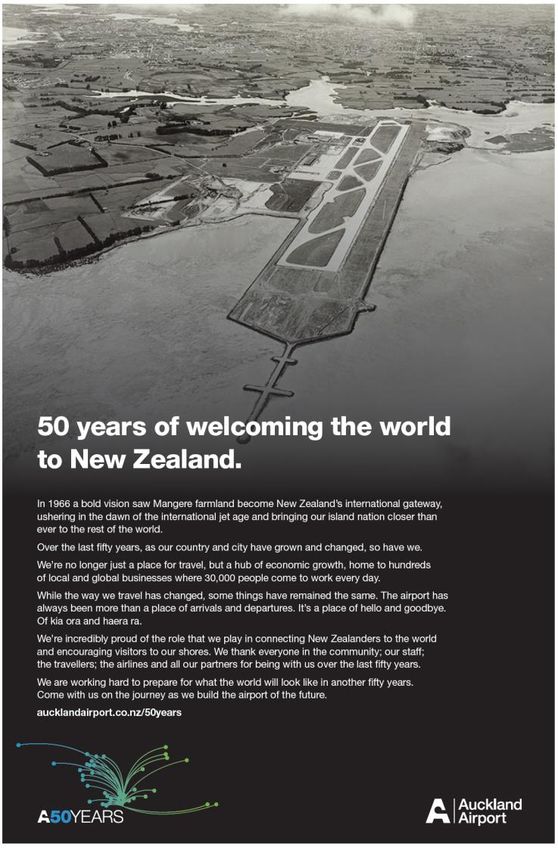
2016 Investor Presentation

                     Proven passenger growth resilience

                         • Highly resilient to global economic weakness and other external shocks

                                                         Total Passengers at Auckland Airport (excl. Transits)
                    18,000,000

                    16,000,000

                                                                                                                  Sub Prime
                    14,000,000                                                                                    Crisis and          Christchurch
                                                                                                                   Global             Earthquake
                                                                                                                  Recession
                    12,000,000                                                          Avian Flu
                                                                       SARS             Outbreak
Annual passengers

                                                                      Outbreak
                    10,000,000                     Sept 11
                                                   Terrorist
                                                   Attacks
                     8,000,000

                     6,000,000

                     4,000,000

                     2,000,000

                            0
                                  FY00     FY01        FY02    FY03     FY04     FY05     FY06      FY07   FY08     FY09       FY10      FY11        FY12   FY13   FY14   FY15
                                                                                         Financial Year Ended 30 June
                                                                                                                                                                                 7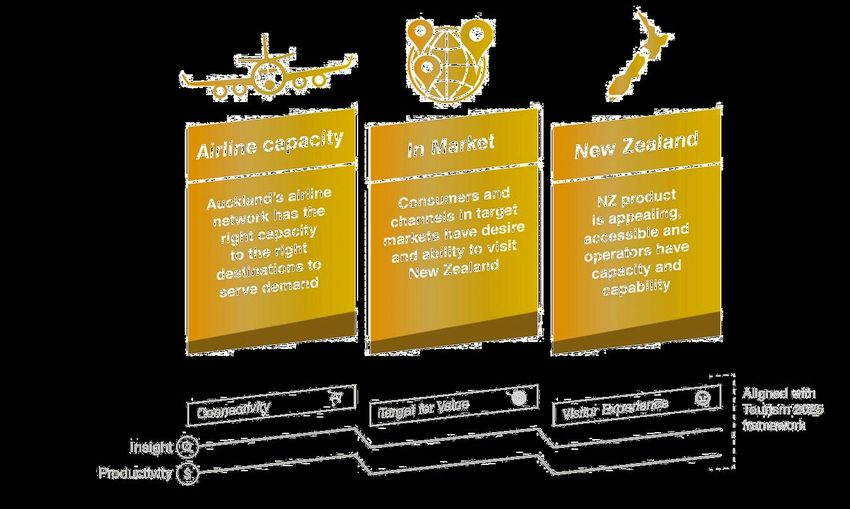
2016 Investor Presentation

       Significant Land Holdings

                                                                                                          Auckland Airport boundary

                                                                                                             Central Park, New York

• Auckland Airport owns approximately 1,500 hectares of freehold land (~300 hectares available for IP development)
• Land value NZ$3.2 billion as at 30 June 2015
• Vacant land enables staged and affordable expansion of aeronautical infrastructure as required and ongoing rental income
  growth
                                                                                                                                      8
2016 Investor Presentation

        Retail

• The retail business operates through concessions;
  the two duty free being the largest
                                                          Retail Spend Rates By Nationality
• 110 stores across the domestic and international
  terminals with a growing and affluent footfall
• Retail concessions represented $132m of income
  in FY15. This was 26% of total revenue and 54%
  of non-aeronautical revenue. Retail revenue
  carries higher margins than other parts of the
  business
• Core categories include Duty Free, Destination,
  FX, Food & Beverage, Specialty
• High growth Asian travellers also the highest
  spenders
• Chinese passengers (NZ resident + non-resident)
  represent 7% of all traffic, yet 14% of international
  terminal retail spend
• Non-resident Chinese spend rate is +166% above
  the overall average                                                                         9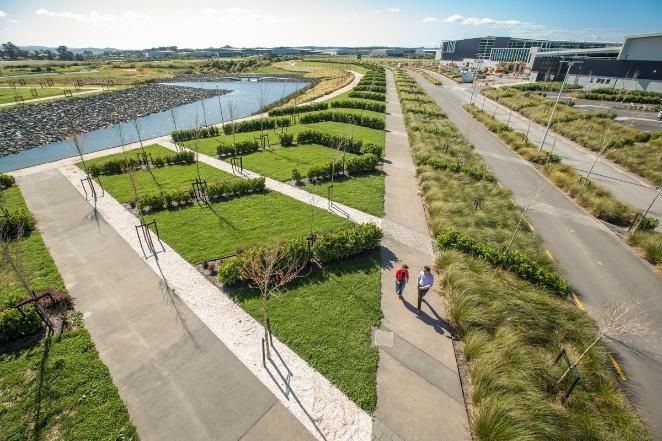
2016 Investor Presentation

        Car parking business
• Dynamic, direct to consumer, online sales channel delivers high car park occupancy and
  yield optimisation
• As at December 2015, the Airport had 9,981 parking spaces
• In FY15 Auckland Airport moved some airline and other staff car parking from the
  domestic terminal to the Park & Ride facility, providing more car parks close to the
  terminal for the travelling public
    International              Domestic Terminal                             Park & Ride                                           Valet
      Terminal
 Proximate short-term          Multi-level car park with                Opened December 2008                    Domestic valet service opened in May 2014.
 and long term parking         direct connectivity into                                                           International valet service opened in
        options                        terminal                                                                              December 2014
 3,574 public parking                2,622 public bays                     1,100 parking bays                                 368 parking bays
        bays
Covered and uncovered          Covered and uncovered             Prominent location, 24/7 shuttle with             Ultra-convenient drive up solution for
       parking                        parking                transfers every 10 minutes, GPS, High Security                 premium customers
In addition there are 2,317 staff car parks across domestic and international terminals which can be leveraged for customer parking at peak times.

                                                                                                                                                             10
2016 Investor Presentation
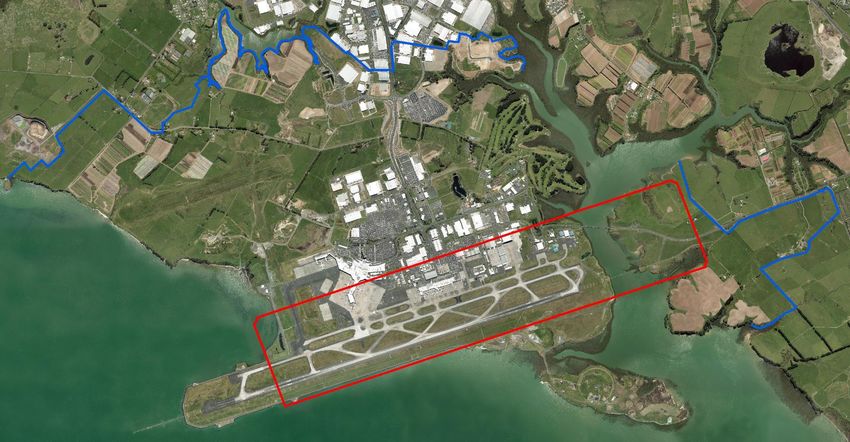
Property Business
• Auckland Airport holds $613.5m of investment property
(excl. undeveloped land) with a rent roll totaling $56.1m
as at 30 June 2015. It is one of the most active
developers in the industrial sector with ~300 hectares of
developable land yet to come to market
• Developments comprise all types of land use except
permanent residential and heavy industrial. The
Auckland Airport business district (“The District”) has
been divided into seven precincts reflecting logical
groupings of industry type and sector
• Leases are medium to long term and properties are
typically developed on a design/build/lease basis with
committed tenants. The weighted average lease term of
existing properties was 5.26 years as at 31 December
2015
• Vacancy in the portfolio is negligible (1% as at 31
December 2015)
112016 Investor Presentation
Hotels
• Auckland Airport has interests in two hotels with
advanced plans for a third and space reserved for
a fourth
• The hotels have outperformed ambitious
expectations and are integral to our consumer
growth strategy
• The Novotel Hotel was completed in May 2011 - a
263 room (4+ star) hotel
• It is a joint venture with Tainui Holdings and Accor
Hospitality with Auckland Airport holding a 20%
stake
• Auckland Airport also collects ground rental from
the Novotel site
• The second hotel (Ibis - 3 star) was completed in
August 2011 and expanded in December 2014
with an additional 73 (50%) rooms
122016 Investor Presentation
Associates
Queenstown Airport – New Zealand (24.99% ownership)
• Queenstown Airport is the gateway airport to New Zealand’s adventure capital, a major
tourist destination and the fourth largest international airport in New Zealand.
• Queenstown Airport has a runway length of 1,911m (2,090 yards)
• In the year ended 30 June 2015, Queenstown airport handled 1,000,713 domestic and
397,927 international passengers with growth of 6.4% and 29.0% on the previous year
respectively
• It is the fastest growing airport in New Zealand with international passenger numbers
more than tripling since Auckland Airport took its stake
132016 Investor Presentation
Associates
North Queensland Airports – Cairns and Mckay, Australia (24.55% ownership)
• Cairns Airport is the gateway airport to Tropical North Queensland, a major Australian
leisure destination. Two world heritage listed attractions, the Great Barrier Reef and Wet
Tropics Rainforests are accessed from Cairns
• The airport has direct flights to all Australian capital cities with the exception of Hobart and
a high number of other regional destinations are also serviced from Cairns. The airport is
also Australia’s seventh busiest airport for international passengers
• The airport is subject to a 99 year lease from the State of Queensland (92 remaining)
• In the year ended 31 December 2015, North Queensland Airport handled 4,090,375
domestic and 646,901 international passengers (excluding transits)
142016 Investor Presentation
Current Position
Market Capitalisation Register composition as at 31 December 2015
$7,502m * International
Retail
Council
Domestic
Institutional
Cost of Total
Returns to Share Price Share Price Capital Cancelled Total Shareholder
Opening Closing Dividend Return Shares Return Return
Shareholders $ $ cps cps cps $ %
1 July 2010 to 30 June 2011 1.870 2.230 8.700 - - 0.447 23.9
1 July 2011 to 30 June 2012 2.230 2.440 10.500 - - 0.315 14.1
1 July 2012 to 30 June 2013 2.440 2.970 12.000 - - 0.650 26.6
1 July 2013 to 30 July 2014 2.970 3.900 7.000 34.300 (34.300) 1.000 33.7
1 July 2014 to 30 July 2015 3.900 4.940 14.600 - - 1.186 30.4
* Market capitalization using share price as of 2 March 2016
152016 Investor Presentation
Regulatory Environment
• Dual-till regime, with the aeronautical segment (1st till) subject to information disclosure
regulation under the Commerce Act 1986
• Disclosure regime includes monitoring of service standards, asset availability, capital
expenditure plans, efficiency of pricing and return on investment
• Commerce Commission monitors information disclosure regime effectiveness
• Commission aiming to publish its draft input methodology amendments in June 2016 in
relation to the regulatory disclosure regime
• Key issues under discussion include WACC percentile, a new forward-looking profitability
measure, a new backward-looking profitability measure reflecting airports’ bespoke pricing
approaches (e.g. our moratorium on regulatory asset revaluations for pricing) and treatment
of future use assets (e.g. our northern runway land holding)
• Auckland Airport’s FY18-22 aeronautical price path consultation with major airlines and
representatives is to begin in early FY17, with final pricing decision expected in May 2017
162016 Investor Presentation Strategy for our future
2016 Investor Presentation

Faster, Higher, Stronger

  Adopt an ambitious and           Strengthen and extend our     Continue to improve our       Build on our strong
innovative approach to help            retail, transport and    performance by increasing   foundations for long-term
New Zealand to sustainably        accommodation businesses        the productivity of our      sustainable growth
     unlock the growth            to ensure we can respond to     assets, processes and
      opportunities in              evolving customer needs             operations
  travel, trade and tourism

                                                                                                                        18
2016 Investor Presentation
Delivering on our ambitions
In 2013 we established several ambitious targets under out Faster, Higher,
Stronger growth strategy
(On track) 340,646 in the 12 months to
31 January 2016
9 million in the 12 months to
(On track)
31 January 2016
(On track) 56.1 million as at
30 June 2015
Aspirational 16.5 million in the 12 months to
(but achievable) 31 January 2016
192016 Investor Presentation
Positioned in high growth Asia-Pacific
• Unique approach to driving airline
capacity.
• Very rarely discounts landing
charges, instead preferring
cooperative marketing campaigns
to drive sustainable traffic on new
routes
• Airport aims to become the
southern hub for air travel in
Australasia and the Pacific Rim,
assisted by its location in the high
growth Asia-Pacific region and
capacity to expand infrastructure in
a staged and efficient manner
Source: The Emerging Middle Class in Developing Countries, Homi Kharas, January 2010
202016 Investor Presentation
Grow Travel Markets
• NZ has an opportunity to capture a larger share of
the fast growing Asia-Pacific aviation market
• Aligning industry on opportunities is a key part of
our “Ambition 2025: High Opportunity Target”
Refer: www.ambition2025.co.nz
• We are working with Tourism Industry Association,
Government and other industry stakeholders to
reset New Zealand’s tourism ambitions and guide
how the country can grow tourism faster
• Launched initiatives to focus on Asian growth
markets such as China and Indonesia:
Hosted industry “Asia Summit” in May 2015
Continued to invest in the New Zealand tourism
industry contributing to the development of a
strategic tourism framework targeting 6% annual
growth for the tourism sector
212016 Investor Presentation
Strong growth potential
At 3m visitor arrivals
to Aug 2015 we are at
the top of the
“Ambitious” target2016 Investor Presentation
Strategic Framework
Grow travel markets by working with partners across the whole value chain
232016 Investor Presentation
Network analysis exposes underserved
demand
China is Canada is
Germany is
underserved underserved
underserved
UK is
underserved USA is
Japan is
underserved
underserved
India is
Australia is Brazil is
underserved
underserved underserved
Singapore is Chile is
underserved underserved
Source: Auckland Airport network model as at March 2016 242016 Investor Presentation
Unprecedented access to the world
• Strong period of expansion in air services with six new airlines having
commenced or announced services to Auckland in the twelve months
to December 2015
• New capacity has further strengthened national hub status and is a
further step on path to southern Asia-Pacific hub aspiration
• Now have better route diversity to important emerging and developed
markets including:
Asia – direct access to all tier one Chinese cities with launch of Air
China to Beijing. Long haul services launched from Manila
(Philippine Airlines) in November 2015 and and Kuala Lumpur
(AirAsia X) from March 2016
Americas – Entry of American Airlines and United Airlines mid 2016
accessing their extensive US distribution networks. Air NZ
expansion into Buenos Aires and Houston in December 2015
Europe and the Middle East – new Dubai direct service from
Emirates from March 2016. Longest passenger route in world
• Domestic – Jetstar launched regional turbo-prop services in
December 2015 / February 2016
• New generation efficient fleet delivery (eg 787/A350) combined with
substantially lower fuel prices provides strong support to long haul
routes 252016 Investor Presentation
Strengthen our consumer business: Retail
• Proactive landlord optimizing store mix and
overall customer experience. Planning and
refinement over the last two years is
beginning to deliver results
• Continue to add new brands and stores that
meet objective of ‘best of NZ and world’
retail e.g. Kiehls, Jo Malone, Urban Decay,
Victoria Secret (first in NZ), Ruby
• Duty Free retailers have now completed
bedding in operations, immediate store
refurbishment and product mix changes
leading to growth in core category
performance e.g. cosmetics and skincare up
18% vs. PCP in the six months to 31
December 2015
262016 Investor Presentation
Strengthen our consumer business: Retail
• Market leading innovation continuing to drive
duty free footfall and sales e.g. ‘ACE’ (duty
free collections robot), Johnny Walker House
(one of six world-wide)
• Outstanding specialty PSR growth (+27% in
the 6 months to 31 December 2015) with
exciting new stores including Comvita, MAC,
Saben, Casio G-Shock
• Six retailers running full online click and
collect model - momentum building as we
learn alongside our retailers
• Joint marketing partnerships to stimulate
sales growth
• Significant increase in retail space underway
272016 Investor Presentation
Transport growth continues
• Car parking growth continues to be driven by broad
programme of improved customer choice, extra capacity
and promotions:
Product – Valet now well established at both
international and domestic. Valet exits up 70%. New
remote “Wait Zone” product introduced to offer
customers free 30mins carparking when waiting to pick
up passengers – also helps to minimize forecourt
congestion
Capacity – continue to add new capacity when demand
supports. Adding further 2,000 new spaces to remote
ParknRide over next two years and doubling Valet
spaces by May 2016
Utilisation – New real time guidance systems helping to
lift space utilisation during peak periods
Promotions – Continue to use online channels to
stimulate demand through targeted promotions. Online
channel sales up 23.5%
282016 Investor Presentation
Operational innovation delivering for
partners and passengers
• Driving high quality customer experience and
operational efficiency
• Based on pro-active collaboration, data sharing
and real-time information
• Collaborative decision making (CDM) with
Auckland Airport’s partners delivering efficiencies
• Innovation and new technology has enabled
ongoing lift in processing throughput. 38% more
passengers processed through international
emigration versus the same period in 2009
• Despite lift in international passenger volumes
2015 summer during peak months of ~9%,
average processing times actually decreased by
~5%
• Since the introduction of CDM in July 2015,
airfield apron congestion has decreased by 4%
292016 Investor Presentation
Customer experience innocation
Lifting customer experience delivers two-way value
• Ongoing investment in customer experience (roving agents,
concierges, customer information systems, pre-airport travel
info)
• Building customer relationships through all channels (Tripit,
Web, App, WiFi) and across lines of business (e.g. parking,
retail)
• Delivering tailored service and relevant offers to customers
• Skytrax award for best Airport in Australia/Pacific 7th year in a
row
Mobile key delivery mechanism for future
• Upgraded Auckland Airport app with integration of Tripit
• Starting integration of other airport service providers (e.g.
transport partners)
• Increasing our relevance beyond the airport’s boundaries
across entire customer travel journey
• Key interface for targeted offers and initiatives over longer term
302016 Investor Presentation
Be fast, efficient & effective: Financial
• We are monitoring cost drivers throughout the business to sustain world
class EBITDA margins (76% in the six months to 31 December 2015)
• We are carefully managing our capital programme to make the most of our
existing infrastructure and deliver in a staged and affordable manner
• Demonstrated commitment to capital efficiency as well as our A- credit
rating with $454 million capital return to shareholders in April 2014
Credit metrics
June 2012 June 2013 June 2014 June 2015
Debt/Enterprise value (%) 25.8 22.8 24.7 22.5
Funds from operations/interest cover ratio (x) 3.9 4.2 4.5 3.9
Funds from operations/debt (%) 17.9 18.4 15.8 16.7
Weighted average interest cost (%) 6.52 6.21 5.95 5.79
312016 Investor Presentation
Our future – 30-year vision launched
• Bold 30-year vision developed with international
experts (www.airportofthefuture.co.nz). Very
positive stakeholder feedback
• Vision is based on a combined domestic and
international terminal as well as an efficient,
affordable and staged development path.
• Work completed on the first two phases and well
underway on phases 3-5:
Phase 1: Additional baggage belts
Phase 2: Reconfigured inbound processing
Phase 3: Expanded outbound processing and
airside dwell areas
Phase 4: Pier B, bus lounge, remote and
contact stands
Phase 5: Domestic Terminal (first stage)
1 This is subject to the successful completion of concept design, detailed design and the final business case. 322016 Investor Presentation
In the flow of airport capacity development
• Following intensive period of detailed planning, strong
pipeline of infrastructure development projects adding
important capacity – was critical to supporting summer
peak demand and new airline services
• Planned approach has also allowed us to bring forward
aeronautical investment programme to support higher
than expected demand
• Demonstrated the ability to deliver additional capacity
under tight timeframes. Examples completed in the last
six months include:
Added a new bus lounge on Pier B of the international
terminal
Completed second of two additional baggage belts in
the international baggage hall
Completed an extra 17,500 square metres of airfield
space
Developed four new regional gates at the domestic
terminal
New departure lounge to support Jetstar’s new
regional services
332016 Investor Presentation
Future investment
• Phase 3 – International terminal expansion of core
processing, passenger dwell space and retail footprint space
will significantly improve passenger amenity. Estimated
project value $160-180m. Adds approximately 65% to
primary retail footprint. Delivered in three phases:
December 2016: Reconfigured landside farewell area
including the first half of the two anchor duty free shops
May 2017: Remaining half of the two anchor duty free
shops, and first half of the new passenger lounge and
retail hub focussing on premium stores
By early FY2018: Remaining half of the new passenger
lounge and retail hub providing additional specialty and
F&B
• Careful development planning to minimise disruption to retail
during international terminal expansion project
• Phase 4 – International pier expansion. New bus lounge
and remote stands commissioned in late calendar 2015 with
construction of two new contact stands / lounges
commencing shortly
• Phase 5 – Future integrated terminal and new domestic
processor targeting ~June 2021
342016 Investor Presentation
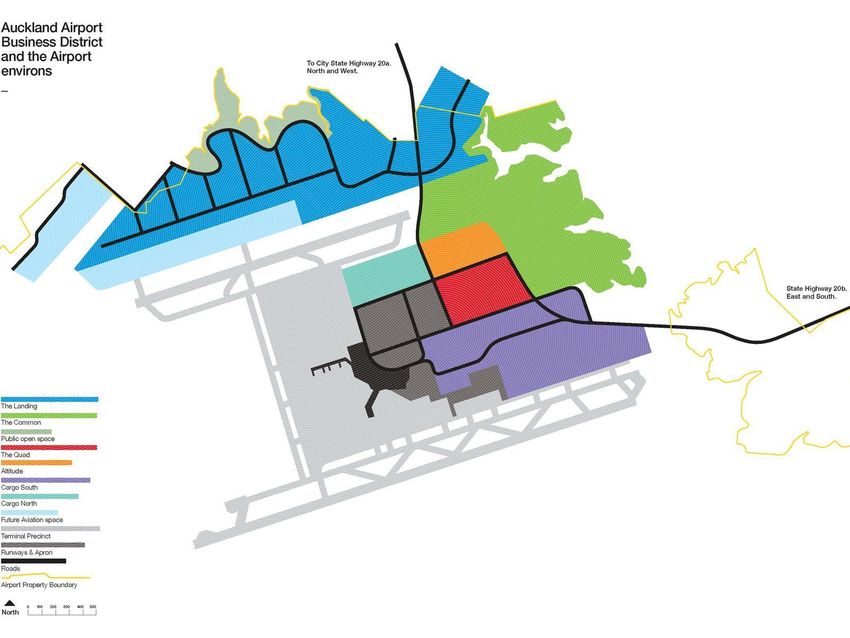
Investment property
• Transformation of non-aeronautical land continues
with Auckland Airport becoming an increasingly
desired location for core logistics tenants and new
industries
• Strong performance reflects the underlying
demand in Auckland for close, connected and high
quality sites. Continue to be optimistic on
development outlook based on tenant enquiry.
• Leasing programme supporting ongoing lift in
WALT to 5.26 as at 31 December 2015
• Successful speculative development programme
continues with construction of a $13m four unit
(flexi warehouse) on Timberley Road and Quad 7
office development (~9,000 sqm)
• Expanded development land with the completion of
stage 3A of the Landing (8 hectares) in H1 FY16.
Work commenced on Stage 3B to add a further 11
hectares
352016 Investor Presentation
The Business District
362016 Investor Presentation
Portfolio Snapshot
FY16 Revenue by Category FY16 Revenue by Precinct
Other, 3% The Common,
The Terminal, 4%
1%
Commercial, Altitude,
9% 6%
Retail, 8%
The Landing,
16%
Hotel, 4%
Cargo South,
Office, 7% Industrial, 52% 36%
The Quad,
12%
Ground Lease,
17%
Cargo North,
25%
WALT Occupancy
100%
5.5
98%
5
96%
4.5
94%
4
92%
3.5 90%
Jul-13
Jul-14
Jul-15
Jan-13
Jan-14
Jan-15
Sep-13
Nov-13
Sep-14
Nov-14
Sep-15
Mar-13
Mar-14
Mar-15
May-13
May-14
May-15
Jan-13
Jan-14
Jan-15
Jul-13
Jul-14
Jul-15
Sep-13
Nov-13
Sep-14
Nov-14
Sep-15
Mar-13
Mar-14
Mar-15
May-13
May-14
May-15
372016 Investor Presentation
Hotels
• Auckland Airport is helping the industry deliver
needed additional hotel rooms and our hotel
performance strengthens from year to year. ~2,000
room increase forecast for Auckland over the next 3
years
• Existing hotels performing strongly
Novotel has stabilised occupancy at 87% with
strong room rate growth
Ibis budget maintained occupancy at 89%, room
rate up 5.4% after 50% expansion in December
2014
• Coherent suite of hotel products
Preferred operator selected for third hotel.
Upgraded planned hotel to premium product with
~250 rooms. Leaves opportunity open for
additional mid-market hotel in the future
Design commenced
382016 Investor Presentation
Financial
Results
FY16 interim results
Philip Neutze, chief financial office2016 Investor Presentation
Ongoing growth in financial performance
Auckland International Airport Group 6 months to
(NZ$’m) 31 Dec 2015 30 Jun 2015 30 Jun 2014 30 June 2013 30 June 2012
Revenue 280.6 508.5 475.8 448.5 426.8
Expenses 67.1 128.5 120.6 117.6 107.5
Earnings before interest expense, taxation,
depreciation, fair value adjustments and 213.5 380.0 355.2 330.8 319.3
investments in associates (EBITDAFI)
Plant, property and equipment revaluation - (11.9) 4.1 - -
Investment property fair value increase/ (decrease) 16.0 57.2 42.0 23.1 1.4
Derivative fair value increase / (decrease) (0.7) (0.7) 0.6 1.5 (2.1)
Share of profit/(loss) of associates 4.1 12.5 11.6 9.9 9.2
Earnings before interest expense, taxation and
232.9 437.1 413.5 365.3 327.7
depreciation (EBITDA)
Depreciation 36.6 64.8 63.5 62.1 64.5
Interest expense and other financial costs 40.9 86.0 68.2 66.7 69.0
Taxation expense 39.6 62.8 65.9 58.6 52.0
Reported net profit after taxation 115.8 223.5 215.9 178.0 142.3
Underlying profit 1 104.1 176.4 169.9 153.8 139.0
Capital expenditure 112.1 147.6 121.5 93.5 83.1
1 A reconciliation showing the difference between reported net profit after tax and underlying profit (for the six moths 31 December 2015) after tax is included on the following slide.
402016 Investor Presentation
Underlying profit reconciliation
6 months to 31 Dec 2015 6 months to 31 Dec 2014
Reported Underlying Reported Underlying
Adjustments Adjustments
earnings earnings earnings earnings
$M $M
$M $M $M $M
EBITDAFI 213.5 - 213.5 189.0 - 189.0
Share of profit from associates 4.1 2.7 6.8 5.4 0.1 5.5
Derivative fair value increases (0.7) 0.7 - (1.6) 1.6 -
Investment property revaluation 16.0 (16.0) - 6.3 (6.3) -
Depreciation (36.6) - (36.6) (30.8) - (30.8)
Interest expense and other finance costs (40.9) - (40.9) (43.7) - (43.7)
Taxation expense (39.6) 0.9 (38.7) (31.8) (0.4) (32.2)
Profit after tax 115.8 (11.7) 104.1 92.8 (5.0) 87.8
• We have made the following adjustments to show underlying profit after tax for the 6-month periods ended 31 December 2015 and 31 December 2014: We have reversed out
the impact of revaluations of investment property in December 2015 and December 2014. An investor should monitor changes in investment property over time as a measure
of growing value. However, a change in one particular year can be too short for measuring performance. Changes between years can be volatile and will consequently
impact comparisons. Finally, the revaluation is unrealised and, therefore, is not considered when determining dividends in accordance with the dividend policy. The group
recognises gains or losses in the income statement arising from valuation movements in interest rate derivatives which are not hedge accounted or where the counterparty
credit risk on derivatives impact accounting hedging relationships. These gains or losses, like investment property, are unrealised interest rate derivative movements and are
expected to reverse out over the lives of the derivatives. To be consistent we have reversed the revaluations of investment property and financial derivatives that are
contained within the share of profit of associates in the periods to 31 December 2015 and 31 December 2014. We also reverse the taxation impacts of the above adjustments
in the periods to 31 December 2015 and 31 December 2014.
412016 Investor Presentation
Strong operating leverage
Half year financial results
6 months to 6 months to
Change
31 Dec 2015 31 Dec 2014
%
$m $m
Revenue 280.6 251.4 11.6
Expenses 67.1 62.4 7.5
Earnings before interest, taxation, depreciation,
fair value adjustments and investments in associates 213.5 189.0 13.0
(EBITDAFI)
Share of profit from associates 4.1 5.4 (24.1)
Derivative fair value (decrease)/increase (0.7) (1.6) (56.3)
Investment property revaluation 16.0 6.3 154.0
Depreciation expense 36.6 30.8 18.8
Interest expense 40.9 43.7 (6.4)
Taxation expense 39.6 31.8 24.5
Reported net profit after tax 115.8 92.8 24.8
Underlying profit after tax 104.1 87.8 18.6
• The following slide provides a reconciliation between reported net profit after tax and underlying profit after tax
422016 Investor Presentation
Associates’ strong underlying profit
6 months to 6 months to
Change
31 December 31 December
%
2015 2014
Queenstown Airport (24.99% ownership) $M $M
Total Revenue 15.7 13.0 20.8
EBITDAFI 11.7 9.2 27.2
Domestic Passengers 565,595 498,506 13.5
International Passengers 264,965 221,286 19.7
Underlying Earnings (Auckland Airport share) 1.5 1.2 25.0
North Queensland Airports (24.55% ownership) AU$M AU$M
Total Revenue 69.2 65.7 5.3
EBITDAFI 44.0 43.1 2.1
Domestic Passengers (Cairns + Mackay) 2,698,748 2,697,118 0.1
International Passengers (Including transits) (Cairns) 371,215 309,839 19.8
Underlying Earnings (Auckland Airport share) NZ$4.5 NZ$3.7 21.6
Novotel Tainui Holdings (20.00% ownership) $M $M
Total Revenue 12.6 11.4 10.5
Net Profit Before Depreciation 4.0 3.3 21.2
Average occupancy 89% 88% 1.1
Average room rate increase 11.4% 5.4%
Underlying Earnings (Auckland Airport share) 0.8 0.6 33.3
432016 Investor Presentation
Passenger growth underpinning
performance
Auckland Airport passenger movements
6 months to 6 months to
Change
31 December 31 December
%
2015 2014
International arrivals 2,209,520 2,054,639 7.5
International departures 2,070,923 1,937,548 6.9
International passengers excluding transits 4,280,443 3,992,187 7.2
Transit passengers 275,242 263,470 4.5
Total international passenger movements 4,555,685 4,255,657 7.1
Domestic passengers 3,850,332 3,624,754 6.2
Total passenger movements 8,406,017 7,880,411 6.7
• Consistent growth across international, transit and domestic passengers
• Consistent growth across geographical markets (11.4% Asia, 9% Americas, 5.7% Trans-Tasman routes)
• More than one third domestic capacity growth in the period serves regional airports:
JQ - 50 seat Q300 - on Nelson & Napier Dec 15 / New Plymouth & Palmerston North Feb 16
Air NZ placed 68 seat ATRs on the same routes and completed upgauging from 737 to A320 on trunk
routes
442016 Investor Presentation
Runway movements growing again
Aircraft movements and MCTOW
6 months to 6 months to
Change
31 December 31 December
%
2015 2014
Aircraft movements
International aircraft movements 24,342 23,678 2.8
Domestic aircraft movements 53,351 53,203 0.3
Total aircraft movements 77,693 76,881 1.1
MCTOW (tonnes)
International MCTOW 2,366,918 2,281,692 3.7
Domestic MCTOW 1,016,149 955,556 6.3
Total MCTOW 3,383,067 3,237,247 4.5
• Recent trend of declining runway movements due to upgauging has reversed:
New carriers adding capacity via additional aircraft (strong FY16 driver)
Existing carriers getting closer to optimal configuration
We expect runway movements to keep growing, albeit slower than
passenger growth
452016 Investor Presentation
Strong revenue growth across
business
6 months to 6 months to
31 December 31 December Change
2015 2014 %
$m $m
Airfield income 50.2 46.9 7.0
Passenger services charge 75.5 69.5 8.6
Retail income 78.6 64.8 21.3
Car park income 26.0 23.4 11.1
Investment property rental income 28.0 24.1 16.2
Other rental income 7.6 7.0 8.6
Other income 14.7 15.7 (6.4)
Total revenue 280.6 251.4 11.7
• A quarter of international aero revenue growth is due to FY16 price increase, the
balance is volume driven
• At half year we have achieved nearly 80% of entire FY15 domestic passenger growth
• Completed investment property developments in H1 and full year impact of FY15
additions dominate investment property rental growth, but also good rent reviews
• Carried lower cash balances over H1 versus PCP to optimise balance sheet
462016 Investor Presentation
Controlling expense growth
6 months to 6 months to
31 December 31 December Change
2015 2014 %
$m $m
Staff 22.4 22.1 1.4
Asset management, maintenance and airport operations 23.5 21.6 8.8
Rates and insurance 5.7 5.4 5.6
Marketing and promotions 6.3 6.0 5.0
Professional services and levies 4.4 3.8 15.8
Other 4.8 3.5 37.1
Total operating expenses 67.1 62.4 7.5
Depreciation 36.6 30.8 18.8
Interest expense 40.9 43.7 (6.4)
• Costs contained, not withstanding high passenger growth. Expense growth areas reflect:
Variable costs to drive revenues (e.g. Ibis hotel, Emperor Lounge, Valet and ParknRide)
Network utilities strategy work (e.g. electricity, gas, water and roads)
Increased health & safety and infrastructure planning resourcing
• Staff costs stabilised following changes to executive long term incentive plans
• Interest expense benefitted from planned floating rate exposure increases and very strong
debt raising outcomes 472016 Investor Presentation
Building on a foundation of success
Look back – celebrating 50 years
• Celebrated 50th anniversary on 29th January and can reflect
on 50 years of continuous growth
• Passenger volumes have grown from 750k in the first year to
over 16m during the last 12 months
• While our business has evolved over time, it remains anchored
in the strong core business of facilitating aircraft and passenger
movements
Looking ahead – updated guidance
• Updated underlying profit after tax guidance of $200 million to
$206 million (previously $183 million to $191 million)
• Capital expenditure guidance is unchanged from October 2015
of between $230 million to $260 million (including
approximately $135 million of aeronautical capital expenditure)
• This guidance is subject to any material adverse events,
significant one-off expenses, non-cash fair value changes to
property and deterioration due to global market conditions or
other unforeseeable circumstances
482016 Investor Presentation
You can also read