Use of carbonized corn cob biomass to reduce acidity of residual frying oil
←
→
Page content transcription
If your browser does not render page correctly, please read the page content below
Acta Scientiarum http://periodicos.uem.br/ojs
 ISSN on-line: 1807-8664
 Doi: 10.4025/actascitechnol.v43i1.51303

 CHEMICAL ENGINEERING

Use of carbonized corn cob biomass to reduce acidity of
residual frying oil

Aline Bavaresco1*, Jhessica Marchini Fonseca2, Fabiano Bisinella Scheufele3, Camila da Silva2,4 and
Joel Gustavo Teleken1,5
1
 Programa de Pós-Graduação em Bioenergia, Universidade Federal do Paraná, Rua Pioneiro, 2153, 85950-000, Palotina, Paraná, Brazil. 2Programa de Pós-Graduação
em Bioenergia, Universidade Estadual do Maringá, Maringá, Paraná, Brazil. 3Programa de Graduação em Engenharia de Bioprocessos e Biotecnologia, Universidade
Tecnológica Federal do Paraná, Toledo, Paraná, Brazil. 4Departamento de Tecnologia, Universidade Estadual de Maringá, Umuarama, Paraná, Brazil. 5Departamento
de Engenharias e Ciências Exatas, Universidade Federal do Paraná, Palotina, Paraná, Brazil. *Author for correspondence. E-mail: aline.bava@gmail.com

 ABSTRACT. The objective of this work was to evaluate the ability of CCC as an adsorbent material for the acidity
 removal of RFO, aiming at the application of the oil in biodiesel production. For that, a RCCD was used for FFA
 removal by applying the CCC and CAC for comparative purposes. In the RCCD removal assays the effect of the
 Temperature, Agitation and Mass factors were assessed over acidity removal of the oil. Under the best conditions
 from RCCD, an evaluation of adsorption kinetics was performed, wherein it was observed the equilibrium was
 reached within 4 h, for the CCC. Also, the influence of the adsorbent dosage was performed. It was verified that
 4 g was sufficient to allow the system to reach the maximum FFA removal. Overall, the CCC presented results
 approximately twice as high than those obtained by the CAC, mainly due to the pore size distribution which led
 to a “molecular sieving effect” for the CCC adsorbent. It allowed the major diffusion of the FFA molecules inside
 its narrow-distributed pores, whereas the CAC with a wider pore distribution (up to 260 Å) resulted in the larger
 molecules competition for the active sites inside the porous structure. The adsorbents’ characterization also
 evidenced that CCC adsorbent presented a higher content of oxygenated groups in its surface which acted as
 potential active sites for the FFA molecules resulting in an enhanced adsorbent-adsorbate affinity. Lastly, the
 wastes generated in the adsorption experiments, were evaluated as to their calorific power resulting in a value of
 31,933 J g-1, suggesting that it could be further used for energetic purposes, such as a solid fuel for boilers and
 furnaces to generate thermal energy. Based on these results, the CCC stands out as a promising material for RFO
 acidity removal.
 Keywords: adsorption; activated carbon; free fatty acids; oil acidity.

 Received on December 5, 2019.
 Accepted on April 15, 2020.

 Introduction
 The use of waste vegetable oil originated from the frying food process as a fatty material source for
biodiesel production can significantly reduce the cost, besides being considered an important step for the
waste minimization and recycling. Its physical and chemical characteristics are closely associated with the
presence of contaminants such as water, derived from the food and free fatty acids processing (FFA), as well
as dimers and polymers that directly influence the transesterification reaction (Diya’uddeen, Albul Aziz,
Daud, & Chakrabarti, 2012; Fonseca et al., 2019 ; Rocha Junior et al., 2019; Vieitez et al., 2014).
 The acidity index determination (AI) can provide an important element in the assessment of the oil
conservation status, including the assessment of the amount of residual fatty acids which have not undergone
oxidation (Silva, Borges, & Ferreira,1998; Xia & Budge, 2017). Thus, a pre-treatment of the raw material, should
aim better reaction yields and better product quality, acting physically in the removal of any suspended solids and
contaminants, and chemically, deacidifying the medium (Berrios & Skelton, 2008; Maddikeri, Pandit, & Gogate,
2012; Casallas et al., 2018).
 To remove such compounds, the most commonly used processes are washing with hot water,
neutralization with bases, steam injection, centrifuging and adsorption. Most of these processes require high
temperature or large quantities of solvents, making them unfeasible due to the high operational cost
(Nascimento, Lima, Vidal, Melo, & Raulino, 2014; Talebian-Kiakalaieh, Amin, & Mazaheri, 2013). The use of
adsorbent materials has been conquering space and importance in the purification steps of vegetable oil, for
 Acta Scientiarum. Technology, v. 43, e51303, 2021
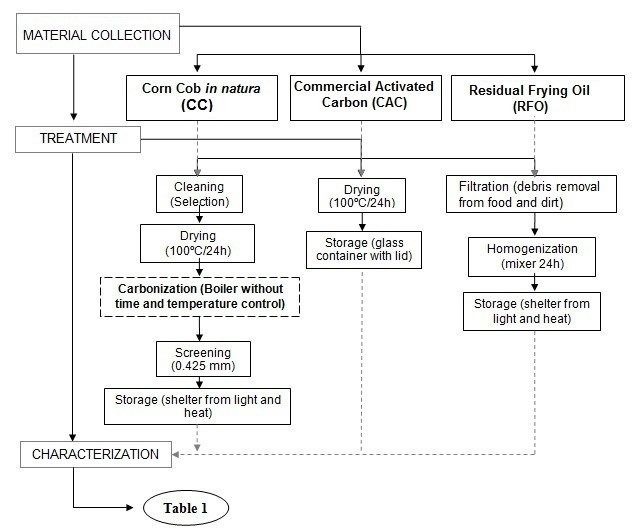
Page 2 of 18 Bavaresco et al.

their efficiency and low energy costs when several types of synthetic adsorbents are usually used, such as
activated carbons (Cai et al., 2015; Ullah, Bustam, & Man, 2015; Yaakob, Mohammad, Alherbawi, Alam, &
Sopian, 2013). Recently, several organic materials considered as waste from the agricultural sector of crops
such as soybeans, corn, wheat or sugar cane, have been tested and recognized as adsorbents for the
purification process of frying residual oil as well as biodiesel (Bonassa et al., 2016; Fonseca et al., 2018;
Manique, Faccini, Onorevoli, Benvenutti, & Caramão, 2012).
 Ashes from sugar cane bagasse were investigated in the removal of several compounds present in the
residual sunflower oil, among them free fatty acids (Ali & El Anany, 2014). Ashes from sugarcane bagasse
were also investigated for the removal of free fatty acids from residual frying oil, evaluating different
operational variables in the adsorption process (Bonassa et al., 2016). Rice husks were also used in the removal
of free fatty acids from waste oil (Schneider et al., 2017) as well as sugarcane bagasse used in the purification
of residual frying oil (Miyashiro et al., 2018). Biodiesel produced from frying waste oil was purified from rice
husks to remove free fatty acids, water, among others (Fonseca et al., 2018).
 In 2017 the world corn production exceeded 1 billion tons (Food and Agriculture Organization of the
United Nations [FAO], 2017), Brazil is responsible for almost 100 million tons. Corn is an important raw
material for glucose, starch, oil and a rich source of nutrients (Ozturk & Esen, 2013).
 The ear of corn is the main part of the plant, which is formed by the peel and straw, cob and grains. The
ear is known by the inflorescence which has an axis, known as the cob, surrounded by flowers that come loose
easily, originating the grains. The ear is composed of 70 % of grain, 20 % of cob and 10 % of straw. Therefore,
each 100 kg of ears, generates 20 kg of cob (Silvério et al., 2013; Texeira, 1998). The cob of corn stands out by
its high production volume and its low associated costs since it is an agricultural by-product, usually
underused (Vaughan, Seo, & Marshall, 2001) and composed of cellulose (38 %), hemicellulose (36 %) lignin
(13 %) and ash (3 %) (Liu et al., 2010).
 Based on the above, the objective of this work was to obtain a carbonized material of corn cobs, an
abundant agricultural waste in Brazil, and apply it in the waste oil pre-treatment intended for the
biodiesel production. The carbonaceous material was characterized and used as an adsorbent for removal
of free fatty acids, which evaluated the effect of operational variables, as well as the adsorption kinetics
and the mass of the adsorbent effect. A computational simulation of the size of the fatty acid molecu les
present in the residual oil was performed in order to investigate the access to the pores of the adsorbent
material. In parallel, experiments were conducted using commercial activated carbon (CAC) for
comparative purposes.

 Material and methods
 Obtaining and characterization of materials
 The in natura corn cob (CC) and the residual frying oil (RFO) used in the study were purchased in the region
of Palotina, Paraná State, Brazil. The commercial activated carbon (CAC), used as a reference for the
experiments, with uniform particle size of 0.004 mm (4 µm), was supplied by Alphatec. Figure 1 presents the
preparation and/or treatment steps of each material used. Both adsorbents and the frying residual oil were
characterized by the methods described in Table 1.
 Table 1. Techniques for the characterization of materials.

 Tests Application Reference
Nitrogen Physisorption (B.E.T. method) CC, CCC and CAC Gregg and Sing (1982)
 Moruzzi, Lima, Colombo, Conceição and Lanza (2014);
 Scanning Electron Microscopy (SEM) CC, CCC and CAC
 Souza, Matsushita and Visentainer (2012)
Energy- Dispersive X-ray Spectrometry
 CC, CCC and CAC Moruzzi et al. (2014); Souza et al. (2012)
 (EDS) – Coupled to SEM
 CC, CCC, CAC, RFO, RFOT and
 Infrared Spectroscopy (FT-IR) Pavia, Lampman, Kris and Vyvyan (2010)
 adsorbents impregnated with RFO
 pHPCZ CCC and CAC Freitas, Câmara and Martins (2015)
 Acidity Index (AI) RFO and RFO American Oil Chemists' Society (2009)
 Fatty acids composition RFO European Committee for Standardization (2003)

 Acta Scientiarum. Technology, v. 43, e51303, 2021
Adsorption waste oil treatment Page 3 of 18

 Figure 1. Flow chart of the procedure of material collection, and preparation of the adsorbents.

 Computational simulation of fatty acids molecular diameter
 Two computational theoretical tests were performed in order to predict the size of the fatty acid molecules
present in the frying residual oil and assess the possibility of their diffusion into the pores of the studied
adsorbents.
 Initially, the molecular geometry of fatty acids present in the RFO was estimated by the minimizing energy
MMFF94 method simulated in the JSmol (3D rendering engine – Mol View software v. 2.4). This method
provided the medium and longitudinal diameters of each molecule found in fatty acid composition, without,
however, considering the interference of electronic cloud present in the molecules.
 Next, the oleic acid molecule simulation acid was performed, specifically, for being the second most
abundant in the analysed RFO sample, and easily purchased. This simulation was carried out by means of the
computational method of HARTREE-FOCK (HF), a semi-empirical AM2 method, which includes data from
classical calculations and quantum mechanics. In this case, a computer with Linux operating system Ubuntu,
i7 processor of 3.40 MHz and 8.0 GB of RAM memory was used. The software used for the input generation
was Gabedit 4.2.8, for processing it was the Gaussian 03®, and for output and data processing was Gaussview
4.1®. Through this method, it was possible to consider all the electronic clouds interference and, therefore,
all the space occupied by them.

 Adsorption tests
 For the removal tests with adsorbent materials (see Figure S1 - Supplementary Material) whose goal was
to reduce the RFO acidity, a water bath Dubnoff was used (New Instruments, NI-1232 model), with
temperature control and agitation. An experimental design based on a Rotational Central Composite Design
(RCCD) was developed proposed for each of the adsorbents. The purpose was the adsorption process
optimization by reducing the number of tests, where it was assessed the effect of the operational variables (X1
– Temperature (T), X2 – Adsorbent Mass (M) and X3 – Agitation (A)) over the response variable (Y – Acidity
Reduction of RFO – RA) by means of Analysis of Variance (ANOVA) and Response Surface Methodology
(RSM). The specification of the operational variables of the RCCD are presented in Table S1 (see
Supplementary Material).
 RCCD used the contemplated 3 (three) factors in 5 (five) levels, providing a factorial design type 23 with 6
axial points and triplicate in the central point, totalling 17 assays (see Table S2). The choice of the values of
each of the independent variables was accomplished taking into consideration the technical capacity of the
available equipment to perform the tests.
 Acta Scientiarum. Technology, v. 43, e51303, 2021
Page 4 of 18 Bavaresco et al.

 The data obtained in the Acidity Index analysis (AI) were interpreted as the percentage of reduction of
Acidity Reduction (RA %) when compared with the initial acidity content of frying residual oil. The tests were
performed in analytics triplicate. These data were statistically evaluated with the aid of the Statistica v. 7.0.

 Adsorption kinetics and evaluation of the adsorbent mass
 Based on the maximum value of RA (%) obtained, a study of the adsorption kinetics was performed, being
values of Temperature (T), Agitation (A) and Adsorbent Mass (M) kept fixed, known in optimal condition. An
evaluation at different times of assay was performed (15 min, 30 min, 1 min, 2 min, 3 min, 4 min, 5 min,
6 min, 7 min, 8h and 9h). The purpose of this procedure was to verify the contact time required between
adsorbent and adsorbate, to observe the highest RA (%) (i.e. the equilibrium time).
 From the definition of the time of maximum removal of FFA through the adsorption kinetics study, a
verification was carried out on the influence the mass of adsorbent variation would play in this process,
aiming to find out the best values of RA (%) of free fatty acids present in the frying residual oil. In this case,
values of temperature and agitation of optimal condition observed were maintained, wherein it was evaluated
only the mass of adsorbent used for the tests, starting with 1 g to 10 g of adsorbent, gradually increasing in
1 g. The oil mass was maintained at 33 g.

 Results and discussion
 Materials Characterization
 The N2 physisorption analysis, performed by the BET (Brunauer, Emmett, Teller) method allowed to know
the superficial area values of each adsorbent material, and through the BJH method, the values of volume and
pore size distribution were determined (see Table 2 and Figure S2)
 Table 2. Textural characteristics of in natura corn cobs and the adsorbents analyzed by the N2 physisorption method.

 Samples SBET (m2 g-1) Sm (m2 g-1) VT (cm3 g-1) Vm (cm3 g-1) ØP (Å) Classification
 CC 2.662 - 0.006557 0.0002164 98.50 Mesopores
 CCC 109.380 140.7 0.07522 0.04999 27.50 Mesopores
 CAC 564.400 819.8 0.3564 0.2913 25.26 Mesopores
 Specific surface area (SBET); Micropore Area (Sm) (a total of these two items equivalent to the total surface area); Total pore volume (VT); Micropore volume (Vm); Average pore
 diameter (ØP).

 Higher specific surface area and larger volume of pores were observed for the commercial activated carbon
(CAC), a fact that may be related to the differentiated conditions of this sample production, since it is a
commercial activated carbon, unlike other samples that have not gone through any type of activation. Usually,
the activated carbons show a high surface area, reaching 2400 m2 g-1 (Gupta & Suhas, 2009). Their volume of
pores also tends to be high, approximately 0.60 cm3 g-1(Lopez et al., 2013). Thus, regarding to the micropores,
their volume and surface area were also higher than the other samples. However, comparing the CC with the
CCC, it is noted that the carbonization process applied to corn cobs let to an increase of all the parameters
shown in Table 2.
 In CCC (see Figure S2) one may notice that the macropores volume is negligible in contrast to the CC,
which presented macropores within the range of 170 to 800 Å (or higher). This behaviour is related to the
carbonization process in which a mesoporous structure started increasing, consequently, the pore volume
and the surface area of the CCC, as presented in Table 2. Analysing the pore size distribution of the CCC
(Figure S2) one may notice the predominance of mesopores of homogeneous size concentrated in a narrow
range, where its distribution showed a more acute frequency curve, and also a tendency for micropores, which
is in accordance with the micropores area values observed for the CC (Table 2). The pore size distribution
obtained for the CCC stands out as a major feature for the adsorbent, since it can provide selectivity for the
adsorbent on the removal of fatty acids molecules, selecting those with diameters smaller than those of the
adsorbent, rather than larger molecules.
 Regarding the CAC adsorbent, larger pore volumes are observed, mainly concentrated in the range from
30 to 50 Å, however in minor quantity up to 120 Å (mesopores). There is also a tendency, more expressive, for
micropores and a smaller volume of macropores. Thus, one may suggest that larger molecules are adsorbed
easier in CAC than in CCC.
 Acta Scientiarum. Technology, v. 43, e51303, 2021
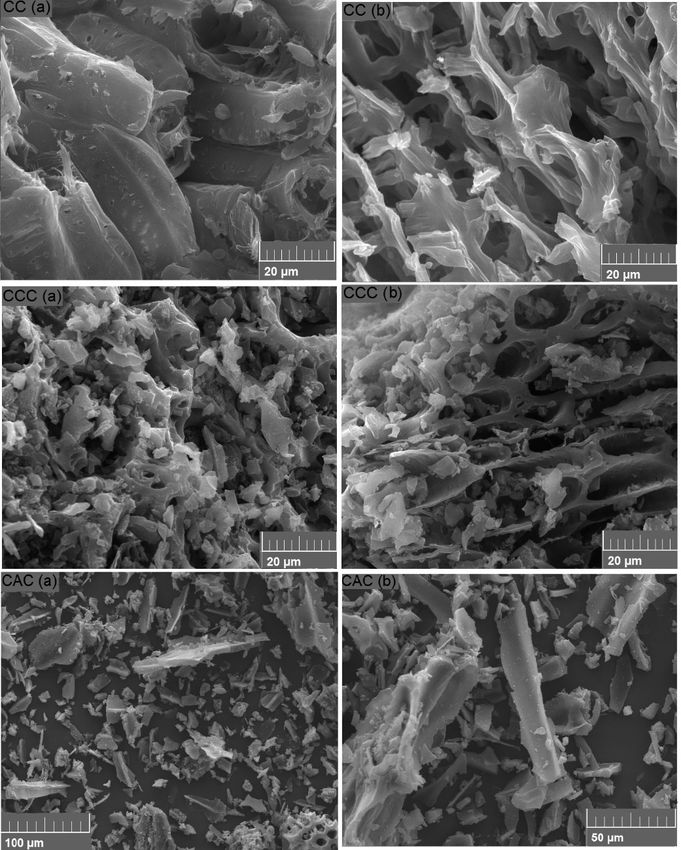
Adsorption waste oil treatment Page 5 of 18

 The micrographs obtained by SEM (Figure 2) indicated that the CC had clustered thin tubular structures
(a), containing some small visible pores and long and fibrous structures (b). Whereas in the CCC micrographs
(a and b) a greater quantity of scattered pores throughout the structure is observed that seems to take shape
of rings. In CAC, a more defined structure was observed.

Figure 2. Micrographs of in natura corn cobs– CC (a and b, 30.0 kV, 2.00 kx ); Carbonized Corn Cobs – CCC (a and b, 30.0 kV, 2.00 kx)
 and Commercial Activated Carbon – CAC (a - 20 kV, 500x and b - 20 kV, 1.0 kx).

 Through the Energy-Dispersive X-ray Spectroscopy (EDS) analysis (Table 3) it was noticed that the corn
cobs in natura exhibited a considerably higher quantity of carbon, which implies to be a potential raw material
for the activated carbon production. The quantity of this chemical element in a material indicates its potential
to become a highly porous structure. Although this carbonized material was not subjected to any activation
process for the pores exposure, it is possible to state that it showed good results, in comparison to the
commercial activated carbon. After the major carbon composition, the oxygen presents the higher contents.
It must be noticed that the CCC presented a greater value of oxygen (12.43%) when compared to the CAC
(12.43%). The higher oxygen levels may become an advantage for the CCC, since the oxygenated groups are
commonly recognized as functional groups (e.g. lactones, hydroxyl, carbonyl, carboxyl, etc) that may interact
with different adsorbates.
 According to the extensive review performed by Shafeeyan, Wan Daud, Houshmand, & Shamiri (2010), the
concentration of oxygen on an adsorbent’s surface strongly impacts on the adsorption performance of the carbon.
 The other inorganic elements, such as Mg and K are common macronutrients required by the plant. After
the carbonization process, such elements can be observed in the form of oxides onto the carbon's surface,
 Acta Scientiarum. Technology, v. 43, e51303, 2021
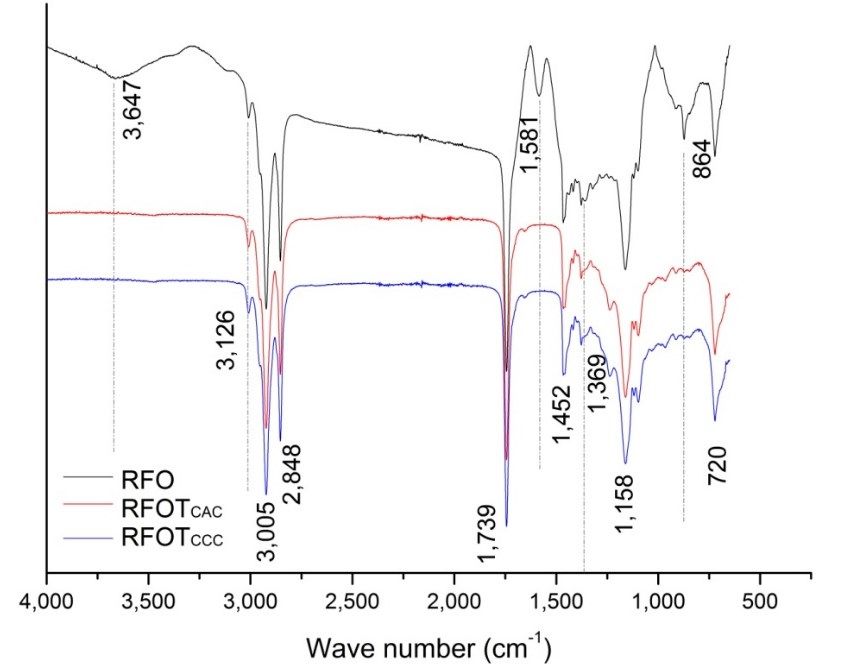
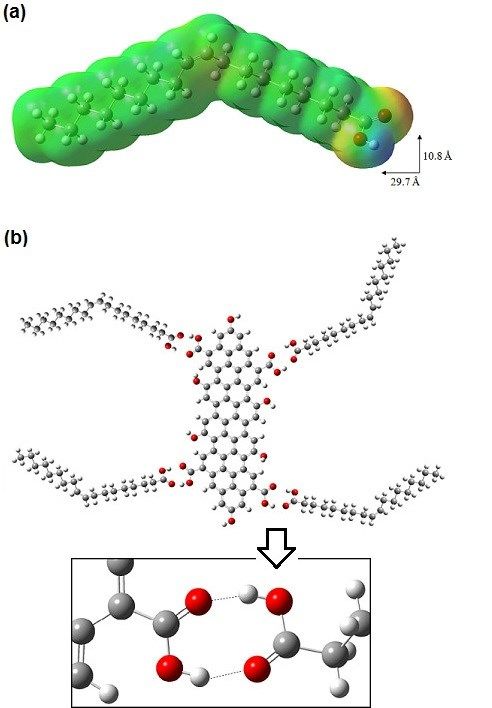
Page 6 of 18 Bavaresco et al.

which contributes to the alkaline character of the carbon. In addition, it is possible that the potassium and
magnesium, in the form of nitrogen oxides, participate in the neutralization reactions of the free fatty acids
present in the frying residual oil.
 Table 3. Elemental composition, moisture (X) and ash (Ash) contents of the adsorbents (% m m-1).

 Samples C (%) O (%) Mg (%) Si (%) Cl (%) K (%) X (%) Ash (%)
 CC 54.29 43.28 ND ND 0.08 2.37 7.24 1.95
 CCC 85.58 12.43 0.17 0.21 0.35 1.40 5.35 5.10
 CAC 94.04 5.58 0.13 0.18 ND ND 5.67 13.30

 Chlorine is a micronutrient that plays a key role in the osmotic balance in the plants and also participates
as an enzymatic cofactor in the photosystem II (PS II) in the water photolysis and O2 liberation in
the photosyntesis. Despite the fact that Si is not traditionally associated as an essential nutrient for plants,
recently it has been recognized as an important element in the defence mechanism under stress conditions
and in the resistance to fungus contamination. Monocotyledonous plants are particularly, silicon
accumulators. Not only Si but also Mg may be present in the form of ash in the samples, as found by Kikuchi,
Qian, Machida and Tatsumoto (2006).
 In the analysis of pHPZC (see Figure S3) both samples showed basic character surface (CCC: 8.61 and CAC:
8.04), which is a desirable feature for the adsorbents, since the goal of this project is to promote the adsorption
of free fatty acids molecules present in the frying residual oil, reducing their acidity index.
 Although the difference was small, it was noted that the CCC presented even a more basic surface than CAC.
This basicity is given as a function of each material’s composition, i.e. of the functional groups present in their
superficial structures. Thus, it can be suggested that CCC has greater affinity for free fatty acids than CAC.
 Through the infrared analysis (Figure S4) samples of RFO and RFOT with each adsorbent, it is noted that
both spectra exhibit findings of typical characteristics of esters molecules, indicated by the bond C = O (1,630
to 1,810 cm-1) and bond C (1,020 to 1,250 cm-1). For RFO, there is a peak in 3,647 cm-1 which is no longer seen
in samples of RFOT (CAC and CCC). It can be attributed to the hydrogen bonds, carboxylic acids or water possibly
present in the material. Its disappearance may indicate that there was the elimination of fatty acids during the
process (Dovbeshko, Gridina, Kruglova, & Pashchluk, 2000; Pavia et al., 2010, Smidt & Meissl, 2007).
 In 1,581 cm-1, a small peak is seen in the sample of ORT and ceases to exist in oil samples treated with both
adsorbents. It can be related to the presence of NH2 groups of potential protein compounds present in RFO.
In the case of the presence of amines, another band appears around 800 cm-1, which refers to the creases N-
H outside the plan. The absence of these peaks in samples of RFOT can be attributed to the elimination of this
compound in the acidity removal by some form of interaction with the adsorbents (Pavia et al., 2010).

 Molecular dynamics simulation
 The RFO molecules dimensions determined in fatty acid composition were estimated, initially, by the
minimizing energy MMFF94 method (Table 4), and subsequently by the HARTREE-FOCK method (HF).
However, for this method, only the oleic acid was used for the analysis, in which despite of being the second
most abundant in the sample, was easily obtained the most for testing in the laboratory.
 Table 4. Fatty acid composition of the RFO and the fatty acids dimensions estimated by computational method MMFF94.

 Molecular dimensions
 Fatty acids AR (%)
 dlonga (Å) davb (Å)
 C14:0 Myristic 0.22 19.4 2.2
 C16:0 Palmitic 12.05 22.0 2.2
 C18:0 Stearic 4.33 24.1 2.2
 C18:1 Oleic 32.20 14.5 7.6
 C18:2 Linoleic 43.26 14.2 6.8
 C18:3 Linolenic 3.77 10.8 8.7
 C20:0 Arachidonic 0.34 26.6 2.2
 AR: relative area. a Longitudinal diameter (Å); b Average diameter (Å).

 Evaluating the results obtained for the first simulation method, in comparison with the average pores
diameter (Table 2), it is verified that, apparently, it is possible that the FFAs diffused inside the CCC pores as
the largest dimension observed was 26.6 Å to the linear FFAs (for example C20:0), and for the non-linear
 Acta Scientiarum. Technology, v. 43, e51303, 2021
Adsorption waste oil treatment Page 7 of 18

(unsaturated) approximately 14.5×7.6 Å (Oleic – C18:1) and14.2×6.8 Å (linoleic – C18:2) that, apropos, are
those that appear in larger quantity (approximately 75 %).
 However, when assessing the oleic acid dimensions and molecular structure through the HARTREE-FOCK
computational method, which also considers the electron cloud, a bigger molecule size was observed.
 In Figure 3(a) it is possible to check the three-dimensional structure of the oleic acid molecule (octadec-
9-enoic acid) with its cis preferential conformation, total height of 10.8 Å and total length of 29.7 Å,
considering the electronic “cloud” throughout the molecule.

 Figure 3. Molecular dynamics simulation: (a) Oleic acid 3-D structure and electronic cloud (theoretical); and (b) Possible interaction
 mechanism (H-Bond) between the oleic acid molecules (i.e. FFA) and the functional groups (active sites) on the adsorbent surface.

 Comparing these dimensions with those observed by BET and BJH methods (see Table 2) to the average
diameter of the adsorbent pores, it seems that, in the case of CCC and the CAC, with pore diameters of 27.50
and 25.26 Å, respectively, this oleic acid molecule could not easily and completely diffuse into the pores due
to steric factors, as they are smaller than the FFA molecule.
 Figure 3(b) implies, by the same method of semi-empirical analysis, a generic surface of an activated
carbon, with its active functional groups interacting with those of the FFA molecule. Even though the FFA
molecules cannot enter fully into the activated carbon pores, remaining only on their surfaces, it is possible
that these superficial interactions are responsible for the removal process of free acidity in the frying residual
oil. In addition to the weak forces of Van der Waals interactions, hydrogen bonds type (2.8 Å) are indicated,
characterizing a moderate force formed between a hydrogen atom of a an FFA molecule with one atom of
oxygen of an active group present in the activated carbon, and vice versa. In the case of the molecule that can
partially enter into the pore structure, it can also be suggested, that this part which diffuses into the internal
pores may interact with the functional groups present in the interior of the pore in the same way as they
interacted with more accessible groups onto the adsorbent’s surface.

 Adsorption experiments – RCCD: Operational variables optimization
 In the adsorption tests the proportion in mass of adsorbate/adsorbent ranged from 0.09 to 0.15 considering
the smallest and the largest used mass of adsorbent; the contact time was 6 h for all the tests. The average
results were expressed in terms of RA percentage. Tests are shown in Figure 4.
 Acta Scientiarum. Technology, v. 43, e51303, 2021
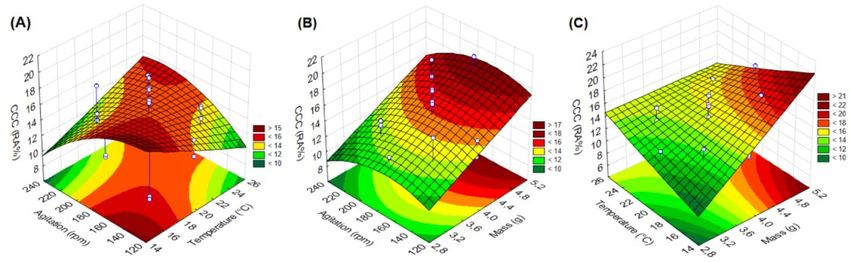
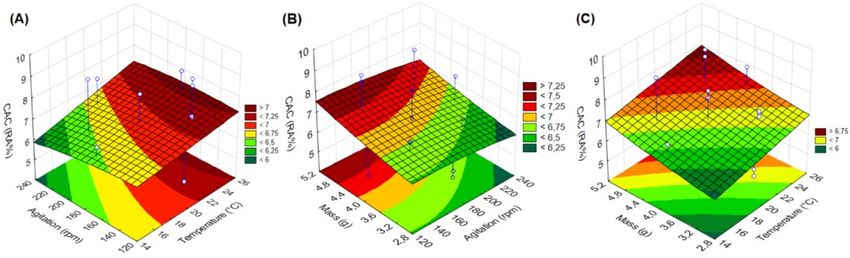
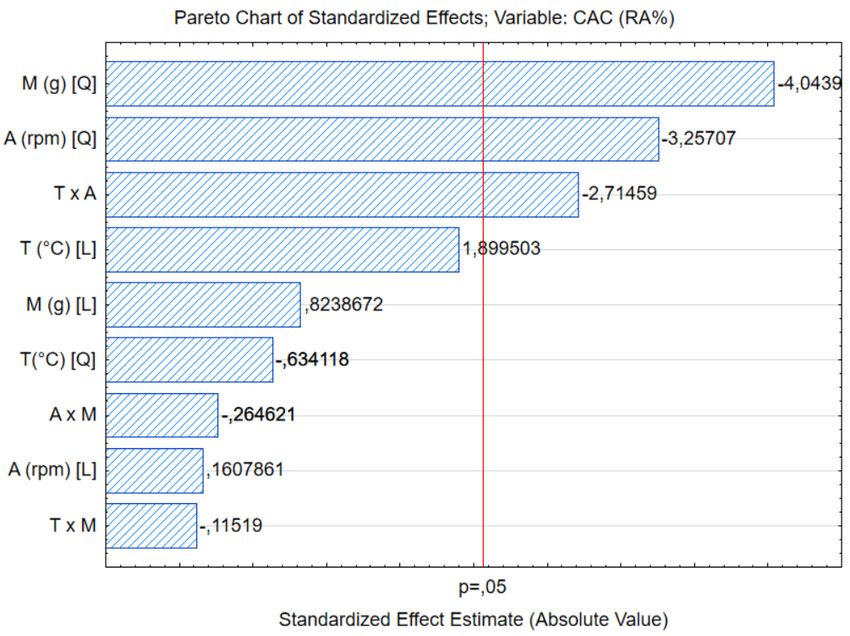
Page 8 of 18 Bavaresco et al.

 Figure 4. Experimental results of the adsorption assays by the RCCD for the CAC and CCC.

 Considering that the initial acidity index of RFO was 3.84 mg KOH g-1, for the CCC, the largest percentage
of acidity reduction was obtained in the Experiment 14 (T = 20 °C; A = 175 rpm; M = 5 g), with a maximum
reduction of 19.53 %, reaching an acid index of 3.09 mg KOH g-1 of oil. Concerning CAC, the best result was
obtained in the Experiment 6 (T = 23 °C; A = 145 rpm; M = 4.6 g), achieving a less significant reduction
compared to CCC, reaching only 9.19 %, which is equivalent to an acid index of 3.34 mg KOH g-1 of oil.
 The experimental results of the RCCD were statistically analysed, and it was verified that the proposed
model was valid for both adsorbents, which proved to be significant at 95% level of confidence (pFtab).

 Regarding CAC (Figure 5), possibly the temperature increase may have provided greater interaction
(collisions) among the adsorbate molecules (collisions), facilitating the fatty acids access to the mesopores or
 Acta Scientiarum. Technology, v. 43, e51303, 2021
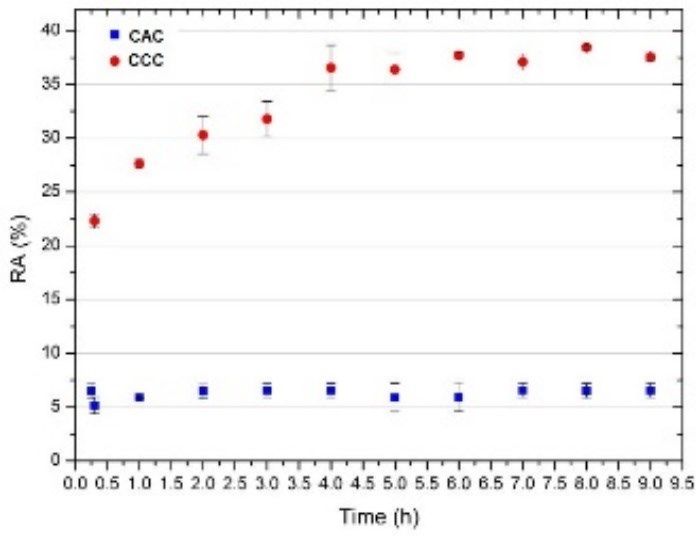
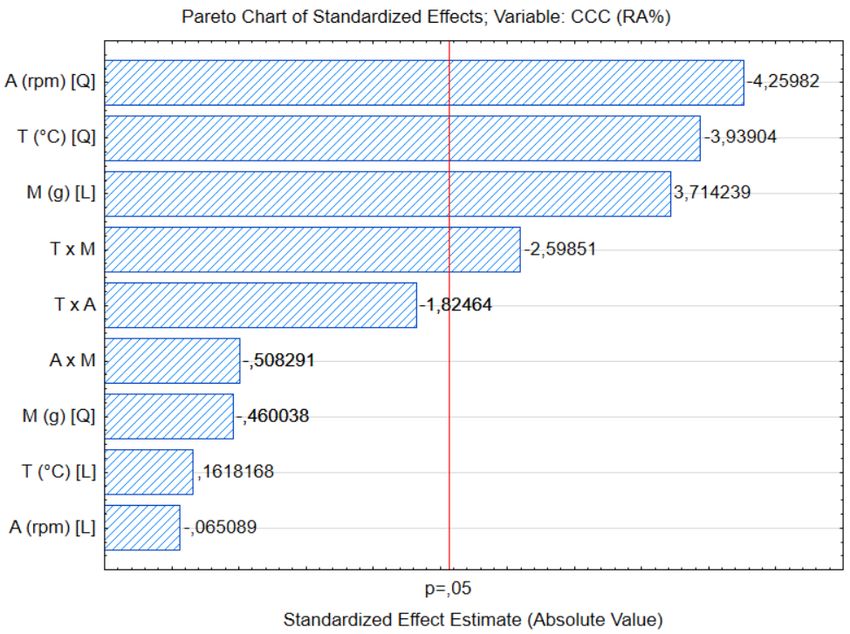
Adsorption waste oil treatment Page 9 of 18

the adsorbent active sites. In contrast, the increase in agitation of the reaction medium may have caused the
molecules displacement already adsorbed. Thus, agitation lower than or equal to 145 rpm would have been
enough to promote the movement necessary for the molecules to reach the adsorption sites.
 In relation to the CCC data, from the Pareto diagram (see Figure S6) the significant values (i.e. p-value<
0.05) were the variables: Agitation (quadratic term), Temperature (quadratic term) and Adsorbent Mass
(linear term). The factors ² and ², showed negative values, whereas the factor had a positive value
indicating that its increase provides higher acidity reduction levels. Also, the linear interaction ×
presented a significant and negative effect over the response. An interaction between two variables generates
a secondary effect that characterizes the synergism between the two factors. The surface responses for the
RCCD for the influence of the operational variables over the acidity reduction for the CCC are presented in
Figure 6.

Figure 6. Response surfaces for RA% by the CCC for the interaction of independent variables: (A) Temperature (T) × Agitation (A); (B)
 Adsorbent Mass (M) × Agitation (A); and (C) Adsorbent Mass (M) × Temperature (T); Equation (Real values): (%) = −245.865 +
 12.325 − 0.180 2 + 0.966 − 0.002 2 + 25.105 − 0.526 2 − 0.011 − 0.786 − 0.016 ; ANOVA (Significant terms):
Agitation[Q]: Fcalc(18.14610), p-value (0.000273); Temperature[Q]: Fcalc(15.51603), p-value (0.000615); Mass [L]: Fcalc(13.79557), p-value
 (0.001081); Interaction T×M: Fcalc(6.75225), p-value (0.015757). ANOVA (Regression): Fcalc(6.4489), Ftab(9;24;5%) (2.3002) – Model
 statistically valid (Fcalc>Ftab).

 Overall, one may notice that the higher levels of adsorbent mass lead to an increase on the acidity removal,
what is expected since a higher number of available sites for the FFA is provided. In contrast, the temperature
effect (quadratic as well as interaction terms) impairs the acidity removal. This behaviour is probably related
with the strong influence of the temperature over the oil properties (e.g. viscosity) as well as over its
intermolecular interactions, namely, the H-bonds forces between the FFAs and the adsorbent’s surface sites
(see Figure 3b) can be weakened with the temperature increase.
 It could be expected that, at higher temperatures the removal FFA process would be facilitated due to a
higher diffusivity of the FFA molecules inside the pores (i.e. in the case that diffusional mechanism prevailed).
However, the best RA results were observed at lower temperatures. Therefore, the adsorption process is
probably governed by the adsorbent-adsorbate affinity rather than diffusional resistances. This behaviour is
in accordance with molecular dimensions and pore size distribution as discussed in the previous sections.

 Adsorption kinetics
 In the best conditions obtained in the RCCD, namely, for CAC (T = 23°C; M = 4.6 g; and A = 145 rpm) and
for CCC (T = 20°C; M = 5.0 g; and A = 175 rpm), adsorption kinetics experiments were performed as presented
in Figure S7) By analyzing the adsorption kinetics for the CCC, within the first 30 min of contact between the
CCC and RFO, an acidity reduction of 22.34% was observed. However, the equilibrium was only achieved after
4 h of contact, wherein 38.44% of RA was observed. It must be highlighted that this is a favourable kinetics
considering that the oil presents a high viscosity, that impairs the diffusional processes in the fluid phase as
well as inside the pores. For the CAC a smaller and almost constant percentage reduction was verified, in
which the equilibrium was observed within 1 h of contact, however the RA was only 6.57%, i.e. a slight
variation along the experiment.
 Note: The equilibrium time of the kinetics data was confirmed by ANOVA and by the post-hoc tests,
namely, Tukey’s and Fischer’s multiple comparison of means. For the CCC adsorbent, the effect of time
 Acta Scientiarum. Technology, v. 43, e51303, 2021
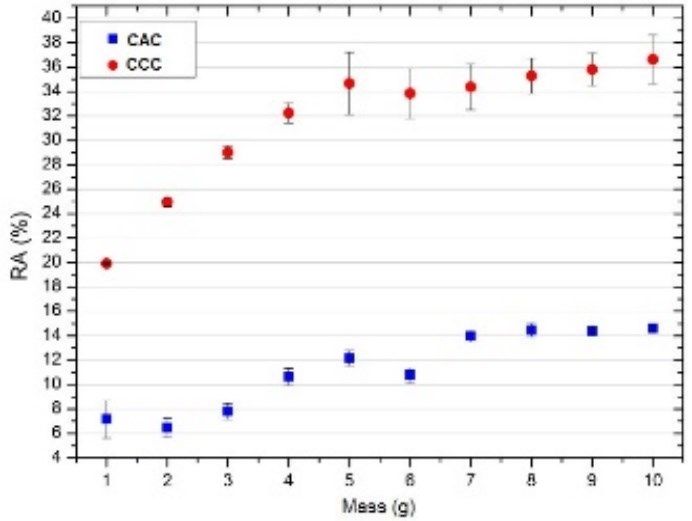
Page 10 of 18 Bavaresco et al.

variable was considered significant over the RA(%) response, for a 5% of significance level (p-value =
6.9104×10⁻⁹), whereas for the CAC there was no significant difference between the values. Also, for CCC
kinetic data, both Tukey and Fischer post-hoc analysis evidenced that there were no significant differences
between the RA values after 4h of contact time, confirming that equilibrium time was reached within 4h of
experiment. Furthermore, the first derivative was applied to kinetic data wherein the inclination for times
higher than 4h were very close to zero, therefore, confirming the stability was achieved after 4h.
 In the beginning of the process, an elevated rate of FFA removal was observed due to the
promptly available external active sites available. Subsequently, less accessible sites inside the pore structure
took place, however, in a slower way.
 From the moment in which the molecules begin to be sorbed, the sorption speed decreases, since the
driving force reduces and only internal active sites are still unoccupied for the adsorbate molecules (Sud,
Mahajan, & Kaur, 2008; Weber & Smith, 1987).
 In mesoporous materials, adsorption takes place through the pores of wider diameter, that facilitates the
passage of adsorbate molecules inside the structure, a factor that may explain the speed in which the process
occurs. In this sense, by observing in the pore size distribution (see Figure S2), one may notice that the CAC
presents a wider distribution of pores ranging majorly from 20 to 80 Å, but also showing wider pores up to 260
Å. In contrast, the CCC presented a very narrow pore structure (20 to 40 Å), showing no larger pores in its
distribution. By confronting these results with the acidity removal (see Figure 4 and S6) one may notice that
the CAC macropore structure was not efficient to promote the FFA removal.
 Despite the larger pores commonly known as access pores may favor the kinetics for the process, for our
system that was not observed. In fact, a jeopardizing effect was observed for the larger pores present in the
CAC. Such behavior, may be related to the competition for the active sites between the FFA molecules (target)
and other larger molecules present in the RFO, such as monoacylglycerols (MAG), diacylglycerols (DAG) and
the triacylglycerols (TAG) which may have been adsorbed preferentially before FFA, hence causing an adverse
effect to the FFA removal.
 In other words, since the CCC present a very defined and narrow pore size (20 to 40 Å), the CCC acted
similarly to a molecular sieve, wherein only FFA molecules could diffuse into the porous structure and achieve
the internal active sites (since FFA molecules presented molecular sizes lower than 40 Å – see Table 4),
explaining its best performance when compared to CAC adsorbent.
 Despite the textural and porous structure influence over the acidity reduction, one may notice that the
affinity can be a major factor for the FFA removal. Hence, given the greater presence of oxygen-containing
groups as observed in the EDS elemental analysis (see Table 4), a higher affinity between the adsorbent and
the adsorbate is expected (Shafeeyan et al., 2010), as observed for the CCC.
 Also, in this process, neutralization reactions may have occurred, given the presence of basic groups on
the adsorbents surface (as discussed in the pHPZC results – see Figure S3) mainly in the CCC samples, where
there was a greater acidity reduction.
 Generally, an adsorption process kinetics comprehends a multiple-resistance sequential steps, which may
include: (i) external resistance (film diffusion); (ii) internal resistance (intraparticle diffusion) and (iii)
adsorption on the sites (Neves et al., 2018; Ruthven, 1984). Based on the textural properties along with the
molecular geometry simulations for this study, a mechanism involved in the FFA retention onto the CCC
adsorbent can be proposed. Given the pore sizes, the internal diffusion is plausible, hence it may control the
overall mass transfer process. Also, oxygenated functional groups on the adsorbent's surface may act as active
sites for the FFA molecules, which can interact mainly by H-bonds (even though other intermolecular
interactions such as Van der Waals forces may also take place between the apolar part of the FFA molecule –
see Figure 3a – and the apolar regions of the carbons

 Adsorbent mass evaluation
 After the definition of the equilibrium time (4h) in the kinetics experiments, the evaluation of the
adsorbent mass was performed, as presented in Figure S8 it should be noted that there was a substantial
difference among the percentages of acidity reduction comparing the CAC and CCC adsorbents. In general,
CCC acidity removal performances were superior for all adsorbent mass studied confirming its higher affinity
to the FFA as previously discussed.
 Based on ANOVA and multiple comparison of means (Tukey and Fischer tests), the adsorbent mass was
identified as a significant variable for both adsorbents (ANOVA at 5% confidence level): CAC (p-value =
 Acta Scientiarum. Technology, v. 43, e51303, 2021
Adsorption waste oil treatment Page 11 of 18

2.2074×10⁻¹²) and CCC (p-value = 1.1408×10⁻¹⁰). The results of Tukey post-hoc comparison of means showed
that for CAC there were no significant difference between the adsorbent mass values higher than 7, whereas
for CCC the values of 4 to 10 g were statistically equal.
 In summary, it was observed that CCC presented a higher acidity reduction achieving 34.70% ± 1.43% for
adsorbent mass values between 4 and 10 g, whereas CAC achieved 14.35% ± 0.28% of RA for adsorbent mass
values between 7 and 10 g. Therefore, it is possible to infer that, in these conditions, the FFA removal process
became stable with 4 g of CCC adsorbent (resulting a mass ratio adsorbent: oil of 12.1% – i.e. adsorbent
dosage), in a way that higher amounts of adsorbent would not provide higher FFA removal levels.
 This disparity in the acidity reduction maybe related to the composition of each adsorbent and,
consequently, to the adsorbent-adsorbate affinity (as discussed in the previous sections), mainly in what
refers to the number of active sites, or even to greater availability of the contact surface. It must be highlighted
that the steric effects of the adsorbed compounds, related to the pore’s distribution and to the RFO molecules
diameter played a key role in the acidity removal in this study, impacting on the competition for the active
sites between FFA and higher molecules for the CAC adsorbent. In contrast, given the narrow pore size
distribution presented by the CCC adsorbent, the removal of FFA was favoured through a molecular sieving
effect inside the pores (i.e. the CCC presented a desirable selectivity for the FFA target adsorbate).

 Impregnated adsorbent calorific potential
 In the proposed adsorption process, a process residue is generated, namely, the activated carbon
impregnated with the frying residual oil. Aiming to evaluate its potential to energetic purposes as solid fuel
for the thermal energy generation, its calorific power was analysed. Specifically, for the CCC impregnated
with RFO, a value of 31,933 J g-1was found, which represents a high value, enough for the present purpose.
 In the literature, the values observed for soybean oil, in line with most of the vegetable oil, varied from
34,000 to 39,400 J g-1 (Martini, Delalibera, & Weirich Neto, 2012), while the corn cob exhibited approximately
15,000 to 17,000 J g-1.
 The value obtained in this mixture may be the result of the interaction among the characteristics of each
component, or only the predominance of frying residual oil. In any case, these results show that the residue
obtained on the use of carbonized corn cobs as adsorbent in the free acidity removal of frying residual oil can
be used (e.g. pellets) in the burning in boilers and furnaces for thermal energy generation.

 Conclusion
 In general, carbonization process of the corn cobs led to enhanced textural properties, which allowed the
FFA diffusion into the CCC, as well as oxygen functional groups, providing affinity to the FFA. The
temperature showed an adverse effect over the FFA removal, which is probably related to the weakening of
the H-bonds between the carboxylic groups of the FFA and oxygenated groups onto the adsorbent’s surface.
The kinetics experiment evidenced a favorable process reaching an equilibrium time after 4h, wherein 4 g was
enough to achieve the maximum acidity removal. The material can be further used for energetic purposes.

 Symbols
 R2 – determination coefficient
 p – p-value
 p/p0 – relative pressure

 Abbreviations
 AI – Acidity Index.
 RA – Acidity Reduction.
 A – Agitation Speed.
 BJH – Barret, Joyner and Halenda (1951) method.
 CAC – Commercial Activated Carbon.
 CCC – Carbonized Corn Cob.
 CC – Corn Cob in natura.
 DAG – Diacylglycerols.
 Acta Scientiarum. Technology, v. 43, e51303, 2021
Page 12 of 18 Bavaresco et al.

 FAO – Food and Agriculture Organization of the United Nations.
 FFA – Free Fatty Acids.
 RFO – Residual frying oil.
 pHPCZ – Hydrogen ion potential at the zero-charge point.
 M – Adsorbent Mass.
 MAG – Monoacylglycerols.
 BET – Nitrogen Physisorption method (Brunauer, Emmett, & Teller, 1938).
 RCCD – Rotational Central Composite Design.
 SEM – Scanning Electron Microscopy.
 T – Temperature.
 TAG – Triacylglycerols.

 References
American Oil Chemists' Society. (2009). AOCS CD 3D-63: Sampling and analysis of commercial fats and oils.
 Urbana, IL: Author.
Ali, R. F. M., & El Anany, A. M. (2014). Recovery of used frying sunflower oil with sugar cane industry waste and
 hot water. Journal of Food Science and Technology, 51(11), 3002-3013. doi: 10.1007/s13197-012-0832-7
Barrett, E. P., Joyner, L. G., & Halenda, P. P. (1951). The determination of pore volume and area
 distributions in porous substances. I. Computations from nitrogen isotherms. Journal of the American
 Chemical Society, 73(1), 373-380. doi: 10.1021/ja01145a126
Berrios, M., & Skelton, R. L. (2008). Comparison of purification methods for biodiesel. Chemical Engineering
 Journal, 144(3), 459-465. doi: 10.1016/j.cej.2008.07.019
Bonassa, G., Schneider, L. T., Alves, H. J., Meier, T. R. W., Frigo, E. P., & Teleken, J. G. (2016). Sugarcane
 bagasse ash for waste cooking oil treatment applications. Journal of Environmental Chemical Engineering,
 4(4), 4091-4099. doi: 10.1016/j.jece.2016.09.017
Brunauer, S., Emmett, P. H, & Teller, E. (1938). Adsorption of gases in multimolecular layers, Journal of the
 American Chemical Society, 60(2), 309-319. doi: 10.1021/ja01269a023
Cai, Z. -Z., Wang, Y., Teng, Y. -L., Chong, K. -M., Wang, J. -W., Zhang, J. -W., & Yang, D. -P. (2015). A two-
 step biodiesel production process from waste cooking oil via recycling crude glycerol esterification
 catalyzed by alkali catalyst. Fuel Processing Technology, 137, 186-193. doi: 10.1016/j.fuproc.2015.04.017
Casallas, I. D., Carvajal, E., Mahecha, E., Castrillon, C., Gomez, H., Lopez, C., & Malagon-Romero, D. (2018).
 Pre-treatment of waste cooking oil for biodiesel production. Chemical Engineering Transactions, 65, 385-
 390. doi: 10.3303/CET1865065
Diya’uddeen, B. H., Abdul Aziz, A. R., Daud, W. M. A. W., & Chakrabarti, M. H. (2012). Performance
 evaluation of biodiesel from used domestic waste oil: A review. Process Safety and Environmental
 Protection, 90(3), 164-179. doi: 10.1016/j.psep.2012.02.005
Dovbeshko, G. I., Gridina, N. Y., Kruglova, E. B., & Pashchuk, O. P. (2000). FTIR spectroscopy studies of
 nucleic acid damage. Talanta, 53(1), 233-246. doi: 10.1016/s0039-9140(00)00462-8
European Committee for Standardization. (2003). EN 14103: Fat and oil derivatives: Fatty Acid Methyl Esters
 (FAME): Determination of ester and linolenic acid methyl ester contents. Brussels: Author.
Fonseca, J. M., Cardozo-Filho, L., Teleken, J. G., Silva, C. (2018). Ethyl esters from waste oil: Reaction data of
 non-catalytic hydroesterification at pressurized conditions and purification with sugarcane bagasse ash.
 Journal of Environmental Chemical Engineering, 6(4), 4988-4996. doi: 10.1016/j.jece.2018.07.044
Fonseca, J. M., Teleken, J. G., Almeida, V. C., Silva, C. (2019). Biodiesel from waste frying oils: Methods of
 production and purification. Energy Conversion and Management, 184, 205-218. doi:
 10.1016/j.enconman.2019.01.061
Food and Agriculture Organization of the United Nations. (2017). Food outlook: Biannual report on global
 food markets. Retrieved from https://bit.ly/3lG2y5c
Freitas, F. B. A., Câmara, M. Y. F., & Martins, D. F. F. (2015). Determinação do PCZ de adsorventes naturais
 utilizados na remoção de contaminantes em soluções aquosas. Blucher Chemistry Proceedings, 3(1), 1-8.
 Retrieved from https://bit.ly/32NMVRA
 Acta Scientiarum. Technology, v. 43, e51303, 2021
Adsorption waste oil treatment Page 13 of 18

Gregg, S. J., & Sing, K. S. W. (1982). Adsorption, surface area and porosity (2nd ed.). Cambridge, MA:
 Academic Press.
Gupta, V. K., & Suhas (2009). Application of low-cost adsorbents for dye removal: A review. Journal of
 Environmental Manage, 90(8), 2313-2342. doi: 10.1016/j.jenvman.2008.11.017
Kikuchi, Y., Qian, Q., Machida, M., & Tatsumoto, H. (2006). Effect of ZnO loading to activated carbon on Pb
 (II) adsorption from aqueous solution. Carbon, 44(2), 195-202. doi: 10.1016/j.carbon.2005.07.040
Liu, K., Lin, X., Yue, J., Li, X., Fang, X., Zhu, M., Lin, J., Qu, Y., & Xiao, L. (2010). High concentration ethanol
 production from corncob residues by fed-batch strategy. Bioresource Technology, 101(13), 4952-4958. doi:
 10.1016/j.biortech.2009.11.013
Lopes, C. W., Bertella, F., Pergher, S. B. C., Finger, P. H., Dallago, R. M., & Penha, F. G. (2013). Síntese e
 caracterização de carvões ativados derivados do sabugo de milho. Perspectiva, 37(139), 27-35.
 Recuperado em 20 jan. 2017 de https://bitlybr.com/8LKldA
Maddikeri, G. L., Pandit, A. B., & Gogate, P. R. (2012). intensification approaches for biodiesel synthesis
 from waste cooking oil: A review. Industrial & Engineering Chemistry Research, 51(45), 14610-14628.
 doi: 10.1021/ie301675j
Manique, M. C., Faccini, C. S., Onorevoli, B., Benvenutti, E. V., & Caramão, E. B. (2012). Rice husk ash as an
 adsorbent for purifying biodiesel from waste frying oil. Fuel, 92(1), 56-61. doi: 10.1016/j.fuel.2011.07.024
Martini, J., Delalibera, H. C., & Weirich Neto, P. H. (2012). Consumption of soybean oil preheated by diesel
 engine. Revista Brasileira de Agrociência, 18(2-4), 213-220.
Miyashiro, C. S., Bonassa, G., Schneider, L. T., Parisotto, E. I. B., Alves, H. J., & Teleken, J. G. (2018).
 Evaluation of different adsorbents for acidity reduction in residual oil. Environmental Technology, 40(11),
 1438-1454. doi: 10.1080/09593330.2017.1422807.
Moruzzi, R. B., Lima, V. B., Colombo, R., Conceição, F. T., & Lanza, M. R. V. (2014). Remoção do ácido
 mefenâmico em água utilizando carvão ativado em pó, lama vermelha e oxidação com cloro. Química
 Nova, 37(10), 1594-1599. doi: 10.5935/0100-4042.20140269.
Nascimento, R. F., Lima, A. C. A., Vidal, C. B., Melo, D. Q., & Raulino, G. S. C. (2014). Adsorção: aspectos
 teóricos e aplicações ambientais. Fortaleza, CE: Edições UFC.
Neves, C. V., Scheufele, F. B., Nardino, A. P., Vieira, M. G. A., Silva, M. G. C., Módenes, A. N., & Borba, C. E.
 (2018). Phenomenological modeling of reactive dye adsorption onto fish scales surface in the presence of
 electrolyte and surfactant mixtures. Environmental Technology, 39(19), 2467-2483.
 doi: 10.1080/09593330.2017.1356876.
Öztürk, T., & Esen, B. (2013). Physical and mechanical properties of some hybrid corn varieties.
 International Journal of Agricultural and Biological Engineering, 6(1), 111-116.
Pavia, D. L., Lampman, G. M., Kriz, G. S., & Vyvyan, J. A. (2010). Introdução à espectroscopia. São Paulo, SP:
 Cengage Learning.
Rocha Junior., J. G., Santos, M. D. R., Madeira, F. B., Rocha, S. F. L. S., Bauerfeldt, G. F., Silva, W. L. G.,
 Salomão, A. A., & Tubino, M. (2019). Influence of fatty acid methyl ester composition, acid value, and
 water content on metallic copper corrosion caused by biodiesel. Journal of Brazilian Chemical Society,
 30(8), 1751-1761. doi: 10.21577/0103-5053.20190078
Ruthven, D. M. (1984). Principles of adsorption and adsorption processes. Hoboken, NJ: John Wiley & Sons.
Schneider, L. T., Bonassa, G., Alves, H. J., Meier, T. R. W., Frigo, E. P., & Teleken, J. G. (2017). Use of rice
 husk in waste cooking oil pretreatment. Environmental Technology, 40(5), 594-604. doi:
 10.1080/09593330.2017.1397772
Shafeeyan, M. S., Wan Daud, W. M. A., Houshmand, A., & Shamiri, A. (2010). A review on surface
 modification of activated carbon for carbon dioxide. Journal of Analytical and Applied Pyrolysis, 89(2),
 143-151. doi: 10.1016/j.jaap.2010.07.006
Silva, F. A. M., Borges, M. F. M., & Ferreira, M. A. (1999). Methods for assessing the degree of lipid oxidation
 and antioxidant capacity. Química Nova, 22(1), 94-103. Retrieved from https://bit.ly/3lC5a3V.
Silvério, H. A., Flauzino Neto, W. P., Dantas, N. O., & Pasquini, D. (2013). Extraction and characterization of
 cellulose nanocrystals from corncob for application as reinforcing agent in nanocomposites. Industrial
 Crops and Products, 44, 427-436. doi: 10.1016/j.indcrop.2012.10.014
 Acta Scientiarum. Technology, v. 43, e51303, 2021
Page 14 of 18 Bavaresco et al.

Smidt, E., & Meissl, K. (2007). The applicability of Fourier transform infrared (FT-IR) spectroscopy in waste
 management. Waste Management, 27(2), 268-276. doi: 10.1016/j.wasman.2006.01.016
Souza, N. E., Matsushita, M., & Visentainer, J. V. (2012). Ácidos graxos: estrutura, classificação, nutrição e
 saúde. Arquivos da Apadec, 2(2), 102-107. Retrieved from https://bit.ly/3kxrREV
Sud, D., Mahajan, G., & Kaur M. P. (2008). Agricultural waste material as potential adsorbent for
 sequestering heavy metal ions from aqueous solutions – A review. Bioresource Technology, 99, 6017-6027.
 doi: 10.1016/j.biortech.2007.11.064
Talebian-Kiakalaieh, A., Amin, N. A. S., & Mazaheri, H. (2013). A review on novel processes of biodiesel
 production from waste cooking oil. Applied Energy, 104, 683-710. doi: 10.1016/j.apenergy.2012.11.06.
Teixeira, A. S. (1998). Alimentos e alimentação dos animais. Lavras, MG: UFLA-FAEPE.
Ullah, Z., Bustam, M. A., & Man, Z. (2015). Biodiesel production from waste cooking oil by acidic ionic liquid
 as a catalyst. Renewable Energy, 77, 521-526. doi: 10.1016/j.renene.2014.12.040
Vaughan, T., Seo, C. W., & Marshall, W. E. (2001). Removal of selected metal ions from aqueous solution
 using modified corncobs. Bioresource Technology, 78, 133-139. doi: 10.1016/s0960-8524(01)00007-4
Vieitez, I., Callejas, N., Irigaray, B., Pinchak, Y., Merlinski, N., Jachmanián, I., & Grompone, M. A. (2014).
 Acid value, polar compounds and polymers as determinants of the efficient conversion of waste frying oil
 to biodiesel. Journal of the American Oil Chemists’ Society, 91(4), 655-664. doi: 10.1007/s11746-013-2393-y
Xia, W., & Budge, S. M. (2017). Techniques for the analysis of minor lipid oxidation products derived from
 triacylglycerols: epoxides, alcohols, and ketones. Comprehensive Reviews in Food Science and Food Safety,
 16, 735-758. doi: 10.1111/1541-4337.12276
Weber, W. J., & Smith, E. H. (1987). Simulation and design models for adsorption processes. Environmental
 Science & Technology, 21(11), 1040-1050. doi: 10.1021/es00164a002
Yaakob, Z., Mohammad, M., Alherbawi, M., Alam, Z., & Sopian, K. (2013). Overview of the production of
 biodiesel from waste cooking oil. Renewable and Sustainable Energy Reviews, 18, 184-93. doi:
 10.1016/j.rser.2012.10.016

 Acta Scientiarum. Technology, v. 43, e51303, 2021
Adsorption waste oil treatment Page 15 of 18

 Supplementary Material
 Table S1. Specification of levels of the proposed experimental design (RCCD).

 Factors (Independent
 n -1.68 -1 0 1 1.68
 variables)
 X1 Temperature (°C) 15 17 20 23 25
 X2 Adsorbent Mass (g) 3 3.40 4 4.60 5
 X3 Agitation Speed (rpm) 125 145 175 205 225

 Table S2. Rotational Central Composite Design (RCCD) Matrix.

 Coded Values Real Values
 Tests
 X1 X2 X3 T (°C) A (rpm) m (g)
 1 -1 -1 -1 17 145 3.40
 2 1 -1 -1 23 145 3.40
 3 -1 1 -1 17 205 3.40
 4 1 1 -1 23 205 3.40
 5 -1 1 1 17 205 4.60
 6 1 -1 1 23 145 4.60
 7 -1 1 1 17 205 4.60
 8 1 1 1 23 205 4.60
 9 -1.68 0 0 15 175 4.00
 10 1.68 0 0 25 175 4.00
 11 0 -1.68 0 20 125 4.00
 12 0 1.68 0 20 225 4.00
 13 0 0 -1.68 20 175 3.00
 14 0 0 1.68 20 175 5.00
 15 0 0 0 20 175 4.00
 16 0 0 0 20 175 4.00
 17 0 0 0 20 175 4.00
 Note: Full factorial design (1 to 8), axial points (9 to 14) and central points replicates (15 to 17). Analysis time: 6 h. Amount of oil in each sample: 33 g.

 Figure S1. Flowchart of the procedure of the adsorption tests and statistical analysis of results.
 Source: Author.
 Acta Scientiarum. Technology, v. 43, e51303, 2021
Page 16 of 18 Bavaresco et al.

 Figure S2. Pore size distribution of adsorbents: (CC) Corn Cobs; (CCC) Carbonized Corn Cobs; and (CAC) Commercial Activated
 Carbon.

 Figure S3. pHPCZ analysis of samples of CCC and CAC adsorbent materials.

 Acta Scientiarum. Technology, v. 43, e51303, 2021
Adsorption waste oil treatment Page 17 of 18

 Figure S4. FTIR spectra of residual frying oil before (RFO) and after treatment with the CAC and CCC adsorbents.

 Figure S5. Pareto diagram obtained for the use of CAC over the acidity removal of the RFO.

 Figure S6. Pareto diagram obtained with the use of CCC over the acidity removal of the RFO.
 Acta Scientiarum. Technology, v. 43, e51303, 2021
Page 18 of 18 Bavaresco et al.

Figure S7. Adsorption kinetics of acidity removal of the RFO by the CAC and CCC adsorbents (in the best conditions of RCCD: CAC – T
 = 23°C; M = 4.6 g; and A = 145 rpm; CCC – T = 20°C; M = 5.0 g; and A = 175 rpm).

 Figure S8. Influence of adsorbent mass over the acidity reduction by the CAC and CCC adsorbents in the best conditions obtained in
 the RCCD.

 Acta Scientiarum. Technology, v. 43, e51303, 2021
You can also read