The Chennai Water Crisis: Insufficient rainwater or suboptimal harnessing of runoff?
←
→
Page content transcription
If your browser does not render page correctly, please read the page content below
GENERAL ARTICLES

The Chennai Water Crisis: Insufficient
rainwater or suboptimal harnessing of runoff?
Sumant Nigam*, Alfredo Ruiz-Barradas and Agniv Sengupta

Chennai experienced acute water shortage during 2019 summer, and four years prior, an early-
winter deluge. Analysis of 116 years (1901–2016) of rainfall in Chennai Sub-basin shows a weak
climate change signal: Winter monsoon rainfall, has slightly increased, especially in December.
The much larger Cauvery basin to the south also exhibits a nondescript climate change signal in
winter rainfall. Late summer (September) rainfall in the Cauvery Basin has, however, precipitously
declined in recent years (1987–2016). We show that this decline, as well as the mid-20th century
increase, are attributable to natural multidecadal climate variability (Atlantic Multidecadal Oscil-
lation) – cautioning against cavalier attributions of recent-period trends and the Chennai Water
Crisis to climate change. Analysis of runoff – the rainwater leftover after its hydrologic and atmos-
pheric processing – shows that harnessing even half of the winter monsoon runoff in the Chennai
Sub-basin can satiate the city’s water demand for about seven months; and without needing new
reservoir facilities. The present analysis suggests that Chennai’s water woes arise not from
insufficient rainwater, but from the suboptimal harnessing of related runoff.

Keywords:       Climate change, monsoon rainfall, multidecadal variability, river basin, runoff.

THE Coromandel Coast – long defined, geographically, as               variations are similarly phased – the case, perhaps, in
the coastal plains of southeastern Peninsular India backed            2019.
by the Eastern Ghats to the west and the Bay of Bengal to                Lately, Chennai has witnessed both floods and severe
the east, and bounded by the Krishna and Cauvery river                water scarcity. The heavy rainfall in late November–early
deltas to the north and south respectively – could have as            December of 2015 led to a deluge1 and significant loss of
well been defined, climatologically, as the coastal region            life and property2,3. The severe water shortage in the early
of eastern Peninsular India receiving peak rainfall in                summer of 2019 – the Chennai Water Crisis – originated
October and November, i.e., during the northeast (NE)                 in the large winter rainfall deficit in 2018 and its subse-
winter monsoon. This, unlike the rest of the Indian sub-              quent compounding by the late arrival of summer rains
continent, including the Malabar Coast – Coromandel’s                 the following year4. Although impressive, such hydrocli-
counterpart on the west coast, abutted by Western                     mate variability is not uncommon in the Coromandel as
Ghats – where the southwest (SW) summer monsoon                       the NE monsoon is more variable than the SW monsoon
rules the seasonal distribution of rainfall. Chennai, a bus-          due both to its shorter duration (leading to greater im-
tling coastal metropolis of more than 10 million people,              pacts of onset and retreat variations) and greater exposure
lies in the middle section of the Coromandel.                         to intraseasonal variabilities, such as Madden–Julian
   Although Coromandel Coast receives peak rainfall in                Oscillation, which is more robust in winter with impres-
October and November, its summer months are far from                  sive footprints over Peninsular India5. The high ratio of
dry. The region also includes the lower courses of several            the interannual standard deviation to climatology in
east-flowing rivers whose headwaters in the Western                   winter rainfall attests to the larger interannual variability
Ghats and Deccan Plateau (i.e. summer monsoon-exposed                 of the NE monsoon6–8.
regions) generate resiliency to the vagaries of the                      Chennai is not located on the banks of a major river
monsoon; except when summer and winter monsoon                        and, as such, dependent on rainfed reservoirs and, lately, on
                                                                      groundwater for its water supply9, and on wetlands for
Sumant Nigam, Alfredo Ruiz-Barradas and Agniv Sengupta are in the     natural drainage. The four rainfed reservoirs/lakes
Department of Atmospheric and Oceanic Science, University of Mary-    (Poondi, Cholavaram, Redhills and Chembarambakkam)
land College Park, USA; Sumant Nigam was a Fulbright-Nehru Fellow
                                                                      have a combined 15-yr (2005–2019) average-fill of
at the Indian Institute of Technology, Mandi 175 001, India during
2020; Agniv Sengupta is currently at the Jet Propulsion Laboratory,   ~175 × 106 m3 in December and January10. Storage was
California Institute of Technology, Pasadena, USA.                    down to ~11 × 106 m3 (~17% average-fill) in December
*For correspondence. (e-mail: nigam@umd.edu)                          2018–January 2019 following the weak 2018 winter
CURRENT SCIENCE, VOL. 120, NO. 1, 10 JANUARY 2021                                                                               43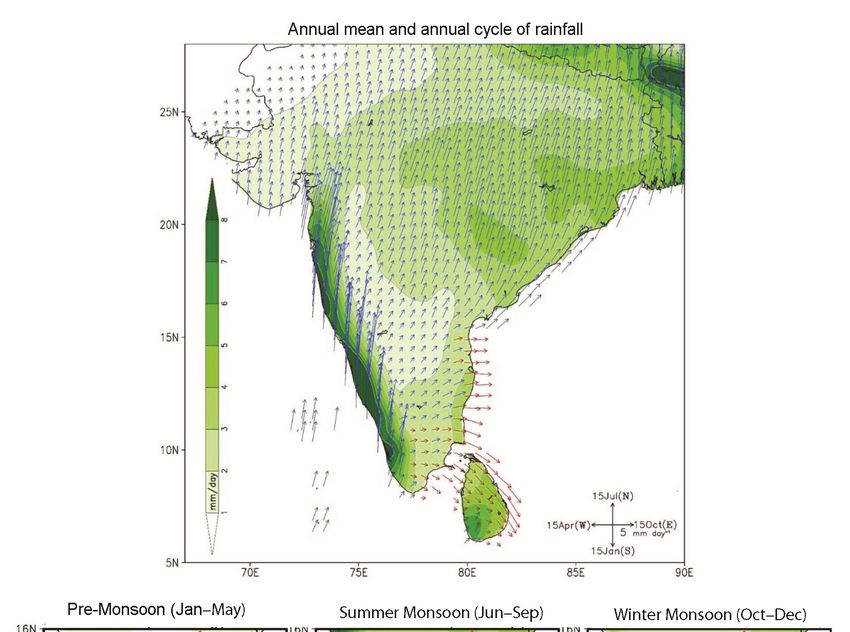
GENERAL ARTICLES

monsoon, and precipitously down to ~0.5 × 10⁶ m3 (
GENERAL ARTICLES
has its headwaters in the Western Ghats, while Ponnaiyar, highlights the multidecadal fluctuations in the 1901–2016
Palar and Penner rivers have their source in the Deccan record.
Plateau.
Rainfall analysis
Precipitation and runoff
Spatiotemporal distribution of rainfall
Rain gauge-based monthly precipitation on a 0.25° conti-
nental grid for the period 1901–2016 was from the Harmonic analysis of climatological monthly rainfall
German Meteorological Service’s (DWD) Global Precipi- yields the annual mean (contoured) and annually varying
tation Climatology Centre (GPCC, ver. 8)26. Rain gauge- (arrows) components of rainfall7,37 (Figure 2, top).
based data from India Meteorological Department (IMD, Annual-mean rainfall is notably large (7–8 mm/day) in
ver. 4)27 was also used in select inter-comparisons. This the northeast and along the west coast (Konkan and
daily data (1901–present) is based on ~7800 stations and Malabar), but modest (2–4 mm/day) over southeastern
gridded on a 0.25°-grid. Peninsular India. The arrows succinctly portray the sea-
Runoff was obtained from the Global Runoff (GRUN) sonality (i.e. monsoonal nature) of rainfall, with July
reconstruction dataset (ver. 1)28, where in situ streamflow being the peak rainfall month across most of the subcon-
observations (from Global Streamflow Indices and tinent, reflecting the pervasive influence of the SW sum-
Metadata archive) train a machine learning algorithm that mer monsoon. The red-arrow region in Figure 2 indicates
predicts monthly runoff rates based on antecedent preci- rainfall peaks in October–December. This early-winter
pitation and temperature (from Global Soil Wetness rainfall is from the NE monsoon which brings moisture
Project Phase-3 meteorological forcing dataset). The from the Bay of Bengal via low-level northeasterlies7.
ensemble mean of 50 GRUN reconstructions obtained The red-arrow region effectively outlines the Coromandel
from training with different data subsets has been used Coast, as noted in the introduction. The winter monsoon
here; monthly runoff is available on a 0.5° grid during also prevails over Sri Lanka, except for its southwest
1902–2014 from https://figshare.com/articles/GRUN_ corner.
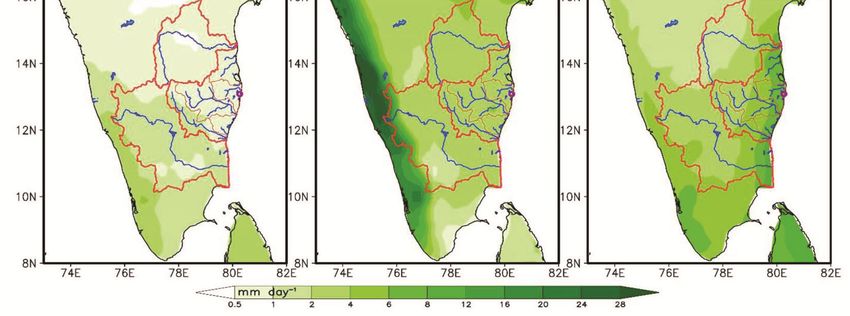
Global_Runoff_Reconstruction/9228176. The rainfall distribution in the pre-summer monsoon,
summer monsoon and winter monsoon periods is overlaid
on the river basins of Peninsular India (Figure 2, lower
Basin rainwater receipts panels). The Coromandel receives rainfall from the win-
ter monsoon (6–8 mm/day) and from the summer mon-
Basin rainwater receipts were obtained by multiplying soon (2–4 mm/day). The Chennai Sub-basin gets twice as
rainfall on the 0.25° continental grid by the grid-cell much rainfall in early winter as summer. The pre-
area, followed by integration over the discretized basin monsoon period (January–May) is the dry period over the
using the GrADS asum function, which implicitly Eastern Basin, including the Chennai Sub-basin. The
accounts for the variation of the grid-cell area with lati- Cauvery basin gets more rainfall during the winter mon-
tude. soon, but the Penner basin receives more during the
summer monsoon.
Multidecadal climate variability
Climatological basin rainfall and rainwater receipts
The attribution of recent period rainfall trends requires
factoring for multidecadal climate variability. Atlantic Figure 3 shows the monthly variation of average rainfall
Multidecadal Oscillation (AMO) and Pacific Decadal and rainwater volume received in each basin. Table 1
Oscillation are two major modes of sea surface tempera- notes the period accumulations. Basin-averaged rainfall
ture (SST) variability whose influence extends to the generally increases from late spring to early winter, with
Indian subcontinent; their influence on summer monsoon only the Cauvery basin exhibiting a secondary peak in
rainfall is well documented29–31, but not the influence on July. Rainfall in the Penner basin – the northernmost –
winter monsoon. The AMO was tracked using the peaks in September, i.e. at the tail end of the SW mon-
NOAA-AMO index32, defined as the linearly detrended, soon. Peak rainfall in the other basins occurs during the
area-averaged SST anomaly in the North Atlantic (75°– winter monsoon: in October in the Cauvery and Eastern
5°W, EQ-60°N). The index was smoothed with the basins, and in November in the Chennai Sub-basin.
LOESS filter using a 15% span window (LOESS-15)33; Basin rainfall is largest in the Chennai Sub-basin, as it is
the span is ~17 years for the 1901–2016 record, which is most exposed to the coastally focused NE winter
approximately one-fourth of AMO’s estimated period monsoon.
(50–70 years)34–36. By suppressing the subseasonal-to- The volume of rainwater received in each basin –
interannual-to-decadal variabilities, the LOESS-15 filter the basin rainwater receipts – depends both on
CURRENT SCIENCE, VOL. 120, NO. 1, 10 JANUARY 2021 45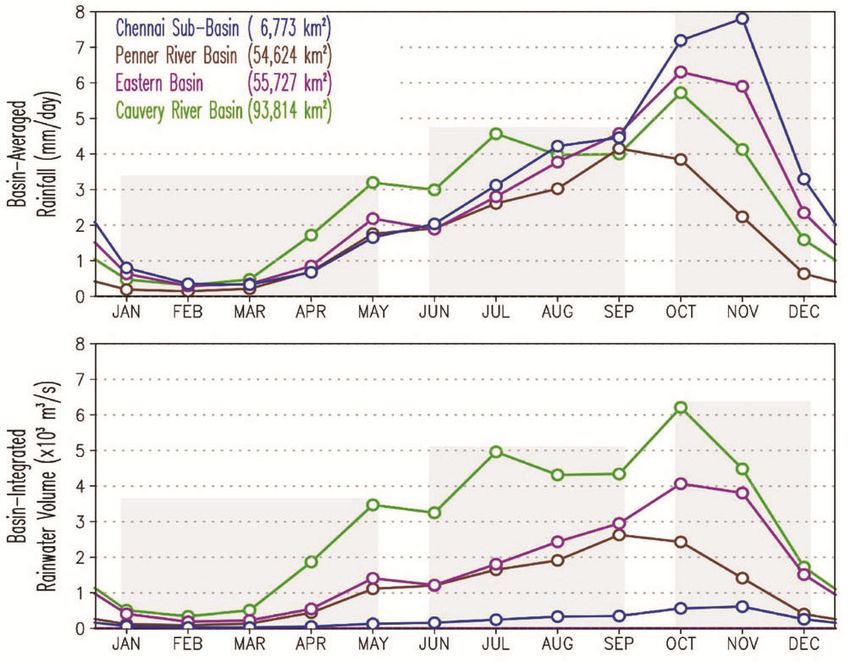
GENERAL ARTICLES

          Figure 2. Climatological rainfall over the Indian subcontinent. (Upper panel) Arrows represent the annual cycle (first
          harmonic) and contours the annual mean (mm/day) of rainfall. The arrow scale and phase convention are shown in the
          lower-right corner; arrows pointing north indicate July as the peak rainfall month, and so on. Arrows in red mark regions
          receiving peak rainfall during October–December, i.e. during the northeast winter monsoon. Arrows are plotted when their
          amplitude is ≥0.75 mm/day. Contouring and shading interval as in the colour bar on the left. (Lower panel) Climatological
          rainfall over southern Peninsular India, with blue and red lines denoting the main rivers and their basin boundaries, fol-
          lowing Figure 1. The 1901–2016 GPCC rainfall climatology is analysed. The fields are shown after four applications of
          smth9 in GrADS.

basin-averaged rainfall and basin area. Cauvery, with the                • Large basins with deep extensions into the interior
largest area (93,814 km2), is the clear frontrunner in all                 (e.g. Cauvery, Penner, Palar and Ponnaiyar) receive
calendar months (Figure 3, lower panel). In early sum-                     more rainwater during summer monsoon.
mer, its rainwater receipts are more than twice as large as              • Smaller, coastally confined basins (e.g. Naidupet,
the Penner and Eastern basins, and many times larger                       Chennai and Varahanadhi), on the other hand, receive
than the Chennai Sub-basin, which because of its small                     significantly more rainwater during winter monsoon.
size (6,773 km2) ranks the lowest even in early winter                     For example, Chennai Sub-basin receives ~38% of its
when it has the largest rainfall. Other notable features                   annual water from the summer monsoon, but as much
include (also from Table 1):                                               as ~51% from the winter monsoon.

• Cauvery basin is unique because of exposure to both                    The amount of rainwater received in the Chennai
  monsoons.                                                              Sub-basin is compared with the average-fill volume of

46                                                                                CURRENT SCIENCE, VOL. 120, NO. 1, 10 JANUARY 2021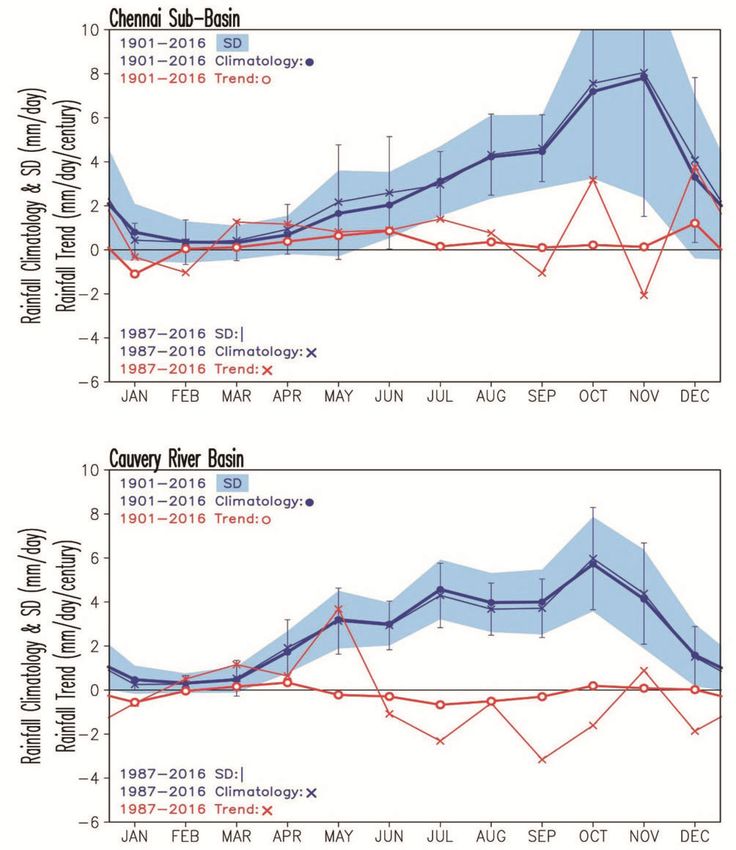
GENERAL ARTICLES

CURRENT SCIENCE, VOL. 120, NO. 1, 10 JANUARY 2021                 47
GENERAL ARTICLES

Chennai’s four rainfed reservoirs, annual recruitment of                perspective of rainfall, the controlling element of atmos-
the Cauvery and Krishna waters, and, above all, Chennai                 pheric and terrestrial water cycles. The rainfall decline in
city’s potential water needs and current supply in the                  January – significant, as it is a dry month (
GENERAL ARTICLES
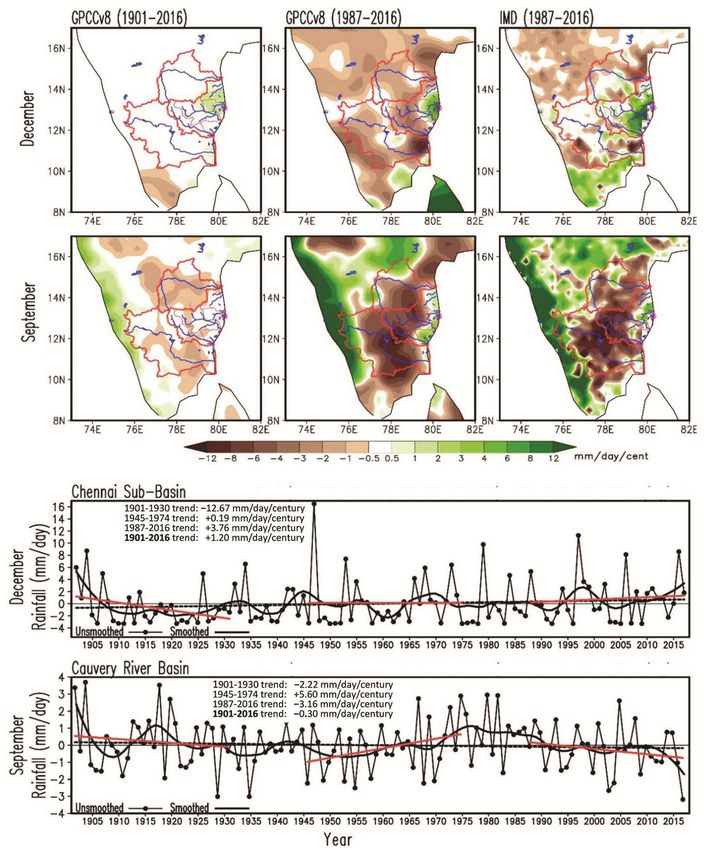
Figure 5. Rainfall trends over Southern Peninsular India. Linear trends are shown in December (first row) (top) and September
(second row); recent trends – most positive in the Chennai Sub-basin in December and most negative in the Cauvery basin in Sep-
tember (cf. Figure 4) – motivate the month choice. Trends are shown over 1901–2016 (left) and 1987–2016 (middle, right), the lat-
ter from both GPCCv8 and IMDv4 data; all in units of mm/day/century following the brown–green shading scale. Basin-
averaged rainfall anomalies (i.e. departures from normal) during 1901–2016 are plotted for the Chennai Sub-basin in December
(third row) and the Cauvery basin in September (last row). The thick black curve shows smoothed rainfall anomalies (from
LOESS-15% filtering of the 116-yr yearly record) in the lower panels. Both long-period (black dashed line) and short-period (thin
red line) rainfall trends in the unsmoothed record are marked and noted.
more than a 10% reduction in July rainfall in the 20th Spatiotemporal distribution of rainfall trends
century. January is also a challenging month for this
basin from the superposition of a significant negative The centennial trends are positive over the Chennai (and
trend on weak climatological rainfall. The recent period Naidupet) Sub-basin in December but nondescript in Sep-
trends are again larger and more volatile, e.g. Septem- tember (Figure 5, left column). In neighbouring basins,
ber’s large negative trend vis-à-vis modest trend in the trends are nondescript in December but modestly negative
adjacent months. in September, especially in central Penner and eastern
CURRENT SCIENCE, VOL. 120, NO. 1, 10 JANUARY 2021 49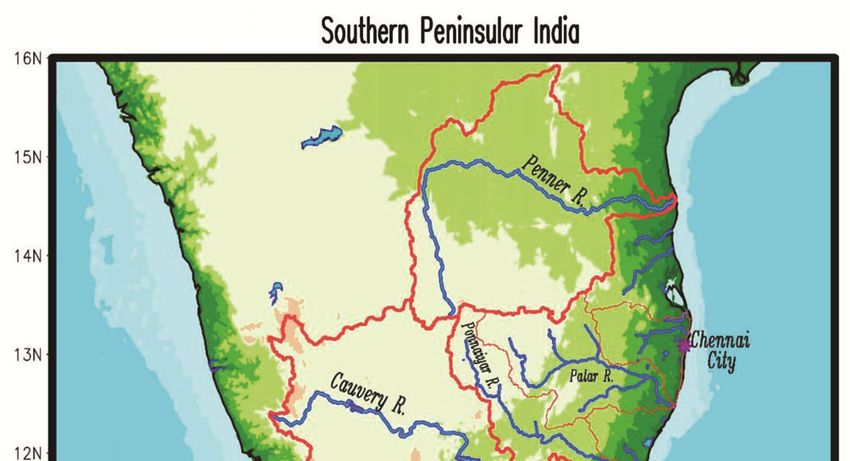
GENERAL ARTICLES

Cauvery basins. The recent period trends (middle–right         rainfall record instead consists of multidecadal periods of
columns) are far more extensive and impressive: They are       varying trends, including opposite signed ones.
positive over the Chennai Sub-basin and stronger in De-           The Cauvery basin rainfall in September (when recent
cember than September. The December trends are more            period trends are most negative, Figure 4) also exhibits
fractured along the coast, with Chennai in the bull’s eye      significant multidecadal variability against the backdrop
of regional wet trends. The surrounding sea of browns in-      of a weakly negative centennial trend (–0.30 mm/day/
dicates significant rainfall decline over the Cauvery and      century; dashed black line). The recent period trend is
Penner, and Ponnaiyar and Palar basins in recent decades,      strongly negative, but it follows a mid-century period
especially in September when the GPCC and IMD trends           (1945–1974) of strongly positive trend (+5.60 mm/day/
are in good agreement. It is intriguing why the Chennai        century), which, in turn, follows an early-century period
Sub-basin and its coastal vicinity are carved out region of    of negative trend (–2.22 mm/day/century). In short,
increasing rainfall in both century-long and recent multi-     multidecadal trends of alternate sign underlie the weakly
decadal periods, especially the latter, when this region is    negative centennial trend.
surrounded by steeply declining rainfall trends.
   A more granular temporal view of rainfall variability is
                                                               Influence of Atlantic Multidecadal Oscillation
shown in the plots of basin-averaged rainfall over 1901–
2016 in Figure 5 (lower panels). Departures from normal
                                                               AMO was tracked using the NOAA–AMO index (blue
(the 116-yr monthly average) are plotted for the Chennai
                                                               line in Figure 6). Its recent variations include cooling of
Sub-basin in December (a wet trend month) and Cauvery
                                                               the North Atlantic basin since the 1950s and its warming
basin in September (a drying trend month). The former
                                                               since the mid-1970s. The AMO’s influence on Peninsular
shows large positive departures, more frequent in the lat-
                                                               rainfall is apparent from Figure 6 (right panels). The De-
ter half of the record. The 2015 December rainfall depar-
                                                               cember rainfall regressions, consisting of positive anoma-
ture, while notably positive, is not as historic as the 2015
                                                               lies over the Chennai and Naidupet basins and negative
Chennai deluge, as it is exceeded by three previous De-
                                                               ones elsewhere, including the Cauvery delta, broadly re-
cember months (1946, 1996, 1978) and nearly equalled
                                                               semble the recent period trends in GPCC rainfall (Figure
by two others (1903, 2005); indicating that the days-to-
                                                               5, top–middle). Likewise, regressions of September
weeks long intense rainfall episodes are not always re-
                                                               rainfall on the AMO index, comprising of large deficits
flected in monthly departures. No less interesting are the
                                                               over Penner and Cauvery basins, closely resemble the
multiyear (3–5) periods of strongly deficient December
                                                               recent period September trends (Figure 5, second row).
rainfall, e.g. 1920–1924, 1947–1951, 1974–1977 and
                                                               These resemblances indicate that the influence of
2002–2004, when negative rainfall anomalies approach
                                                               AMO on Peninsular rainfall is significant and likely
the climatological value (~3.3 mm/day), reflecting little/
                                                               dominant in recent-period trends. The 116-yr correlation
no rainfall in these periods. Unlike large positive depar-
                                                               of the smoothed AMO index with December rainfall
tures that appear sporadic, the large negative ones exhibit
                                                               in the Chennai Sub-basin (+0.23) and September
multiyear coherence.
                                                               rainfall in the Cauvery basin (–0.59) support this assess-
                                                               ment.
Multidecadal variability of rainfall: Atlantic
Multidecadal Oscillation and the climate change                Climate change signal
signal
                                                               The 116-yr-long rainfall record is clearly not sufficient to
Figure 5 (lower panels) highlights the modulation of rain-     encompass multiple cycles of the AMO and as such, the
fall on longer timescales; the smooth black curve captures     trend in this century-plus period – referred to as centenni-
both the multidecadal decline in early 20th century and        al trend here – will include some aliasing of multidecadal
the increasing trend in early 21st century in December         variability, compromising the integrity of centennial
rainfall in the Chennai Sub-basin. The 116-yr trend            trend as a marker of climate change. A more refined
(sloped dashed black line) is +1.20 mm/day/century; the        estimate of the climate change signal in rainfall is devel-
recent 30-yr trend (red line) is also positive but larger      oped by removing the AMO influence from the rainfall
(+3.76 mm/day/century); both consistent with trends in         record. The influence is removed by subtracting the prod-
Figure 4. Rainfall trends in two non-overlapping 30-yr         uct of AMO index (blue curve, Figure 6) and related rain-
sub-records, 1901–1930 (early century) and 1945–1974           fall regressions (right panel, Figure 6) from the smoothed
(mid-century), are strongly negative (–12.67 mm/day/           rainfall record (thick black curve, Figure 6); the AMO-
century) and near zero (+0.19 mm/day/century) respec-          removed rainfall record is shown in Figure 6 by the thin
tively, showing that December rainfall in the Chennai          black curve. The 116-yr trend in the AMO-removed
Sub-basin has not risen monotonically, as may be sug-          December rainfall in the Chennai Sub-basin is +0.80 mm/
gested by its centennial or recent period trends. The          day/century versus +1.20 mm/day/century when the
50                                                                    CURRENT SCIENCE, VOL. 120, NO. 1, 10 JANUARY 2021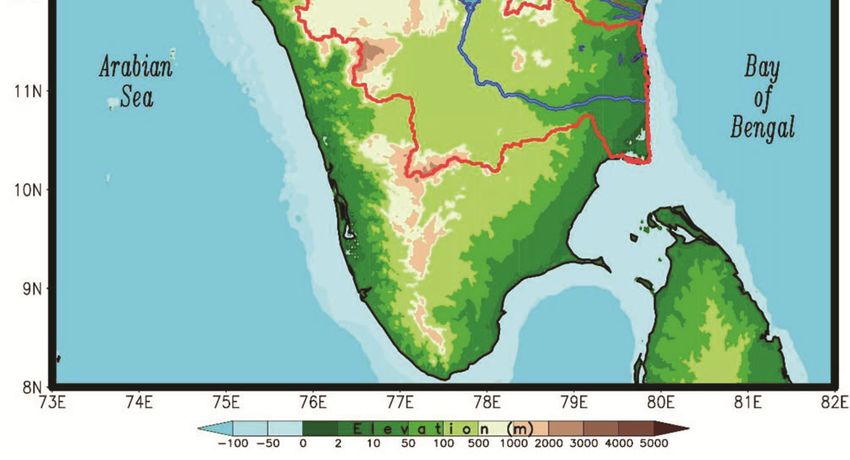
GENERAL ARTICLES
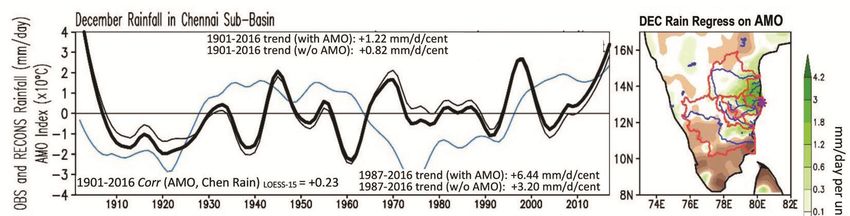
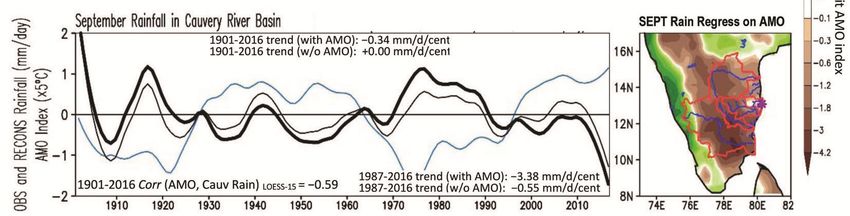
Figure 6. Influence of Atlantic Multidecadal Oscillation (AMO) on Peninsular rainfall. AMO index (LOESS-15%
filtered) is shown in blue in the left panels. Note: Ten times (five times) the index is plotted in the upper (lower) panels.
December (September) rainfall regressions on the AMO index are in the upper (lower) right, with brown/green shading
indicating negative/positive anomalies, in units of mm/day per unit AMO index. The LOESS-15% filtered December rain-
fall anomalies over Chennai Sub-basin are replotted (shown in Figure 5 as well) in the upper left panel using thick black
line, and the same anomalies without AMO influence are shown by thin black line. Likewise, for September rainfall
anomalies in Cauvery basin in bottom left panel. Long-period (1901–2016) and short-period (1987–2016) trends in basin-
averaged rainfall are noted both with and without (w/o) the influence of AMO, in units of mm/day/century (mm/d/cent).
AMO influence is retained. The aliasing of AMO influ- (water- or energy-limited), infiltration (landscape-depen-
ence thus leads to significant overestimation of the cli- dent, but leading potentially to groundwater recharge)
mate change signal in this period. The exclusion of AMO and runoff, which can be harnessed for immediate or later
influence flips the trend sign in September rainfall in the use through storage.
Cauvery basin, from –0.30 to +0.04 mm/day/century. The seasonal cycle of basin-averaged rainfall and
Although AMO-removed trends can be further adjusted runoff in the Chennai Sub-basin shows the May-onward
for potential aliasing of other multidecadal variabilities, increase of rainfall to mark the end of the dry period
this analysis strongly cautions against viewing century- (January–May), but runoff remains minimal (~0.1 mm/
long trends, let alone multidecadal ones, in observed data day) until September (Figure 7). The modest June–
as markers of the climate change signal. August rainfall (~3 mm/day) is evidently insufficient for
The AMO influence is even more impressive on short- generating runoff, principally because of soil moisture
er-period trends: December rainfall in the Chennai Sub- capacitance. Runoff – the rainwater leftover after soil
basin and September rainfall in the Cauvery basin exhibit moisture recharge (and evapotranspiration) – is thus
steep trends during 1987–2016: +6.44 and –3.38 mm/ lagged vis-à-vis rainfall, but only during build-up of the
day/century respectively (Figure 6). Sans AMO influ- rainy season. In the exit phase (December–February),
ence, the same trends are +3.20 and –0.55 mm/day/ runoff variations are near synchronous with rainfall,
century respectively, i.e. smaller by a factor of 2–6; illu- reflecting at-capacity soil moisture.
strating the fallacy of cavalier attributions of recent mul- The runoff-to-rainfall ratio peaks in February (0.41),
tidecadal trends to climate change. i.e. after winter monsoon rainfall when the soil moisture
is at capacity. In the recent period (Figure 7, dashed red
line), it has peaked earlier – in January – at 0.43
Runoff analysis (=0.28/0.65), i.e. at a marginally higher value; the Janu-
ary ratio in the 113-yr climatology is 0.34 (=0.28/0.82), for
Runoff in the Chennai Sub-basin: climatology and reference. The higher runoff-to-rainfall ratio in recent Jan-
trends uary months is potentially interesting. It can arise from a
more saturated soil state resulting from higher rainfall in
The rainwater received is not all available for human the preceding three months in recent decades (Figure 4,
needs. A significant portion is lost to soil moisture re- top) and/or from the land-use land-cover change in recent
charge (especially after dry periods), evapotranspiration decades that generates more runoff from the same
CURRENT SCIENCE, VOL. 120, NO. 1, 10 JANUARY 2021 51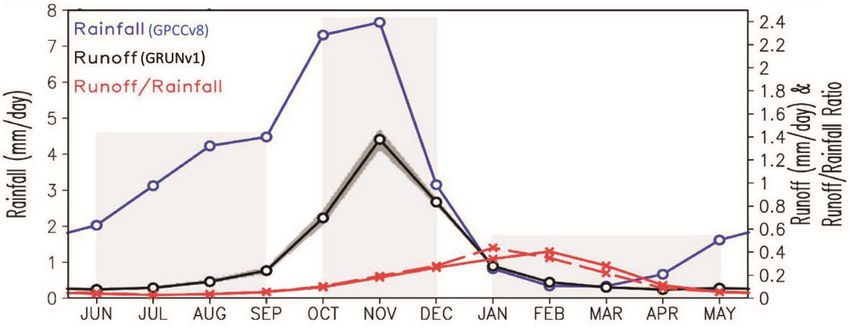
GENERAL ARTICLES

              Figure 7. Seasonal cycle of runoff and rainfall in Chennai Sub-basin. Monthly climatology of runoff (black)
              and rainfall (blue) in the common data period (1902–2014). The basin-averaged runoff to basin-averaged rainfall
              ratio is shown in red. Note the ratio and runoff are shown using the right vertical scale. The standard deviation of
              50 ensemble members about the ensemble-mean runoff (black) provides an estimate of runoff uncertainty; ±1 SD
              spread is shown by grey shaded ribbon. Ratio in the recent 30-yr period (1985–2014) is shown by dashed red line.

rainfall, i.e. a higher ratio. More hydrologic analysis and               runoff in the Chennai Sub-basin (6773 km2) and ignoring
modelling are clearly needed for this attribution.                        direct rain-feed and consumptive withdrawals, it would
                                                                          take ~27 days during winter monsoon to fill these reser-
Surface rainwater in Chennai Sub-basin: limited                           voirs from an empty state to their average-fill state. In
availability or suboptimal management?                                    practice, it would take longer because of the suboptimal
                                                                          harnessing and management of surface water, and be-
Approximately 41 × 106 m3/day of rainwater is received                    cause of consumptive drawdowns. Even a three times
in the Chennai Sub-basin, on average, during the winter                   longer estimate (~81 days) allows attainment of the aver-
monsoon (Table 1), but not all of it is available for                     age-fill state within the 90 day-long winter monsoon
human needs. An estimate of the amount remaining at the                   period.
surface (surface water) after hydrologic and atmospheric                     Table 2 shows that if all of the winter monsoon runoff
processing of rainwater is provided by runoff – the avail-                in the Chennai Sub-basin is harnessed and stored,
able surface rainwater. The average runoff in the Chennai                 it would equal 604 × 106 m3 (=92 days × 6.57 ×
Sub-basin during the winter monsoon is ~0.97 mm/day                       106 m3/day), or ~3.45 times the average-fill of the four
(Figure 7), generating an ‘available’ surface rainwater                   reservoirs. Clearly, not all winter runoff in the Chennai
volume of ~6.57 × 10⁶ m3/day during October–December.                     Sub-basin can be (should be) harnessed or stored. This
Not all runoff can be diverted into reservoirs and lakes,                 cursory analysis, however, suggests that there is potential
nor should it be, as untamed runoff is vital for habitat and              here – to harness more and store more. Can more runoff
ecosystem functioning. The management of surface water                    be harnessed without disrupting ecosystems and habitats?
is, in any case, not optimal. The estimation uncertainty                  While this question is beyond the purview of the present
and harnessing inefficiency notwithstanding, winter mon-                  analysis, the question on the amount of water storage that
soon runoff is a pertinent water metric as harnessing re-                 would make Chennai resilient against monsoon-related
gional runoff is the foremost goal of water resource                      water supply disruptions is tractable.
management. In this context, it is both insightful and                       Lessons from the 2019 Chennai Water Crisis suggest
motivating to express the water stores/resources of the                   that having seven months of the city’s water demand
Chennai Sub-basin and the Chennai city’s water recruit-                   reservoired in January can help cope with monsoon dis-
ment, demand and current supply in units of winter mon-                   ruptions, excluding multi-year ones. The seven month
soon basin-runoff days, even if only a fraction of the                    storage will cover both the January–May dry period and
basin runoff is being (can be) tapped for consumptive                     about half of the summer monsoon period (to cover dis-
needs. This is motivating because it brings an immediate                  ruptions from delayed onsets). At current demand level
awareness of the possibilities.                                           (1,200 MLD), seven month of demand equals ~255 ×
   Table 2 takes a step in this direction. For example, the               106 m3, which is only about ~80% of the full capacity of
December and January average-fill of the four rainfed                     the four reservoirs (=11,257 million cubic feet, or 319 ×
reservoirs supplying water to Chennai is ~175 × 106 m3 or                 106 m3) (ref. 10).
~27 basin-runoff days [=175 × 106/(6.57 × 106)] (ref. 10).                   Chennai’s seven month demand can thus be met by
That is, assuming full harnessing of winter monsoon                       harvesting ~42% (=255/604) of winter monsoon runoff

52                                                                                 CURRENT SCIENCE, VOL. 120, NO. 1, 10 JANUARY 2021
GENERAL ARTICLES
Table 2. Water in the Chennai Sub-basin: Basin-integrated winter monsoon rainwater and runoff are compared with other water resources. Runoff
is the rainwater leftover after hydrologic and atmospheric processing of rainfall. As harnessing runoff is an important goal of water resource
management, the water stores/resources of the region are expressed in units of basin-runoff days
Water in the Chennai Sub-basin during winter
Chennai Sub-basin area: 6,773 km2; Chennai metro area: 173 km2 Equivalent basin-runoff days
Runoff Volume (sub-basin integrated)
GRUNv1, 1901–2014; October–December climatology 6.57 × 10⁶ m3/day 1
Rainwater Volume (sub-basin integrated; Table 1)
GPCCv8, 1901–2016; October–December climatology 41.18 × 10⁶ m3/day ~6
Average-fill of Chennai’s four reservoirs
Poondi, Cholavaram, Redhills, and Chembarambakkam
2005–2019, December–January average1 ~175 × 106 m3 ~27
Krishna Water2
Permitted uptake (via Telugu Ganga Canal) ~425 × 106 m3 ~65
2019 Receipt ~45 × 106 m3 ~7
2020 Receipt3 ~166 × 106 m3 ~25
Cauvery Water4
From Mettur Dam via Veeranam Lake
April 2019 delivery (piped) ~0.17 × 10⁶ m3/day ~0.03
Desalination Yield5
From Minjur and Nemmeli plants ~0.2 × 10⁶ m3/day ~0.03
Chennai City Water Demand6
Median estimate:1200 million litres/day (MLD) ~1.20 × 10⁶ m3/day ~0.18
Chennai City Water Supply7
Peak supply estimate: 850 MLD ~0.85 × 10⁶ m3/day ~0.13
Rainwater Harvesting8
2017 estimate (339 million cubic feet) 9.6 × 10⁶ m3 ~1.46
1
Computed from data at Chennai Metropolitan Water Supply and Sewage Board (CMWSSB); http://123.63.203.150/public/lake.htm
2
The Indian Express, 10 January 2019 (ref. 14).
3
5850 million cubic feet (mcft) of Krishna water released. The Times of India, 22 February 2020; https://timesofindia.indiatimes.com/
city/chennai/with-5-85-tmcft-of-krishna-water-realised-so-far-chennais-water-supply-can-last-6-months/articleshow/74251398.cms
4
The Times of India, 20 April 2019 (ref. 15).
5
Minjur and Nemmeli salination plants; CMWSSB (ref. 16).
6
Chennai’s water demand estimates vary by a factor of 2: From ~0.5 mcft/day (or 0.14 × 10⁶ m3/day) by The Times of India (20 April 2019; ref. 15)
to ~1200 MLD by CMWSSB, and ~1,300 MLD by others (https://www.futuredirections.org.au/publication/india-chennai-confronts-another-water-
crisis/).
7
FutureDirections.org.au (26 June 2019; https://www.futuredirections.org.au/publication/india-chennai-confronts-another-water-crisis/).
8
Water Management in Chennai; https://en.wikipedia.org/wiki/Water_management_in_Chennai#cite_note-TH_VanishingWaterbodies-2
in the Chennai Sub-basin. To offset reservoir losses greenhouse gases as well as regional land-use land-cover
(especially evaporative), more would need to be change.
harvested and stored: while existing reservoir capacity Analysis of the 1901–2016 rainfall record in the Chen-
will permit additional storage, can more (or even 42%) nai Sub-basin – an ~6700 km2 region that surrounds and
runoff be harvested? Chennai’s water woes certainly do includes the ~173 km2 Chennai Metro Area – shows
not stem from limited water warehousing capacity. insignificant (but positive) trends in monsoon rainfall,
except in June and December when the trends (still posi-
tive) are notable. Natural climate variability, exemplified
Concluding remarks by Atlantic Multidecadal Oscillation, contributes to these
trends, especially multidecadal ones, cautioning against
Southeastern India experienced acute water shortages cavalier attributions of recent-period trends and the
during the summer of 2019, headlined by the Chennai Chennai Water Crisis to climate change.
Water Crisis. Just four years prior, the same region was Runoff – the rainwater leftover after its hydrologic and
in the news for the late November–early December de- atmospheric processing – can be harnessed for immediate
luge that led to significant loss of life and property. As or later use through storage. Analysis of objectively
this section of the Coromandel Coast, which receives obtained and observationally constrained (by river basin
~50% of annual rainfall in winter, reels from the impact discharge) estimates of runoff in the Chennai Sub-basin
of extreme rainfall swings, questions on the origin of shows low values during summer monsoon because of
these extremes have arisen, in particular, on the anthro- modest rainfall and soil-moisture recharge (from the pre-
pogenic contribution from rising global concentration of ceding season being dry). The runoff-to-rainfall ratio
CURRENT SCIENCE, VOL. 120, NO. 1, 10 JANUARY 2021 53GENERAL ARTICLES
rises steadily during winter monsoon, from ~0.1 to 6. Krishnamurthy, L. et al., Causes and probability of occurrence of
~0.3. extreme precipitation events like Chennai 2015. J. Climate, 2018,
31(10), 3831–3848; see figure 1.
A novel water metric is introduced to increase aware- 7. Sengupta, A. and Nigam, S., The northeast winter monsoon over
ness of the runoff harvesting potential: Water stores/ the Indian subcontinent and Southeast Asia: evolution, interannual
resources in the Chennai Sub-basin and Chennai city’s variability, and model simulations. J. Climate, 2019, 32, 231–249;
water recruitment, demand and supply are expressed in see figures 2 and 3.
units of winter monsoon basin-runoff days, even if 8. Sengupta, A., Sea surface temperature-based statistical prediction
of South Asian summer monsoon rainfall distribution, Ph.D.
only a fraction of the basin runoff is being (can be) har- thesis, University of Maryland Graduate School, College Park,
vested for consumptive needs. For example, Chennai’s USA, 2019, p. 164; see figure 3.2.
daily water demand is equivalent to ~0.18 days of winter 9. Kumar-Rao, A., India’s water crisis could be helped by better
monsoon runoff in the Chennai Sub-basin, while the building, planning. National Geographic, 15 July 2019;
city’s four reservoirs can be filled to their December and https://www.nationalgeographic.com/environment/2019/07/india-
water-crisis-drought-could-be-helped-better-building-planning/
January average-fill level using ~27 days of the Chennai 10. Chennai Metropolitan Water Supply and Sewage Board;
Sub-basin’s runoff. http://123.63.203.150/public/lake.htm
It is shown that harnessing and storing ~42% of winter 11. Sikka, D. R., Some aspects of the large scale fluctuations of sum-
monsoon runoff in the Chennai Sub-basin can fulfil about mer monsoon rainfall over India in relation to fluctuations in the
seven months (January–July) of Chennai city’s water planetary and regional scale circulation parameters. Proc. Indian
Acad. Sci. Earth Planet Sci., 1980, 89, 179–195.
demand, covering the dry period (January–May) and buf- 12. Rasmusson, E. M. and Carpenter, T. H., The relationship
fering the impact of delayed monsoon onsets (June and between eastern equatorial Pacific sea surface temperatures and
July). It is furthermore shown that storing this runoff will rainfall over India and Sri Lanka. Mon. Weather Rev., 1983, 111,
not require new warehousing facilities as the four reser- 517–528.
voirs currently supplying water to Chennai city 13. Nikku, B. R., Water rights, conflicts and collective action: case of
Telugu Ganga Project, India. Presentation at the Tenth Biennial
can store ~42% of the winter runoff at just 80%-full Conference of the International Association for the Study of
capacity. Common Property, Mexico, 2005; http://dlc.dlib.indiana.
Can 42% of the winter runoff in the Chennai Sub-basin edu/dlc/bitstream/handle/10535/1094/Nikku_Water_040513_Paper-
be harvested? Answering this question is difficult, but 088.pdf
working backwards from the reservoirs’ average-fill state 14. The New Indian Express, 10 January 2019; https://www.
newindianexpress.com/states/andhra-pradesh/2019/jan/10/chennai-
(175 × 106 m3) yields ~29% harvesting fraction, assuming may-not-get-full-quota-of-krishna-water-from-ap-in-2019-1923178.
reservoirs are fed by winter runoff but not direct rainfall. html
Even if this is an overestimate, harvesting 42% of the 15. The Times of India, Chennai City Edition, 20 April 2019;
winter runoff no longer seems beyond the realm of possi- https://timesofindia.indiatimes.com/city/chennai/veeranam-lake-
bilities. turns-a-major-water-supplier-for-the-city/articleshow/68960792.cms
16. Minjur (https://chennaimetrowater.tn.gov.in/desalination.html) and
In short, Chennai city’s water woes arise not from in- Nemmeli (https://chennaimetrowater.tn.gov.in/desalination-Nemmeli.
sufficient rainwater in the regional sub-basin, but sub- html)
optimal harnessing of related runoff. The present analysis 17. Gopalakrishnan, S., Water warriors of Chennai. India Water Por-
supports the notion ‘Metro cities in India are rain-rich but tal, 19 March 2014; https://www.indiawaterportal.org/articles/water-
water-starved’39, or its more nuanced version, ‘Metro warriors-chennai-ragade-and-raghavan
18. Jayaraman, N., Viewpoint: Why India’s Chennai has run out of
cities are in runoff-rich regions but water-deprived none- water. BBC, 2 July 2019; https://www.bbc.com/news/world-asia-
theless’. india-48797399
19. Frayer, L., The water crisis in Chennai, India: who’s to blame and
how do you fix it? National Public Radio, 18 July 2019;
https://www.npr.org/sections/goatsandsoda/2019/07/18/742688141/
1. Mishra, A. K., Monitoring Tamil Nadu flood of 2015 using satel- the-water-crisis-in-chennai-whos-to-blame-how-do-you-fix-it
lite remote sensing. Nat. Hazards, 2016, 82, 1431–1434; 20. Amante, C. and Eakins, B. W., ETOPO1 1 arc-minute Global
doi:10.1007/s11069-016-2249-5 Relief Model: procedures, data sources, and analysis. NOAA
2. The Economist, Next time by water. 12 December 2015; Technical. Memo NESDIS NGDC-24, 2009, p. 25.
https://www.economist.com/asia/2015/12/12/next-time-by-water 21. BfG, Major river basins of the world, Global runoff data Centre,
3. Narasimhan, B., Bhallamudi, S. M., Mondal, A., Ghosh, S. and Federal Institute of Hydrology, Germany, 2007.
Mujumdar, P., Chennai floods 2015: a rapid assessment. Interdis- 22. FAO, AQUAMAPS Global Spatial Database on Water and Agri-
ciplinary Centre for Water Research, Indian Institute of Science, culture: rivers/water bodies. Food and Agriculture Organization,
Bengaluru, 2016. Rome, Italy.
4. Patel, K., Water Shortages in India, NASA’s Earth Observatory, 23. Lehner, B., Hydro HydroSHEDS, Technical documentation, ver-
19 June 2019; https://earthobservatory.nasa.gov/images/145242/ sion 1.2. Conservation Science Program, World Wild Life Fund,
water-shortages-in-india USA, 2013, p. 25.
5. Sreekala, P. P., Vijaya Bhaskara Rao, S., Rajeevan, K. and Aruna- 24. Wang, Y. Q., MeteoInfo: GIS software for meteorological data
chalam, P. P., Combined effect of MJO, ENSO and IOD on the visualization and analysis. Meteorol. Appl., 2016, 21, 360–368;
intraseasonal variability of northeast monsoon rainfall over south https://doi.org/10.1002/met.1345.
peninsular India. Climate Dyn., 2018; https://doi.org/10.1007/ 25. Grid Analysis and Display System (GrADS), COLA, George
s00382-018-4117-3. Mason University, Fairfax, VA; http://cola.gmu.edu/grads/
54 CURRENT SCIENCE, VOL. 120, NO. 1, 10 JANUARY 2021GENERAL ARTICLES
26. Schneider, U., Becker, A., Finger, P., Meyer-Christoffer, A. and 34. Nigam, S., Guan, B. and Ruiz-Barradas, A., Key role of the Atlantic
Ziese, M., GPCC Full Data Monthly Product Version 2018 at multidecadal oscillation in 20th-century drought and wet periods
0.25°: Monthly land-surface precipitation from rain gauges built over the Great Plains. Geophys. Res. Lett., 2011, 38, L16713,
on GTS-based and historical data; doi:10.5676/DWD_GPCC/ https://doi.org/10.1029/2011GL048650.
FD_M_V2018_025. 35. Kavvada, A., Ruiz-Barradas, A. and Nigam, S., AMO’s structure
27. Pai, D. S., Sridhar, L., Rajeevan, M., Sreejith, O. P., Satbhai, N. S. and climate footprint in observations and IPCC AR5 climate simu-
and Mukhopadhyay, B., Development of a new high spatial reso- lations. Climate Dyn., 2013, doi:10.1007/s00382-013-1712-1.
lution (0.25° × 0.25°) Long period (1901–2010) daily gridded 36. Nigam, S., Sengupta, A. and Ruiz-Barradas, A., Atlantic–Pacific
rainfall data set over India and its comparison with existing data links in observed multidecadal SST variability: is Atlantic multi-
sets over the region. Mausam, 2014, 65(1), 1–18. decadal oscillation’s phase-reversal orchestrated by Pacific decadal
28. Ghiggi, G., Humphrey, V., Seneviratne, S. I. and Gudmundsson, oscillation? J. Climate, 2020, 33, 5479–5505.
L., GRUN: An observations-based global gridded runoff dataset 37. Nigam, S. and Ruiz-Barradas, A., Seasonal hydroclimate variability
from 1902 to 2014. Earth Syst. Sci. Data Discuss, 2019, over North America in Global and Regional Reanalyses and AMIP
doi:https://doi.org/10.5194/essd-2019-32 simulations: varied representation. J. Climate, 2006, 19, 815–837.
29. Zhang, R. and Delworth, T. L., Impact of Atlantic multidecadal 38. Trenberth, K. E. and Jones, P. D., Climate Change 2007: The
oscillations on India/Sahel rainfall and Atlantic hurricanes. Physical Science Basis (eds Solomon, S. et al.), Cambridge Uni-
Geophys. Res. Lett., 2006, 33, L17712. versity Press, 2007, pp. 235–336.
30. Krishnamurthy, L. and Krishnamurthy, V., Decadal scale oscilla- 39. Raghavan, S., Rainwater Harvesting – The Success Story of
tions and trend in the Indian monsoon rainfall. Climate Dyn., Chennai, 2018; http://site.ieee.org/indiacouncil/files/2018/08/p30-
2014, 43, 319–331. p34.pdf
31. Nigam, S., Zhao, Y., Ruiz-Barradas, A. and Zhou, T., The south-
flood north-drought pattern over Eastern China and the drying of
the Gangetic Plain: observations, simulations, and origin. In Cli-
mate Change: Multidecadal and Beyond (eds Ghil, M. et al.), ACKNOWLEDGEMENTS. We acknowledge the support of the
World Press, 2016, p. 376. Ministry of Earth Sciences, Government of India, through a Monsoon
32. Enfield, D. B., Mestas-Nuñez, A. M. and Trimble, P. J., The Mission grant. Sumant Nigam was also supported by the Fulbright-Nehru
Atlantic multidecadal oscillation and its relation to rainfall and Fellowship from the Fulbright Foundation, US-India Educational Founda-
river flows in the continental US. Geophys. Res. Lett., 2001, 28, tion (USIEF), and the Indian Institute of Technology, Mandi.
2077–2080; https://doi.org/10.1029/2000GL012745.
33. Cleveland, W. S. and Loader, C. L., Smoothing by local regres-
sion: principles and methods. In Statistical Theory and Computa- Received 26 June 2020; revised accepted 19 October 2020
tional Aspects of Smoothing (eds Haerdle, W. and Schimek, M.
G.), Springer, 1996, pp. 10–49; doi https://doi.org/10.1007/978-3-
642-48425-4_2 doi: 10.18520/cs/v120/i1/43-55
CURRENT SCIENCE, VOL. 120, NO. 1, 10 JANUARY 2021 55You can also read