Centrifuge Modeling and the Analysis of Ancient Landslides Subjected to Reservoir Water Level Fluctuation - MDPI
←
→
Page content transcription
If your browser does not render page correctly, please read the page content below
sustainability

Article
Centrifuge Modeling and the Analysis of Ancient
Landslides Subjected to Reservoir Water
Level Fluctuation
Songlin Li, Qiang Xu *, Minggao Tang, Huajin Li, He Yang and Yong Wei
 State Key Laboratory of Geohazard Prevention and Geoenvironment Protection, Chengdu University of
 Technology, No. 1 East Third Road, Erxianqiao, Chengdu, Sichuan 610059, China; lsl68@foxmail.com (S.L.);
 tomyr2008@163.com (M.T.); Huajinlee@yahoo.com (H.L.); yanghexq@163.com (H.Y.);
 ceweiyong@hotmail.com (Y.W.)
 * Correspondence: xq@cdut.edu.cn

 Received: 12 February 2020; Accepted: 2 March 2020; Published: 9 March 2020

 Abstract: Landslides are among the most severe natural hazards with significant impacts in human
 life and infrastructure. The Three Gorges Reservoir Area (TGRA) is vulnerable to landslides because of
 the geological environment and human activities. A centrifuge model test of a landslide with a planar
 sliding surface in the TGRA was conducted. Based on the multiple monitoring systems composed of
 a 3D laser scanner, pore water pressure transducers, particle image velocimetry and earth pressure
 sensors, multiphysical data were obtained. The work described here had the objective of researching
 the long-term deformation pattern of this kind of landslide that was subjected to periodic fluctuations
 in the reservoir water level. The results indicated that the failure processes were characterized by
 progressive retrogression and cracks caused by the reservoir drawdown. Transverse tensile cracks
 first appeared in the submerged zone of the slope. The front part of the slope was dominated by
 horizontal displacement, while the consolidation and compaction deformation in the vertical direction
 dominated at the mid-rear part of the slope. When the water level dropped again, the front part
 slid down and fell into the river, but the mid-rear part had no obvious deformation and exhibited
 a phenomenon of self-stabilization. Moreover, the phreatic line is a concave shape directed into
 the slope during reservoir filling and converts to a convex shape pointing out of the slope during
 reservoir drawdown. The earth pressures in the slope vary with the failure process of the landslide.
 Good agreement is obtained for the deformation characteristics between the experimental results and
 those of prototype landslides.

 Keywords: Centrifuge test; Landslides; Three Gorges Reservoir Area; Impoundment and drawdown;
 Deformation characteristic

1. Introduction
     Reservoir landslides have gradually become an important issue in engineering geology and
geotechnical engineering after the occurrence of the Vajont landslide in Italy [1–4]. Reservoir-induced
catastrophic landslides often cause huge losses in human life and infrastructure, such as the landslides
in the Clyde reservoir [5], Revelstoke reservoir [6], Yesa Reservoir and Three Gorges Reservoir [7,8].
The Three Gorges Reservoir Area (TGRA) has been a landslide-prone area since ancient times due to
geological environment and precipitation. In addition, a large number of landslides reactivated after the
impoundment of the Three Gorges Reservoir, such as the Qiangjiangping landslide, Shuping landslide
and Baishuihe landslide [9–12]. These landslides are characterized by large areas and damage to
property, such as causing cracks in roads and houses. Currently, the TGRA is still facing great challenges
of geological hazard prevention and geological environmental protection [13–15], as are Xiluo Du and
Xianjiaba in Southwest China [16].

Sustainability 2020, 12, 2092; doi:10.3390/su12052092                      www.mdpi.com/journal/sustainability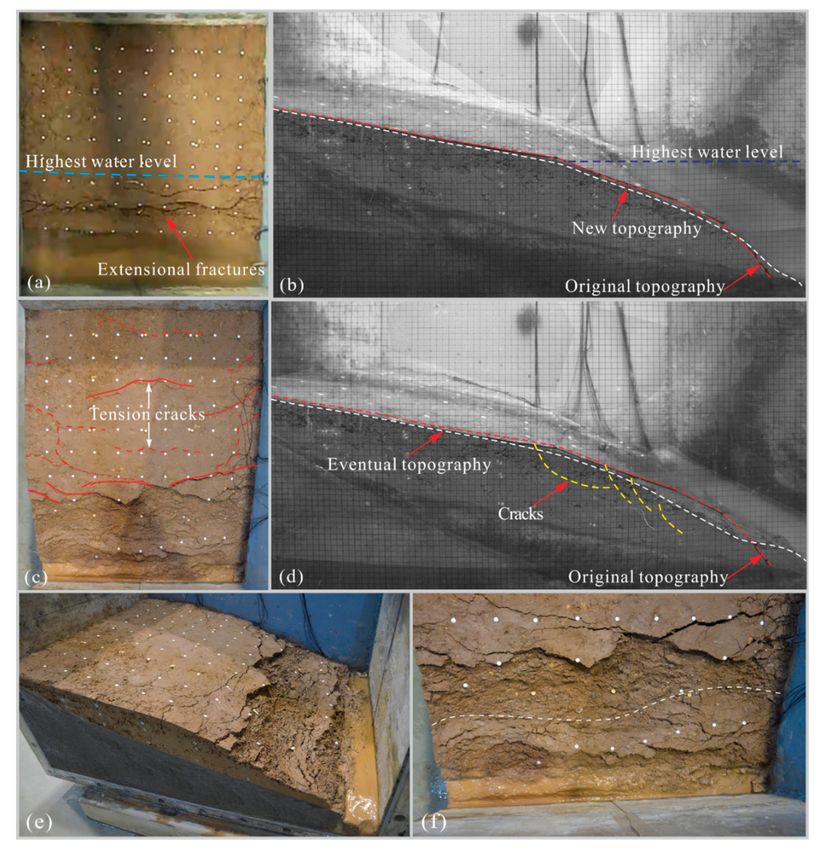
Sustainability 2020, 12, 2092                                                                          2 of 19

      The reservoir water level fluctuated from 145 m in elevation during the flood season to 175 m
afterwards, resulting in the reactivation of approximately 800 landslides 12 years after the first
impoundment in 2003 [15,17,18]. Seventy percent of the reactivated landslides exhibited severe
deformation during the drainage period; however, approximately 16% of the landslides deformed
during the filling stage [15]. A large number of previous studies have shown that the deformation
characteristics of these landslides are affected by the hydraulic conditions (e.g., the fluctuation rate
of the water level) and the material properties (e.g., permeability and mechanical strength) [19–21].
However, further efforts are needed to evaluate the behavior of the macro-geological model. In particular,
the number of landslides reached its maximum within three years after the first impoundment and
then decreased gradually after several years, and the mechanism is still not well understood.
      As a consequence, centrifugal model testing has important advantages in researching landslide
deformation because of the reproduction of the gravity stress field [22,23]. It is a widely held view that
centrifugal model tests have a good effect on exploring the infiltration of rainwater and the deformation
mechanism of rainfall-induced landslides [24–26]. Furthermore, the seismically induced landslides that
focus on the landslide acceleration response and its failure patterns have been widely studied through
centrifuge tests [27,28]. In addition, the exploitation of the physical interpretation of deformation behavior
for loess landslides and submarine landslides via centrifugal model tests has widely been reported [29–31].
      However, limited writers have drawn on systematic research into the deformation pattern of
landslides subjected to reservoir water level fluctuations using centrifugal model tests [32]. In a
previous study, the reduction in the shear strength of the slip zone soil plays an important role in the
failure process, and hydrodynamic pressure produced by rapid drawdown can reduce the slope stability
further [33,34]. The landslides in the Wudongde Reservoir area are also mainly affected by the rapid
drainage of the reservoir and exhibit the characteristics of retrogressive failure [35]. However, systematic
results have yet to be obtained for reservoir-induced landslides adopting centrifugal tests because
of the difficulty in controlling the water level [36,37]. Moreover, a limited number of such studies
on the long-term evolution of landslides subjected to multicycle fluctuations in reservoirs have been
specifically explored.
      The work described here had the objective of evaluating the deformation pattern and long-term
evolution of the landslide with a planar sliding surface. Based on multiple monitoring systems
composed of a 3D laser scanner, pore water pressure transducers, particle image velocimetry (PIV),
and pore water pressure and earth pressure sensors, multiphysical data were obtained. The tests with
two-cycle periods of impoundment and drawdown were conducted. It indicated that the landslide was
reactivated primarily by the hydrodynamic pressure produced by the rapid drawdown in reservoir
water level, and the deformation process made the soil in the mid-rear slope more compact, which may
lead to the self-stabilizing phenomena of these parts. The findings of this study will also facilitate
comprehensive research on the deformation mechanism and evolution of reservoir-induced landslides.

2. Geological Background
     The Three Gorges Reservoir Area is situated at the junction of the Sichuan Basin and the
Middle-Lower Yangtze plains (Figure 1), and a series of arc fold structural assemblages are generally
present in regional geological structures. As a consequence, the TGRA includes complex geological
settings [38,39]. The total lengths of the riversides of the reservoir are approximately 600 km. It has
commonly been assumed that the fluctuation in the reservoir level and precipitation are the dominant
factors causing the reactivation of landslides. Moreover, landslides are typically susceptible to the
presence of slope structures that dip toward the slope free face (i.e., consequent slope), whereas, a few
failures tend to occur where structures dip into the slope (i.e., reverse slope) [40–43].
     In this paper, landslides with planar sliding surfaces are selected as the reference prototype
(Figure 2), which accounts for 30% of all landslides in the TGRA. The landslides mainly occurred
in the consequent slope of monoclinal stratified rocks with low and moderate dip angles, such as
from Fengjie to Yunyang and Fengdu to Fuling (Figure 1). The Damian landslide is typical of this
Sustainability 2020, 12, 2092                                                                                 3 of 19

kind, and the Maoxuzi, Nigutang, and Zhulinwan landslides are of this kind. These accumulative
landslides are mainly deformed by the drawdown of the reservoir. In recent years, the monitoring
results show that the deformation of these landslides is weakening year by year, showing an obvious
self-stabilization characteristic.

      Figure 1. The distribution of landslides with planar sliding surfaces in the Three Gorges Reservoir Area.

      Figure 2. (a) The panoramic photograph of the Damian Landslide (the landslide boundary is depicted
      with the dashed red line) and (b) the exposed planar sliding surface at the rear edge.
Sustainability 2020, 12, 2092                                                                                 4 of 19

3. Materials and Methods

3.1. Principles of Centrifuge Modeling
     It is known that small-scale physical modeling in the normal gravity field has an unavoidable
deficiency in that the stress-strain behaviors in the field are not similar to those of the model. In
contrast to the normal physical modeling test, a geotechnical centrifuge can avoid the problem by
providing an acceleration field N times greater than Earth’s gravity [27]. As a consequence, each soil
particle or water droplet in the model slope will weigh N times greater and ensure the similarity of
effective stresses and groundwater pressures at equivalent depths between the model and prototype.
According to the principle of similarity, assuming a centrifuge acceleration of N gs, where g is the
gravitational acceleration, the major scaling factors can be determined, as shown in Table 1 [44,45].

                                Table 1. Similarity criterion for centrifuge model tests.

                 Type               Physical Quantity             Dimension           Centrifuge Model (ng)
                                         Length                      L                        1/n
        Physical dimension
                                      Displacement                   L2                        n2
                                         Density                    ML−3                        1
                                       Unit weight                 ML−2 T−2                    n3
        Material properties             Cohesion                   ML−1 T−2                     1
                                  Internal friction angle            –                          1
                                          Stress                   ML−2 T−2                     1
                                          Strain                     –                         1
              Seepage                 Seepage time                   T                        1/n2
             parameters              Seepage velocity               LT−1                      1/n

3.2. Centrifuge Facility
     The TLJ-500 geotechnical centrifuge facility, which was jointly manufactured by Chengdu
University of Technology and China Academy of Engineering Physics, and established at 2013 in
Chengdu University of Technology, as shown in Figure 3b, was utilized in this study. The centrifuge has
an effective rotation radius of 4.5 m and a maximum capacity of 500 g tons, and the other specifications
of the apparatus are shown in Table 2. In addition, the model slope topography was scanned by 3D
laser scanning before and after the test (Figure 3c).

      Figure 3. (a) Overview of the centrifuge model, (b) the appearance of the TLJ-500 geotechnical centrifuge
      and (c) application of the hand-held 3D laser scanner after the experiment.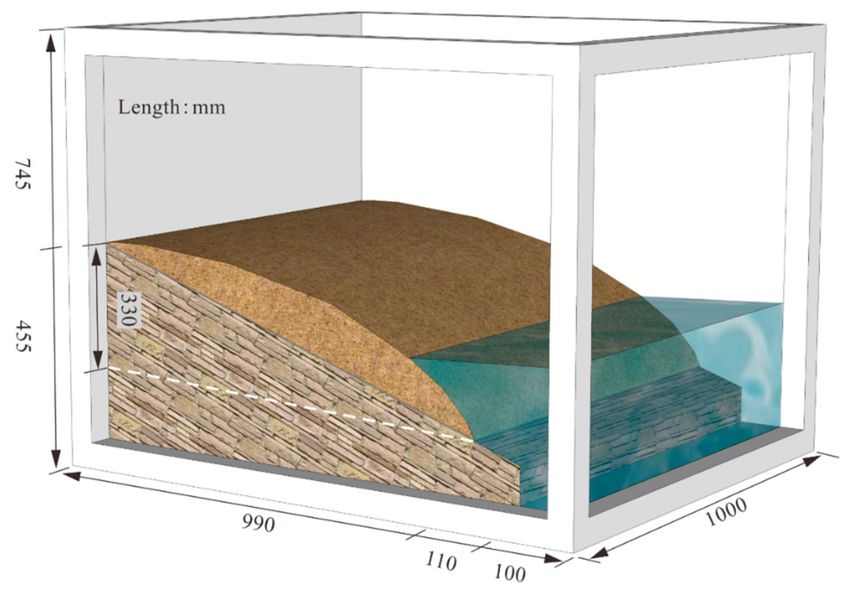
Sustainability 2020, 12, 2092                                                                                      5 of 19

                                Table 2. Specific parameters of the centrifuge apparatus.

                                 Effective Radius                                       4.50 (m)
                      Space of the utilized box (L × W × H)                    1200 × 1000 × 1000 (mm)
                         Allowable weight of the model                                 500 (kg)
                                  Test capacity                                         80 (g/t)
                       Maximum centrifugal acceleration                                 500 (g)

3.3. Materials

3.3.1. Soil Material
     The soil materials used to create the slope model were taken from the field of the Damian
landslide, which occurred in Jurassic red strata along the An’ping bank slope in the TGRA (Figure 1).
The scaling relations of centrifuge modeling have been strictly established. The air-dried soil sample
was pulverized, and gravel particles beyond the size of 2 cm were removed. Figure 4 shows the particle
size distributions of soil materials in this dissertation.

                        Figure 4. Particle size distributions of soil materials in this dissertation.

      The strength of the prototypical sliding body is obtained by collecting the data from the field in
situ shear test in the corresponding investigation. The shear strength of the soil used to create the slope
model under different moisture contents was obtained through the conventional direct shear test in
the laboratory. Afterwards, a moisture content value close to the field strength is adopted. The bulk
density of the soil prepared to create the slope model was tested, and the soil properties were obtained
as shown in Table 3.

                 Table 3. Physical and mechanical properties of the soil materials used in this study.

                      Density         Water            Cohesion        Internal Friction          Permeability
    Soil Type
                      (g/cm3)       Content (%)         (kPa)              Angle (◦ )          Coefficient (10−6 m/s)
       Clay              2.1              14              32.8                22.5                      1.6

3.3.2. Measurement System
     The multiple monitoring systems composed of seven pore water pressure transducers (P), two
high-speed digital cameras and seven earth pressure sensors (E) in this test. Ps and Es were embedded
along two longitudinal sections, as shown in Figure 5. The Ps measure pore pressure up to 1 MPa with
a resolution of 0.2 kPa. One of them was fixed at the bottom of the river to monitor the reservoir water
level. The Es, with a measurement range of 0-1 MPa, were arranged to measure the earth pressure.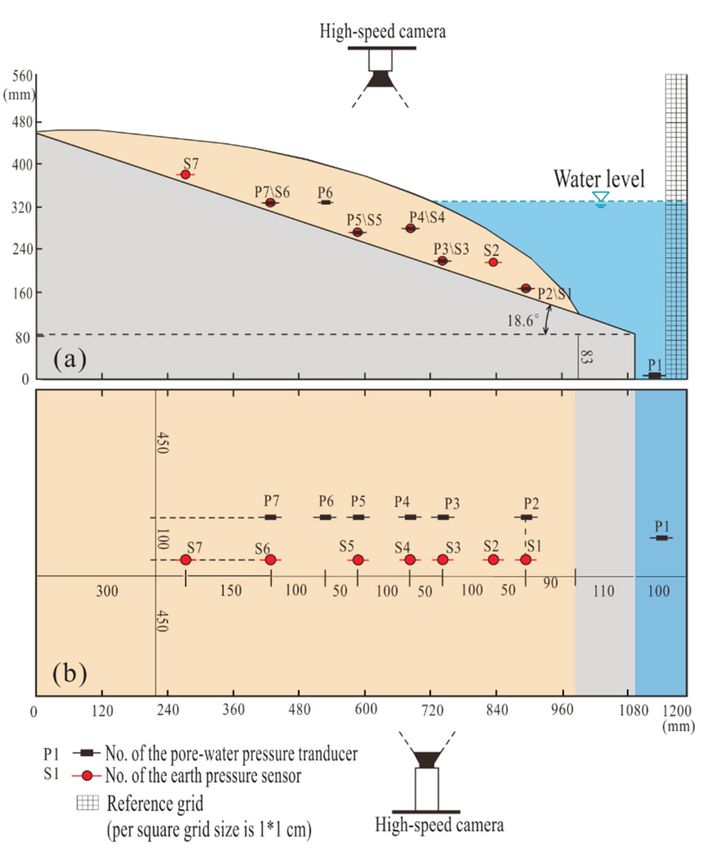
Sustainability 2020, 12, 2092                                                                           6 of 19

The Ps and Es all recorded data in real-time two times per second. A 5-megapixel camera was mounted
on top of the model box to record videos; the other camera was installed on the side of transparent
glass used to photograph the slope section during the test, and several marking points were placed in
the slope section. The PIV technique, which has been commonly applied to compute the displacement
or velocity in geotechnical engineering, was implemented to determine the displacement of the model
through the free PIV software PIVlab [46].

      Figure 5. Schematic view of the model setup and location of the instrumentation: (a) front view and
      (b) top view.

     In addition, the model was scanned by a hand-held 3D laser scanner with high accuracy and
resolution before and after the test (Figure 3c), and the vertical displacement of the model surface
could be obtained. Thumbtacks with a diameter of 10 mm that can be identified as calibration points
by applying Polyworks 10.0 software were arranged on the model slope surface.

3.4. Methods

3.4.1. Construction of the Model
     The large-scale centrifugal model was carried out on the largest model box in this laboratory.
The size of the box is 1.2 m × 1.0 m × 1.2 m, the size of the landslide model is 99 cm (long) × 1 m (wide)
× 33 cm (high), and the conceptualized model is shown in Figure 6. Because the sliding zone was
too thin to conform to the similarity criteria to affect the deformation process, the sliding zones were
not simulated.
Sustainability 2020, 12, 2092                                                                      7 of 19

                            Figure 6. 3D illustration and the size of the centrifuge test model.

     First, the quality of soil and water needed was calculated, and the soil sample and water were
evenly mixed in agreement with the proportion to achieve the designed water content. Next, the model
was constructed layer by layer according to the contours of the soil layers, which were drawn on
the lateral walls of the model box. In addition, the lubricant oil was brushed on the lateral walls of
the model box to reduce the frictional force at the boundary. Additionally, the marking points and
transducers were placed at the designed positions when the soil layers reached the corresponding
heights. Ultimately, the model was covered with a thin film and cured for 24 h. In summary,
the schematic workflow of the conducted experiments is shown in Figure 7.

                      Figure 7. The schematic workflow diagram of the conducted experiments.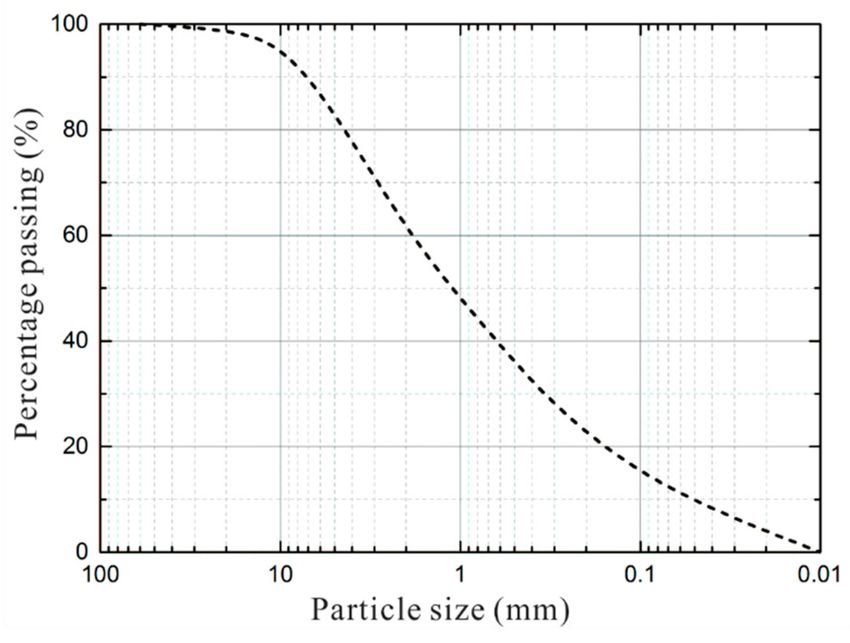
Sustainability 2020, 12, 2092                                                                       8 of 19

3.4.2. Test Procedure
     First, the steel plates of the counterweight and model box were hoisted to the centrifuge apparatus.
Second, the centrifuge was accelerated to 40 g in 10 g increments and then maintained. Excessive increase
of centrifugal acceleration will lead to the deformation of the slope model. The water-diversion devices
consisted of tubing fixed on the arm and extending into the box and a water pump, which was arranged
in the centrifuge chamber. When the acceleration increased and stabilized at 40 g, assuming that
the model reached the steady state, reservoir filling was performed constantly, and the deformation
behavior of the model was observed.
     When the acceleration gradually increased and stabilized at 60 g, the drain valve was opened
after adding water to the designed height. The fluctuation rate of reservoir water level has
the greatest influence on landslide deformation and it should be carefully implemented. After
approximately 16 minutes, the reservoir started to impound again when the water level dropped
to 20 cm. To inspect whether the model has stronger endurance ability, the acceleration eventually
increased to 80 g. The reservoir filling and drawdown were performed again for approximately one
hour at 80 g. Finally, the acceleration decreased to zero. During the test process, the impoundment
and drawdown rates were approximately uniform, corresponding to the actual rates of 2 m/d and
1 m/d, respectively, in which the Three Gorges Reservoir was controlled to 0.8–2 m/d and 0.6–1.5 m/d.
Therefore, the fluctuation rate of the reservoir level is in good agreement with the actual situation.

4. Results

4.1. Spatiotemporal Evolution of Deformation
     During the test, the deformation behaviors of the slope were continuously observed and recorded
by the high-speed digital camera. At the beginning of the centrifuge acceleration test, the slope had a
uniform settlement of approximately 0.5 mm, which was mainly caused by consolidation. This result
indicated that no obvious deformation behavior occurred during the period. At 4050 secs, the reservoir
level reached a maximum height of 33 cm, and the model also had no obvious deformation in this
period. This result is mainly due to the infiltration of water and the hydrodynamic pressure directed
into the slope, which is conducive to increasing the stability of the slope.
     Then, the water level began to fall for the first time. At 5250 secs, transverse tensile cracks
(Figure 8a) occurred at the front of the model. With constant drawdown, the cracks expanded and
penetrated rapidly, which led to the formation of a fracture zone with a width of approximately
20–30 mm (Figure 8c). At 5340 secs, the water level dropped to a low level with an elevation of 20 cm.
In the meantime, the vertical deformation of consolidation and compaction were dominant at the
middle and rear parts.
     During the second impoundment process, there was no obvious deformation. The water level
began to fall for the second time at 7200 secs after the water level had risen again to its highest level.
As the drawdown continued, the frontal sliding body in the wading area continued to slide along the
original fracture zone, showing partial collapse and sliding with a sliding depth of approximately
20–50 mm that was shallow on both sides, with a depth ranging from approximately 10–30 mm
(Figure 8f). And, only the front submerged part of the landslide collapsed and fell into the river
at the end of the test (Figure 8e). The whole sliding process lasted for approximately 13 minutes,
while no obvious deformation behavior occurred at the middle-rear part of the slope. According to the
deformation evolution characteristics of the landslide, the landslide type is a typical hydrodynamic
pressure landslide. It presents obvious self-adjusting and self-stabilizing phenomena for the mid-rear
parts of the landslide, and this phenomenon is very common in the actual bank slope.
Sustainability 2020, 12, 2092 9 of 19
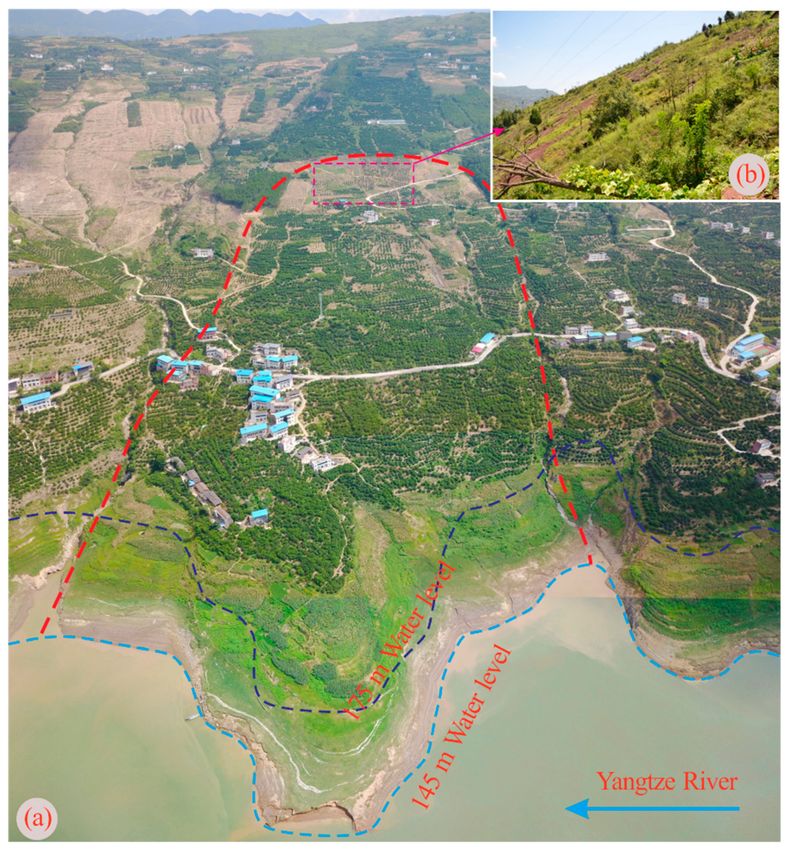
Figure 8. Deformation characteristics of landslides in different periods: (a) deformation characteristics
of the slope surface after the first drawdown, (b) real-time image of the slope profile after the first
drawdown, (c) deformation characteristics of the slope surface after the second drawdown, (d) real-time
image of the slope profile after the second drawdown, (e) overall view of the slope eventually and (f)
deformation characteristics of the slope toe.
4.2. Displacement Response
The PIV technique based on image processing was utilized to acquire the displacement vector
fields. The images of the slope section were obtained twice per second by the high-speed camera.
The displacement vector fields of the slope section during different periods are shown in Figure 9.
In the initial period of the experiment, a small vertical displacement in the middle part increased
gradually with increasing centrifugal acceleration, which was the normal consolidation behavior of
soil, and small horizontal displacement appeared.
The displacement vector field of the landslide in the early period of the first drawdown are
shown in Figure 9b. It can be seen that the displacements of the mid-rear part included both vertical
subsidence and horizontal deformation, and the vertical displacement predominates and is not caused
by centrifugal acceleration compared to that of the first reservoir filling. The deformation of the
frontal part was dominated by horizontal displacement. In the later period of the first drawdown,
the deformation of the mid-rear part decreased gradually (Figure 9c). Consequently, the deformation
process made the soil in the mid-rear slope more compact, which may lead to the self-stabilizing
phenomena of these parts.Sustainability 2020, 12, 2092 10 of 19
Figure 9. Landslide displacement vectors varying with time. (a) during the period of the first
impoundment, (b) during the early period of the first drawdown, (c) during the later period of the first
drawdown, (d) during the early period of the second impoundment.
Small deformation of approximately 0.2-0.4 mm occurred in the middle of the landslide during
the second reservoir filling (Figure 9d). During the second drawdown, the displacement rate in
the frontal slope became faster, and failure eventually occurred along the original fracture surface.
However, due to the consolidation and compaction of the mid-rear and the deep part of the slope,
global failures could not occur.
To understand the vertical displacement of the whole slope surface, the geomorphological data of
the slope between the ultimate failure and initial state before the test are processed and analyzed based
on Polyworks 10.0 software. As shown in Figure 10, the vertical displacement of the middle part is
approximately 8-12 mm and gradually decreases to the rear part. The displacement of the rear edge is
the smallest, which is approximately 1-2 mm. The maximum sliding depth of the sliding zone in front
of the landslide is approximately eight cm. It could be concluded that the middle part is the area with
the largest vertical displacement.
Figure 10. The variation in slope surface elevation is shown with color gradients.Sustainability 2020, 12, 2092 11 of 19
4.3. Pore Pressure and Reservoir Water Infiltration
Because P6 and P7 were not submerged and were placed at the mid-rear part of the landslide,
their values were stable, as shown in Figure 11a. The pressure of P6 slightly decreased to a negative
value in the shallow layer of the sliding body. The pore water pressures at P3 and P4, which were
located at the middle part, increased rapidly after approximately 3500 secs and 3800 secs, respectively,
reflecting the consecutive arrival of the reservoir water at the middle part. The maximum water level
is only 1 cm higher than the position of P4. Therefore, the pore pressure had no obvious change during
the second fluctuation of the water level. However, the pore pressure at P5 increased gradually at
approximately 5020 secs when the water level was 27 cm lower than its position and lagged behind P4
for approximately 20 minutes. Continuing infiltration of the water should occur as the water level
increased; hence, the increment was also small.
Figure 11. The time histories of the pore water pressure at each monitoring point. (a), the pore water
pressure at P6 and P7 in the non-submerging area (b) and at P2-P5 in the submerged zone.
To further interpret the infiltration characteristics and phreatic line, the water pressure values and
corresponding water head of each transducer at the same time were extracted [37], as shown in Table 4.
After that, the phreatic line could be drawn as shown in Figure 12b at different periods during the test.
The water contents of 24 soil samples, which were acquired from a longitudinal section of the landslide
within half an hour after the experiment, were measured, and the water content of the whole section
was obtained through interpolation of the data. As a consequence, the water content distribution of
the landslide after the test is shown in Figure 12a.Sustainability 2020, 12, 2092 12 of 19
Table 4. The monitored pressures and corresponding water head at each point during different periods.
Phreatic Line Time (s) Water Level Elevation (cm) Water Level Variation
a 4200 33.2 First impoundment
b 4600 28.2 First drawdown
c 5300 22.1 First drawdown
d 7190 29.4 Second impoundment
e 7900 22 Second drawdown
Figure 12. (a) Distribution of the water contents of the landslide and (b) the phreatic line of the model
slope at different times; dashed line a denotes the first impoundment period, lines b and c indicate
the first drawdown period, and dashed lines d and e denote the second period of impoundment and
drawdown, respectively.
Dashed lines a and d are the phreatic lines for the first and second water impoundments,
respectively. The phreatic line has a concave shape directed toward the interior of the slope.
Simultaneously, the phreatic line indicated that the reservoir water infiltration included vertical
and horizontal directions, and the vertical direction was the main direction. Dashed lines b, c, and e
are the phreatic lines during water level drawdown, and they are all convex shapes pointing out of
the slope. As the water level decreased, the angle between the phreatic line and the horizontal line
gradually decreased and rotated to below horizontal, i.e., below horizontal, from concave to convex.
The phreatic lines at the drainage stage are similar to the contour of water content measured after the
test; thus, the results could be verified by each other.
4.4. Earth Pressure
The variations in earth pressure at S5, S6, and S7 in the non-submerging area during the test are
shown in Figure 13a. Their variation trends are roughly the same, and the measured values are affected
by the acceleration. This result is mainly observed because the three sensors are buried in the deep
areas of the mid-rear part, where the deformation was slight and had little impact on earth pressure.
Only S6 had a slow increase of approximately 50 kPa, while S7 gradually decreased by 25 kPa during
the period from 4400 secs to 4900 secs. This is due to the creep deformation that occurred in this area,
and the stress gradually released downward.Sustainability 2020, 12, 2092 13 of 19
Figure 13. Measured earth pressure varying with time. (a) the earth pressure at S2-S4 in the submerged
zone (b) and at S5-S7 in the non-submerging area.
The earth pressure in the front part of the slope was obviously affected by the hydrostatic pressure
inclined intra-slope at the beginning of the test. For example, the earth pressure at S2 gradually
increased to approximately 80 kPa from 2000 secs to 4000 secs, following the water level increase from
22 cm to 28 cm (Figure 13b). As the water level began to drop at 4050 secs, the earth pressures at S2
and S3 decreased gradually. At 5000 secs, the earth pressure at S2 rapidly decreased by approximately
40 kPa in one minute; subsequently, tensile cracks appeared at the slope surface above the S2 sensors
at 5250 secs. With the slope deformed continuously, the earth pressure at S2 rapidly decreased to
zero, and its transmission line was pulled off and no longer worked. However, the earth pressures at
S3 and S4 increased gradually, which indicated that the slope had the deformation characteristics of
downward creep.
During the second water level rise, the earth pressure at S3 increased slowly, while that at S4
decreased continuously, which indicated that there was a process of tiny creep deformation and stress
migration. When the water level dropped again, the earth pressures at S3 and S4 both began to
decrease, which led to the continuous expansion and deepening of the cracks on the slope surface
above S4 and local instability of the soil above S3.
4.5. Failure Mechanism
According to the test results, in the later period of the first drawdown, cracks first appeared in the
submerged zone, and the deformation lagged behind the decline in the reservoir water level. The cracks
developed rapidly to the two flanks, forming transverse rupture zones, and the toe of the landslide
continued to slide along the rupture zone as the water level dropped. Then, the mid-rear parts of
the slope began to creep downward. Consequently, the deformation of the slope was characterizedSustainability 2020, 12, 2092 14 of 19
by a progressive failure process induced by reservoir drawdown, and the displacement gradually
decreased from the toe to the rear.
Nevertheless, there was no obvious deformation in the mid-rear parts during the second drainage
of the reservoir, although the front part of the slope slid along the original rupture zones. The
main reason is that the deformation and sliding process released the potential energy of the slope,
reduced the sliding force, and achieved the state of stress equilibrium. In addition, vertical compression
deformation is dominant in the mid-rear parts, which leads to an increase in soil compactness and
enhances the anti-sliding ability of this region.
The compression deformation dominates in the middle part of the slope, which is the strong
compaction area. While the deformation in the rear is small, the weak compaction zone is predominant.
Furthermore, the compaction deformation decreases with increasing depth. The deformation mode
and zones of the deformation characteristic are shown in Figure 14.
Figure 14. Deformation mode of the landslide subjected to reservoir water level drawdown.
5. Discussion
5.1. Self-Adjustment of Deformation
From a worldwide perspective, most reservoir-induced landslides show an evolutionary
characteristic of severe deformation at initialization and later stability [47–50]. The correlation
between the fluctuation of the water level and the frequency of reactivated landslides is shown in
Figure 15.
Figure 15. The correlation between the fluctuation in water level and the frequency of reactivated landslides.
This result indicated that abundant landslides reactivated during the period of initial impoundment.
For instance, in the first three years of the trial impoundment phase, the frequency of landslides
reached its peak. However, as the landslides periodically underwent the disturbances of water level
fluctuations, the frequency of reactivated landslides exhibited a decreasing trend, and it decreasedSustainability 2020, 12, 2092 15 of 19
dramatically after 2009, i.e., one year after experiencing the highest water level. Many scholars also
believed that the reactive landslides are concentrated in the initial stage of water storage, and the
frequency of activation as well as the degree of deformation decrease gradually after the last phase of
water storage [51,52]. The experimental results in this study also show that the front of the slope slid
along the original rupture zone during the second drawdown, but the mid-rear parts had no obvious
deformation, which is different from the creep deformation induced by the traction of the front part
during the first drawdown; further, its stability was improved after the first deformation.
It can be concluded from experiments that the distribution of the anti-sliding ability of each
part is relatively balanced due to the planar sliding surface, and the mid-rear parts are not subjected
to immersion and erosion damage by the reservoir water. Simultaneously, there is also a distinct
vertical consolidation and compaction process during creep deformation. The main deformation of
the mid-rear part of the landslide in the test is vertical displacement, which leads to an increase in
the compactness of the soil, thus increasing its anti-sliding ability, and continued sliding becomes
difficult. Consequently, reducing the drawdown rate during the drainage period can be an effective
measure for stabilizing landslides in the initial stage. Currently, the activity of the landslides has
gradually weakened, and the deformation behaviors of the majority of landslides has progressively
disappeared in the TGRA. It can also be considered that gradually increasing the drawdown rate of
the reservoir increases the economic benefits. It is worth studying how much the drawdown rate
can increase, which involves solving the contradiction between the prevention of landslide and the
economic benefits produced by the reservoir.
5.2. Seepage Erosion
The process of seepage erosion and the destruction of the structure of the soil skeleton can be
seen from the high-definition images (Figure 16). The soil of the slope was softened and collapsed
after being saturated, forming some micro holes. In addition, the soil around the primary pore
continuously collapsed, and the pore gradually enlarged and underwent the action of water erosion.
Moreover, the fine particles or collapsed materials were carried away by groundwater seepage.
The series of processes leads to the continuous development and expansion of holes in some areas
of the slope and ultimately leads to damage to the internal structure of the slope. This phenomenon
can also be found in the prototypes according to previous studies [19,53]. Some researchers have
proved that most fine particles in the pore structure are rushed out under the seepage force action
and the seepage channels gradually develop and become interconnected in the seepage process by
permeability test [54,55].
Figure 16. Erosion effect through seepage caused by the reservoir water level drawdown. (a), the primary
structure of soil in the slope. (b), some micro holes are formed after the first drawdown.Sustainability 2020, 12, 2092 16 of 19
It can be seen that the landslide moves or slides along these holes or fissures, which were developed
or produced by seepage erosion. The fissures and holes gradually disappeared again after the sliding
process, resulting in soil compaction and consolidation again. Therefore, the damaging effect of the
seepage erosion of groundwater on the slope structure is also an important factor causing landslide
deformation. However, the effect is significantly weakened in the later period.
5.3. Deformation and Failure Modes
Good agreement is obtained for the deformation characteristics between the experimental results
and those of prototype landslides, such as Nigutang landslide, Damian landslide, Changwu landslide
and Zhulin landslide from Guling Town to Anping Town in Fengjie.
For instance, the displacement of the Damian landslide decreases gradually from the front (DM01)
to the middle (DM03, DM02), while the rear (DM04, DM05) has the smallest deformation, as shown
in Figure 17. The overall deformation is characterized by progressive retrogression. After the first
175 m impoundment, the landslide deformed severely from April to July in 2009, and thereafter, the
displacement decreased gradually in the same period of 2010 and 2011 and reached basic stability
with rare deformation eventually after 2012. The deformation and failure mode similar to this kind of
landslide has also been studied by many researchers in the TGRA [56,57].
Figure 17. Monitoring curves of accumulative displacement of the Damian landslide.
Taking the Anping riverside as an example, the monitored data of the surface displacement of
these landslides that occurred in the consequent slope of Fengjie are analyzed. The results show that
most of the severe deformation of these landslides occurred during the drawdown in 2009 after the
first 175 m impoundment. The deformation locations were almost concentrated in the front, consisting
of ground cracking, small-scale bank collapse or local shallow landslides in the water level fluctuation
zone. The cracks also occurred in the middle of partial landslides, and their widths ranged from
1-10 cm; however, there was no obvious sign of deformation in the rear part. The deformation is
characterized by progressive retrogression from the front to the rear, similar to the experimental results.
6. Conclusions
A centrifugal landslide model is constructed and tested to investigate the deformation
characteristics and long-term evolution of a landslide with a planar sliding surface. The following
conclusions have been drawn from the test results and the analysis:
The majority of these landslides were reactivated primarily by the hydrodynamic pressure pointing
out of the slope. The cracks first appeared in the submerged zone of the slope and extended to the rear
part during the drawdown. The overall deformation is characterized by progressive retrogression
from the front to the rear.Sustainability 2020, 12, 2092 17 of 19
The deformation of the front of the slope was dominated by the horizontal displacement, while
the vertical consolidation and compaction deformation dominated in the middle and rear parts, which
could promote the self-stabilization of the slope. This finding indicates good agreement between
the laboratory testing and field monitoring results. The entire instability does not occur for most
of reservoir-induced landslides, and the long-term evolution of the landslide is characterized by
progressive self-recovery from small deformation to stabilization.
The earth pressure in the front part of the slope increases with increasing reservoir level and
decreases gradually following the cracks. The pore water pressure lags behind the variation in the
reservoir level, but the lag effect weakened in the second fluctuation of the reservoir. Moreover, seepage
erosion has a certain damage effect on the internal structure of the slope. This research provides a
scientific basis for further study of the long-term evolution of reservoir-induced landslides.
Author Contributions: For research articles with several authors, a short paragraph specifying their individual
contributions must be provided. The following statements should be used “Conceptualization, Q.X. and M.T.;
methodology, M.T. and S.L.; software, Y.W.; validation, H.L.; formal analysis, H.Y.; investigation, S.L. and H.Y.;
resources, M.T.; data curation, S.L.; writing—original draft preparation, S.L.; writing—review and editing, Q.X.;
visualization, M.T.; supervision, Q.X.; project administration, M.T.; funding acquisition, Q.X. and M.T. All authors
have read and agreed to the published version of the manuscript
Funding: This research was funded by the National Natural Science Foundation of China (Grant No. 41630640
and No. 41977255), the Geological Hazard Prevention Project of Three Gorges (Grant No. 000121 2015C C60 005)
and the Sichuan Science and Technology Program (Grant No. 2019YJ0403).
Conflicts of Interest: The authors declare no conflict of interest.
References
1. Barla, G.; Paronuzzi, P. The 1963 Vajont Landslide: 50th Anniversary. Rock Mech. Rock Eng. 2013, 46, 1267–1270.
[CrossRef]
2. Dykes, A.P.; Bromhead, E.N. New, simplified and improved interpretation of the Vaiont landslide mechanics.
Landslides 2018, 15, 2001–2015. [CrossRef]
3. Ibañez, J.P.; Hatzor, Y.H. Rapid sliding and friction degradation: Lessons from the catastrophic Vajont
landslide. Eng. Geol. 2018, 244, 96–106. [CrossRef]
4. Zaniboni, F.; Tinti, S. The 1963 Vajont Landslide: A Numerical Investigation on the Sliding Surface
Heterogeneity. Pure Appl. Geophys. 2019, 176, 279–295. [CrossRef]
5. Mansour, M.F.; Morgenstern, N.R.; Martin, C.D. Expected damage from displacement of slow-moving slides.
Landslides 2011, 8, 117–131. [CrossRef]
6. Macciotta, R.; Martin, C.D.; Morgenstern, N.R.; Cruden, D.M. Development and application of a
quantitative risk assessment to a very slow moving rock slope and potential sudden acceleration. Landslides
2016, 13, 765–785. [CrossRef]
7. Gutiérrez, F.; Lucha, P.; Galve, J.P. Reconstructing the geochronological evolution of large landslides by
means of the trenching technique in the Yesa Reservoir (Spanish Pyrenees). Geomorphology 2010, 124, 124–136.
[CrossRef]
8. Chen, Z.; Meng, X.; Yin, Y.; Dijkstra, T.; Winter, M.; Wasowski, J. Landslide Research in China. Q. J. Eng. Geol.
Hydrogeol. 2016, 49, 279–285. [CrossRef]
9. Yin, Y.; Wang, H.; Gao, Y.; Li, X. Real-time monitoring and early warning of landslides at relocated Wushan
Town, the Three Gorges Reservoir, China. Landslides 2010, 7, 339–349. [CrossRef]
10. Du, J.; Yin, K.; Lacasse, S. Displacement prediction in colluvial landslides, Three Gorges Reservoir, China.
Landslides 2013, 10, 203–218. [CrossRef]
11. Tang, M.; Xu, Q.; Li, Y.; Huang, R.; Rengers, N.; Zhu, X. Partial reactivation of a huge deep-seated ancient
rock slide: Recognition, formation mechanism, and stability. Nat. Hazards Earth Syst. Sci. 2016, 16, 1719–1735.
[CrossRef]
12. He, C.; Hu, X.; Tannant, D.D.; Tan, F.; Zhang, Y.; Zhang, H. Response of a landslide to reservoir impoundment
in model tests. Eng. Geol. 2018, 247, 84–93. [CrossRef]Sustainability 2020, 12, 2092 18 of 19
13. Tang, M.; Xu, Q.; Huang, R. Site monitoring of suction and temporary pore water pressure in an ancient
landslide in the Three Gorges reservoir area, China. Environ. Earth Sci. 2015, 73, 5601–5609. [CrossRef]
14. Yin, Y.; Huang, B.; Wang, W.; Wei, Y.; Ma, X.; Ma, F.; Zhao, C. Reservoir-induced landslides and risk control
in Three Gorges Project on Yangtze River, China. J. Rock Mech. Geotech. Eng. 2016, 8, 577–595. [CrossRef]
15. Li, S.; Xu, Q.; Tang, M.; Iqbal, J.; Liu, J.; Zhu, X.; Liu, F.; Zhu, D. Characterizing the spatial distribution
and fundamental controls of landslides in the three gorges reservoir area, China. Bull. Eng. Geol. Environ.
2019, 78, 4275–4290. [CrossRef]
16. Javed, I.; Tu, X.; Gao, W. The Impact of Reservoir Fluctuations on Reactivated Large Landslides: A Case
Study. Geofluids 2019, 1–16. [CrossRef]
17. Huang, D.; Gu, D.; Song, Y.; Cen, D.; Zeng, B. Towards a complete understanding of the triggering mechanism
of a large reactivated landslide in the Three Gorges Reservoir. Eng. Geol. 2018, 238, 36–51. [CrossRef]
18. Li, H.; Xu, Q.; He, Y.; Deng, J. Prediction of landslide displacement with an ensemble-based extreme learning
machine and copula models. Landslides 2018, 15, 2047–2059. [CrossRef]
19. Huang, D.; Gu, D. Influence of filling-drawdown cycles of the Three Gorges reservoir on deformation and
failure behaviors of anaclinal rock slopes in the Wu Gorge. Geomorphology 2017, 295, 489–506. [CrossRef]
20. Song, K.; Wang, F.; Yi, Q.; Lu, S. Landslide deformation behavior influenced by water level fluctuations of
the Three Gorges Reservoir (China). Eng. Geol. 2018, 247, 58–68. [CrossRef]
21. Wang, S.; Wu, W.; Wang, J.; Yin, Z.; Cui, D.; Xiang, W. Residual-state creep of clastic soil in a reactivated
slow-moving landslide in the Three Gorges Reservoir Region, China. Landslides 2018, 15, 2413–2422.
[CrossRef]
22. Rajabian, A.; Viswanadham, B.V.S.; Ghiassian, H.; Salehzadeh, H. Centrifuge model studies on anchored
geosynthetic slopes for coastal shore protection. Geotext. Geomembr. 2012, 34, 144–157. [CrossRef]
23. Lü, X.; Xue, D.; Chen, Q.; Zhai, X.; Huang, M. Centrifuge model test and limit equilibrium analysis of the
stability of municipal solid waste slopes. Bull. Eng. Geol. Environ. 2019, 78, 3011–3021. [CrossRef]
24. Wang, R.; Zhang, G.; Zhang, J. Centrifuge modelling of clay slope with montmorillonite weak layer under
rainfall conditions. Appl. Clay Sci. 2010, 50, 386–394. [CrossRef]
25. Ling, H.; Ling, H.I. Centrifuge Model Simulations of Rainfall-Induced Slope Instability. J. Geotech. Geoenviron.
Eng. 2012, 138, 1151–1157. [CrossRef]
26. Zhang, G.; Wang, R.; Qian, J.; Zhang, J.; Qian, J. Effect study of cracks on behavior of soil slope under rainfall
conditions. Soils Found. 2012, 52, 634–643. [CrossRef]
27. Zhang, Z.; Wang, T.; Wu, S.; Tang, H.; Liang, C. Seismic performance of loess-mudstone slope in TianShui
—Centrifuge model tests and numerical analysis. Eng. Geol. 2017, 222, 225–235. [CrossRef]
28. Zhang, Z.; Wang, T.; Wu, S.; Tang, H.; Liang, C. Investigation of dormant landslides in earthquake conditions
using a physical model. Landslides 2017, 14, 1181–1193. [CrossRef]
29. Cui, S.; Pei, X.; Wu, H.; Huang, R. Centrifuge model test of an irrigation-induced loess landslide in the
Heifangtai loess platform, Northwest China. J. Mt. Sci. 2018, 15, 130–143. [CrossRef]
30. Peng, J.; Fan, Z.; Wu, D.; Huang, Q.; Wang, Q.; Zhuang, J.; Che, W. Landslides triggered by excavation in the
loess plateau of China: A case study of Middle Pleistocene loess slopes. J. Asian Earth Sci. 2019, 171, 246–258.
[CrossRef]
31. Zhang, J.; Lin, H.; Wang, K. Centrifuge modeling and analysis of submarine landslides triggered by elevated
pore pressure. Ocean Eng. 2015, 109, 419–429. [CrossRef]
32. Zhao, T.; Chen, S.; Fu, C.; Zhong, Q. Centrifugal model tests and numerical simulations for barrier dam
break due to overtopping. J. Mt. Sci. 2019, 16, 630–640. [CrossRef]
33. Chen, X.; Huang, J. Stability analysis of bank slope under conditions of reservoir impounding and rapid
drawdown. J. Rock Mech. Geotech. Eng. 2011, 3, 429–437.
34. Chen, X.; Zhu, H.; Huang, J.; Liu, D. Stability analysis of an ancient landslide considering shear strength
reduction behavior of slip zone soil. Landslides 2016, 13, 173–181. [CrossRef]
35. Fan, L.; Zhang, G.; Li, B.; Tang, H. Deformation and failure of the Xiaochatou Landslide under rapid
drawdown of the reservoir water level based on centrifuge tests. Bull. Eng. Geol. Environ. 2017, 76, 891–900.
[CrossRef]
36. Luo, F.; Zhang, G.; Liu, Y.; Ma, C. Centrifuge modeling of the geotextile reinforced slope subject to drawdown.
Geotext. Geomembr. 2018, 46, 11–21. [CrossRef]Sustainability 2020, 12, 2092 19 of 19
37. Miao, F.; Wu, Y.; Li, L.; Tang, H.; Li, Y. Centrifuge model test on the retrogressive landslide subjected to
reservoir water level fluctuation. Eng. Geol. 2018, 245, 169–179. [CrossRef]
38. Wang, J.; Xiang, W.; Lu, N. Landsliding triggered by reservoir operation: A general conceptual model with a
case study at Three Gorges Reservoir. Acta Geotech. 2014, 9, 771–788. [CrossRef]
39. Zhang, J.; Zhengjun, L.; Xiaoxia, S. Changing landscape in the Three Gorges Reservoir Area of Yangtze River
from 1977 to 2005: Land use/land cover, vegetation cover changes estimated using multi-source satellite data.
Int. J. Appl. Earth Obs. Geoinf. 2009, 11, 403–412. [CrossRef]
40. Chigira, M. Long-term gravitational deformation of rocks by mass rock creep. Eng. Geol. 1992, 32, 157–184.
[CrossRef]
41. Godt, J.W.; Baum, R.L.; Savage, W.Z.; Salciarini, D.; Schulz, W.H.; Harp, E.L. Transient deterministic shallow
landslide modeling: Requirements for susceptibility and hazard assessments in a GIS framework. Eng. Geol.
2008, 102, 214–226. [CrossRef]
42. Qi, S.; Xu, Q.; Lan, H.; Zhang, B.; Liu, J. Spatial distribution analysis of landslides triggered by 2008.5.12
Wenchuan Earthquake, China. Eng. Geol. 2010, 116, 95–108. [CrossRef]
43. Javed, I.; Tu, X.; Xu, L. Landslide Hazards in Reservoir Areas: Case Study of Xiangjiaba Reservoir, Southwest
China. Nat. Hazards Rev. 2017, 18, 1–13.
44. Take, W.A.; Bolton, M.D.; Wong, P.C.P.; Yeung, F.J. Evaluation of landslide triggering mechanisms in model
fill slopes. Landslides 2004, 1, 173–184. [CrossRef]
45. Higo, Y.; Lee, C.; Doi, T.; Kinugawa, T.; Kimura, M.; Kimoto, S.; Oka, F. Study of dynamic stability of
unsaturated embankments with different water contents by centrifugal model tests. Soils Found. 2015, 55,
112–126. [CrossRef]
46. Thielicke, W.; Stamhuis, E.J. PIVlab—Towards User-friendly, Affordable and Accurate Digital Particle Image
Velocimetry in MATLAB. J. Open Res. Softw. 2014, 2, 1–10. [CrossRef]
47. Schuster, R.L. Reservoir-induced landslides. Bull. Eng. Geol. Environ. 1979, 20, 8–15. [CrossRef]
48. Kaczmareka, H.; Mazaevab, O.A.; Kozyrevab, E.A.; Babichevab, V.A.; Tyszkowskia, S.; Rybchenkob, A.A.;
Brykałaa, D.; Bartczaka, A.; Słowińskia, M. Impact of large water level fluctuations on geomorphological
processes and their interactions in the shore zone of a dam reservoir. J. Great Lakes Res. 2016, 42, 926–941.
[CrossRef]
49. Riemer, W. Landslides and Reservoirs (Keynote Paper). In Proceedings of the 6th International Symposium
on Landslides, Christchurch, New Zealand, 10–14 February 1992; A.A. Balkema: Rotterdam The Netherlands,
1992; pp. 1373–2004.
50. Du, Y.; Xie, M.; Jia, J. Stepped settlement: A possible mechanism for translational landslides. CATENA
2020, 187, 104365. [CrossRef]
51. Tang, H.; Wasowski, J.; Juang, C.H. Geohazards in the three Gorges Reservoir Area, China—Lessons learned
from decades of research. Eng. Geol. 2019, 261, 105267. [CrossRef]
52. Tang, M.; Xu, Q.; Yang, H.; Li, S.; Iqbal, J.; Fu, X.; Huang, X.; Cheng, W. Activity law and hydraulics
mechanism of landslides with different sliding surface and permeability in the Three Gorges Reservoir Area,
China. Eng. Geol. 2019, 260, 105212. [CrossRef]
53. Wang, F.; Zhang, Y.; Huo, Z.; Peng, X.; Araiba, K.; Wang, G. Movement of the Shuping landslide in the first four
years after the initial impoundment of the Three Gorges Dam Reservoir, China. Landslides 2008, 5, 321–329.
[CrossRef]
54. Dhungana, P.; Wang, F. The relationship among the premonitory factors of landslide dam failure caused by
seepage: An experimental study. Geoenviron. Disasters 2019, 6, 1–20. [CrossRef]
55. Zhang, Z.; Huang, X.; Liu, W.; Wang, L. Study on the Hydraulic Parameters of Woshaxi Landslide Soils
during Water Level Drawdown of Three Gorges Reservoir. Geofluids 2020. [CrossRef]
56. Li, D.; Miao, F.; Xie, Y.; Leo, C. Hazard Prediction for Baishuihe Landslide in the Three Gorges Reservoir
during the Extreme Rainfall Return Period. KSCE J. Civ. Eng. 2019, 23, 5021–5031. [CrossRef]
57. Luo, S.; Jin, X.; Huang, D. Long-term coupled effects of hydrological factors on kinematic responses of a
reactivated landslide in the Three Gorges Reservoir. Eng. Geol. 2019, 261, 105271. [CrossRef]
© 2020 by the authors. Licensee MDPI, Basel, Switzerland. This article is an open access
article distributed under the terms and conditions of the Creative Commons Attribution
(CC BY) license (http://creativecommons.org/licenses/by/4.0/).You can also read