State of Australian Cities Conference 2013 - APO
←
→
Page content transcription
If your browser does not render page correctly, please read the page content below
State of Australian Cities Conference 2013

Ecosystem Guidelines for the Conservation of Aquatic Ecosystems of the
Georges River Catchment: A Method Applicable to the Sydney Basin.
              a,d                   b                    a                 c
Carl Tippler , Dr. Ian. A. Wright , Dr.Peter J. Davies and Alison Hanlon
A
    Department of Environment and Geography, Macquarie University, NSW, Australia
B
    School of Science and Health, University of Western Sydney, NSW, Australia
C
    Hurstville City Council, Civic Centre, Hurstville, NSW, Australia
D
    Corresponding author. Email: carl.tippler@mq.edu.au

Abstract: For waterway managers the conservation of freshwater streams in Australia is commonly
underpinned by comparing water quality data with default ANZECC water quality guidelines. However
distinctive conditions found within many streams of the Sydney basin render a number of the default
guidelines not suitable and prone to misinterpretation. In this study we draw on a three year
monitoring program and follow the framework recommended by the ANZECC guideline to develop a
catchment specific approach for the conservation of aquatic ecosystems for the Georges River
catchment. In addition to the ‘common’ set of water quality guidelines we include values for a
selection of ionic parameters and guideline values for aquatic macroinvertebrate communities, riparian
vegetation condition and catchment imperviousness. The study revealed three distinct patterns of
ecosystem disturbance and water quality characteristics that corresponded to the level of development
across the catchment from reference forested areas through to highly urbanised centres. W hen
compared to non-urban reference sites streams with greater than 5% impervious surfaces showed
emergent signs of ecosystem degradation while those with >19% imperviousness had highly degraded
water quality, macroinvertebrate communities and riparian vegetation. Based on the results of this
study, we recommend two sets of regionally relevant ecosystem and water quality guidelines, one for
the conservation of streams with high ecological value that would apply to waterways with minimally
disturbed catchments and the other to apply to urban streams and stream restoration projects.
Although the focus of this paper is the Georges River catchment, the approach developed in this study
can be easily applied to other urban catchments within the Sydney Basin.

Introduction
Water quality guidelines or trigger values are commonly used by waterway managers to assess the
condition or ‘health’ of a stream. The Australia and New Zealand Guidelines for Fresh and Marine
Water Quality (ANZECC Guidelines) (ANZECC 2000) is the national standard used to assess water
quality. The guideline has evolved over the past 25 years (Moss et al 2005) and provides a
comprehensive framework for the development of waterway management strategies.

The most recent edition of the ANZECC guidelines (ANZECC 2000) includes default water quality
parameters for a wide range of pollutants. The common water quality guidelines which include total
nitrogen, ammonia, oxides of nitrogen, total phosphorous, filterable reactive phosphate, pH,
conductivity, dissolved oxygen, turbidity and chlorophyll-a were developed for slightly to moderately
disturbed ecosystems across broad geographical regions. Parameters relevant to the Sydney region
are included in the guidelines within the descriptors for south-east Australia. Concentrations for
additional pollutants such as metals and other chemicals have been determined based on acceptable
levels for ecosystem protection (that equates to 99% - 80% protection of all species).

In NSW, the ANZECC guidelines (2000) are widely used for environmental assessment and reporting
by a variety of organisations including the NSW Environment and Protection Authority for State of
Environment reporting (NSWEPA 2012), NSW Department of Environment and Climate Change for
assessment of water quality in drinking water catchments (DECC 2009) and local councils to assess
waterway condition (e.g. Ku-ring-gai Council 2013; Hornsby Shire Council 2012). They are also used
by a range of organisations to assess the condition of waterways as part of local and regional aquatic
monitoring programs (e.g. Ryder et al 2011).
For some waterways, however, the default ANZECC guidelines do not reflect typical background
water quality and chemistry. In these situations, an assessment of water quality monitoring data
against these default values can suggest the condition of the waterway is outside the normal range, or
polluted, when in fact it is ‘clean.’ An example of how default guidelines may be misinterpreted is
often seen with low pH values reported for many Sydney streams in undisturbed catchments that rise
on Hawkesbury sandstone. These naturally acidic streams frequently report pH below the default
ANZECC guideline of 6.50. For example, Tippler et al (2012) reported pH in reference streams of the
Georges River catchment as low as 4.07, Wright (2011) reported pH of 5.40 in naturally vegetated
Blue Mountains streams and both Davies et al (2010) and Wright et al (2007) reported pH of 5.50 and
5.30 respectively in reference streams in northern Sydney. In these cases determining what is a
‘healthy’ pH against the guideline would provide an incorrect assessment and may drive catchment
investigations or management interventions contrary to the natural waterway condition.
Another limitation is that the regions within the ANZECC guidelines are geographically very large and
geologically complex. The default guideline for south-east Australia applies to the Murray Darling
Basin through to the small coastal tributaries of the Sydney Basin, despite major differences in water
geochemistry across this vast area (Hart & McKelvie, 1986). This requires the default water quality
values to be sufficiently flexible to incorporate a wide range of biological or geophysical difference.
To counter these problems, the ANZECC framework encourages the development of
region/catchment specific guidelines to better reflect local conditions. The ANZECC guidelines (2000)
outline the approach necessary to develop locally derived water quality guidelines and also to
incorporate biological assessment of waterways into monitoring programs.
Urban steams and urban water quality
The impact of urbanisation on freshwater streams has been well documented. Degraded water
quality, habitat fragmentation, loss of species diversity and altered hydrological regimes are impacts
common to urban streams (e.g. Paul and Meyer 2001; Walsh et al 2005; Marchetti et al 2006). One
element that has been identified as a key contributing factor to the decline of urban streams is the
percentage of a catchment which is covered by impermeable surfaces, such as roads, buildings and
car parks (Paul and Meyer 2001). Australian studies have shown that the onset of stream degradation
occurs once a catchment is covered by between 3% and 5% impermeable surfaces (Walsh 2007;
Davies et al 2010; Tippler et al 2012). Critical to stream degradation is the connection of impervious
surfaces to local waterways via the urban stormwater drainage system. This connected
imperviousness has a significant impact on stream hydrology (Dunne and Leopold 1978; Booth et al.
2004; Roy et al. 2005) and water chemistry (Hatt et al. 2004).
Stream restoration and catchment management projects have been implemented in an attempt to
improve the ecological function and water quality within urban streams. This has usually involved
various treatments including the rehabilitation of riparian zones, re-instatement of woody debris and
1
the introduction of various Water Sensitive Urban Design (WSUD) techniques within the catchment
such as swales, bio-retention systems and artificial wetlands (Larsen et al 2001; Richardson et al
2011). While there can be short-term ecological and water quality improvements, the longer-term
benefits of urban stream restoration requires on-going evaluation (e.g. University of Melbourne 2008
and Walsh et al 2005), particularly in catchments that are already urbanised and often increasing in
density (further increasing the proportion of impervious surfaces) as well as catchments targeted for
urban expansion in greenfield areas.
The performance of catchment and stream improvement projects are often determined against the
change in water quality and ecological indicators, from pre-intervention to post intervention and using
the ANZECC guidelines. Both approaches are fraught with problems in highly urban catchments due
to the significance of the degradation and multiple causative factors contributing to poor water and
ecological health (Paul and Meyer 2001; Walsh et al 2005). Further the default parameters used in
the ANZECC guidelines are designed to reflect natural to slightly disturbed ecosystem conditions and
are often unrealistic as a guideline to measure against the poor and highly variable water quality
experienced by urban streams (eg.Tippler et al 2012; Wright et al 2007; Blakely and Harding 2005).
Given these challenges urban creek restoration projects can be set up to fail from the outset due to
unrealistic expectations and benchmark targets. Catchment specific guidelines and targets that reflect
local conditions can overcome this problem (Ryder and Miller 2005) and a framework for developing
such targets is outlined in chapter 3 of the ANZECC guidelines (ANZECC 2000).
1
also referred to in the literature as Sustainable Urban Design (SUDS), Low Impact Development
(LID) and more broadly environmental engineeringThe research presented in this paper presents an approach for the development of localised aquatic
ecosystem guidelines for the Georges River catchment in south west Sydney. Two guidelines are
presented reflecting the variable level of disturbance (as defined by the of % impervious surfaces) and
the pragmatic capacity for recovery. Measurements incorporate water quality, including
anions/cations, in-stream freshwater macroinvertebrates (determined at Order and Family level) and
riparian condition. The first guideline is designed to protect waterways of conservation significance,
akin to the default ANZECC guidelines, but specific to the Georges River catchment. The second is
aimed at more urbanised catchments to provide targets that are more achievable and realistic
reflecting the inherent challenges of the urban stream syndrome. This method is transferrable to other
regions and can be used by non-specialist personal to provide a more region-specific approach to
waterway management.
Method
Study catchment
The Georges River catchment is located in south west Sydney with a population of over 1 million and
2
an area of 960km . There are 12 local councils in the catchment (Rockdale, Kogarah, Hurstville,
Canterbury, Bankstown, Holroyd, Fairfield, Liverpool, Campbelltown, Wollondilly, Wollongong and
Sutherland) and it falls within the boundaries of two metropolitan planning sub-regions (South and
South West) (NSW Government 2013) and for the purpose of on-ground catchment management is
within the now combined Sydney Metro and Hawkesbury-Nepean Catchment Management Committee
(CMA). Development and population within the catchment will increase significantly over the next 20
years (Table 1) driven by the targets within the South and South West subregional plans for Sydney
(NSW Government 2013). Informing the development across the catchment are five environmental
priorities within the subregional plans (NSW Government 2013) that include to:
Protect the health and resilience of environmental assets, including internationally significant
wetlands, national parks and the drinking water supply catchment
Protect metropolitan-significant infrastructure including freight corridors, intermodal terminals
and Sydney’s drinking water supply catchment, key water storages and the Upper Canal
corridor (a canal that transports bulk water from the metropolitan water supply dams to
Prospect reservoir)
Continue to provide extensive environmental, recreation and tourism opportunities in the Blue
Mountains and Nattai National Park
Recognise the subregion’s agriculture and the extensive resource deposits valuable to
employment and the economy
Protect land to serve Sydney’s future transport needs, including sites and associated
corridors.
The spectrum of urban development across the catchment has resulted in a gradient of waterway
disturbance which ranges from streams in ‘near pristine’ condition to highly disturbed and degraded
urban streams. The condition of the streams generally corresponds to catchment development
typologies ranging from minimally developed naturally vegetated catchments to highly developed
urbanised catchments (Tippler et al 2012). Approximately 45 % of the catchment remains covered by
large tracts of natural bushland (SMCMA 2012). These relatively undeveloped areas are managed
and regulated by a variety of state and federal agencies including NSW National Parks and Wildlife
Service, Sydney Catchment Authority (for the purpose of potable water supply) and The Australian
Defence Force.
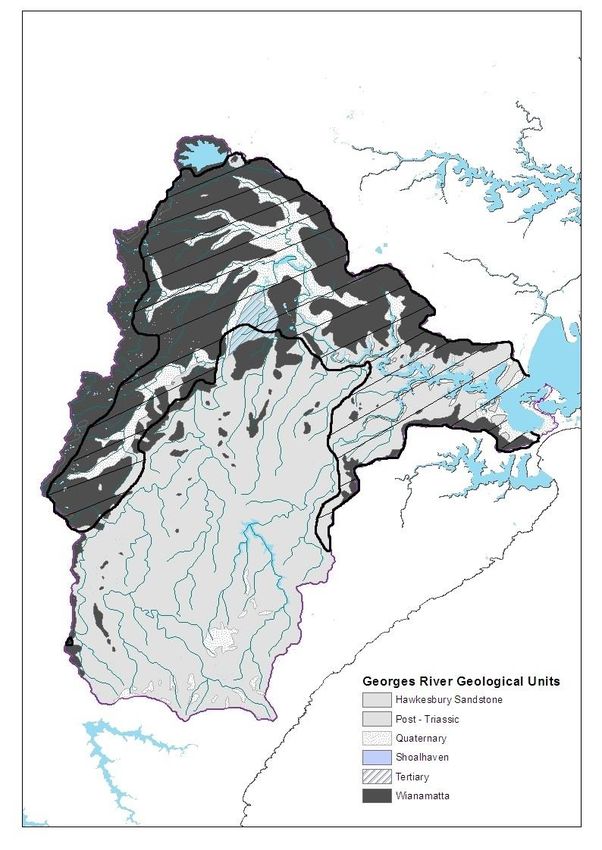
The dominant geological formations are Hawkesbury Sandstone in the east and south, Wianamatta
Shale in the west and Hawkesbury Sandstone with Wianamatta Shale capping in the north (NSW
Department of Mineral Resources 1983). Quaternary alluvium underlies much of the Wianamatta
Shale and in some areas has been exposed by erosional processes (LCC 2002). Soils reflect the
underlying geological formations (NSWDIPN 2004) (Figure 1).
The average annual rainfall across the catchment is approximately 900 mm per year (BOM 2013) with
more rainfall nearer the coast. The sub-catchment closest to the coast (6km) has an average of 1427
mm/year compared to 871 mm/year in the sub-catchment furthest form the coast (36 km) (BOM 2013).13
14
11
12
9
10
8
7 15 16 17
8 18 19
12 12
24
20 8
12
8
21
23 22
6
6
5
3
4
2
1
Figure 1. The Georges River catchment. Sample sites (numbered), catchment geology and urban
area (black outline, diagonal lines)Table 1. Current and growth targets for population, housing and employment that will impact on the
Georges River Catchment as outlined by the draft Metropolitan Strategy for Sydney (NSW
Government 2013)
Subregion Current Target for 2021 Target for 2031
Population 829,000 1, 048,000 1,298,000
South West Housing 286,000 346,000 427,000
Employment 298,000 362,000 432,000
Population 609,000 655,000 685,000
South Housing 241,000 263,000 283,000
Employment 183,000 207,000 226,000
Data collection
Catchment imperviousness upstream of each monitoring site was quantified using Environmental
Systems Research Institute Arc-Map version 9.3.1 with sub-catchments delineated using 10 m
contours. An impervious/pervious layer was developed using remote sensing of Satellite Pour
l'Observation de la Terre imagery on a 10×10 m grid that was clipped by the digitised sub-catchment
layer. Sub-catchment pervious/impervious areas were totalled, enabling the percentage of impervious
surface to be calculated.
Monitoring sites were grouped by the degree of catchment disturbance based on catchment
imperviousness (a measure of the proportion of hard impermeable areas such as roads, roofs and
footpaths). In previous studies of the Georges River catchment (Tippler et al 2012a, b) three
disturbance categories were identified based on the level of sub-catchment imperviousness: 19 % impervious surfaces were classified as being
highly disturbed. This classification resulted in 7 sites with low disturbance, 4 sites with moderate
disturbance and 11 sites with high disturbance.
Water quality, water chemistry and macro-invertebrate data were collected from 24 freshwater sites
across 18 waterways within the Georges River catchment over a 44-month period. Water quality was
monitored between October 2009 to May 2013 based on a seasonal (spring and autumn) sampling
frequency. In addition, three sites (two low disturbance; one moderate disturbance) were monitored
monthly between September 2011 and May 2013.
Physiochemical water quality parameters of pH, electrical conductivity (EC), dissolved oxygen (DO%)
and turbidity (NTU) were measured in-situ using a calibrated TPS 90FLMV multi probe meter.
Between October 2009 to May 2013 surface water grab samples were analysed at each site for total
nitrogen (TN), total kehldahl nitrogen, NO-x nitrogen (NOx-N) and total phosphorus (TP).
Grab samples for major anions and cations and total suspended solids (TSS) were collected from
2010 and ammonia nitrogen (NH3-N) collected from October 2012. These were collected in
decontaminated sample containers (acid preserved for nutrients) provided by a commercial testing
laboratory. Samples were chilled and delivered to the laboratory for analysis. All grab samples were
analysed using standard methods (APHA 1998) by a National Associations of Testing Authorities
(NATA) accredited laboratory.
Macroinvertebrate samples were collected according to the Australian National River Health Program
protocols (DEST et al. 1994; Chessman 1995, 2003). This involved collection using a ‘kick’ net, with
250-μm mesh and square 30×30 cm net frame (Chessman 1995) to survey pool, edge and riffle
habitat. Pool, edge and riffle sub-samples were combined into one homogenised sample to berepresentative of each study site. A total of 10 m of stream habitat was sampled within a 100 m
section of each site. Samples were live picked in the field on a sorting tray for 30 minutes using
forceps and pipettes, and animals were identified in the field to Order level using ×30 magnification
hand lenses and the recommended Australian taxonomic keys of Hawking and Smith (1997) and
Gooderham and Tsyrlin (2002). Samples were then preserved in ethanol and later identified in a
laboratory to Family level under microscope with the recommended taxonomic keys (Hawking and
Smith 1997).
The aim of the macroinvertebrate sampling was to maximise the diversity of animals identified at both
Order and Family taxon using the rapid assessment SIGNAL2 approach (Chessman 1995).
Freshwater macroinvertebrates identified to both Order and Family taxonomic levels have been widely
used to detect the impacts of water pollution and environmental change to aquatic ecosystems (eg.
Wright et al. 1995; Bowman and Bailey 1997; Tippler et al 2012). Four macroinvertebrate biotic
indices were calculated for each macroinvertebrate sample:
percentage of Ephemeroptera (mayfly), Plecoptera (stonefly) and Trichoptera (caddisfly)
(EPT) (Cairns and Pratt 1993) - a biotic index based on the percentage of pollution sensitive
taxa present at a site
Order and Family taxonomic richness (Rosenberg and Resh 1993)
Shannon index (Krebs 1989) - a biodiversity measure that reflects taxa richness and evenness
of taxa distribution
Order and Family level SIGNAL 2 scores (Chessman 2003b) - Biotic index based on the
presence/absence of pollution tolerant/intolerant invertebrate taxa.
Riparian vegetation condition was surveyed at each site in spring 2009 and autumn 2013 using the
‘Rapid Appraisal of Riparian Condition’ (RARC) Version 2 (Jansen et al. 2004). This method uses a
suite of 15 indicators of riparian condition that reflect the functional aspects of the physical vegetation
community and landscape features of the riparian zone (Jansen et al. 2004). Due to the variability of
access to survey sites a standardised approach where 100 m metres of stream bank was surveyed
and survey transects were limited to 40 m (Tippler et al 2012 a, b).
Data Analysis
A one-factor analysis of variance (ANOVA) was used to investigate whether riparian condition,
macroinvertebrate biotic indices (SIGNAL 2, percentage of EPT, taxonomic richness and Shannon
index) and water quality parameters varied according to catchment disturbance (low, moderate and
high).
Multivariate analysis was used to assess macroinvertebrate community response to waterway
disturbance using the software package PRIMER version 5 (Clarke 1993). Non-metric
multidimensional scaling (NMDS) was performed on a Bray-Curtis similarity matrix calculated with
cube root-transformed macroinvertebrate data grouped by the degree of catchment disturbance (low,
moderate and high) (Clarke 1993; Warwick 1993). Two-dimensional ordination plots were generated
to give a representation of the dissimilarity among individual samples and disturbance categories.
Two-way crossed analysis of similarity (ANOSIM) (Clarke 1993) was used to test for
macroinvertebrate assemblage differences between disturbance categories and season of sampling.
Formulation of region specific guidelines
To formulate region specific guidelines for the Georges River catchment we applied the rationale set
out in chapter 3 ‘Aquatic Ecosystems’ of the ANZECC guidelines (ANZECC 2000). This process
involved defining guidelines for water quality, macroinvertebrate indices and riparian vegetation
condition by applying the 80th and/or 20th percentile values of data obtained from the six reference
streams in the Georges River catchment. Reference streams in this study were defined as having <
5% impervious surfaces. For stressors that cause problems at high concentrations (e.g. nutrients, pH
and conductivity and major ions) the 80th percentile of reference stream data was used as the
guideline. For stressors that caused problems at low levels (e.g. dissolved oxygen) the 20th percentile
of reference data was used.
In addition to the development of a region specific guideline for streams with conservation
significance, the ANZECC approach was applied to derive region specific guidelines for application to
urban streams. Urban streams of the Georges River catchment are generally impaired beyond the
‘slight to moderate’ category spectrum that the ANZECC guidelines have been designed to be appliedagainst (Tippler et al 2012 a, b). To develop this guideline, data from moderately disturbed streams,
which were defined as having between 6 – 19% impervious surfaces, was used. This guideline is
based on data collected from peri urban streams with a lower degree of urbanisation that have
retained a higher amount of ecological integrity when compared with highly urbanised streams (Tippler
et al 2012 a, b). This ‘peri-urban’ guideline should provide waterway managers with more appropriate
and realistic targets to use when assessing urban streams and evaluating the efficacy of urban stream
restoration projects.
Results
Mean values for most water quality parameters across three levels of catchment disturbance generally
complied with ANZECC upland and lowland river water quality guidelines for south east Australia
(Table 2). The notable exceptions were: mean DO across all catchment disturbance categories was
found to be lower than the minimal ANZECC guideline; mean NOx-N was in excess of both lowland
and upland river ANZECC guidelines for all catchment disturbance categories; and mean NH4+ and TN
exceeded ANZECC guideline limits for moderately and highly disturbed catchments.
Mean pH of minimally disturbed catchments fell below the ANZECC guideline range however mean
pH at moderately and highly disturbed catchments were compliant with the ANZECC guideline. Mean
EC of highly disturbed catchments was excessive of the lowland ANZECC guideline yet compliant with
the lowland guideline. However this result was excessive of the 200-300 µS/cm recommended by
ANZECC for NSW coastal rivers as defined in the ANZECC (2000) guideline table for south east NSW
fine print.
Table 2. Mean water quality results across the three catchment groups compared against the
ANZECC Guidelines for upland and lowland rivers
Level of catchment disturbance based on %
Impervious Surface
ANZECC guideline Low (< 5%) Moderate (6-19%) High (> 19%)
Upland Lowland
1 1
Water Quality Parameters river river Mean Mean Mean
pH 6.5-8.0 6.5-8.5 5.93 7.18 7.25
Electrical Conductivity (uS/cm) 30-350 125-2200^ 124 333 789
Dissolved Oxygen (% saturation) 90-110 85-110 81 82 52
Turbidity (NTU) 2-25 6-50 2.7 10.7 25.8
TSS (mg/L) NA NA 3.5 9 17
NOx-N (mg/L) 0.015 0.04 0.03 0.08 0.34
NH4+ (mg/L) 0.013 0.02 0.01 0.07 0.09
TKN (mg/L) NA NA 0.20 0.30 0.90
TN (mg/L) 0.25 0.35 0.20 0.40 1.20
TP (mg/L) 0.02 0.05 0.03 0.04 0.12
Total Alkalinity (as CaCO3) (mg/L) NA NA 5 38 100
HCO3 (as CaCO3) (mg/L) NA NA 5 38 100
SO4 (mg/L) NA NA 5 9 35
Cl (mg/L) NA NA 32 54 173
Ca (mg/L) NA NA 2 7 28
Mg mg/L NA NA 3 5 15
Na (mg/L) NA NA 18 38 110
K (mg/L) NA NA 1 2 5
Notes: ^ NSW coastal rivers are typically in the range 200–300 µS/cm (ANZECC 2000) *Bold = not compliant with one or both
1
ANZECC water quality guidelines. Upland streams are defined as those >150m and lowlandThe one-way ANOVA test reported all water quality parameters that were tested had a significant
variation across each of the catchment disturbance categories (Table 3). The level of significance for
most parameters was p =Indices and mean %EPT were highest in streams in low disturbance catchments and lowest in
streams in highly disturbed catchments (Table 4).
Table 4. Range, mean and results of ANOVA analysis for riparian condition and macroinvertebrate
indices across catchment disturbance categories based on percentage of impervious surface. Level of
significance = *pAnother common water quality indicator used to assess stream condition is pH. The minimum default value for SE Australia is pH 6.50 for both lowland and upland freshwaters (ANZECC, 2000). This value does not take into consideration the background hydrogeology and biological activity that drives the naturally acidic processes within the aquatic ecosystem of Hawkesbury sandstone streams, such as the low disturbed streams in this study. To account for these naturally acidic conditions we followed the recommended approach in ANZECC to derive a locally specific pH guideline of < pH 6.76 for minimally disturbed systems. Following this same approach we also recommend a guideline for urban systems of < pH 7.80 (Table 5). This study yielded further data that supports the theory that concrete stormwater infrastructure is modifying the chemistry in freshwater streams (Wright et al 2011, Davies et al 2010b, Nodvin et al 1986). In particular, the major mineral ions (bicarbonate and calcium) are much higher in moderate and highly urbanised streams when compared to the low disturbance sites (noting that the influence of alkaline concrete materials also raises the pH). Average bicarbonate concentrations were 7 times higher at moderately disturbed streams and 20 times higher at highly disturbed streams when compared to low disturbed streams. Such investigation of the ionic composition of water reveals that it isnot only the strength of salt solution that is important, but also takes into account the mineral composition of salts (Hart & McKelvie, 1986). The extent to which the elevation of mineral ions affects stream ecology is still under investigation but applying a precautionary approach we would recommend that concrete stormwater infrastructure should be avoided in all high conservation values streams where protection of natural water quality and ecosystem health is a management priority. Given the clear difference in water chemistry across the urban development spectrum we recommend new guidelines be introduced (Table 5). The ANZECC (2000) water quality guidelines do not address ions such as calcium and bicarbonate. In a previous study of the Georges River catchment multivariate analysis was used to isolate the most influential environmental variables affecting macroinvertebrate community structure (BIOENV procedure in Tippler et al 2012). This study revealed riparian habitat quality, catchment imperviousness, nitrogen and calcium were the most important attributes that correlate to stream health as indicated by macroinvertebrate community structure. The results of Tippler et al (2012) further emphasises that riparian habitat is highly important for aquatic ecosystem health (Shandas and Alberti 2009; Davies et al 2010; Miserendino et al 2011) and catchment works that only deal with water quality will not result in the full range of benefits that are needed for successful stream remediation projects (Walsh et al 2005). The ANZECC guidelines (2000) do not recommend performance criteria for habitat quality. Given the importance of this variable to the ongoing health of a catchment we have recommended a regionally specific guideline for riparian habitat condition based on the RARC assessment scores. We also recognise that land and water managers may more readily improve stream and riparian habitat for the benefit of stream ecosystems. A key aim of waterway management is to conserve and promote aquatic ecosystem health. Many studies (eg. Urban et al 2006; Wright et al 2007; Roy et al 2003; Walters et al 2009; Davies et al 2010a) have shown stream macroinvertebrates provide a highly relevant and direct measure of ecosystem ‘health’. In this study macroinvertebrate communities in the most highly disturbed streams signalled a degraded ecosystem when compared to moderate or low disturbance catchment streams. For example the mean % EPT taxon (i.e. representing the more sensitive invertebrate groups) was only 1% at highly disturbed sites, when compared with 16% for moderately disturbed catchments and 36% at low disturbed catchment streams. A similar pattern applied for SIGNAL scores and other metrics used in the analysis. Following from this data we recommend new guidelines to assess the health of stream ecology through macroinvertebrate analysis for high conservation value streams and for urban stream assessment and restoration targets (Table 5). The ANZECC guidelines are a very important guide to helping protect water quality in Australia and New Zealand aquatic systems. In the experience of the authors we have seen these be misused and misinterpreted. Very few studies actually follow the clear ANZECC process to determine either local relevant guidelines or management aims supported by appropriate data gathering and analysis. The advantage of this study is that there are multiple naturally vegetated waterways to offer excellent ‘control’ or ‘reference’ waterways that have only slight disturbance by current or historic human activities and accordingly it has not had to rely on proxy sites to established background reference conditions.
The impacts of urban development on stream health are well documented (eg. Walsh et al 2007;
Walsh et al 2004; Walters et al 2009; Paul and Meyer 2001) and we contest that these should be
considered a ‘key threatening process’ to environmentally valuable waterways and to sensitive
ecological communities and species therein. In this study, the level of ecosystem degradation and
water quality impairment reflected the proportional level of urban development with ‘%
imperviousness’ being a reliable surrogate for the extent of urban development. As many parts of this
catchment will be urbanised in the coming decades (NSW Government 2013) there is a need for
planners to consider the implications of where and how new estates and employment centres are built
and managed. Accepting that governments wish to expand their economies and enable land for
housing and development, we would recommend for this catchment that the naturally vegetated
streams (with less than 5% imperviousness) be protected from major landuse change that removes
vegetation or notably increases imperviousness. We would recommend that development be
preferentially located in existing urban centres or in moderately disturbed catchments and include
appropriate water and creek management systems and structures.

Table 5. Locally derived ecosystem guidelines for protection of clean freshwater streams and
moderately disturbed streams in the Georges River catchment compared with default ANZECC
guidelines for upland and lowland rivers.

                          Level of catchment disturbance based on % Impervious        Upland     Lowland
                                                                                           1           1
                                                 Surface                              River       River
                                Low (0-5%)                  Moderate (6-19%)         ANZECC      ANZECC
                       Guideline for the conservation
                        of freshwater streams with      Guideline for urban stream
                              ecological value          assessment and restoration   Guideline   Guideline
Riparian Vegetation Condition
RARC score (x/50)                  >35.8                           >33                  NA          NA
Macroinvertebrate Indices
Order Richness                      >9                             >10                  NA          NA
Family Richness                     >17                            >13                  NA          NA
Order SIGNAL                       >4.85                          >3.67                 NA          NA
Family SIGNAL                      >4.17                          >3.24                 NA          NA
Order Shannon
Index (H)                          >1.77                          >1.62                 NA          NA
Family Shannon
Index (H)                          >2.27                          >2.01                 NA          NA
%EPT                                >28                            >6                   NA          NA
Water Quality
pH
Ca (mg/L)
Commonwealth of Australia (2012) One Land – Many Stories: Prospectus of Investment.Australian
Government, Department of Sustainability, Environment, Water, Population and Communities,
Canberra.
Chessman, B. C. (2003). SIGNAL 2—a scoring system for macro-invertebrate (‘water bugs’) in
Australian Rivers, monitoring river heath initiative technical report no 31. Canberra: Commonwealth of
Australia.

Chessman, B. C. (1995). Rapid assessment of rivers using macroinvertebrates: a procedure based on
habitat-specific sampling, family level identification and a biotic index. Australian Journal of Ecology,
20, 122–129.

Clarke, K.R. (1993). Non-parametric multivariate analyses of changes in community structure.
Australian Journal of Ecology, 18, 117–143.

Davies P.J., Wright, I.A. Findlay S.J., Jonasson, O,J. and Burgin, S. (2010a) Impact of urban
development on aquatic macroinvertebrates in south eastern Australia: degradation of in-stream
habitats and comparison with non-urban streams. Aquatic Ecology 44:685–700.

Davies P.J., I.A. Wright, O.J. Jonasson and S.J. Findlay (2010b) Impact of concrete and PVC pipes on
urban water chemistry. Urban Water Journal Vol. 7, No. 4, 233–241.

DEST, EPA, & WRDC. (1994). River bioassessment manual.Version 1.0, National River Processes
and Management Program, Monitoring River Health Initiative. Canberra: Department of the
Environment, Sport and Territories, Environment Protection Agency, and Land and Water Research
and Development Corporation.

Dunne T. and Leopold L. B. (1978) Water in environmental planning. W. H. Freeman and Company,
San Francisco, California.

Georges River Combined Councils’ Committee (2013)
http://www.georgesriver.org.au/IgnitionSuite/uploads/docs/Geology_GRCCC.pdf. (Accessed July 20,
2013).

Gooderham, J., & Tsyrlin, E. (2002). The waterbug book - guide to the freshwater macroinvertebrates
of temperate Australia. Melbourne: CSIRO.

Hatt, B.E., Fletcher T.D., Walsh C.J., and Taylor S.L. (2004) The influence of urban density and
drainage infrastructure on the concentrations and loads of pollutants in small streams. Environmental
Management 34:112–124.

Hart, B. T. and McKelvie, I. D. (1986). Chemical Limnology in Australia, In ‘Limnology in Australia’.
(Eds. W.D. Williams and P. De Deckker) pp. 3-31. (CSIRO Publishing: Collingwood, Melbourne.)

Hawking, J. H., & Smith, F. J. (1997). Colour guide to invertebrates of Australian inland waters.
Identification guide no. 8. Albury: Cooperative Research Centre for Freshwater Ecology.

Hornsby Shire Council (2012) Water Quality Companion Technical Report Water Quality Report Card

Jansen, A., Robertson, A., Thompson, L., & Wilson, A. (2004). Development and application of a
method for the rapid appraisal of riparian condition, River Management Technical Guideline no. 4.
Canberra: Land & Water Australia.

Kondolf, G. M. & Micheli, E. M. (1995). Evaluating stream restoration projects. Environmental
Management, 19, 1-15.

Krebs, C. (1989). Ecological methodology. New York: Harper Collins.

Ku-ring-gai Council (2013) http://www.kmc.nsw.gov.au/Projects
initiatives/Council_initiatives/Environment_sustainability/Water/Waterways_catchments. (Accessed
July 26 2013).

Liverpool City Council (LCC) (2002) Georges River corridor plan of management and master plan

Larson M. G., Booth D.B. and Morley S.A. (2001) Effectiveness of large woody debris in stream
rehabilitation projects in urban basins. Ecological Engineering 18, 211 – 226.
Marchetti M. P., Lockwood J. L and Light T. (2006) Effects of urbanisation on California’s fish diversity:
Differential, homogenisation and the influence of spatial scale. Biological Conservation 127: 310-318.

Miserendino M.L., Casaux R., Archangelsky M., Yanina Di Prinzio C., Brand C. and Kutschke M.A.
(2011) Assessing land-use effects on water quality, in-stream habitat, riparian ecosystems and
biodiversity in Patagonian northwest streams. Science of the Total Environment 409, 612-624.

Moss, A., Brodie, J. and Furnas, M., 2005. Water Quality guidelines for the Great Barrier Reef World
Heritage Area: a basis for development and preliminary values. Marine Pollution Bulletin, 51: 174-185.

NSW Department of Environment, Climate Change and Water (DECCW) (2010) Lower Hawkesbury-
Nepean River nutrient management strategy.

State of NSW and Environment Protection Authority (2012) NSW State of the Environment 2012.

NSW Department of Infrastructure, Planning and Natural Resources (NSWDIPR) (2004) Biodiversity
of the Georges River Catchment.

NSW Department of Mineral Resources (1983). Sydney, Australia 1:100 000. Geological series sheet
9130 (edition 1). Geological Survey of NSW, NSW Department of Mineral Resources, SydneyNew
South Wales Government (2013) Draft Metropolitan Strategy for Sydney to 2021, NSW Government,
Sydney.

Nodvin, S. C., L. B. Weeks, E. P. E. Thomas, and L. J. Lund (1986), Alkalization of a High-Elevation
Sierra Nevada Stream, Water Resources. 22(7), 1077–1082.

Paul, M. J., & Meyer, J. L. (2001). Streams in the urban landscape. Annual Review of Ecology and
Systematics, 32, 333–365.

Richardson C. J., Flanagan N. E., Ho M. and Pahl J. W. (2011) Integrated stream and wetland
restoration: A watershed approach to improved water quality on the landscape. Ecological Engineering
37, 25–39.

Rosenberg,D.M.,& Resh,V. H. (1993). Freshwater biomonitoring and benthic macroinvertebrates. New
York: Chapman and Hall.

Roy, A. H., Rosemond, M. J., Paul, M. J., Leigh, D. S., & Wallace, J. B. (2003). Stream
macroinvertebrate response to catchment urbanisation (Georgia, USA). Freshwater Biology, 48, 329–
346.

Roy, A. H., Freeman, M. C. Freeman, B. J..Wenger, S. J. Ensign, W. E and. Meyer J. L (2005)
Investigating hydrological alteration as a mechanism of fish assemblage shifts in urbanizing streams.
Journal of the North American Benthological Society 24:656–678.

Ryder D.S and W Miller (2005) Setting and measuring success: linking patterns and processes in
stream restoration. Hydrobiologia 552: 147-158.

Ryder, D, Veal, R, Sbrocchi, C and Schmidt, J (2011). Bellinger-Kalang Rivers Ecohealth Project:
Assessment of River and Estuarine Condition 2009-2010. Final Technical Report to the Bellingen
Shire Council. University of New England, Armidale.

Shandas Vivek and Marina Alberti (2009) Exploring the role of vegetation fragmentation on aquatic
conditions: Linking upland with riparian areas in Puget Sound lowland streams. Landscape and Urban
Planning 90; 66–75.

Sydney Metropolitan Catchment Management Authority (SMCMA). (2012). Georges River.
http://www.sydney. cma.nsw.gov.au/georgesriver.html. (Accessed 5 July 2013).

Tippler Carl, Ian A. Wright & Alison Hanlon (2012a) Is Catchment Imperviousness a Keystone Factor
Degrading Urban Waterways? A Case Study from a Partly Urbanised Catchment (Georges River,
South-Eastern Australia) Water Air and Soil Pollution 223:5331–5344.

Tippler C., Wright I.A and Hanlon A. (2012b) Development of regional water quality and catchment
guidelines for the conservation of aquatic ecosystems: a case study from the Georges River
catchment, in Grove, J.R and Rutherford, I.D (eds). Proceedings of the 6th Australian Stream
Management Conference, Managing for Extremes, 6-8 February, 2012, Canberra, Australian Capital
Territory. Published by the River Basin Management Society..

Urban M. C., Skelly D.K., Burchsted D., Price W. and Lowry S. (2006) Stream communities across a
rural-urban landscape gradient. Diversity and Distributions 12: 337-350.

Walsh, C. J., Waller, K. A., Gehling, J. E., & MacNally, R. (2007). Riverine invertebrate assemblages
are degraded more by catchment urbanisation than by deforestation. Freshwater Biology, 52, 574–
587.

Walsh, C. J., Leonard, A. W., Ladson, A. R., & Fletcher, T. D. (2004). Urban stormwater and the
ecology of streams. Canberra: Cooperative Research Centre for Freshwater Ecology and Cooperative
Research Centre for Catchment Hydrology.

Walsh, C.J., Tim D. Fletcher and Anthony Ladson (2005) Stream restoration in urban catchments
through redesigning stormwater systems: looking to the catchment to save the stream. Journal of the
North American Benthological Society 24(3):690-705.

Walters, D. M., Roy, A. H., & Leigh, D. S. (2009). Environmental indicators of macroinvertebrate and
fish assemblage integrity in urbanizing watersheds. Ecological Indicators, 9, 1222–1233.

Winterbourn M.J,. Harding J. S. and McIntosh A. R. (2007) Response of the benthic fauna of an urban
stream during six years of restoration. New Zealand Natural Sciences 32: 1-12.

Wright I, A., Peter Davies, David Wilks, Sophia Findlay and Mark P Taylor (2007) Aquatic
macroinvertebrates in urban waterways: comparing ecosystem health in natural reference and urban
streams. In Wilson, A.L., Dehaan, R.L., Watts, R.J., Page, K.J., Bowmer, K,H. and Curtis A. (2007).
Proceedings of the 5th Australian Stream Management Conference. Australian rivers: making a
difference. Charles Sturt University, Thurgoona, New South Wales. Published by the River Basin
Management Society

Wright I, A. (2012). Coal mine ‘dewatering’ of saline wastewater into NSW streams and rivers: a
growing headache for water pollution regulators. in Grove, J.R and Rutherford, I.D (eds). Proceedings
of the 6th Australian Stream Management Conference, Managing for Extremes, 6-8 February, 2012,
Canberra, Australian Capital Territory. Published by the River Basin Management Society.

Wright I,A., P.J. Davies, S.J Findlay and O.J Jonasson (2011) A new type of water pollution: concrete
drainage infrastructure and geochemical contamination of urban waters. Marine and Freshwater
Research 62(12) 1355-1361.

University of Melbourne (2008)
http://www.urbanstreams.unimelb.edu.au/Docs/LSC_Project_Update_1.pdf. (Accessed August 20,
2013).
You can also read