Investigating the Effect of Urbanization on Weather Using the Weather Research and Forecasting (WRF) Model: A Case of Metro Manila, Philippines - MDPI
←
→
Page content transcription
If your browser does not render page correctly, please read the page content below
environments

Article
Investigating the Effect of Urbanization on Weather
Using the Weather Research and Forecasting (WRF)
Model: A Case of Metro Manila, Philippines
Jervie M. Oliveros 1,2, *, Edgar A. Vallar 2 and Maria Cecilia D. Galvez 2
 1   Physics Department, Technological University of the Philippines, Manila 1000, Philippines
 2   Applied Research for Community, Health, and Environment Resilience and Sustainability (ARCHERS),
     Center for Natural Science and Environment Research (CENSER), Physics Department, De La Salle
     University, 2401 Taft Ave., Malate, Manila 1004, Philippines; edgar.vallar@dlsu.edu.ph (E.A.V.);
     maria.cecilia.galvez@dlsu.edu.ph (M.C.D.G.)
 *   Correspondence: jervie_oliveros@tup.edu.ph; Tel.: +63-02-372-8933

 Received: 18 October 2018; Accepted: 14 December 2018; Published: 24 January 2019

 Abstract: The effect of urbanization of Metro Manila, particularly on the amount of sensible heat
 flux, rainfall and temperature of selected urban and rural areas, was investigated using the Weather
 Research and Forecasting Version 3.4.1 (WRFV3.4.1) model. National Center for Environmental
 Prediction - Final (NCEP-FNL) grib1 data from 2000 to 2010 were used as inputs into the model for
 meteorological data. The Mann–Kendall trend test (M–K test) was utilized to verify the significance
 of the trends while Sen’s slope estimator was used to quantify the measured trends. Results showed
 that, on average, the sensible heat flux of Metro Manila is about 1.5 × 10⁸ Jm−2 higher than in selected
 areas outside Metro Manila. The occurrence of an urban heat island (UHI) effect was detected in
 Metro Manila by comparing the difference in the minimum and maximum temperatures. For the
 selected urban and rural areas, the minimum and maximum temperature differences (relative to
 Metro Manila) are around 0.4 to 2.4 ◦ C and 0.83 to 2.3 ◦ C, respectively. Metro Manila recorded higher
 11-year average values of rainfall during the summer season (8% to 64%), rainy season (15% to 305%),
 and transition season (8% to 232%) when compared with selected areas from 25 to 100 km from
 Manila. These results show that the sensible heat flux, temperature and rainfall in Metro Manila is
 affected by Metro Manila’s urbanization.

 Keywords: WRF; urbanization; sensible heat flux; rainfall; temperature; Mann-Kendall Test

1. Introduction
     Urbanization is a direct result of physical growth of urban areas due to an increase of their
populations. Based on the 2018 Revision of World Urbanization Prospects, the global urban population
is expected to exceed the rural population by year 2050. By that time, the urban population will be
approximately 70% of the global population and more than half of will be concentrated in Asia [1].
The higher demands of housing in urban areas bring changes in land use where vegetation areas
are transformed to high rise buildings and roads. Sensible heat flux refers to the amount of energy
transferred to the environment by the modified urban surface and the incoming solar radiation.
Sensible heat flux can alter the energy balance and, eventually, the temperature of cities. This can
produce an urban heat island (UHI) effect in cities. UHI is the warming of an urban area which can be
observed in the decrease of the diurnal temperature range (DTR). DTR is the variation between the
maximum temperature (daytime) to the minimum temperature (nighttime) [2]. All of these phenomena
are causing noticeable changes in meteorological conditions, and climates of cities and nearby areas [3].

Environments 2019, 6, 10; doi:10.3390/environments6020010               www.mdpi.com/journal/environments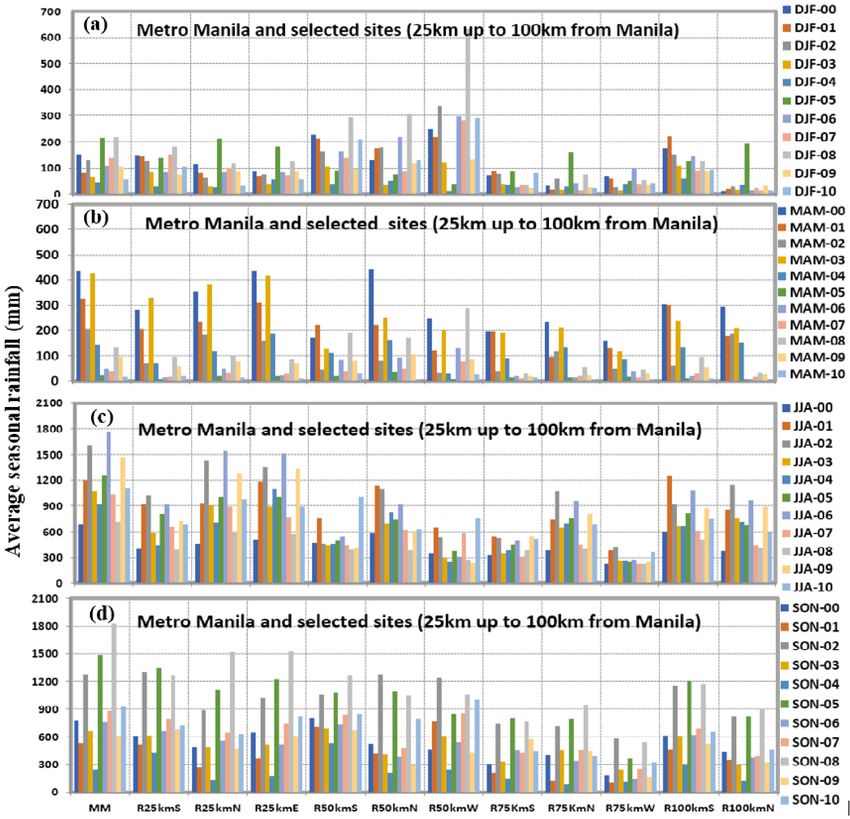
Environments 2019, 6, 10                                                                            2 of 17

      The energy balance of cities is accidentally altered by human activities [4,5]. There is an increase
in energy consumption due to the numbers of vehicles, and aerosol gases in the atmosphere of urban
areas has the effect of decreasing surface insulation [6]. An increasing difference between the amount
of absorbed radiation to the reflected radiation of asphalted road surfaces and concrete high-rise
building walls may cause turbulent convection [5].
      The common materials that make up an urban area are concrete, asphalt, and brick, which are
very different from natural materials of rural areas, such as trees, grass, and wet soils. Heat capacities
and conductivities of asphalted roads and concrete walls of buildings are large compared to wet
soil and grassland. The ability of urban materials to absorb more solar radiation makes urban areas
warmer than rural areas. The noticeable decrease in the observed temperature difference of cities
during daytime and nighttime, in addition to the difference between the air and surface temperature
of central areas of the city and rural areas, are some of the effects of urbanization [2]. This anomaly in
temperature relates to the urban heat island (UHI).
      Urbanization may increase sensible heat flux, reduce evapotranspiration and create a deeper
atmospheric boundary layer [7–9]. These altered conditions of the atmosphere may bring less water
vapor, a high water-vapor mixing ratio, and reduce convective available energy for initiation of
rainfall [10].
      Metro Manila or the National Capital Region (NCR), the capital of the Philippines, is located
at 14.59◦ N, 120.98◦ E. It is considered one of the top five largest urban areas in the world, having
an estimated population of 13,000,000 as of 2015, and projected growth of 1.5% annually [11]. It has
a land area of 638 km2 (around 0.20% of total land area of the Philippines) and a density of about
21,000 people per km2 . Due to its limited size, coastlines of Manila Bay, Laguna Bay, and Pasig River,
and green parks were converted to high-rise building (commercial/residential), with asphalted roads.
Large portions of the coastline are shelters for marginalized urban dwellers. In this study, NCR
has been classified as an urban area (2000–2010). Most of the places in Metro Manila are below sea
level, so most of its population are affected by floods brought by typhoons, sea level rise and local
thunderstorms. In addition, poor ventilation, particularly in depressed areas, will bring discomfort
and can cause health-related problems. Therefore, studying the effect of urbanization of Metro Manila
on its weather, particularly on sensible heat flux, temperature and rainfall, using regional climate
modeling, is essential.

2. Materials and Methods

2.1. Data
     The study utilized meteorological data from January 2000 to December 2010 of the National
Center for Environmental Prediction-Final (NCEP-FNL) grib1 global analysis data. The grid resolution
of the data is 1◦ × 1◦ , and it is prepared every 6 hours. The data consists of topographical and
meteorological variables. The study period was chosen because major infrastructure was constructed
within Metro Manila in this period. More infrastructure is currently being built so the current study is
very significant.
     The Weather Research and Forecasting Model or WRF is a mesoscale numerical weather prediction
system intended for both research and operational applications. The development of this model is
an effort by multiple agencies aiming to build a forecast model and data assimilation system, to
enhance understanding and advance weather prediction [12]. Wang et al. (2006) [13] stated that
WRF performs better than the Fifth-Generation Pennsylvania State University (PSU) / National
Center for Atmospheric Prediction (NCAR) Mesoscale Model or MM5 model in simulating the
position and movement of weather systems that lead to the formation of precipitation processes.
A comparative study of WRF and Regional Climate Model (RegCM) to predict weather in the upper
Mahaweli River basin was conducted by Mafas et al. (2016) [14]. The result showed that rainfall
value was more accurately predicted in the area by the WRF model than the RegCM model. A similar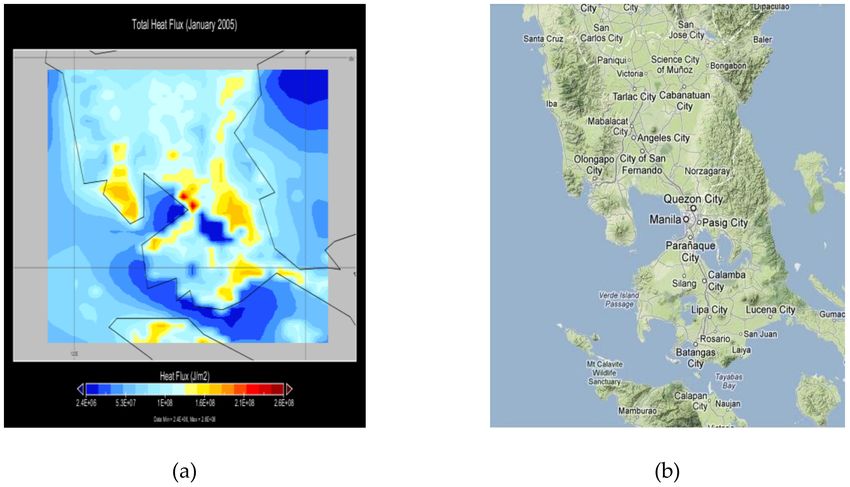
Environments 2019, 6, 10                                                                                   3 of 17

result was obtained by Gsella et al. (2014) [15], when they evaluated the performance of MM5,
WRF and Tropospheric Realtime Applied Meteorological Procedures for Environmental Research
(TRAMPER) models.
      The Weather Research Forecasting Preprocessing System (WPS) of the WRF consists of 3 executable
files namely: geogrid, ungrib, and metgrid. The main function of geogrid is to define the topographic
features of the selected domain. The ungrib reads and rewrites the Network Common Data Form
(NetCDF) or grib file formats into intermediate files for the model to easily understand. Then, the
metgrid horizontally interpolates the meteorological parameters in the domain. The output of metgrid
will be used by the WRF as input for generating real or ideal cases.
      The Weather Research and Forecasting Version 3.4.1 (WRFV 3.4.1) version of the model was used
in the study with the physics options enumerated in Table 1. Listed in this table are the compatible
physics schemes suited to the domain after the sensitivity analysis were made. One-way nesting with
27 km × 27 km and 9 km × 9 km grid spacings (the availability of the resources is the reason of choosing
this resolution) is used in simulating the Luzon as parent domain and Metro Manila as nested domain,
respectively. To reduce the simulation time, the model was set to write the output every 3 hours.
The accumulated sensible heat flux, temperature at 2 m above the surface and rainfall were extracted
in the output. Validation of the model output (Temperature and Rainfall) were conducted using the
historical data of the Philippine Atmospheric Geophysical and Astronomical Services Administration
(PAGASA), the weather bureau of the Philippines. It showed that, using the schemes listed in Table 1,
both generated temperature and rainfall of the selected areas were close (5–15% differences) to the
observed data. The differences may be due to the resolution and data assimilation technique of the
meteorological (NCEP-FNL Reanalysis) data used in the study.

                                   Table 1. Physics schemes used in this study.

                                                      Weather Research and Forecasting (WRF) Single
                    Microphysics
                                                                Moment 3 Class Scheme
                                                    Dudhia Scheme and Rapid Radiative Transport Model
       Shortwave and Longwave Radiation
                                                                      (RRTM) Scheme
             Planetary Boundary Layer                         Yonsei University (YSU) Scheme
                 Cumulus Physics                                   Kain-Fritsch Scheme
               Land Surface Physics                      Noah Land Surface Model (LSM) Scheme
                                                    National Center for Environmental Prediction – Final
          Initial and Boundary Condition
                                                                 (NCEP-FNL) Reanalysis

       The Philippines’ climate can be divided into a dry season and a wet season. The weather of
December, January and February (DJF) is considered the cool and dry season. This is because the
wind originates from the high latitude regions and moves towards the northwest Pacific Ocean and
Philippines. This air stream is also known as the Northeast Monsoon or “Amihan”. March, April and
May (MAM) is a transition period where hot and dry winds come from high pressure systems in the
Pacific Ocean. These months coincide with the local summer season. The months of June, July and
August (JJA) consist of hot and moist air which brings more rainfall. The prevailing wind during this
period is the Southwest Monsoon or “Habagat”. Another transition period starts in September and
ends in November (SON) but, in this case, hot and wet winds come from the West Philippine Sea.
In addition, tropical cyclones contribute largely to the rainfall in the Philippines and occur mostly
during JJA and SON.
       The Modified Coronas Classification (MCC) was used to obtain the weather classification of each
selected site. A Type I climate is characterized by a defined dry and a wet season; wet from June to
November and dry, the rest of the year. For Type II, there is no dry season. On the other hand, a Type
III climate is described by not very pronounced seasons, dry from November to April and wet for the
rest of the year. This resembles Type I climate since they both have a short dry season. Most of the sites
selected in this work are Type I. Type II sites in this study are Infanta (75 km south), Lucena (100 km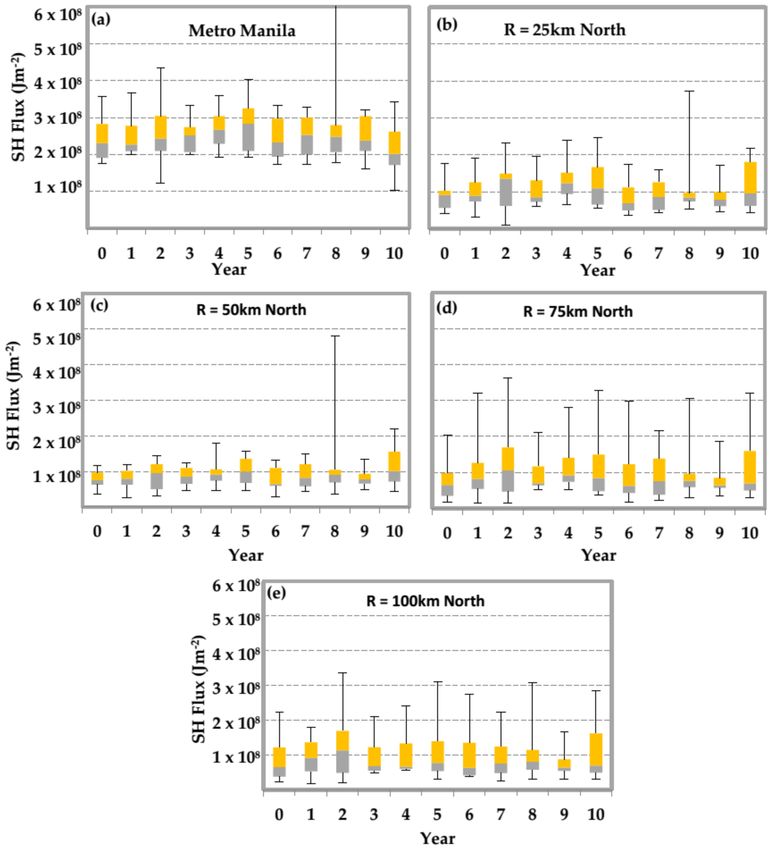
Environments 2019, 6, 10                                                                             4 of 17

South) and Dingalan (100 km east). These 3 sites have been separated from the east and south plots
since their climate is very different from that of Type I and III. Type III sites studied were Cabanatuan
(100 km north) and Luisiana, Laguna (75 km south) but these were included in the south and north
plots since their climate is like that of Type I.
      The temperature from 2000–2010 was divided into 3 parts, namely: the minimum temperature
(Tmin ), the maximum temperature (Tmax ) and the diurnal temperature range (DTR). Tmax used in the
study is the temperature generated by the model every 06:00 UTC or 02:00 PST (Philippine Standard
Time). Tmin is the temperature processed by the model every 21:00 UTC or 05:00 PST. The diurnal
temperature range or DTR is the difference between Tmax and Tmin . To identify the presence of the
urban heat island effect (UHI), the DTR of urban area and rural areas was observed.
      To recognize trends, the Mann–Kendall (M–K) test was conducted. This test is a statistical method
used to identify trends in data, detect climate change, and, in particular, detect UHI intensity [16,17].
Its procedure is based on ranking and is therefore resistant to results of extreme values and deviation
from a linear relationship [18]. This generally measures the correlation between two variables and
requires the data to be independent, and can accept outliers in the data. The standardized test statistics
Z will indicate whether there is an increasing or decreasing trend in the time series. To quantify the
change in magnitude of the trend per unit time, Sen’s slope estimator was combined in the test [16].
The World Meteorological Organization (WMO) highly recommended the use of these tests (M–K test
and Sen’s test). Thus, many researchers have used either both the M–K test and Sens’ test, or only the
M–K test, to investigate the data’s trend and its magnitude [19–23].

2.2. Domain
     The three cities—namely, Manila, Pasig and Quezon City—were used to represent Manila data.
These cities occupy approximately 40% of Manila’s land area and almost 43% of its population lives in
these areas. In addition, these cities were categorized by US Geological Survey (USGS) as urban and
built-up areas during the period of study.
     For urban–rural weather and climate comparison, the 19 nearby rural areas listed in Table 2 were
selected in the study. The selected rural areas are in the big plain of Luzon Island (except for Tagaytay).
Their topographies are similar to Metro Manila, so are ideal for weather comparison. The selection of
the sites based on locations relative to Metro Manila were made to investigate if the leeward sites are
most affected by the induced weather of Metro Manila. The coordinates, climate classification and
land use category index of every location during the period of study are also included in the table.
These were included to determine whether the urbanization of Metro Manila affects the local climate
of nearby areas. Also, the range segregation (25, 50, 75, and 100 km) aids in determining the extent and
magnitude of the effect of Metro Manila’s urbanization.
     Some of the surrounding rural areas in Bulacan, Rizal, Cavite and Laguna are also undergoing
urbanizations. In this study, the urbanization of nearby areas is assumed to be negligible in comparison
with the rate of urbanization of Manila. In addition, areas like Infanta, Dingalan and Lucena have been
excluded in the plots in this subsection since they have a Type II climate (MCC). Tagaytay has also
been excluded in the plots.

3. Results and Discussions
    This section analyzes the urbanization of Metro Manila and its effect on the weather of Metro
Manila and surrounding places (up to 100 km away), particularly in terms of sensible heat flux,
temperature and rainfall. Graphs of these parameters were made to illustrate the changes over the period
2000–2010. Furthermore, Mann–Kendall results were conducted to show trends and their magnitudes.

3.1. Effects on Sensible Heat Flux
   The materials (concrete, asphalt, and steel) that make up the numerous structures in Metro
Manila absorb more solar radiation compared to natural materials (i.e., trees, wood, and soil) used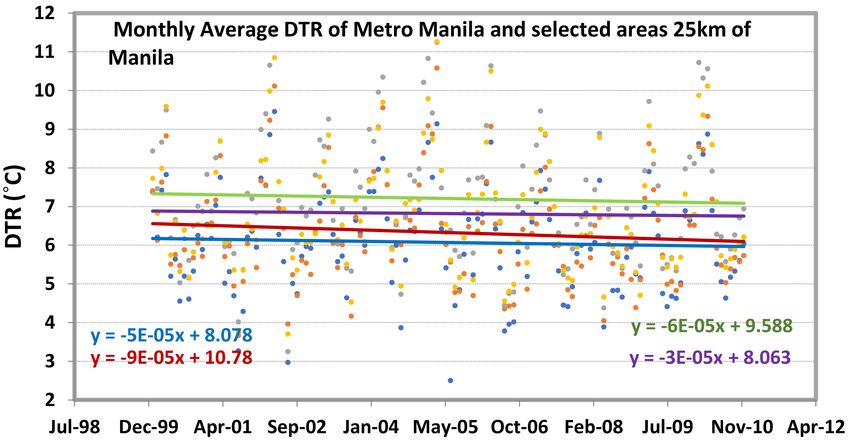
Environments 2019, 6, 10                                                                                           5 of 17

in neighboring rural areas. Part of the absorbed radiation is transformed into heat which causes
an increase in the air temperature of cities [5,24]. Recent research on worldwide land use land
cover (LULC) changes of urban areas suggests this may have contributed to increased global mean
temperature. Hence, further studies on the impacts of LULC change on climate are necessary [25,26].
      Table 2 lists the land use (LU) category assigned by the US Geological Survey (USGS) to Metro
Manila and the other sites used in this study. Identifying the LU is important in assessing sensible heat
flux, since the LU classification gives an idea of the predominant material in each site. Varied materials
have different thermodynamic properties (such as heat capacity and emissivity).

      Table 2. Selected urban and rural areas with corresponding Modified Corona Classification (MCC) and
      land use (LU) categories.

                 Sites                    Location                Coordinates           MCC Type           LU
                                       Quezon City             14.68◦   N 121.02◦   E        I              1
        Metro Manila (MM)                 Manila               14.60◦   N 121.02◦   E        I              1
                                           Pasig               14.60◦   N 121.11◦   E        I              1
                                        Sta. Maria             14.82◦   N 120.95◦   E        I              3
               25 km N
                                         Bulacan               14.79◦   N 120.88◦   E        I              3
              25 km E                     Cogeo                14.65◦   N 121.21◦   E        I              3
              25 km S                   Gen. Trias             14.40◦   N 120.88◦   E        I              3
              50 km N                    Angeles               15.17◦   N 120.62◦   E        1              3
              50 km W                   Mariveles              14.45◦   N 120.55◦   E        I              3
                                      Gen. Aguinaldo           14.19◦   N 120.80◦   E        I              6
               50 km S
                                         Calamba               14.17◦   N 121.13◦   E        I              3
              75 km N                     Gapan                15.22◦   N 120.95◦   E        I              3
              75 km W                   Olongapo               14.83◦   N 120.33◦   E        I              3
                                           Lipa                13.94◦   N 121.16◦   E        I              2
               75 km S
                                       Luisiana (L)            14.17◦   N 121.52◦   E       III             6
              100 km N                 Cabanatuan              15.50◦   N 120.97◦   E       III             3
                                        San Pablo              14.03◦   N 121.35◦   E        I              6
              100 km S
                                         San Juan              13.76◦   N 121.41◦   E        I              6
                                          Infanta              14.73◦   N 121.65◦   E       II              6
                                         Tagaytay              14.15◦   N 120.98◦   E        I              6
           Elevated Area
                                          Lucena               13.94◦   N 121.61◦   E       II              6
                                        Dingalan               15.42◦   N 121.32◦   E       II              6
      LU 1: Urban and Built-up, 2: Dryland Cropland, 3: Irrigated Cropland and 6: Cropland/Woodland Mosaic. (Source:
      US Geological Survey (USGS) 24 Land Use Classification).

      Figure 1 shows the total sensible heat flux of January 2005 in Luzon. During this period, no
rainfall was recorded in all the study sites. The sensible heat flux of Metro Manila is represented by the
red region while the yellow regions are other highly populated places, some of which are located close
to the mountains found in Luzon and neighboring rural areas of Metro Manila. The terrain of Luzon is
also illustrated in the figure. This reflects the fact that some factors affecting sensible heat flux of an
area are topography (areas near the mountain) and land use (Manila).
      In determining the detailed effect of urbanization on the amount of sensible heat flux, the annual
average sensible heat flux of Metro Manila and selected places (up to 100 km away from Manila) was
measured and analyzed. A comparison of the sensible heat flux of Metro Manila with selected places
south and north of Manila are plotted in Figures 2a–e and 3a–e, respectively. These show that, on
average, sensible heat fluxes of selected rural areas from north and south obtained a value closer to
1.0 × 10⁸ Jm−2 . However, the average sensible heat flux of Metro Manila is about 2.5 × 10⁸ Jm−2 ; that
is, Metro Manila has a higher sensible heat flux compared with selected rural areas located north and
south of Metro Manila. This result shows that the urbanization of Metro Manila causes it to have a
higher sensible heat flux since the amount of incoming solar radiation is not significantly different for
all locations considered in this study.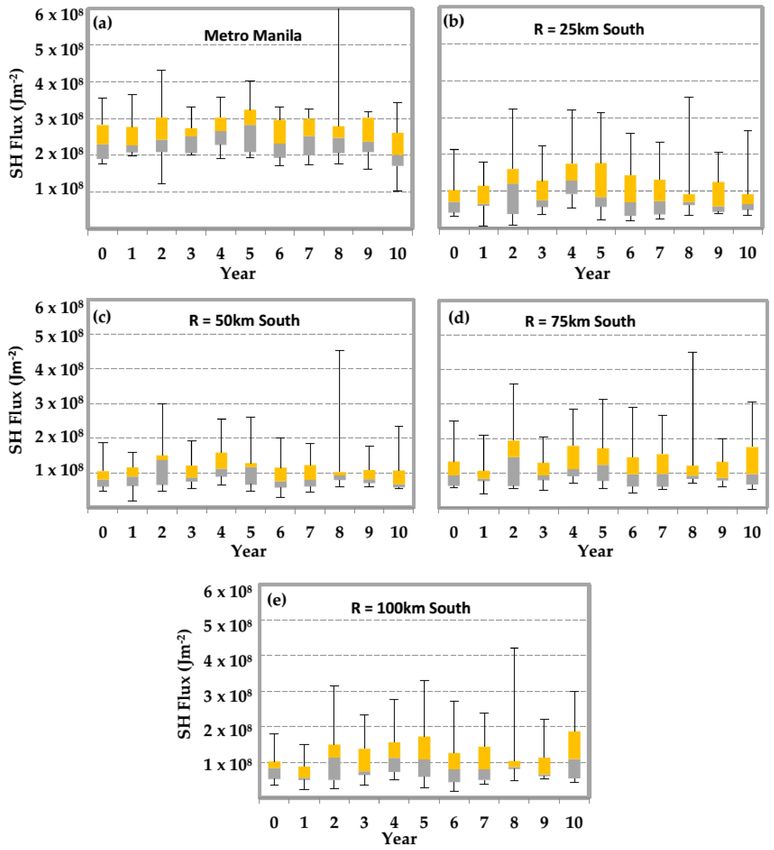
Environments 2019, 6, 10                                                                                      6 of 17

        Figure 1. (a) Variation of sensible heat flux (in Jm−2 ) and (b) terrain of Luzon from Google maps.

      Figure 2. Annual variation of sensible heat (SH) flux of Metro Manila (a) and selected places in the
      south of Manila (b–e) for the period 2000–2010. Figure 2a is the same as Figure 3a.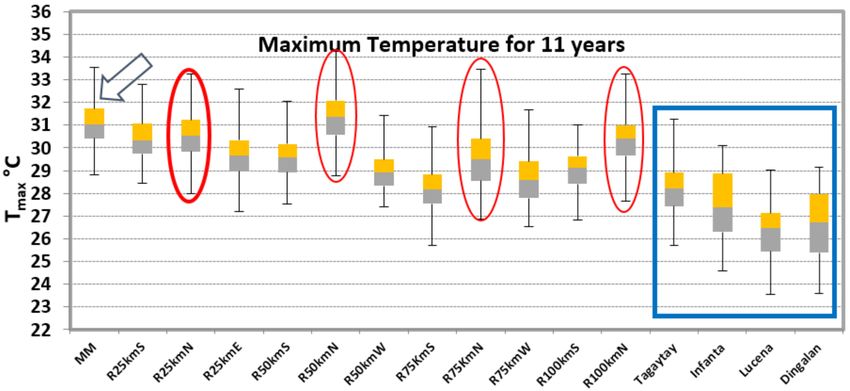
Environments 2019, 6, 10                                                                                 7 of 17

      Figure 3. Annual variation of sensible heat (SH) flux of Metro Manila (a) and selected places in the
      north of Manila (b–e) for the period 2000–2010. Figure 3a is the same as Figure 2a.

     It can be seen in Figures 2a–e and 3a–e that there is no significant difference in the magnitude of
the average sensible heat flux when comparing sites north and south of Manila. Similar results were
obtained for areas east and west of Manila. Further, even the sensible heat flux of selected areas 25 km
from Manila was almost the same as for all directions and all distances away from Manila. The 25 km
area seems unaffected by the urbanization happening in Metro Manila. Therefore, the urbanization
of Metro Manila only affects its sensible heat flux. Moreover, for the period of the study (2000–2010),
Manila’s sensible heat flux has remained constant at about 2.5 × 10⁸ Jm−2 . This indicates that the
level of urbanization of Metro Manila, as measured using sensible heat flux, has leveled off for the
2000–2010 period. There may be more development taking place in the area, but the sensible heat flux
parameter does not indicate this detail.

3.2. Effects on Rainfall
     Metro Manila possesses repetitive structures such as buildings and its roads are constructed
using concrete or a combination of asphalt and concrete. The high heat capacities of these materials
contribute to sensible heat flux and then increase the temperature of the area. In addition, buildings
can provide air convergence, pushing warm and moist surface air into the cooler air above it. This can
modify local atmospheric conditions that lead to less water vapor, more water-vapor mixing and less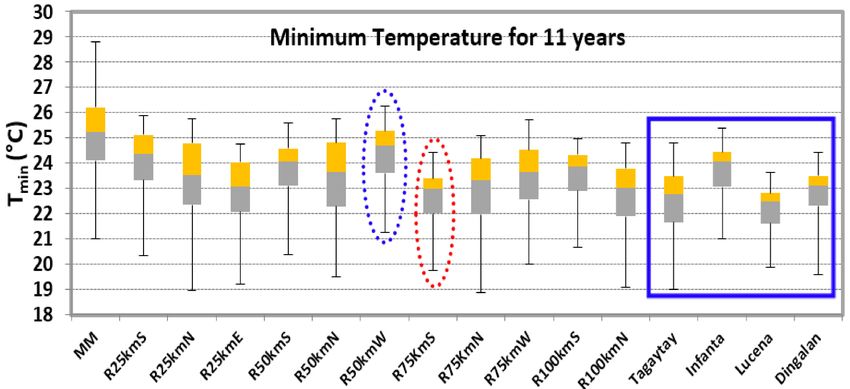
Environments 2019, 6, 10 8 of 17
available energy for generating convection and rainfall formation [27]. Therefore, investigating the
impact of urbanization on rainfall is also important.
3.2.1. Annual Variation of Monthly Rainfall
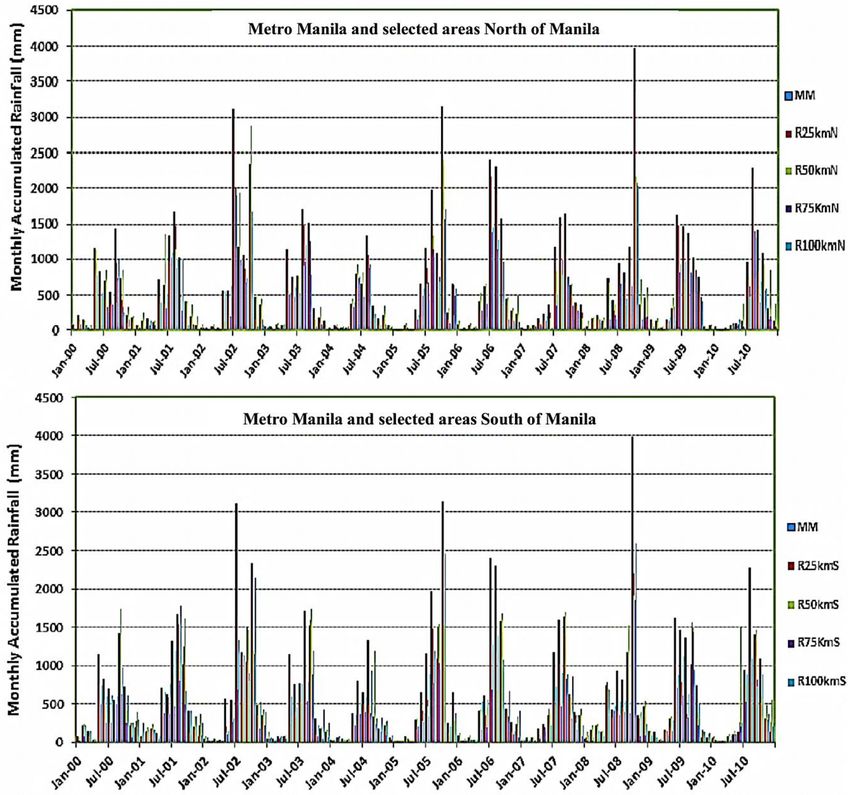
Figure 4 shows the time series of the monthly accumulated rainfall of selected urban and rural
areas north and south of Manila for the period 2000–2010. This figure illustrates the durations of dry
and wet seasons, with large volumes of rainfall measured for the month of June up to November, and
rainfall falling below 500 mm for the remaining months. Similar characteristics were obtained for the
selected sites categorized by MCC as Type I or Type III.
Figure 4. Rainfall distribution (in mm) of Metro Manila and selected areas north and south of Manila
for 2000–2010.
A different result was observed for rainfall distribution for Tagaytay, Infanta, Lucena and Dingalan.
Tagaytay is situated hundreds of meters in altitude above sea level, and the air temperature and air
density are affected by the low pressure. The condensation rate is faster at high altitudes than at lower
altitudes. Therefore, rains are more frequent, even during the dry season of the year. Further, there
was no dry season in Infanta, Lucena and Dingalan for most of the 11-year period. This is because
these places have a Type II climate classification.Environments 2019, 6, 10 9 of 17
3.2.2. Average Seasonal Rainfall
The variations of average seasonal rainfall per year for the selected sites are plotted in Figure 5.
This figure provides information on how urbanization may affect rainfall during either the dry seasons
(DJF and MAM) or the wet seasons (JJA and SON). Looking at Figure 5a, the 50 km groups (south,
north, and west) and 100 km south recorded average rainfalls of 158.77 mm, 136.10 mm, 237.09 mm
and 126.10 mm, respectively. These are about 5% to 98% larger than the rainfall of Metro Manila.
However, the rainfall of Metro Manila is approximately 4% to 220% greater than the 25 km group
(south, north, and east), 75 km group (south, north, and west) and 100 km north.
Figure 5. Volume of rainfall (mm) for 11 years (2000–2010) during the dry seasons (December, January,
and February (DJF) and March, April, and May (MAM)) and wet seasons (June, July, and August (JJA)
and September, October, and November (SON)) of the selected sites.
In addition, Figure 5a also suggests that the average seasonal rainfall during the Northeast
Monsoon is bigger for sites south (25 km, 50 km, 75 km and 100 km) of Manila compared with sites
north of Manila (25 km, 50 km, 75 km and 100 km). This result agrees with the findings of Huff
and Vogel (1978) [28] during their Metropolitan Meteorological Experiment (METROMEX) project
conducted in St. Louis, Missouri, and Estoque and Sta. Maria (2000) [27] in Metro Manila. It can beEnvironments 2019, 6, 10 10 of 17
concluded that the effect of urbanization on rainfall is more visible downwind of the urban area in
relation to the prevailing wind.
A decreasing trend can be observed for the rainfall during the summer season (MAM) of
2000–2010 for all selected places (Figure 5b). The 11-year average rainfall of Metro Manila is 172.46 mm
for this season and is the highest compared with all the sites having similar climate classification.
This corresponds to 8% to 38%, 15% to 41%, 51% to 64% and 33% to 41% higher than the rainfall values
in the groups of 25 km, 50 km, 75 km and 100 km, respectively.
This observed high value of rain in Metro Manila during summer might be the urbanization
effect on rainfall in urban areas. Studies have shown that modifying geometry of urban areas can
generate its own climatic features resulting in an increase in the number of urban-induced changes in
rainfall [10,29]. Subbiah et al. (1991) [5] stated that urban areas experienced more rainy days and more
thunderstorms during warm seasons. Furthermore, rainfall patterns of the urban area are modified
due to the combination of atmospheric circulation induced by UHI and aerodynamic effect of the
urban canopy [30].
Historically, Type I and III (MCC) places experienced more rain during the rainy season (JJA) and
the transition period (SON). As suggested in Figure 5c, Metro Manila, along with the 25 km, 50 km, and
75 km north sites, received higher 11-year average rainfall during Southwest Monsoon (JJA) season
compared with the transition (SON) season. Further, during JJA, the rainfall values of the 25 km,
50 km and 75 km north sites are greater than the south sites. However, during SON (see Figure 5d),
the south sites have greater rainfall than the north sites. Moreover, the rainfall for the south sites is
greater during SON compared to the JJA period. This is because the rain brought by the Southwest
Monsoon or Habagat (JJA) is intensified by tropical cyclones (mostly coming from the Pacific Ocean)
which frequently make landfall in the North Luzon. For the South Luzon, a considerable number of
tropical cyclones arrive during the transition period or SON.
Among all the sites selected in this work (except 100 km north), Metro Manila experienced a
higher 11-year average rainfall during JJA (1166 mm) and SON (906.75 mm). These are about 15%
to 305% and 8% to 232% higher during JJA and SON, respectively. In Figure 5c, it is noticeable that
the magnitudes of rainfall decrease as the distance from Manila increases, except for the 100 km
sites. The increasing number of aerosol gases due to human activities that serve an important role in
cloud formation maybe the reason for such an increase in the magnitude of rainfall in urban areas.
This so-called secondary effect is not considered in the study. The trends of precipitation are analyzed
further in Section 3.3.4.
The value of rain during SON decreases from 25 km north up to 75 km north. No specific rainfall
pattern can be deduced from the south sites.
In general, during summer (MAM) and rainy (JJA) seasons, the high values of average rainfall
are found for areas located 25 km and 50 km north compared to 75 km and 100 km north. A similar
observation can be made for SON and DJF: more rains occur in the areas under 25 km and 50 km
south of Manila than in areas under 75 km and 100 km south. These observations may be the effect of
urbanization on rainfall amount in nearby areas (25–50 km). In addition to this claim is the interaction
between UHI occurrences in Metro Manila and sea breezes from Manila Bay and Laguna Bay.
3.3. Effects on Temperature
3.3.1. Maximum Temperature or Tmax
The variation of the maximum temperature for the sites selected in this study for the period
2000–2010 is plotted in Figure 6. This graph shows that the maximum temperature is in the range of
23 ◦ C to 35 ◦ C. Excluding sites that have a different climate type (Infanta, Lucena and Dingalan) and
elevation (Tagaytay), Tmax varies from 25 ◦ C to 35 ◦ C.Environments 2019, 6, 10 11 of 17
Figure 6. Spatial variation of temperature for the period 2000–2010. MM stands for Metro Manila
(indicated by the arrow) while encircled are the north sites, and the blue box represents the elevated
and MCC Type II.
As can be observed from Figure 6, the average Tmax of Metro Manila (about 31 ◦ C) is larger than
the Tmax of all the other sites selected except for Angeles City (about 31.5 ◦ C) which represents the
50 km north dataset. The Tmax of Metro Manila corresponds to the average maximum temperatures
of Manila, QC and Pasig. In addition, Angeles City can be considered a highly urbanized city due
to conversion of an airbase into commercial, industrial and residential buildings. This is convincing
evidence that pavements and vertical structures are linked to surface temperature increases during
daytime. This brings discomfort and may cause serious health problems for urban dwellers [31].
Analyzing the values of the average Tmax by geographic location, the graph shows that the mean
Tmax of north sites are higher compared to their counterpart equidistant places (south, west and east).
The estimated difference between the averages (for the 11-year period) of Tmax of Metro Manila and
the north sites (except 50 km N), south sites, east (Cogeo) and west are 0.83 ◦ C, 1.73 ◦ C, 1.5 ◦ C and
2.3 ◦ C, respectively.
3.3.2. Minimum temperature or Tmin
The minimum temperatures, Tmin , of selected urban and rural areas for the period 2000–2010 are
shown in Figure 7. Just like the results of Tmax , the highest average Tmin is recorded in Metro Manila
compared with all the other sites selected. The sites selected have an average Tmin that is lower than
the average Tmin of Metro Manila, in the ranges of 0.4 ◦ C to 2.4 ◦ C. The sites included in the blue
box have the same variation in Tmin as the other sites and their average Tmin is mostly lower than the
average Tmin of the other sites.
Sea breezes from Manila Bay (west of Manila) and Laguna Bay (south of Manila) greatly affect
the temperature of Metro Manila. Sea breeze occurs due to the temperature gradient between a body
of water and the land surface. This can bring a cooling effect to places near the coastline area [32].
However, if this wind circulation has a cooling effect for areas near this body of water (Metro Manila
and south of Manila), results show the opposite. Even if bodies of water are close to Metro Manila and
sites up to 25 km south of Metro Manila, the Tmin of these sites are greater than the sites located inland.
All the factors that might alter the weather, such as wind systems, periodic warming and cooling
pattern in the tropical Pacific Region or El Niño Southern Oscillation (ENSO), and many more, are
included in the results. Thus, this suggests that urbanization, which is occurring in Metro Manila,
affects its minimum temperature.
Comparing the different sites outside of Metro Manila, Figure 7 also shows that places south of
Manila recorded the highest average minimum temperature compared with north sites except 75kmEnvironments 2019, 6, 10 12 of 17
south (dotted red circle). Among the south sites, 25 km south reached the highest average value of
Tmin (24.3 ◦ C). Moreover, Mariveles (50 km west) recorded a 24.8 ◦ C average Tmin , which is only 0.4 ◦ C
lower than the Tmin of Metro Manila.
Figure 7. Spatial variation of Tmin (◦ C) for the period 2000–2010. The blue dotted line represents
Mariveles while the blue box separates the sites that are elevated and MCC Type II.
3.3.3. Diurnal Temperature Range (DTR)
Results of Tmax and Tmin successfully revealed the occurrence of UHI and the effect of urbanization
on temperature. The diurnal temperature range analysis is incorporated to give additional proof in
illustrating the UHI effect.
Figure 8 shows the monthly average DTR for the period 2000–2010. Most of the high and low
peaks of DTR happened during the summer season and Southwest Monsoon, respectively. Only 25 km
north and south are included in the graph of DTR trend of Metro Manila because of the suspicion that
the urbanization effect of Metro Manila only extends up to those areas.
Figure 8. Decreasing diurnal temperature range (DTR, ◦ C) of Metro Manila (blue) and 25 km south
(red), 25 km north (green) and 25 km east (violet) of Manila. Decreasing rate is largest at 25 km south.
Decreasing trends were measured for Metro Manila, 25 km north, 25 km south and 25 km east
of Manila. This is a proof of how Metro Manila affects the temperature of nearby areas. Due to theEnvironments 2019, 6, 10 13 of 17
closeness of the magnitudes of the slopes of 25 km sites, it is not possible to identify the direction in
which the effect of urbanization of Metro Manila is at its greatest. A decreasing DTR means that either
Tmin is increasing (at a faster rate compared to Tmax ) or Tmax is decreasing (approaching Tmin ). Both
cases mean that there is not much difference between Tmax and Tmin values, that is, the temperature at
05:00 PST (Tmin ) is close to the temperature at 14:00 PST (Tmax ). The decreasing rate of DTR of Metro
Manila is more evidence (aside from Tmin (urban) > Tmin (selected sites)) of the occurrence of the urban
heat island (UHI) effect.
In general, all the selected sites have shown decreasing trends of DTR. However, it seems that no
trend exists since the line is almost horizontal (approaching zero slope) or the DTR is constant over
time (2000–2010).
3.3.4. Trend analysis using M–K test and Sen’s Slope
The Sen’s slope analysis results for Tmax and Tmin , DTR, and rainfall computed for the period
2000–2010 are listed in Table 3. It shows that there is increasing trend (slope is positive) of Tmin and
Tmax for all selected places except for the Tmax in 75 km west of Manila. The values of the slopes of Tmax
range from −0.001 ◦ C/year to 0.002 ◦ C/year, while for Tmin are from 0.001 ◦ C/year to 0.003 ◦ C/year.
On the other hand, there is a decreasing (negative slope) trend for DTR. This implies that the
minimum temperature increases at a faster rate than the maximum temperature. Thus, the difference
between Tmax and Tmin decreases yielding a negative slope/trend. This is the same as the result of Karl,
T. R. et al. (1991) [33], and means that all the selected locations are experiencing urban growth and
land use change. The areas 25 km south, 50 km south (Calamba and Gen. Aguinaldo) and 75 km west
of Manila have a larger rate (more negative) while other places have almost the same rate as Metro
Manila. Lower rates are found for 25 km east (represented by Cogeo) and 100 km south (represented
by San Pablo, Laguna and San Juan, Batangas).
Furthermore, the average slopes of rainfall for the selected areas under similar weather
classification are also included in the same table. Trends in rainfall for all the selected sites are
slightly positive (less than 1 mm/year) for the period 2000–2010. This means that there has been only
a slight increase in rainfall during this period. The areas 50 km west and 50 km south of Manila have a
higher slope compared with all the other sites, including Metro Manila. This may be because of the
industrial park (50km south) and increasing population resulting in increased convection. However,
upon verification of Tmax and Tmin , DTR, and rainfall trend using the M–K test (Table 3), the computed
p-values are larger than 0.05. Thus, it can be concluded that the computed trends are not statistically
significant for the 11-year period under consideration in this study.
One probable reason for a statistically insignificant result is the period (2000–2010) of study.
Perhaps longer datasets are necessary to see if the trends persist and to allow further investigation of
urbanization effects on weather. In addition, Metro Manila was already categorized as LU = 1 in 2000,
so the transition of Metro Manila from rural to urban was not captured in the study.Environments 2019, 6, 10 14 of 17
Table 3. Mann–Kendall results for the period 2000–2010.
Mann Kendall Test and Sens Slope Estimate on 11 Years Rainfall
Locations MM 25 km S 25 km N 25 km E 50 km S 50 km N 50 km W 75 km S 75 km N 75 km W 100 km S 100 km N
Kendall’s Tau (τ) 0.013 0.024 0.023 0.02 0.046 0.006 0.073 0.019 0.033 0.019 0.019 0.029
p-value
0.829 0.685 0.704 0.74 0.483 0.922 0.214 0.584 0.575 0.754 0.746 0.627
(two-tailed)
Sen’s Slope (Q) 0.128 0.125 0.164 0.183 0.341 0.061 0.728 0.091 0.125 0.076 0.172 0.083
Mann Kendall Test and Sens Slope Estimate on 11 Years Maximum Temperature (Tmax )
Locations MM 25 km S 25 km N 25 km E 50 km S 50 km N 50 km W 75 km S 75 km N 75 km W 100 km S 100 km N
Kendall’s Tau (τ) 0.056 0.021 0.035 0.049 0.01 0.046 0.038 0.019 0.02 −0.031 0.054 0.046
p-value
0.353 0.721 0.558 0.402 0.871 0.431 0.521 0.732 0.735 0.601 0.365 0.439
(two-tailed)
Sen’s Slope (Q) 0.002 0.001 0.001 0.002 0 0.002 0.001 0.001 0.001 −0.001 0.002 0.002
Mann Kendall Test and Sens Slope Estimate on 11 Years Minimum Temperature (Tmin )
Locations MM 25 km S 25 km N 25 km E 50 km S 50 km N 50 km W 75 km S 75 km N 75 km W 100 km S 100 km N
Kendall’s Tau (τ) 0.076 0.077 0.048 0.06 0.089 0.043 0.091 0.043 0.049 0.047 0.075 0.067
p-value
0.202 0.197 0.421 0.312 0.184 0.461 0.120 0.469 0.410 0.427 0.214 0.256
(two-tailed)
Sen’s Slope (Q) 0.003 0.003 0.003 0.003 0.003 0.002 0.003 0.001 0.002 0.002 0.003 0.003
Mann Kendall Test and Sens Slope Estimate on 11 Years Diurnal Temperature Range (DTR)
Locations MM 25 km S 25 km N 25 km E 50 km S 50 km N 50 km W 75 km S 75 km N 75 km W 100 km S 100 km N
Kendall’s Tau (τ) −0.033 −0.068 −0.038 −0.026 −0.062 −0.032 −0.04 −0.018 −0.027 −0.037 −0.015 −0.04
p-value
0.572 0.259 0.542 0.655 0.291 0.593 0.497 0.684 0.645 0.530 0.805 0.499
(two-tailed)
Sen’s Slope (Q) −0.002 −0.003 −0.002 −0.001 −0.004 −0.002 −0.002 −0.002 −0.002 −0.003 −0.001 −0.002
Significant p-value = 0.05, −1 ≤ τ ≤ 1.Environments 2019, 6, 10 15 of 17
4. Conclusions
This work successfully utilized the Weather Research and Forecasting (WRF) model to investigate
the effect of the urbanization of Metro Manila on the weather of Metro Manila and the surrounding
areas. Using WRF, meteorological parameters (such as the sensible heat flux, temperature and rainfall)
for Metro Manila and selected sites 25 km, 50 km, 75 km and 100 km away from Manila were
determined for the period 2000–2010. In addition, WRF also provided the USGS land use classification
for all the sites in this study.
The difference in the sensible heat flux between Metro Manila and the selected areas in this study
can be explained by the physical characteristics (such as increased heat capacities and a decrease
in surface albedo) of the structures in Metro Manila. The sensible heat flux results show that
the urbanization of Metro Manila does not affect the sensible heat flux of the surrounding areas.
The urbanization of Metro Manila only affects its sensible heat flux.
Compared to the selected areas, Metro Manila attained the highest average Tmin of 25.2 ◦ C.
At 05:00 PST, Metro Manila is warmer than all the selected areas in this study. This is due to the UHI
intensity which opposes the breeze coming from Manila Bay and Laguna Bay. UHI intensity is affected
by land modification and population increases. This, in turn, can alter the energy budget and weather
of the urban cities.
Comparing rural areas, 25 km, 50 km and 100 km south obtained high morning temperatures
(Tmin ) while from 25 km to 100 km north obtained high noontime temperatures (Tmax ). Thus, the
warming of Metro Manila extends only up to areas within 25 km of Manila, which is supported by the
result of the DTR trend.
The differences in the temperatures of Metro Manila from the selected sites range from 0.4 ◦ C
to 2.4 ◦ C and 0.83 ◦ C to 2.3 ◦ C for Tmin and Tmax , respectively. One reason for this is the number of
commercial and residential buildings that are scattered inside Metro Manila. Buildings increase surface
roughness, leading to reduced ventilation rates in urban areas. Evapotranspiration is considered one
of the major cooling processes for both atmosphere and the land surface. Transforming vegetation into
high rise buildings in Metro Manila results in less evapotranspiration, larger sensible heat flux and a
warmed environment.
Thus, these Tmax differences between Metro Manila and the other selected sites, along with
the warming morning temperatures, are the effects of urbanization and indicate the presence of an
UHI effect.
It is observed that over the period of study (2000–2010), the DTR values of Metro Manila and the
selected sites were not affected by urbanization of Metro Manila.
Metro Manila’s urbanization leads to increased surface runoff and, thus, produces less evaporation
and evapotranspiration, increases surface temperature and sensible heat fluxes, and can generate more
rainfall. That is why in most seasons (except during the Northeast Monsoon), the 11-year average
rainfall in Metro Manila is larger than for all the selected sites (except at 100 km north during the
transition season (SON)).
M–K tests show a positive trend for rainfall in Metro Manila and for all selected areas. However,
since the computed p-values are greater than 0.05, the trend is not statistically significant.
Author Contributions: The authors shared their ideas in the conceptualization of this research. J.M.O conducted
the formal analysis and investigation. The data curation, visualization, and supervision were made by E.A.V. and
M.C.D.G. Finally, writing, review and editing of the manuscript were prepared by J.M.O and E.A.V.
Funding: This research was funded by, Commission on Higher Education (CHED)–Center of Excellence (COE)
and the De La Salle University (DLSU) Science Foundation.
Acknowledgments: The researchers would like to acknowledge the support of Department of Science and
Technology Science Education Institute (DOST-SEI) and Technological University of the Philippines (TUP),
Commission on Higher Education (CHED) and to the valuable comments and suggestions of Dr. Gerry Bagtasa.
Conflicts of Interest: The authors declare no conflict of interest.Environments 2019, 6, 10 16 of 17
References
1. United Nations DESA. Revision of World Urbanization Prospects. 2018. Available online: https://www.un.
org/development/desa/publications/2018-revision-of-world-urbanization-prospects.html (accessed on
9 November 2018).
2. Wang, K.; Wang, J.; Wang, P.; Sparrow, M.; Yang, J.; Chen, H. Influences of urbanization on surface
characteristics as derived from the Moderate-Resolution Imaging Spectroradiometer: A case study for
the Beijing metropolitan area. J. Geophys. Res.-Atmos. 2007, 112, 1–12. [CrossRef]
3. Çiçek, I.; Turkoglu, N. Urban effects on precipitation in Ankara. Atmosfera 2005, 18, 173–187.
4. Huang, S.; Taniguchi, M.; Yamano, M.; Wang, C. Detecting urbanization effects on surface and subsurface
thermal environment–A case study of Osaka. Sci. Total Environ. 2009, 407, 3142–3152. [CrossRef] [PubMed]
5. Subbiah, S.; Vishwanath, V.; Devi, K. Urban climate in Tamil Nadu, India: A statistical analysis of increasing
urbanization and changing trends of temperature and rainfall. Energy Buildings 1990, 15, 231–243. [CrossRef]
6. Jin, M.; Kessomkiat, W.; Pereira, G. Satellite–Observed Urbanization Characters in Shanghai, China: Aerosols,
Urban Heat Island Effect, and Land-Atmosphere Interactions. Remote Sens. 2011, 3, 83–99. [CrossRef]
7. Sugawara, H.; Narita, K. Roughness length for heat over an urban canopy. Theor. Appl. Climatol. 2009, 95,
291–299. [CrossRef]
8. Taha, H. Urban climates and heat islands: Albedo, evapotranspiration, and anthropogenic heat. Energy Build.
1997, 25, 99–103. [CrossRef]
9. Grimmond, C.; Oke, T. Evapotranspiration rates in urban areas. In Proceedings of the 22nd General Assembly
of the International Union of Geodesy and Geophysics (IUGG99): Impacts of Urban Growth on Surface Water
and Groundwater Quality, Birmingham, UK, 18–30 July 1999; International Association of Hydrological
Sciences (IAHS): Oxfordshire, UK, 1999; pp. 235–244.
10. Zhang, N.; Gao, Z.; Wang, X.; Chen, Y. Modeling the impact of urbanization on the local and regional climate
in Yangtze River Delta, China. Theor. Appl. Climatol. 2010, 102, 331–342. [CrossRef]
11. Philippine Statistics Authority. Available online: https://psa.gov.ph/content/highlights-philippine-
population-2015-census-population (accessed on 15 April 2018).
12. Skamarock, W.; Klemp, J.; Dudhia, J.; Gill, D.; Barker, D.; Wang, W.; Powers, J. A Description of the Advanced
Research WRF (ARW) Version 2 (NCAR/TN–468+STR); Mesoscale and Microscale Meteorology Division,
National Center for Atmospheric Research: Boulder, CO, USA, 2005; Available online: http://opensky.ucar.
edu/islandora/object/technotes%3A479/datastream/PDF/view (accessed on 14 January 2018).
13. Wang, S.; Huang, S.; Li, Y. Sensitive numerical simulation and analysis of rainstorm using nested WRF
model. J. Hydrodyn. Ser. B 2006, 18, 578–586. [CrossRef]
14. Mafas, M.; Muhammadh, K.M.; Weerakoon, S.B.; Mutua, F. Comparative Study of WRF and
REGCM Weather Predictions for the Upper Mahaweli River Basin. In Proceedings of the 7th
International Conference on Sustainable Built Environment, Kandy, Sri Lanka, 16–18 December 2016;
Available online: https://www.researchgate.net/publication/316524322_COMPARATIVE_STUDY_OF_
WRF_REGCM_WEATHER_PREDICTIONS_FOR_THE_UPPER_MAHAWELI_RIVER_BASIN (accessed on
13 November 2018).
15. Gsella, A.; de Meij, A.; Kerschbaumer, A.; Reimer, E.; Thunis, P.; Cuvelier, C. Evaluation of MM5, WRF and
TRAMPER meteorology over the complex terrain of the Po Valley, Italy. Atmos. Environ. 2014, 89, 797–806.
[CrossRef]
16. Karpouzos, D.; Kavalieratou, S.; Babajimopoulos, C. Trend analysis of precipitation data in Pieria Region
(Greece). Eur. Water 2010, 30, 31–40.
17. Chen, J.; Li, Q.; Niu, J.; Sun, L. Regional climate change and local urbanization effects on weather variables
in Southeast China. Stoch. Environ. Res. Risk Assess. 2011, 25, 555–565. [CrossRef]
18. Hirsch, R.; Helsel, D.; Cohn, T.; Gilroy, E. Statistical treatment of hydrologic data. In Handbook of Hydrology;
Maidment, D.R., Ed.; McGraw-Hill: New York, NY, USA, 1993.
19. Mourato, S.; Moreira, M.; Corte-Real, J. Interannual variability of precipitation distribution patterns in
Southern Portugal. Int. J. Climatol. 2010, 30, 1784–1794. [CrossRef]
20. Subash, N.; Singh, S.S.; Priya, N. Variability of rainfall and effective onset and length of the monsoon season
over a sub-humid climatic environment. Atmos. Res. 2011, 99, 479–487. [CrossRef]Environments 2019, 6, 10 17 of 17
21. Duhan, D.; Pandey, A. Statistical analysis of long term spatial and temporal trends of precipitation during
1901–2002 at Madhya Pradesh, India. Atmos. Res. 2013, 122, 136–149. [CrossRef]
22. Gocic, M.; Trajkovic, S. Analysis of changes in meteorological variables using Mann-Kendall and Sen’s slope
estimator statistical tests in Serbia. Glob. Planet. Chang. 2013, 100, 172–182. [CrossRef]
23. Da Silva, R.M.; Santos, C.A.G.; Moreira, M.; Corte-Real, J.; Silva, V.C.L.; Medeiros, I.C. Rainfall and river flow
trends using Mann–Kendall and Sen’s slope estimator statistical tests in the Cobres River basin. Nat. Hazards
2015, 77, 1205–1221. [CrossRef]
24. Asimakopoulos, D.; Asimakopoulos, V.; Chrisomallidou, N.; Klitsikas, N.; Mangold, D.; Michel, P. Energy
and Climate in the Urban Built Environment; Santamouris, M., Ed.; James & James (Science Publishers) Ltd.:
London, UK, 2001.
25. Cao, Q.; Yu, D.; Georgescu, M.; Han, Z.; Wu, J. Impacts of land use and land cover change on regional climate:
A case study in the agro-pastoral transitional zone of China. Environ. Res. Lett. 2015, 10, 124025. [CrossRef]
26. Kim, H.; Kim, Y.; Song, S.; Lee, H. Impact of future urban growth on regional climate changes in the Seoul
Metropolitan Area, Korea. Sci. Total Environ. 2016, 571, 355–363. [CrossRef]
27. Estoque, M.; Sta. Maria, M. Climate Changes Due to Urbanization of Metro Manila; Climate Studies Division,
Manila Observatory: Quezon City, Philippines, 2000.
28. Huff, F.; Vogel, J. Urban, topographic and diurnal effects on rainfall in the St. Louis region. J. Appl. Meteorol.
1978, 17, 565–577. [CrossRef]
29. Zhang, C.; Chen, F.; Miao, S.; Li, Q.; Xia, X.; Xuan, C. Impacts of urban expansion and future green planting
on summer precipitation in the Beijing metropolitan area. J. Geophys. Res.-Atmos. 2009, 114, 1–26. [CrossRef]
30. Yan, Z.; Wang, J.; Xia, J.; Feng, J. Review of recent studies of the climatic effects of urbanization in China.
Adv. Clim. Chang. Res. 2016, 7, 154–168. [CrossRef]
31. Nuruzzaman, M. Urban heat island: Causes, effects and mitigation measures—A review. Int. J. Environ.
Mon. Anal. 2015, 3, 67–73. [CrossRef]
32. Kitayama, H.; Katayama, T.; Hayashi, T.; Tsutsumi, J.; Ishii, A. Statistical analysis of the sea-land breeze and
its effect on the air temperature in summer. J. Wind Eng. Ind. Aerodyn. 1991, 38, 93–99. [CrossRef]
33. Karl, T.; Kukla, G.; Razuvayev, V.; Changery, M.; Quayle, R.; Heim, R.; Easterling, D.R.; Fu, C.B. Global
warming: Evidence for asymmetric diurnal temperature change. Geophys. Res. Lett. 1991, 18, 2253–2256.
[CrossRef]
© 2019 by the authors. Licensee MDPI, Basel, Switzerland. This article is an open access
article distributed under the terms and conditions of the Creative Commons Attribution
(CC BY) license (http://creativecommons.org/licenses/by/4.0/).You can also read