Modeling and Simulations of the Sulfur Infiltration in Activated Carbon Fabrics during Composite Cathode Fabrication for Lithium-Sulfur Batteries ...
←
→
Page content transcription
If your browser does not render page correctly, please read the page content below
Article
Modeling and Simulations of the Sulfur Infiltration in
Activated Carbon Fabrics during Composite Cathode
Fabrication for Lithium-Sulfur Batteries
Kyriakos Lasetta, Joseph Paul Baboo and Constantina Lekakou *

                                          Department of Mechanical Engineering Sciences, University of Surrey, Guildford, Surrey GU2 7XH, UK;
                                          kl00602@surrey.ac.uk (K.L.); j.baboo@surrey.ac.uk (J.P.B.)
                                          * Correspondence: c.lekakou@surrey.ac.uk

                                          Abstract: During the manufacture of a composite cathode for lithium-sulfur (Li-S) batteries it is
                                          important to realize homogeneous infiltration of a specified amount of sulfur, targeted to be at least
                                          5 mg cm−2 to achieve good battery performance in terms of high energy density. A model of the
                                          sulfur infiltration is presented in this study, taking into account the pore size distribution of the porous
                                          cathode host, phase transitions in sulfur, and formation of different sulfur allotropes, depending on
                                          pore size, formation energy and available thermal energy. Simulations of sulfur infiltration into an
                                          activated carbon fabric at a hot-plate temperature of 175 ◦ C for two hours predicted a composite
                                          cathode with 41 wt% sulfur (8.3 mg cm−2 ), in excellent agreement with the experiment. The pore
                                          size distribution of the porous carbon host proved critical for both the extent and form of retained

                                   sulfur, where pores below 0.4 nm could not accommodate any sulfur, pores between 0.4 and 0.7 nm
                                          retained S4 and S6 allotropes, and pores between 0.7 and 1.5 nm contained S8 .
Citation: Lasetta, K.; Baboo, J.P.;
Lekakou, C. Modeling and
                                          Keywords: composite cathode; sulfur infiltration; porous carbon host; modeling; computer simula-
Simulations of the Sulfur Infiltration
                                          tions; sulfur allotropes
in Activated Carbon Fabrics during
Composite Cathode Fabrication for
Lithium-Sulfur Batteries. J. Compos.
Sci. 2021, 5, 65. https://doi.org/
10.3390/jcs5030065                        1. Introduction
                                               Lithium-sulfur (Li-S) batteries are one of the latest generation lithium batteries, pur-
Academic Editor: Francesco                sued due to their high theoretical energy density, 2510 Wh kg−1 [1], compared to an
Tornabene                                 expected maximum of 250 Wh kg−1 for conventional Li-ion batteries [2–4]. Li-S batteries
                                          typically comprise a lithium anode and a composite sulfur cathode, consisting of sulfur
Received: 19 January 2021                 as the active cathode material and a porous host, which provides electronic conductivity
Accepted: 20 February 2021
                                          and structural integrity. Such hosts include activated carbon fabrics (ACF) [5], hollow
Published: 25 February 2021
                                          nanofibers [6], hierarchically porous carbon coatings [7–10], graphene, and graphene ox-
                                          ide [11,12], where oxygen groups and functional, transition metal oxide groups [9,10] trap
Publisher’s Note: MDPI stays neutral
                                          sulfur and polysulfides and thus reduce the “shuttling” effect during battery operation, and
with regard to jurisdictional claims in
                                          highly conductive materials such as carbon black and multiwall carbon nanotubes [13,14].
published maps and institutional affil-
                                          Furthermore, the porous carbon cathode host contributes a supercapacitor element [12,14–23],
iations.
                                          hence, increasing the power density of the Li-S battery. In this manner, a Li-S battery
                                          with such composite cathode is a hybridized battery/Li-ion capacitor [24], combining the
                                          high energy density of the Li-S battery and the high power density of the Li-ion capacitor
                                          (consisting of the lithium anode and porous carbon cathode), similarly to composite su-
Copyright: © 2021 by the authors.
                                          percapacitors [25,26] but with much higher energy density, as the theoretical capacity of a
Licensee MDPI, Basel, Switzerland.
                                          Li-S battery reaches 1670 Ah gs −1 (where gs −1 denotes per gram of sulfur). A Li-S battery
This article is an open access article
                                          with a composite cathode can be easily recycled by disassembly [27] and liquid processing,
distributed under the terms and
                                          dissolution of binder and sulfur [28,29], dielectrophoresis [30], and filtration techniques.
conditions of the Creative Commons
                                               In order for the Li-S battery to achieve the expected high capacity and energy density,
Attribution (CC BY) license (https://
                                          the amount of sulfur needs to be maximized in the composite cathode, recently specified
creativecommons.org/licenses/by/
4.0/).
                                          above 5 mg cm−2 of cathode [31], with at least 70 wt% sulfur in the composite cathode

J. Compos. Sci. 2021, 5, 65. https://doi.org/10.3390/jcs5030065                                                  https://www.mdpi.com/journal/jcs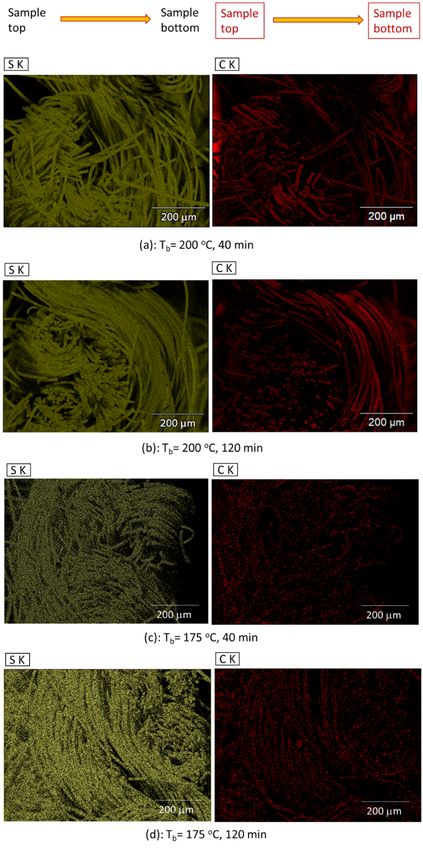
J. Compos. Sci. 2021, 5, 65                                                                                               2 of 17

                              to minimize the weight of the redox-passive carbon host [1,6,7,11,31]. The infiltration
                              stage is critical for the homogeneous sulfur impregnation through all host material and
                              all pore sizes, while the porous host should have the required pore volume and pore size
                              distribution to accommodate the specified amount and proportion of sulfur. There are
                              different sulfur infiltration techniques in the porous cathode host [32]. Melt infiltration is
                              the most common technique [5,6,8], where sulfur powder is placed on top of a fabric or
                              other type of scaffold host or mixed with the carbon powder and heated above its melting
                              point, where the lowest viscosity of sulfur is at 155 ◦ C (20 mPa s), quickly rising to 54 Pa s at
                              165 ◦ C and further as it polymerizes, reaching a maximum of 940 Pa s at 190 ◦ C and falling
                              thereafter to 60 Pa s at 280 ◦ C [33]. Solution infiltration is another technique [12], rarely used
                              because there are few good solvents for sulfur, all highly toxic, and there is the problem
                              of solvent removal, usually by solvent evaporation, which would also lead to sulfur
                              sublimation [12] that can easily take place even at relatively low temperatures between
                              25 and 50 ◦ C [34]. Vapor infiltration [35] results in impregnation of smaller pores and
                              shorter required duration of the infiltration process [35], where isothermal vapor infiltration
                              at 135, 155, and 175 ◦ C took place in 50, 30, and 7 min, respectively [35]. Although it can be
                              seen that there is an overlap between the temperatures of the melt [5,13,32,33] and vapor
                              processing [35], no investigations have been carried out, experimentally or theoretically,
                              to resolve the proportion of melt and vapor contribution in the infiltration process at the
                              usual infiltration temperatures in the range of 120–155 ◦ C [5,13,32,33].
                                    An additional question is which pore sizes may be able to accommodate sulfur and
                              in which allotrope form, given that solid sulfur is typically encountered as octasulfur, S8 ,
                              but can also exist in other allotrope forms [36]. Activated porous carbons and graphene
                              or graphene oxide have pore size distributions [5,9,10,24,25] including slit pores from
                              0.3 nm, representing interlayer spacing in graphite, 0.63 nm, and other pore sizes thereafter.
                              While melt, solution, or vapor infiltration dynamics might resemble flow through porous
                              media and could be modelled by Darcy’s law [37], for example, there is the question of
                              which pore sizes can accommodate which sulfur allotropes. No theoretical, modeling, or
                              computational study has been carried out of the sulfur infiltration of the porous carbon
                              cathode host.
                                    We present, for the first time, a novel model of sulfur infiltration in parallel porous
                              paths of different pore sizes from the pore size distribution of the porous cathode host
                              with simultaneous heat transfer. In this model, we considered both sulfur sublimation
                              and evaporation, as well as melting, of course, and formation of different sulfur allotropes
                              depending on the pore size compared to the sulfur allotrope molecule size and also on
                              the available thermal energy compared to the required sulfur allotrope formation energy.
                              Computer simulations were carried out to predict sulfur retention and distribution for
                              different sulfur allotropes in different pore sizes and across the cathode thickness. The
                              predictions were compared with data of sulfur retention from an experimental study with
                              an activated carbon fabric (ACF) host.

                              2. Materials and Experimental Methods
                                   The cathode host was ACF Kynol® ACC-507-15 (Kynol Europe GmbH (Hamburg,
                              Germany): areal density of 12 mg cm−2 and specific surface area BET = 1461 m2 g−1 ),
                              presented in Figure 1a,b, with a discretized pore size distribution (PSD) (Figure 1c) derived
                              from data of nitrogen adsorption experiments [24]. The PSD started at 0.3 nm and exhibited
                              peaks at 0.69 nm and 1.31 nm, which were in the micropore range. Micropores were
                              expected to be of slit shape in phenolic-derived ACFs, as was the Kynol® fabric [24,38].
                              Figure 1b displays that macro- and mesopores of approximately circular cross section were
                              also present and, during sulfur infiltration or battery operation, provided the transport
                              channels for the transported species, sulfur, or ions [24], respectively, to reach the large
                              proportion of micropores that dominated the PSD of the ACF. Sulfur powder (Sigma
                              Aldrich, Gillingham, UK) was used as the active cathode material, via an infiltration stage
                              into the porous ACF host.
channels for the transported species, sulfur, or ions [24], respectively, to reach the large pro-
portion of micropores that dominated the PSD of the ACF. Sulfur powder (Sigma Aldrich,
J. Compos. Sci. 2021, 5, 65 Gillingham, UK) was used as the active cathode material, via an infiltration stage into the3 of 17
porous ACF host.
Figure
Figure 1. Cathode
1. Cathode host:SEM
host: (a,b) (a,b)images
SEM images of cathode
of cathode host activated
host activated carbon
carbon fabric fabric(c)
(ACF); (ACF); (c) dis-
discre-
cretized pore size distribution (PSD) of cathode
tized pore size distribution (PSD) of cathode host ACF. host ACF.
ACFACF samples
samples of 1 cm cm2mg)
of 12 (12 (12 were
mg) were
placedplaced on 1-cm
on 1-cm
2 aluminum foil (of 30-µm thick-
2 aluminum foil (of 30-µm thick-
ness,ness, utilized
utilized as current
as current collector
collector in theinbattery
the battery cathode).
cathode). Twelve Twelve mg
mg of of sulfur
sulfur powder powder
was was
sprinkled on the free top surface of each ACF sample. The assembly was wrapped by a by a
sprinkled on the free top surface of each ACF sample. The assembly was wrapped
single
single layerlayer of aluminum
of aluminum foilentrap
foil (to (to entrap any sulfur
any sulfur vapor vapor as much
as much as possible),
as possible), taking taking
care care
for the wrap not to touch the sulfur powder. Finally, each wrapped assembly was placed
for the wrap not to touch the sulfur powder. Finally, each wrapped assembly was placed
in a sealed pressure vessel from stainless steel of a circular base of 160-mm diameter and
in a sealed pressure vessel from stainless steel of a circular base of 160-mm diameter and
height of 110 mm, as illustrated in Figure 2a. The pressure vessel was placed on a hot plate
height of 110 mm, as illustrated in Figure 2a. The pressure vessel was placed on a hot plate
for a specified period of time. Different experiments were carried out at three different
for a specified period of time. Different experiments were carried out at three different
hot-plate temperatures: Tb = 150, 175, and 200 ◦ C. External temperature monitoring was
hot-plate temperatures: Tb = 150, 175, and 200 °C. External temperature monitoring was
carried out during each experiment using an infrared (IR) camera (Figure 2b). On the basis
carried out during each experiment using an infrared (IR) camera (Figure 2b). On the basis
of the ideal gas law, a gauge pressure range of 0–0.6 bar was estimated, where the safety
of the ideal gas law, a gauge pressure range of 0–0.6 bar was estimated, where the safety
valve in the pressure vessel was set to 1 bar and was never reached, i.e., the safety valve
valve in the pressure vessel was set to 1 bar and was never reached, i.e., the safety valve
did not open in any of the experiments. It must be mentioned that the dimensions of the
did not open in any of the experiments. It must be mentioned that the dimensions of the
pressure vessel were designed so if its base allocated a maximum number of eight samples,
pressure vessel were designed so if its base allocated a maximum number of eight sam-
the estimated maximum gauge pressure was below the safety valve setting of 1 bar. After
ples,40themin
estimated
and aftermaximum
2 h at Tb , gauge
followedpressure
by 12 hwas below
cooling to the
roomsafety valve setting
temperature, of 1 bar.were
the samples
Afterremoved
40 min and after 2 h at Tb, followed by 12 h cooling to room temperature, the samples
from the vessel; the 40- and 120-min experiments were independent experiments,
werewhere
removed the from the vessel; the
2-h experiments 40- and
were 120-min experiments
not interrupted. Each samplewere independent
on the current exper-
collector
iments,
foilwhere the 2-h experiments
was weighed before and after weresulfur
not interrupted.
powder was Each sample
added, on the
as well current
as at the endcol-
of the
lectorspecified
foil wasperiod
weighed before and after sulfur powder was added, as well as
of sulfur infiltration processing. Samples were examined under scanning at the end
of the specified
electron period ofHR-SEM
microscope sulfur infiltration
JEOL-7100 processing.
F (JEOL Ltd.,Samples were examined
Tokyo, Japan) in terms ofunder
SEM and
scanning electron microscope HR-SEM
EDX (energy-dispersive X-ray spectroscopy). JEOL-7100 F (JEOL Ltd., Tokyo, Japan) in terms of
SEM and EDX (energy-dispersive X-ray spectroscopy).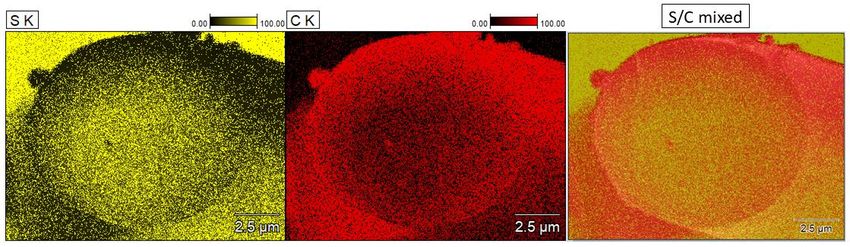
J. Compos. Sci. 2021, 5, x FOR PEER REVIEW 4 of 17
J. Compos. Sci. 2021, 5, x FOR PEER REVIEW 4 of 17
J. Compos. Sci. 2021, 5, 65 4 of 17
Figure 2. Sulfur impregnation setup: (a) assembly for the sulfur impregnation into ACF cathode
host; y axis for the model in Section 3; (b) an infrared photograph from the temperature-monitor-
ing procedure. 2. Sulfur impregnation setup:
Figure
Figure 2. Sulfur impregnation setup: (a) (a) assembly
assembly forfor
thethe sulfur
sulfur impregnation
impregnation into
into ACF
ACF cathode host;
cathode
host;y y
axis forfor
axis thethe
model in Section
model 3; (b)
in Section 3;an
(b)infrared photograph
an infrared from the
photograph temperature-monitoring
from procedure.
the temperature-monitor-
3. Modeling of the Sulfur Infiltration in the Porous Cathode Host
ing procedure.
3. Modeling of the Sulfur Infiltration in the Porous Cathode Host
A numerical model was developed for the heat transfer and sulfur impregnation in
3. Modeling
the cathode A numerical
host. of the
On model
theSulfur
basis of was
the developed
Infiltration
diagram in the for the heat
Porous
presented transfer
Cathode
in Figure and
Host
2a, sulfur impregnation in
one-dimensional
equations Athe cathode
were host.
assembled On the
in the basis of the diagram presented in Figure 2a, one-dimensional
numerical model wasy-axis, givenfor
developed thethesmall
heatthickness of each
transfer and component
sulfur impregnationin in
equations
the assembly. were assembled in the y-axis, given the small thickness of each component in
the cathode host. On the basis of the diagram presented in Figure 2a, one-dimensional
All the assembly.
possible sulfur allotropesinwere considered forthe
melt or low-temperature
equations were assembled the y-axis, given small thickness of eachvapor [36] in
component
and the lowest All possible
energy sulfur allotropes
structures were were as
selected, considered
predicted for
by melt or low-temperature
density functional theory vapor [36]
the assembly.
and
(DFT) simulationsthe lowest energy
by Jackson structures
et al. [39]. were
Furtherselected,
molecular as predicted
simulations by density functional
were carriedvapor theory
out [36]
All possible sulfur allotropes were considered for melt or low-temperature
(DFT) simulations by Jackson et al. [39]. Further molecular simulations were carried out
in thisand
study for geometrical
the lowest optimization,
energy structures were using
selected,Avogadro, and by
as predicted thedensity
resulted molecular
functional theory
in this study for geometrical optimization, using Avogadro, and the resulted molecular
models are
(DFT) displayed
simulations in Figure
by Jackson 3a, together
et al. [39].with the measured
Further molecular minimum
simulations dimension for
were carried out
models are displayed in Figure 3a, together with the measured minimum dimension
each allotrope
in this model
study for and their formation
geometrical energy,using
optimization, as calculated
Avogadro, by and
Jackson
the et al. [39]molecular
resulted em-
for each allotrope model and their formation energy, as calculated by Jackson et al. [39]
ploying DFT simulations.
models are displayed On inthe basis3a,
Figure of the minimum
together withofdimension
the of each sulfur allotrope,
employing DFT simulations. On the basis themeasured
minimum minimum
dimension dimension
of each for sulfur
it waseach
deducted which
allotrope allotrope
model and mayformation
their be accommodated
energy, incalculated
as each pore by size, as is presented
Jackson et al. [39] em-as is
allotrope, it was deducted which allotrope may be accommodated in each pore size,
for the peaks DFT
ploying of the PSD of the On porousbasis
cathode host ACF in Figure 3b. Pores smaller than
presentedsimulations.
for the peaks ofthe the PSDofofthe minimum
the dimension
porous cathode hostofACF
each sulfur
in allotrope,
Figure 3b. Pores
0.4 nm could
it was not
deducted accommodate
which any
allotrope sulfur
may bein any form
accommodated and pores
in each smaller
pore than
size, as 0.7
is nm
presented
smaller than 0.4 nm could not accommodate any sulfur in any form and pores smaller than
couldfornotthe
accommodate
peaks of the S8 andofS7the
. porous cathode host ACF in Figure 3b. Pores smaller than
0.7 nm could notPSD
accommodate S8 and S7 .
0.4 nm could not accommodate any sulfur in any form and pores smaller than 0.7 nm
could not accommodate S8 and S7.
3. Sulfur in
Figureallotropes
Figure 3. Sulfur allotropes in pores
relation to relation to porescathode
in porous in porous
host:cathode host: (a)
(a) molecular molecular
models of models of
sulfur allotropes, minimum dimension
sulfur allotropes, minimum dimension (Lmin) for each (L min allotrope and formation energy (DHf) [39]; f ) [39]; (b)
) for each allotrope and formation energy (DH
possible accommodation of allotropes
(b) possible accommodation of allotropes in different in different pore (d
pore sizes sizes (dp), corresponding
p), corresponding to the peaks
to the peaks of of the
Figure 3. Sulfur allotropes in relation to pores in porous cathode host: (a) molecular models of
the PSD inPSD
Figure 1c.
in Figureminimum
1c.
sulfur allotropes, dimension (Lmin) for each allotrope and formation energy (DHf) [39];
(b) possible accommodation of allotropes in different pore sizes (dp), corresponding to the peaks of
the PSD in Figure 1c.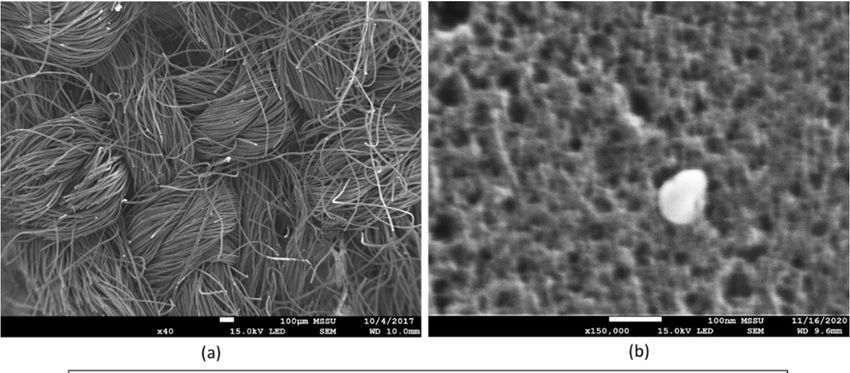
J. Compos. Sci. 2021, 5, 65                                                                                                    5 of 17

                                      The vertical assembly of different materials during the sulfur infiltration comprised
                                  from bottom to top (also see Figure 2a):
                                  (a)    hot-plate specified temperature: Tb ;
                                  (b)    pressure container wall from stainless steel (ρ = 8000 kg m−3 ; cp = 468 J kg−1 K−1 ;
                                         k = 16.3 W m−1 K−1 ) of thickness of 3 mm;
                                  (c)    aluminium foil of wrap (ρ = 2725 kg m−3 ; cp = 910 J kg−1 K−1 ; k = 235 W m−1 K−1 )
                                         of thickness of 30 µm;
                                  (d)    aluminium foil of current collector (ρ = 2725 kg m−3 ; cp = 910 J kg−1 K−1 ;
                                         k = 235 W m−1 K−1 ) of thickness of 30 µm;
                                  (e)    ACF (ρ = 240 kg m−3 ; specific heat capacity in J kg−1 K−1 as a function of absolute
                                         temperature T: cp = 0.0004T + 0.8133; k = 0.12 W m−1 K−1 ) of thickness of 500 µm;
                                  (f)    ACF-sulfur composite consisting of ACF infiltrated with sulfur of varying thickness
                                         from 0 (non-infiltrated ACF) to 500 µm (fully infiltrated ACF);
                                  (g)    sulfur layer of 12 mg cm−2 , consisting of initially solid S8 allotrope (ρ = 2070 kg m−3 ;
                                         cp = 706 J kg−1 K−1 ; k = 0.205 W m−1 K−1 ) which when melt (ρ = 1819 kg m−3 ;
                                         cp = 975 J kg−1 K−1 ; k = 0.205 W m−1 K−1 );
                                  (h)    air layer (at temperature T (K) and pressure P (Pa): ρ T,P = 3.6 × 10⁻³ P/T in kg m−3 ;
                                         cp = 1010 J kg−1 K−1 ; k = 34 + 0.07(T − 273) in mW m−1 K−1 ) of thickness of 3 mm;
                                  (i)    aluminium foil of wrap (ρ = 2725 kg m−3 ; cp = 910 J kg−1 K−1 ; k = 235 W m−1 K−1 )
                                         of thickness of 30 µm;
                                  (j)    air (at temperature T (K) and pressure P (Pa): ρ T,P = 3.6x10⁻³ P/T in kg m−3 ;
                                         cp = 1010 J kg−1 K−1; k = 34 + 0.07 (T − 273) in mW m−1 K−1) of thickness of 100 mm;
                                  (k)    pressure container ceiling from stainless steel (ρ = 8000 kg m−3 ; cp = 468 J kg−1 K−1 ;
                                         k = 16.3 W m−1 K−1 ) of thickness of 3 mm.
                                         The heat transfer equation for each single material layer, i, is given by:

                                                                     ∂T     ki ∂ 2 T
                                                                          ρi cp,i ∂y2 ∑
                                                                        =            − Rj DHf,Sj                                  (1)
                                                                     ∂t               j

                                  where T is the temperature, t is the time, y is the vertical axis, ρ is density, cp is specific
                                  heat capacity, k is thermal conductivity, subscript i denotes layer i, and ∑ Rj DHf,Sj is the
                                                                                                                  j
                                  power lost due to the formation of new sulfur allotropes j. The air pressure in the container
                                  was updated according to the updated air temperature, employing the ideal gas law. The
                                  specific heat capacity of sulfur, cp,S , is given as a function of the absolute temperature, T (in
                                  K), by the following relation with the values of the constants given in Table 1 [40].

                                                                                a + bT + cT2 + dT3
                                                                       cp,S =                                                     (2)
                                                                                       0.032

                                            Table 1. Density and heat capacity of sulfur [40].

                              Solid S8 Orthorhombic        Solid S8 Monoclinic             Melt Sulfur           Melt Sulfur
            Title 1
                                     T < 95 ◦ C             95 ◦ C ≤ T < 120 ◦ C       120 ◦ C ≤ T < 159 ◦ C     159 ◦ C ≤ T
        ρS (kg m−3 )                     2070                       1960                      1819                     1819
             a                          21.22                      21.22                    −4540.97                  −37.93
             b                           3.86                       3.86                    26,065.60                 133.24
             c                          22.27                      22.27                    −55,520.70                −95.32
             d                          −10.32                     −10.32                   42,112.20                 24.01

                                      For the composite ACF-S, the thermal diffusivity, ρ kcip,i , is given by the rule of mixtures,
                                                                                         i
                                  where the thermal diffusivity of the sulfur is weighted by the volume fraction of the
                                  impregnated sulfur in the ACF. At the boundaries between adjacent layers, there is heat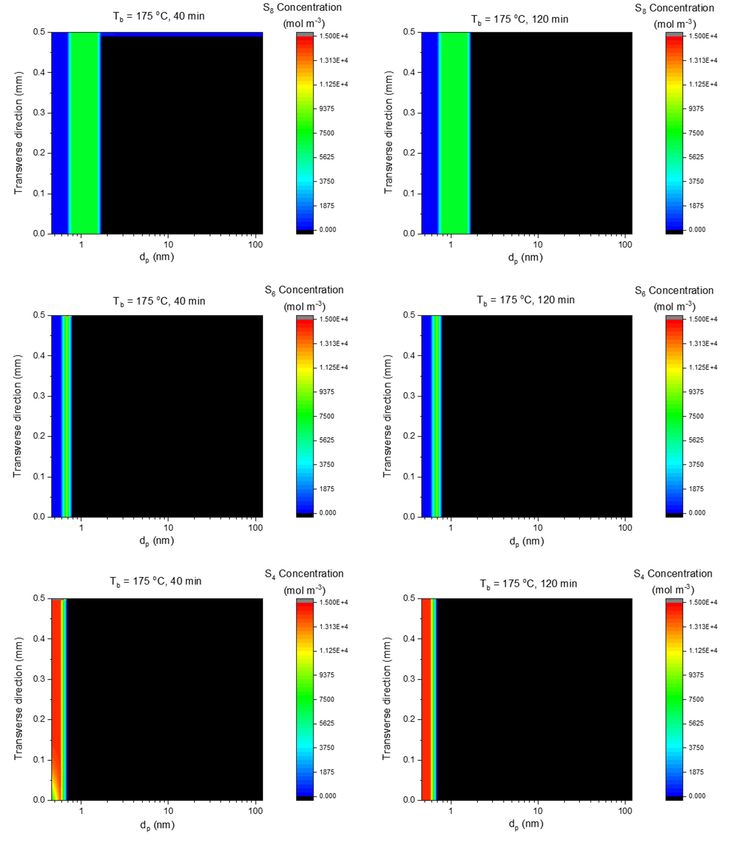
J. Compos. Sci. 2021, 5, 65                                                                                              6 of 17

                              flux continuity boundary condition, with a contact resistance, 1/hc , to take into account any
                              non-perfect contact at the ACF/current collector interface and previous interfaces (layers
                              (b)–(e)). A fixed boundary condition, Tb , is used at the bottom of layer (b), in contact with
                              the hot plate. The time-changing temperature at the ceiling of the pressure container is
                              given by the temperature at that height from the IR images, monitoring the experiment,
                              and used as input data in the heat transfer simulation. A heat transfer coefficient of
                              390 W m−2 K−1 was used for the heat transfer via natural convection between the S-ACF
                              and air [41,42] and of 2280 W m−2 K−1 between air and aluminum foil or stainless steel
                              top plate [43].
                                    At the sulfur melt–solid interface, with sulfur melt point at 119.7 ◦ C, there is the
                              boundary condition:
                                                                   ∂Sm          ∂Ts         ∂Tm
                                                         ρS,m ∆Hm        = kS,s      − kS,m                               (3)
                                                                    ∂t          ∂y           ∂y
                              where ∂S∂tm is the rate of sulfur melt generation, ∆Hm is the heat of fusion of sulfur,
                              ∆Hm = 54 kJ kg−1 [40], and, for the rest of properties, subscripts s and m denote solid
                              and melt, respectively.
                                   Sublimation (solid-to-vapor for temperatures below 119.7 ◦ C) and vaporization of
                              sulfur (melt-to-vapor for temperatures above 119.7 ◦ C) occur from the top surface of sulfur
                              layer (g) ((g) top subscript), where a heat flux loss occurs at that boundary with the air
                              layer boundary (h), according to the relation:

                                                                   ∂Sv             ∂T(g)top        ∂T(h)
                                                      ρS,v ∆HS,v       = kS,s or m          − kS,v                          (4)
                                                                    ∂t               ∂y             ∂y

                              where the heat of vaporization is ∆HS,v = 306.25 kJ kg−1 and the heat of sublimation is
                              ∆HS,v = 360.31 kJ kg−1 [40]. The rate of generation of S vapor sulfur moles, dNS,v /dt, is
                              given by the equation [44,45]:

                                                                   dNSv     U        P
                                                                        = −A transfer S,v                                   (5)
                                                                    dt           RT
                              where A is the area of the top surface of layer (g), Utransfer is the mass transfer coefficient,
                              PS,v is the sulfur vapor pressure and R is the gas constant R = 8.3145 J mol−1 K−1 . The
                              mass transfer coefficient is given by the relation [45]:

                                                                                      1.5D0.75
                                                                                          S,v g
                                                                                                0.25
                                                                   Utransfer =                 0.25                        (6)
                                                                                       0.2µS,v

                              where g is gravity (g = 9.81 m s−2 ), µS,v is the sulfur vapor viscosity given by the linear rela-
                              tion against temperature fitting the experimental data from [46], as presented in Figure 4a,
                              and DS,v is the diffusion coefficient of the sulfur vapor, given as a function of temperature,
                              T (in K), by the following relation [44], assuming binary coefficients with air being the
                              second vapor-phase material [44]:

                                                                                  3.3 × 10⁻³ T1.5
                                                          DS,v =                   1/3          1/3 2                 (7)
                                                                               0.256          0.018
                                                                    105        ρ         +     ρ
                                                                                S,v              air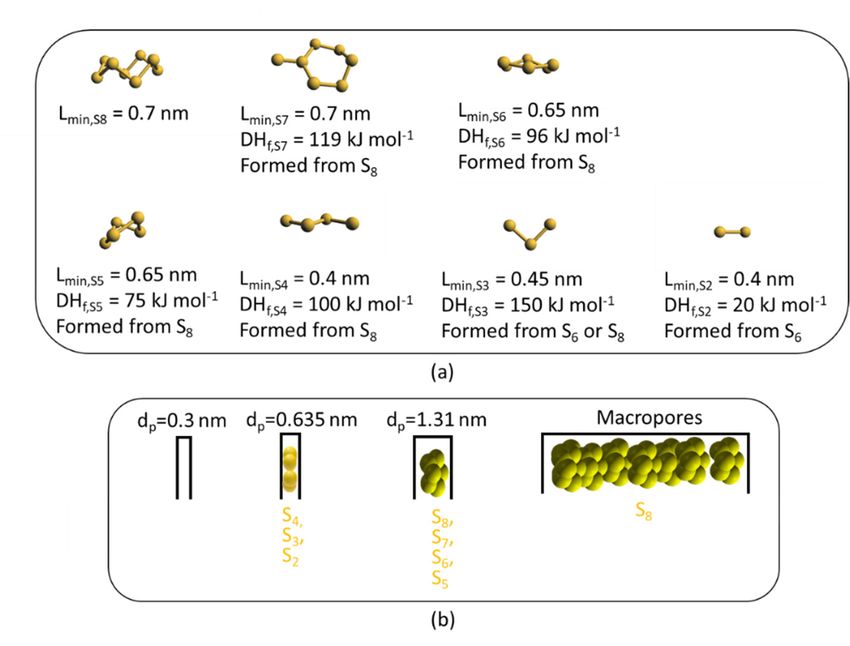
mpos. Sci. 2021, 5, x FOR PEER REVIEW 7 of 17
J. Compos. Sci. 2021, 5, 65 7 of 17
Figure 4. Data fits for sulfur vapor (a) linear fit of experimental data (data table from [46]) of sulfur vapor viscosity against
Figure 4. Data fits for sulfur vapor (a) linear fit of experimental data (data table from [46]) of
temperature; (b) polynomial
sulfur fit of experimental
vapor viscosity data (data(b)
against temperature; table from [47])fitofofsulfur
polynomial vapor pressure
experimental against
data (data temperature.
table
from [47]) of sulfur vapor pressure against temperature.
The sulfur vapor pressure is considered a function of temperature from the polynomial
data
The sulfur vapor fit of experimental data froma[47],
pressure is considered as is presented
function of temperaturein Figurefrom4b.the polyno-
The second system of equations describes the mass transport of each sulfur allotrope,
mial data fit of experimental data from [47], as is presented in Figure 4b.
Sj for j = 2–8 (Figure 3a), and infiltration through the porous ACF in the average y-axis and
The second system of equations describes the mass transport of each sulfur allotrope,
in each pore size, p, from the discretized PSD in Figure 1c:
Sj for j = 2–8 (Figure 3a), and infiltration through the porous ACF in the average y-axis and
in each pore size, p, from the discretized PSD ∂uin Figure 1c: ∂2 Cj,p
∂Cj,p p Cj,p
+ Fdecay,j,p = Fdecay,j,p Dj,p + Rj − rj (8)
∂C , ∂t ∂u C , ∂y ∂ C, ∂y2
+F ,, =F ,, D, +R −r (8)
∂t ∂y ∂y
where Cj,p is the concentration of sulfur allotrope j in pore size p, up is the velocity in pore
where Cj,p issizethe concentration of sulfur coefficient
p, Dj,p is the diffusion allotrope j in of pore
sulfur size p, up is jthe
allotrope velocity
in pore sizeinp,pore
Rj is the rate of
size p, Dj,p isformation
the diffusion
of new allotrope Sj in pore size dp , rj is the rate of loss of the
coefficient of sulfur allotrope j in pore size p, R j is rate ofSj due to the
allotrope
formation offormation
new allotrope Sj inorder
of lower pore allotropes
size dp, rj isfor
thesmaller
rate ofpores,
loss ofandallotrope
Fdecay,pSjisdue to thefactor where
a decay
formation ofFlowerdecay,j,porder
= 1 forallotropes for smaller
the S8 allotrope pores,
(j = 8) and Fdecay,p
but depends on is a decay
local thermalfactor where
energy and allotrope
Fdecay,j,p = 1 for the S8 allotrope
formation energy for (j =the8) lower
but depends on local
order sulfur thermal energy and allotrope
allotropes.
formation energyParallel for the infiltration
lower orderpaths sulfurareallotropes.
considered for the different pore sizes, with the mean
Parallelvelocity,
infiltration paths
up , for eachareporeconsidered for the according
size calculated different pore sizes, law
to Darcy’s withinthethemean
same manner as
velocity, up, matrix
for each pore size calculated according to Darcy’s law in
infiltration in a fibrous medium in composites’ manufacturing [37,48]: the same manner as
matrix infiltration in a fibrous medium in composites’ manufacturing [37,48]:
Kp ∂Pc,p
K up∂P =, (9)
u = εp µS,m Lf (9)
ε μ, L
where εp is the pore fraction for pores sized p, Lf is the filled length across the thickness of
where εp is the pore fraction for pores sized p, Lf is the filled length across the thickness of
the porous ACF, Kp is the permeability of the porous medium for pore size dp given by the
the porous ACF, Kp is the permeability of the porous medium for pore size dp given by
Carman–Kozeny equation for flow transverse to fibers with Kozeny constant of 3.4 [49]:
the Carman–Kozeny equation for flow transverse to fibers with Kozeny constant of 3.4
[49]: εp d2p
Kp = (10)
ε d 4 × 3.4
K = (10)
4x3.4
Pc,p is the capillary pressure given by the Young–Laplace equation [37,50]:
Pc,p is the capillary pressure given by the Young–Laplace equation [37,50]:
2σcosθ 2σ cos θ
Pc,p = (11)
P, = dp (11)
d
where
where σ is the σ istension
surface the surface
of thetension of thesulfur
infiltrating infiltrating
fluid,sulfur
θ is itsfluid, θ isangle
contact its contact angle with the
with the
−1 4.3◦study),
carbon porecarbon
walls (σ pore
= 61walls
mN (σ m−1= and
61 mNθ =m4.3° and
[51] θin=this [51] in and
this study), andviscosity
µS,m is the µS,m is the viscosity
of the sulfurof the sulfur
melt, melt,
its value its value
taken fromtaken from experimental
experimental data depending
data depending on temperature
on temperature [33] [33] as:
as:
119.7 ◦ C ≤ T < 165 ◦ C: µS,m = 0.04 Pa s
T < ◦165
119.7 °C ≤165 C ≤°C:
T< 185= ◦0.04
µS,m C: µPa
S,ms = 0.035 Pa s (12)
◦ ◦ C: µ (12)
165 °C ≤ T185< 185C°C:≤T < 195
µS,m = 0.035 s = 0.92 Pa s
PaS,m
195 ◦ C ≤ T: µS,m = 0.85 Pa s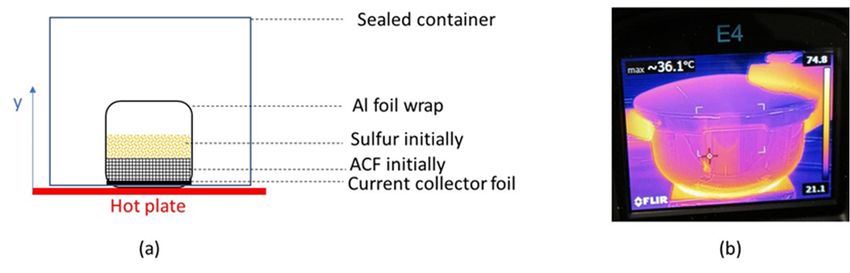
J. Compos. Sci. 2021, 5, 65                                                                                            8 of 17

                                    Sulfur allotropes are generated (Rj ) and infiltrate the pores in pore size hierarchy,
                              as follows. All pores with dp ≥ Lmin,S8 are infiltrated by the S8 allotrope. Pores with
                              Lmin,S8 > dp ≥ Lmin,S7 are first given the chance to be infiltrated with the S7 allotrope, if
                              there is sufficient local thermal energy, ETh , available to overcome the formation energy of
                              S7 , DHf,S7 . Otherwise, formation and infiltration of S6 is considered and consecutive smaller
                              allotropes, pores with Lmin,S7 > dp ≥ Lmin,S6, are first given the chance to be infiltrated
                              with the S6 allotrope, if there is sufficient local thermal energy available to overcome the
                              formation energy of S6 , DHf,S6 . Otherwise, formation and infiltration of S5 is considered
                              and consecutive smaller allotropes. The procedure continues in the same manner until
                              pores of dp < Lmin,S2 are encountered, which cannot be infiltrated by any form of sulfur.
                              The rate of formation of a sulfur allotrope, Rj , encompasses the full concentration of the
                              parent allotrope (Figure 3a) for that pore size, multiplied by the decay factor, Fdecay,j,p ,
                              given by the equation [24]:
                                                                                         DEf,Sj
                                                                                    −( RT+E        )
                                                                   Fdecay,j,p = e             Th                        (13)
                                    The diffusion coefficient of sulfur allotrope j in pore size dp is given by the following
                              relation [17] (where kB is Boltzmann’s constant), which is a modified Einstein’s equation to
                              take into account tortuosity and constrictivity effects [24]:

                                                                      ε1.5
                                                                                                         4
                                                                       p kB T                  Lmin,Sj

                                                          Dj,p =                         1−                             (14)
                                                                   2πµS,m Lmin,Sj               dp

                                   The system of the heat transfer and sulfur transport equations was solved using the
                              implicit time-dependent finite volume/finite difference technique [52,53]. Computer simu-
                              lations were performed for the experimental process described in Section 2, at Tb = 150 ◦ C
                              or 175 ◦ C or 200 ◦ C for two alternative, specified infiltration durations: 40 min or 2 h,
                              employing a timestep ∆t = 0.1 s and a y-increment ∆y = 5 µm in layers (a)–(i).

                              4. Results
                                     The monitoring IR camera showed that after the hot plate reached the set temperature
                              and the steel container with the samples was placed on the hot plate, the hot-plate temper-
                              ature was disturbed and it took about 30–40 min to reach the set temperature again. From
                              then on, the samples were left for sulfur infiltration for either 40 min or 2 h. To ensure that
                              the correct experimental temperature profile was used, both the bottom and top tempera-
                              tures of the steel container were inputted in the computer simulations from the monitoring
                              IR camera. For hot plate-temperature Tb = 150 ◦ C, the sulfur powder did not melt and was
                              still on top of the ACF samples when the steel container was opened, after either 40 min or
                              2 h. The computational simulations predicted an end, steady-state temperature of 109.88 ◦ C
                              at the top of the ACF sample, which was below the sulfur melting temperature, which
                              justified the experimental result.
                                     The computational simulations predicted an end, steady-state temperature of 125.55 ◦ C
                              and 146.8 ◦ C at the top of the sulfur layer for initially set, experimental hot-plate tempera-
                              tures of 175 and 200 ◦ C, respectively. These steady state temperatures at the top of ACF
                              were then above the sulfur melting point.
                                     Figure 5 displays the predicted total mass of sulfur (in the form of any allotrope)
                              that infiltrated the porous ACF and also and in top sulfur layer as a function of the
                              infiltration time, for the two, set, hot-plate temperatures, 175 and 200 ◦ C. It also compares
                              the predictions with the experimental data of the weight gain after sulfur infiltration of
                              40 min and 2 h. Initially, the sulfur was approximately 12 mg cm−2 , same as the amount of
                              sulfur added initially. Sulfur evaporation or sublimation seemed to start slowly and then
                              accelerated as the sample was heated and continued until the sulfur started impregnating
                              meso- and micropores, where the numerical model considered that it was trapped without
                              vapor escape from the ACF. In the simulations, sulfur seemed to impregnate and stay in the
                              macropores for longer in the samples at set, hot-plate temperature, Tb = 175 ◦ C, from which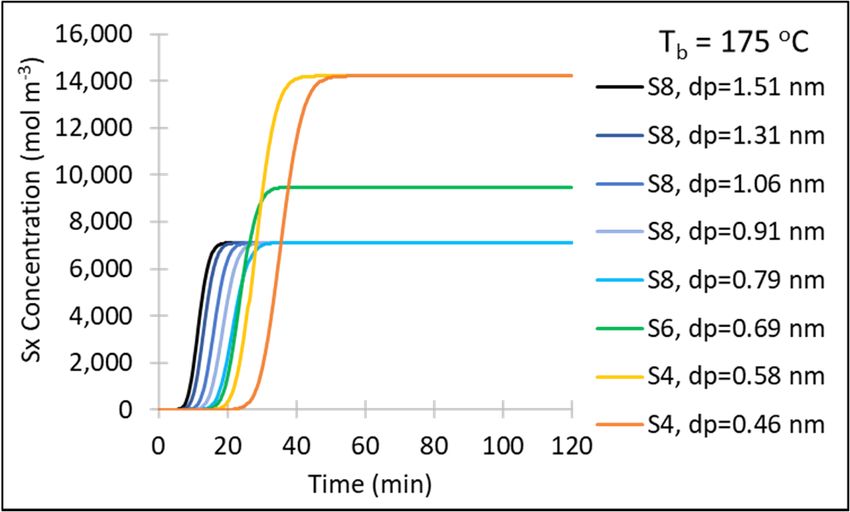
added initially. Sulfur evaporation or sublimation seemed to start slowly and then accel-
erated as the sample was heated and continued until the sulfur started impregnating
meso- and micropores, where the numerical model considered that it was trapped with-
J. Compos. Sci. 2021, 5, 65 9 of 17
out vapor escape from the ACF. In the simulations, sulfur seemed to impregnate and stay
in the macropores for longer in the samples at set, hot-plate temperature, Tb = 175 °C, from
which it may it may
havehave evaporated
evaporated fasterfaster
due todue
thetolarger
the larger
surface surface
area ofarea of macropores,
macropores, com- compared
withassumed
pared with the the assumed flat surface
flat surface of thelayer
of the sulfur sulfur layer
at the topatofthe topHence,
ACF. of ACF. Hence,
there was there was
faster initial sulfur evaporation for T = 175 ◦ C, compared to the samples at T = 200 ◦ C.
faster initial sulfur evaporation for Tb = 175 °C, compared to the samples at Tb = 200 °C. b
b
However,
However, overall, moreoverall,
sulfurmore sulfur evaporated
evaporated until the end until
for the
the end for the
samples at Tsamples at T = 200 ◦ C,
b = 200 °C, b
which wastoattributed
which was attributed the higher to the higherresulting
temperature temperature resulting
in higher vaporinpressure,
higher vapor
as seenpressure, as
seen in Figure 4b. As a result, the set hot-plate temperature T = 175 ◦ C is recommended,
in Figure 4b. As a result, the set hot-plate temperature Tb = 175 °C is recommended, b pro-
provided
vided that the sulfur isthat the sulfur
distributed is distributed homogeneously
homogeneously through
through the thickness the ACF
of the thickness
sam- of the ACF
sample and there is no accumulated sulfur layer at the top or bottom surface on the sample.
ple and there is no accumulated sulfur layer at the top or bottom surface on the sample.
This was investigated, both in the predictions and experimentally, in the rest of this study.
This was investigated, both in the predictions and experimentally, in the rest of this study.
Figure 5. Predicted
Figure total mass of sulfur
5. Predicted in ACF
total mass ofand top in
sulfur sulfur
ACFlayer
and as
topa function of time
sulfur layer as aand com- of time and
function
parison with the experimental data at 40 and 120 min; error bars in the experimental data points
comparison with the experimental data at 40 and 120 min; error bars in the experimental data points
from five repeat experiments.
from five repeat experiments.
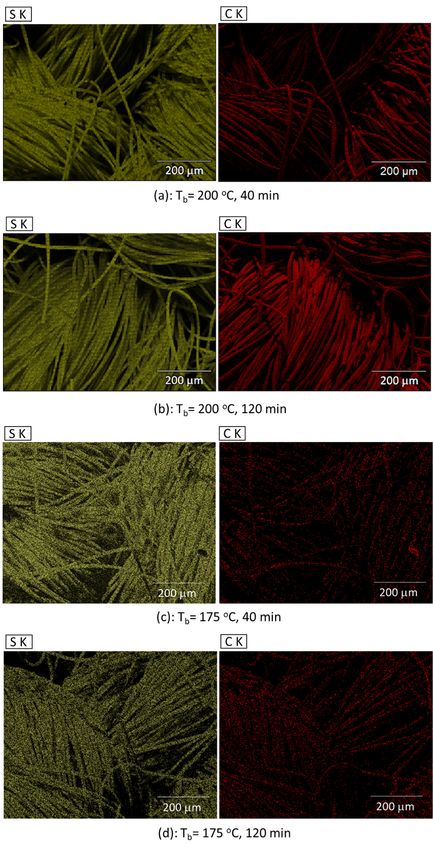
Figures 6 and 7 present
Figures 6 andthe SEM/EDX
7 present theelement
SEM/EDX maps of sulfur
element maps and
ofcarbon
sulfur andof the top of the top
carbon
surface andsurface
cross section, respectively, of ACF samples after being impregnated with
and cross section, respectively, of ACF samples after being impregnated with sulfur sul-
fur for 40 and
for120 min120
40 and for min
set, hot-plate temperature
for set, hot-plate Tb = 200Tor =175
temperature 200°C.
orIn
175general, it can it can be
◦ C. In general,
b
be seen thatseen
therethat
wasthere
no sulfur present in the interfiber space and the sulfur impregnated
was no sulfur present in the interfiber space and the sulfur impregnated
very well the
veryACwellfibers.
the The cross sections
AC fibers. The cross in Figure
sections7 inareFigure
from samples
7 are from cutsamples
after their
cut after their
sulfur impregnation. Figure 7 illustrates
sulfur impregnation. Figure 7that sulfur impregnated
illustrates homogeneously
that sulfur impregnated across
homogeneously across
the whole thickness
the wholeofthickness
the sample, without
of the sample, anywithout
accumulation at the top oratthe
any accumulation thebottom of bottom of
top or the
the sample. the
No sample.
leftover, Nounimpregnated sulfur was detected
leftover, unimpregnated sulfur was in any of the case
detected in anystudies:
of theTcase
b studies:
= 200 or 175T°C, impregnation ◦ time 40 or 120 min. The cross section of one of the cut fibers
b = 200 or 175 C, impregnation time 40 or 120 min. The cross section of one of the cut
of Figure 7bfibers
is presented
of Figure in Figure 8, where S,inC,Figure
7b is presented and mixed S/C element
8, where S, C, andmaps
mixed depict
S/Cthat
element maps
there was no sulfurthat
depict layer surrounding
there was no sulfur the carbon fiber and, inthe
layer surrounding fact, the sulfur
carbon fiber had
and,higher
in fact, the sulfur
concentration
had inhigher
the central region of the
concentration fiber
in the drawn
central by capillary
region flowdrawn
of the fiber into thebymicropores
capillary flow into the
there. Any micropores
sulfur and carbon in the
there. Any background
sulfur and carbon of the fiber
in the in Figure of
background 8 was frominthe
the fiber Figure 8 was
neighboringfrom
fibers,
theasneighboring
shown in Figurefibers,7b.as shown in Figure 7b.J. Compos. Sci. 2021, 5, x FOR PEER REVIEW 10 of 17
J. Compos. Sci. 2021, 5, 65 10 of 17
Figure 6. SEM/EDX element maps of sulfur (yellow) and carbon (red) of the top surface of the ACF
Figure 6. SEM/EDX element maps of sulfur (yellow) and carbon (red) of the top surface of the ACF
samples
samples impregnated
impregnated with sulfur;
with sulfur; each
each set set element
of S/C of S/C element
maps ismaps
from is from a different
a different sample.sample.J. Compos. J.Sci. 2021, 5,
Compos. x FOR
Sci. 2021,PEER
5, 65 REVIEW 11 of 17 11 of 17
Figure 7. Figure
SEM/EDX 7. SEM/EDX element
element maps maps(yellow)
of sulfur of sulfurand(yellow)
carbon and(red)carbon (red) of
of the cross the cross
section of thesection of the
ACF impregnated
ACF samples samples impregnated with
with sulfur, sulfur,inwhere,
where, in eachleft
each image, image, leftrepresents
to right to right represents top-to-bottom
top-to-bottom
direction direction in theeach
in the sample; sample; each
set of S/Cset of S/Cmaps
element element maps
is from is from a sample.
a different different sample.J. Compos. Sci. 2021, 5, x FOR PEER REVIEW 12 of 17
J. Compos. Sci. 2021, 5, 65 12 of 17
ompos. Sci. 2021, 5, x FOR PEER REVIEW 12 of 17
Figure 8. SEM/EDX element maps of sulfur (yellow) and carbon (red) and a mixed S/C element map of the
Figure 8. SEM/EDX
cross section Figure element
8. SEM/EDX
of an activated maps of(AC)
sulfur
element
carbon (yellow)
maps
fiber and carbon
of sulfur
impregnated with(red)
(yellow) andand a mixed
carbon
sulfur, from S/C
(red) andelement
magnificationa mixedmap
S/Cofelement
of sample the crossmap
image section of
of the
an activated cross
carbon
of Figure 7b. section
(AC) of
fiberan activated
impregnated carbon
with (AC) fiber
sulfur, fromimpregnated
magnification with
of sulfur,
sample from
imagemagnification
of Figure of
7b. sample image
of Figure 7b.
Figure 9 presents the predicted evolution of different sulfur allotropes near the bottom
Figure 9 presents the predicted evolution of different sulfur allotropes near the bot-
of theFigure
ACF. Sulfur infiltration took place in a hierarchical manner, where thenear largethepores
tom of the ACF. Sulfur9infiltration
presents the predicted
took place inevolution of different
a hierarchical manner, sulfur
where allotropes
the large bot-
wereof
tom infiltrated
the ACF. first, followed
Sulfur by mesopores
infiltration took and,
place in lastly,
a by micropores.
hierarchical manner, S8where
entered therapidly
large
pores were infiltrated first, followed by mesopores and, lastly, by micropores. S8 entered
and hierarchically the first,
largefollowed
pores that bycould accommodate it, i.e., d p > 0.7 nm. SFor pores
rapidly andpores were infiltrated
hierarchically the large pores that could mesopores
accommodate and, lastly,
it, i.e., dby micropores.
p > 0.7 nm. For
8 entered
smaller
rapidly than
andnm,0.7 nm, S
hierarchicallyconverted
thetolarge to S ,
pores and then
that to S for d < 0.65 nm.
pores smaller than 0.7 8
S8 converted S6, and 6
then to Scould accommodate
4 p
4 for dp < 0.65 nm.
it, i.e., dp > 0.7 nm. For
pores smaller than 0.7 nm, S8 converted to S6, and then to S4 for dp < 0.65 nm.
Figure 9. Predicted
Figure evolution of the
9. Predicted concentration
evolution of the sulfur allotropes
of the concentration in different
of the sulfur allotropespore sizes in pore sizes in
in different
the ACF (nearFigure
the 9. Predicted
bottom surfaceevolution
of ACF) of athe
as concentration
function of time.of the sulfur allotropes in different pore sizes in
the ACF
the ACF (near
(near the
the bottom
bottom surface
surface ofof ACF)
ACF) as
as aa function
function of time.
of time.
Figure 10 presents
Figure 10 thepresents
predicted thecontour
predicted plots of the plots
contour sulfurofconcentration at the end at the end
the sulfur concentration
Figure 10h presents theperiods,
predicted contour plots of the sulfur concentration
= 175 °C.Tbat=the end
of the 40 min and the 2 infiltration for set hot-plate temperature
of the 40 min and the 2 h infiltration periods, for set hot-plate temperature T b 175 ◦ C.
of the
Micropores Micropores 40 min
greater thangreaterand the
0.7 nmthan 2 h
were0.7 infiltration
impregnated periods, for
with S8. Pores set hot-plate
smaller temperature
thansmaller
0.8 nmthan T b = 175 °C.
and 0.8 nm and
nm were impregnated with S8 . Pores
larger than Micropores
0.6 nmthan
larger
greater than
contained
0.6 nmScontained
0.7 nm were
6, and pores S6,smaller
impregnated
and poresthansmaller
0.64 nm with
than
S8. larger
and Pores smaller
0.64 nm than 0.4than
and larger
0.8 nm and
nmthan 0.4 nm
larger
contained Scontained than
4. The sulfur
0.6 nm contained S 6, and pores smaller than 0.64 nm and larger than 0.4 nm
S4 .distribution was homogeneous
The sulfur distribution through thethrough
was homogeneous ACF thickness
the ACFatthickness
the at the
end of the 2contained
end
S4. The
h infiltration sulfur
period.
of the 2 h infiltration
distribution
After 40 min
period.
was homogeneous
sulfur
After infiltration,
40 min
through
there wasthe
sulfur infiltration, someACF thickness
therelowwasSsome
8
at the
low S8
concentrationend of the 2 h
in the meso-inandinfiltration period. After 40 min sulfur infiltration, there was some low S8
concentration themacropores near the topnear
meso- and macropores ACFthe surface,
top ACF which was depleted
surface, which was depleted
concentration
in the subsequent in the meso- and macropores near the top ACF surface, which was depleted
in the infiltration
subsequenttime for the sulfur
infiltration time forinfiltration
the sulfurinto the lowerinto
infiltration parts,
thewhile
lower theparts, while
in
thethe
initial top reservoirsubsequent
oftop
initial sulfur infiltration
over
reservoir the
of ACF time
sulfur wasforexhausted.
over the
thesulfur
ACF At infiltration
was the end of
exhausted.into
thethe
40lower
At minend
the parts,
infil-
of thewhile the
40 min
initial top
infiltration reservoir
period, of sulfur
fully Sinfiltrated over the ACF was exhausted. At the end of the 40 min infil-
tration period, S4 had not 4 had not yet fullytheinfiltrated
bottom 20%yet the bottom
of the ACF 20% but theof the ACF but the S4
S4 infil-
tration was tration
completedperiod,
infiltration was Scompleted
through4 had not fully infiltrated yet the bottom 20% of the ACF but the S 4 infil-
the whole through
ACF the whole at
thickness ACFthethickness
end of theat2-h theperiod.
end of the 2-h period.
tration was completed through the whole ACF thickness at the end of the 2-h period.ompos. Sci. J.2021, 5, x FOR
Compos. PEER5,REVIEW
Sci. 2021, 65 13 of 17 13 of 17
Figure 10. Predicted
Figurecontour plots ofcontour
10. Predicted the concentration of concentration
plots of the different sulfurofallotropes
differentafter 40 allotropes
sulfur min and after 2 h40of infiltration
after
time, as a function
min and after 2 h of infiltration time, as a function of the pore diameter and vertical positionyin= 0 at current
of the pore diameter and vertical position in the sulfur-ACF composite cathode, where
collector and ythe
= 0.5 mm at thecomposite
sulfur-ACF top of thecathode,
composite cathode.
where y = 0 at current collector and y = 0.5 mm at the top of
the composite cathode.
5. Discussion
5. Discussion It is most interesting that in both the experiment and the computational simulation
a sulfur
It is most loss ofthat
interesting 59–62 wt%the
in both occurred, depending
experiment and theon hot-plate temperature.
computational simulationSulfur
a vapor
may have escaped outside the aluminum wrap, as after several such
sulfur loss of 59–62 wt% occurred, depending on hot-plate temperature. Sulfur vapor may experiments the inner
walls of the stainless steel pressure vessel obtained a shiny, yellowish
have escaped outside the aluminum wrap, as after several such experiments the inner hue. The heat transfer
walls of thecharacteristics of the experimental
stainless steel pressure rig greatly
vessel obtained a shiny,affected
yellowishthehue.
temperature distribution and,
The heat trans-
hence, sulfur vaporization and also infiltration. Alternative experimental
fer characteristics of the experimental rig greatly affected the temperature distribution setups in the
and, hence, sulfur vaporization and also infiltration. Alternative experimental setups in where, in
literature include sulfur impregnation with the sample in a convection oven [12]
fact, even higher degree of sulfur vaporization was observed [12]. The methodology of a
the literature include sulfur impregnation with the sample in a convection oven [12]
sealed container on a hot plate with set hot-plate temperature, employed in this study, may
where, in fact, even higher degree of sulfur vaporization was observed [12]. The method-
represent continuous, large-scale sulfur deposition on a substrate tape moving continually
ology of a sealed container on a hot plate with set hot-plate temperature, employed in this
on a conveyor belt. The substrate may be ACF on aluminum foil current collector, their
study, may represent continuous, large-scale sulfur deposition on a substrate tape movingJ. Compos. Sci. 2021, 5, 65 14 of 17
assembly moving on the conveyor belt with sulfur powder being sprayed on top and
the bed of the moving belt being heated to the set temperature. Hence, the heat transfer
and sulfur infiltration model presented in this study is applicable to a scaled fabrication
of composite S-ACF cathode. As sulfur loss through vaporization and sublimation is
generally undesirable, process design simulations may try to optimize the temperature and
external pressure to maintain sulfur infiltration in melt state rather than vapor state. This
would mean that only S8 allotrope would be present, as lower-order sulfur allotropes are
formed in vapor state only. As a result, cathode host micropores below 0.7 nm would not
contain any sulfur and such unfilled pores would, instead, absorb and waste the electrolyte
solvent of the Li-S battery without any prospect of active participation in the redox battery
reactions in the absence of sulfur.
It was predicted that in pores smaller than 0.7 nm (and greater than 0.4 nm) the sulfur
resides in the form of mainly S6 and S4 allotropes. The so confined sulfur in small carbon
micropores cannot move to the anode so easily in a Li-S battery, which offers the advantage
of limiting the “shuttling” effect in the Li-S battery [54].
However, S4 in micropores smaller than 0.64 nm, which occupy 16% of the total
volume of pores sized 0.46–119 nm in the ACF of this study, reduces the capacity of the
first potential plateau at 2.3–2.4 V in the discharge of a Li-S battery for some composite
cathodes, as this plateau corresponds to the conversion of Li2 S8 to Li2 S6 [5,54]. Therefore,
it can be seen that the pore size distribution of the porous carbon host is critical for both
the amount and form of infiltrated sulfur, which are going to affect the capacity of the Li-S
battery, depending on the amount and allotrope type of sulfur and its energy stored and
delivered, which depends on the integrated product of potential and capacity.
Hence, the design of future cathode hosts for Li-S batteries is a complex exercise.
Micropores smaller than 0.7 nm are detrimental for the Li-S battery energy, as they can
only accommodate lower-order sulfides that reduce the first voltage plateau in the battery
while these micropores consume electrolyte, which is sometimes a waste as the absorbed
electrolyte remains passive if there is no sufficient sulfur to utilize it in redox reactions.
However, these pores filled with the electrolyte offer a high-power supercapacitor com-
ponent and the device is then a hybrid Li-S battery/Li-ion capacitor. Furthermore, larger
micropores might be beneficial to the Li-S battery as they can accommodate S8 and restrict
escape of polysulfides, reducing the “shuttling” effect during battery cycling.
The numerical model of heat transfer and sulfur infiltration outlined in this paper may
also be applied to other porous cathode hosts, such as activated carbon powder [7,9,10]
graphene [11,12] or other porous carbon material [6] with measured pore size distribution
that can be used as input data in the simulations. The material properties and porosity
would be used to determine the thermal properties (heat capacity and thermal conductivity)
for the heat transfer, Equation (1). The pore size distribution of the porous host controls
the sulfur impregnation in Equations (8)–(11) and the type of sulfur allotrope that may be
formed in each pore size. In general, simulations of the sulfur infiltration may comprise
the first stage, in a comprehensive numerical model of cathode fabrication and Li-S battery
operation. Combining simulations of the composite cathode fabrication and battery cycling
will help in the design of optimized porous hosts and composite cathodes.
6. Conclusions
The pore size distribution of a porous carbon host for a composite cathode is very
important in a Li-S battery, both in cathode manufacture and during battery operation.
A numerical model has been developed in this study for the description of the sulfur
infiltration into the porous host while heated above the melting point of sulfur in cathode
manufacture, taking into account the pore size distribution of the porous host and including
heat transfer, sulfur sublimation, and evaporation, as well as formation of lower-order
sulfur allotropes, depending on pore size and available thermal energy compared to their
energy of formation. Computational simulations predicted a composite cathode with
38 and 41 wt% sulfur for set hot-plate temperatures of 200 and 175 ◦ C, respectively, withJ. Compos. Sci. 2021, 5, 65 15 of 17
homogeneous sulfur distribution through the ACF thickness after 2 h of infiltration. In
terms of the porous carbon host, pores smaller than 0.4 nm could not accommodate any
sulfur allotrope. For pores smaller than 0.7 nm, sulfur resided mainly in the form of S4 and
of S6 . S8 resided in micropores between 0.7 and 1.5 nm.
Author Contributions: Conceptualization, C.L.; methodology, K.L., J.P.B., and C.L.; software, K.L.
and C.L.; validation, K.L. and J.P.B.; formal analysis, K.L., J.P.B., and C.L.; investigation, K.L., J.P.B.,
and C.L.; resources, C.L.; data curation, C.L.; writing—original draft preparation, K.L. and C.L.;
writing—review and editing, C.L.; visualization, K.L., J.P.B., and C.L.; supervision, C.L.; project
administration, C.L. All authors have read and agreed to the published version of the manuscript.
Funding: J.P.B. gratefully acknowledges funding from EPSRC project HiPoBat.
Conflicts of Interest: The authors declare no conflict of interest.
References
1. Zhu, K.; Wang, C.; Chi, Z.; Ke, F.; Yang, Y.; Wang, A.; Wang, W.; Miao, L. How far away are lithium-sulfur batteries from
commercialization? Front. Energy Res. 2019, 7, 123. [CrossRef]
2. Reddy, M.V.; Mauger, A.; Julien, C.M.; Paolella, A.; Zaghib, K. Brief history of early lithium-battery development. Materials 2020,
13, 1884. [CrossRef] [PubMed]
3. Reddy, M.V.; Subba Rao, G.V.; Chowdari, B.V.R. Metal oxides and oxysalts as anode materials for li ion batteries. Chem. Rev. 2013,
113, 5364–5457. [CrossRef] [PubMed]
4. Petnikota, S.; Rotte, N.K.; Srikanth, V.V.S.S.; Kota, B.S.R.; Reddy, M.V.; Loh, K.P.; Chowdari, B.V.R. Electrochemical studies of
few-layered graphene as an anode material for Li ion batteries. J. Solid State Electrochem. 2014, 18, 941–949. [CrossRef]
5. Elazari, R.; Salitra, G.; Garsuch, A.; Panchenko, A.; Aurbach, D. Sulfur-impregnated activated carbon fiber cloth as a binder-free
cathode for rechargeable Li-S batteries. Adv. Mater. 2011, 23, 5641–5644. [CrossRef] [PubMed]
6. Ji, X.; Lee, K.T.; Nazar, L.F. A highly ordered nanostructured carbon–sulphur cathode for lithium–sulphur batteries. Nat. Mater.
2009, 8, 500–506. [CrossRef]
7. Xu, G.; Ding, B.; Nie, P.; Shen, L.; Dou, H.; Zhang, X. Hierarchically porous carbon encapsulating sulfur as a superior cathode
material for high performance lithium−sulfur batteries. ACS Appl. Mater. Interfaces 2014, 6, 194–199. [CrossRef] [PubMed]
8. Kim, J.; Lee, D.-J.; Jung, H.-G.; Sun, Y.-K.; Hassoun, J.; Scrosati, B. An advanced lithium-sulfur battery. Adv. Funct. Mater. 2013,
23, 1076–1080. [CrossRef]
9. Vijayan, B.L.; Misnon, I.I.; Kumar, G.M.A.; Miyajima, K.; Reddy, M.V.; Zaghib, K.; Karuppiah, C.; Yang, C.-C.; Jose, R. Facile
fabrication of thin metal oxide films on porous carbon for high density charge storage. J. Colloid Interface Sci. 2020, 562, 567–577.
[CrossRef]
10. Vijayan, B.L.; Zain, N.K.M.; Misnon, I.I.; Reddy, M.V.; Adams, S.; Yang, C.-C.; Anilkumar, G.M.; Jose, R. Void space control in
porous carbon for high-density supercapacitive charge storage. Energy Fuels 2020, 34, 5072–5083. [CrossRef]
11. Ji, L.; Rao, M.; Zheng, H.; Zhang, L.; Li, Y.; Duan, W.; Guo, J.; Cairns, E.J.; Zhang, Y. Graphene oxide as a sulfur immobilizer in
high performance lithium/sulfur cells. J. Am. Chem. Soc. 2011, 133, 18522–18525. [CrossRef]
12. Reece, R.; Lekakou, C.; Smith, P.A.; Grilli, R.; Trapalis, C. Sulphur-linked graphitic and graphene oxide platelet-based electrodes
for electrochemical double layer capacitors. J. Alloys Compd. 2019, 792, 582–593. [CrossRef]
13. Di Lecce, D.; Marangon, V.; Du, W.; Brett, D.J.L.; Shearing, P.R.; Hassoun, J. The role of synthesis pathway on the microstructural
characteristics of sulfur-carbon composites: X-ray imaging and electrochemistry in lithium battery. J. Power Source 2020,
472, 228424. [CrossRef]
14. Markoulidis, F.; Todorova, N.; Grilli, R.; Lekakou, C.; Trapalis, C. Composite electrodes of activated carbon and multiwall carbon
nanotubes decorated with silver nanoparticles for high power energy storage. J. Compos. Sci. 2019, 3, 97. [CrossRef]
15. Markoulidis, F.; Lei, C.; Lekakou, C. Investigations of activated carbon fabric-based supercapacitors with different interlayers via
experiments and modelling of electrochemical processes of different timescales. Electrochim. Acta 2017, 249, 122–134. [CrossRef]
16. Lei, C.; Markoulidis, F.; Wilson, P.; Lekakou, C. Phenolic carbon cloth-based electric double-layer capacitors with conductive
interlayers and graphene coating. J. Appl. Electrochem. 2016, 46, 251–258. [CrossRef]
17. Lei, C.; Lekakou, C. Activated carbon–carbon nanotube nanocomposite coatings for supercapacitor application. Surf. Coat. Technol.
2013, 232, 326–330. [CrossRef]
18. Vermisoglou, E.C.; Giannakopoulou, T.; Romanos, G.; Giannouri, M.; Boukos, N.; Lei, C.; Lekakou, C.; Trapalis, C. Effect of
hydrothermal reaction time and alkaline conditions on the electrochemical properties of reduced graphene oxide. Appl. Surf. Sci.
Part A 2015, 358, 100–109. [CrossRef]
19. Vermisoglou, E.C.; Giannakopoulou, T.; Romanos, G.E.; Boukos, N.; Giannouri, M.; Lei, C.; Lekakou, C.; Trapalis, C. Non-activated
high surface area expanded graphite oxide for supercapacitors. Appl. Surf. Sci. Part A 2015, 358, 110–121. [CrossRef]
20. Todorova, N.; Giannakopoulou, T.; Boukos, N.; Vermisoglou, E.; Lekakou, C.; Trapalis, C. Self-propagating solar light reduction
of graphite oxide in water. Appl. Surf. Sci. Part B 2017, 391, 601–608. [CrossRef]You can also read