Thermal bottlenecks in the life cycle define climate vulnerability of fish - AWI
←
→
Page content transcription
If your browser does not render page correctly, please read the page content below
RES EARCH

CLIMATE RESPONSES                                                                                                        capacities in relation to O2 demand (2, 7)
                                                                                                                         (Fig. 1A). Specifically, tolerance ranges are
Thermal bottlenecks in the life cycle                                                                                    hypothesized to widen from embryo to larval
                                                                                                                         and adult stages after the development of car-
define climate vulnerability of fish                                                                                     diorespiratory organs (7, 8). During reproduc-
                                                                                                                         tion (spawning stage), tolerance ranges may
Flemming T. Dahlke1*, Sylke Wohlrab1,2, Martin Butzin1, Hans-Otto Pörtner1,3*                                            narrow again as the result of a net decrease
                                                                                                                         in aerobic capacity associated with additional
Species’ vulnerability to climate change depends on the most temperature-sensitive life stages, but                      energy and thus O2 demand for gamete pro-
for major animal groups such as fish, life cycle bottlenecks are often not clearly defined. We used                      duction and biomass (2, 7). These principles
observational, experimental, and phylogenetic data to assess stage-specific thermal tolerance                            are supported by empirical data for some well-
metrics for 694 marine and freshwater fish species from all climate zones. Our analysis shows that                       studied species such as Atlantic cod (Gadus
spawning adults and embryos consistently have narrower tolerance ranges than larvae and                                  morhua) (6), but it is currently unknown wheth-
nonreproductive adults and are most vulnerable to climate warming. The sequence of stage-specific                        er the proposed ontogenetic shift in thermal
thermal tolerance corresponds with the oxygen-limitation hypothesis, suggesting a mechanistic                            tolerance represents a globally consistent
link between ontogenetic changes in cardiorespiratory (aerobic) capacity and tolerance to                                pattern.
temperature extremes. A logarithmic inverse correlation between the temperature dependence                                  Thermal adaption of species and life stages
of physiological rates (development and oxygen consumption) and thermal tolerance range is                               to local climatic conditions probably involves
proposed to reflect a fundamental, energetic trade-off in thermal adaptation. Scenario-based                             energetic optimizations and trade-offs (9, 10).
climate projections considering the most critical life stages (spawners and embryos) clearly                             Available data suggest that tolerance ranges

                                                                                                                                                                                   Downloaded from http://science.sciencemag.org/ on August 12, 2020
identify the temperature requirements for reproduction as a critical bottleneck in the life cycle                        are as narrow as possible to ensure survival
of fish. By 2100, depending on the Shared Socioeconomic Pathway (SSP) scenario followed, the                             under local conditions while minimizing costs
percentages of species potentially affected by water temperatures exceeding their tolerance                              for maintaining homeostasis over wide tem-
limit for reproduction range from ~10% (SSP 1–1.9) to ~60% (SSP 5–8.5). Efforts to meet ambitious                        perature ranges (6). Consequently, tolerance
climate targets (SSP 1–1.9) could therefore benefit many fish species and people who depend                              ranges are expected to reflect the magnitude
on healthy fish stocks.                                                                                                  of local temperature variability (11), with wider
                                                                                                                         tolerance ranges in temperate regions relative

T
                                                                                                                         to polar and tropical regions (12). Potential trade-
       he identification of biological patterns             ciples potentially related to this pattern include           offs between energy efficiency and thermal
       and underlying principles is fundamen-               the temperature dependence of physiologi-                    tolerance may be linked to thermodynamic
       tal for understanding and predicting eco-            cal rates and thus oxygen (O2) demand (4, 5).                properties of metabolic processes (i.e., thermal
       logical processes (1), including climate             Different cardiorespiratory capacities to sustain            responsiveness) (9, 13). Mechanistic theory pre-
       change effects (2). A central observation            adequate O2 supply to tissues during temper-                 dicts that “stenothermal” organisms with nar-
in this context is that aquatic ectothermic ani-            ature changes are suggested to explain why                   row temperature ranges display higher thermal
mals such as fish have specific temperature                 tolerance ranges are narrower for some fish                  responsiveness than more tolerant “euryther-
limits and tolerance ranges, which determine                species than for others (6). Thermal tolerance               mal” organisms (13) (Fig. 1, B and C). In con-
their latitudinal distribution limits and sensi-            is also expected to change during the life cycle of          trast, the concept of universal temperature
tivity to climate change (3). Mechanistic prin-             species according to the development of aerobic              dependence implies that there is no variation

Fig. 1. Thermal tolerance differs between life
stages, and thermal responsiveness is higher in
stenothermal than in eurythermal organisms.
(A) Lower and upper temperature thresholds (Tmin and
Tmax) are defined as ultimate temperature limits that
relate to behavioral avoidance, impaired physiological
functions, and mortality (22), thereby reflecting limits
to the geographic distribution of species (3, 4). The
specific temperature ranges (Trange = Tmax − Tmin) of
species are expected to differ between life stages
according to changes in the relationship between
oxygen demand and supply capacity (4). This hypoth-
esis implies that from embryo to adult, aerobic
capacity (and thus Trange) increases with the develop-
ment of the cardiorespiratory system, but then
declines again with increasing body size. During the
spawning season, aerobic capacity and Trange may
decrease further as a result of additional energy
requirements for the production of gametes and their
biomass (2, 7). (B) Physiological rates (solid lines) are
temperature-dependent and typically scale exponen-
tially within Trange (1). Lines with different slopes suggest that stenothermal species or life stages with narrow Trange (black line) are more responsive (steeper slope) than
eurythermal ones (gray line) (13). As a benefit, the energy demand of stenotherms may be lower than that of eurytherms (49). (C) Thermal responsiveness is quantified in
Arrhenius form (log-transformed rate versus inverse absolute temperature) and is expressed as activation energy (Ea) in electron volts (27).

Dahlke et al., Science 369, 65–70 2(2020)     3 July 2020                                                                                                                 1 of 6
RES EARCH | R E S E A R C H A R T I C L E
in thermal responsiveness among ectothermic
species [(14), but see (15, 16)].
Fish usually reproduce at certain times of
the year (spawning seasons) and in certain
places (spawning habitats) that provide suit-
able conditions for offspring survival (17, 18).
Reproductive success is likely at risk under
climate change when spawning habitat tem-
peratures exceed the tolerance limit of the most
sensitive life stage, forcing species to reproduce
at different times and/or places (18). To date,
mainly because of the scarcity of experimental
data, potential life cycle bottlenecks in thermal
tolerance are rarely considered in large-scale
risk assessments (19–21), limiting our ability to
determine whether climate mitigation targets
are sufficient to sustain healthy fish stocks.
Here, we address this limitation by combining
experimental and observational data as well as
phylogenetic data imputation (22) to generate
Downloaded from http://science.sciencemag.org/ on August 12, 2020
a comprehensive set of stage-specific thermal
tolerance metrics for 694 marine and fresh-
water fish species from all climate zones. With
this dataset, we addressed the following hypo-
theses: (i) Upper and lower temperature limits
(Tmax, Tmin) and temperature ranges (Trange =
Tmax – Tmin) differ consistently between life
stages (Fig. 1A). (ii) Thermal responsiveness
is higher in stenothermal organisms than in
eurythermal ones (Fig. 1B). Furthermore, stage-
specific tolerance limits were used to assess
climatic risks under different Shared Socio-
economic Pathway (SSP) scenarios of global
change developed during the sixth phase of
the Coupled Model Intercomparison Project
(CMIP6) (23).
Thermal tolerance depends on phylogeny,
geographic origin, and ontogeny
We collated empirical thermal tolerance data
of four life stages: egg stage (“embryos”),
pre-metamorphosis stage (“larvae”), post- Fig. 2. Phylogenetic and ontogenetic patterns in thermal tolerance of fish. (A to C) Circular
metamorphosis stage (“adults”), and reproduc- chronograms show upper temperature limits (Tmax) (A), lower temperature limits (Tmin) (B), and thermal
tive stage (“spawners”). Data on embryos, larvae, tolerance ranges (Trange) (C) of species and their life stages from inside to outside: spawners, embryos,
and adults are experimental estimates of phys- larvae, and adults. Prominent taxonomic groups as well as particularly warm-eurythermal (Fundulidae and
iological ultimate temperature limits (22). Be- Cyprinodontidae) and cold-stenothermal groups (Notothenioidei) are highlighted.
cause experimental data for spawners are
extremely scarce, in situ observations (e.g., fish-
eries monitoring and tagging data) of behavioral either observed temperature optima or arith- ance were assessed using generalized additive
temperature limits were considered for this life metic means of Tmin and Tmax. For 694 of models (GAMs), taking into account variation
stage. A direct comparison revealed no signif- 777 species, we obtained at least one empirical related to geographic origin (latitude and ma-
icant difference between experimental and thermal tolerance metric (Tmax, Tmin, or Tmid) rine versus freshwater) as well as uncertainty
observational Tmax data of spawners (two-sided as well as time-calibrated phylogeny from the related to data imputation by including the in-
paired t test, P = 0.189, n = 15 species; fig. S1 Fish Tree of Life (24). Phylogenetic imputation verse of estimated variances as weights.
and table S1). Temperature ranges (Trange) (22) was then used to estimate missing Tmax The completed dataset (26) reveals phylo-
were estimated as the difference between Tmax and Tmin values. We confirmed phylogenetic genetic and ontogenetic patterns in thermal
and Tmin. Midpoint temperatures (Tmid) are niche conservatism (i.e., similar trait values tolerance of fish (Fig. 2). In addition to existing
among closely related species) as a prerequi- evidence for niche conservatism in adult fish
site for reliable data imputation (25) a priori, (20), we find that phylogenetic clustering of
1
Alfred Wegener Institute, Helmholtz Centre for Polar and based on phylogenetic signal indices (Pagel’s l, temperature limits (Tmax and Tmin; Fig. 2, A
Marine Research, 27570 Bremerhaven, Germany. 2Helmholtz P < 0.001; table S2). Precision of imputed data and B) and tolerance ranges (Trange; Fig. 2C) is
Institute for Functional Marine Biodiversity, 26129 Oldenburg, was assessed on the basis of correlation anal- consistent across life stages (table S2). In line
Germany. 3University of Bremen, 28359 Bremen, Germany.
*Corresponding author. Email: flemming.dahlke@gmx.de (F.T.D.); ysis and variance estimation (fig. S2 and table with expected ontogenetic shifts in aerobic
hans.poertner@awi.de (H.-O.P.) S3). Ontogenetic differences in thermal toler- capacity (2), we find that Trange is narrower
Dahlke et al., Science 369, 65–70 (2020) 3 July 2020 2 of 6RES EARCH | R E S E A R C H A R T I C L E
Fig. 3. Ontogenetic model, LMM) and the correlation between
changes in thermal Ea and Trange (generalized additive mixed-effect
tolerance are model, GAMM) accounted for phylogenetic
consistent across lati- nonindependence.
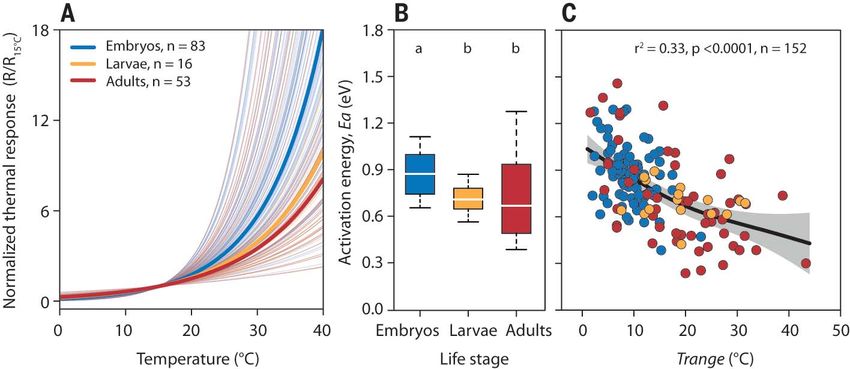
tudes. (A to C) Upper Thermal responsiveness of embryos is on
temperature limits average 24% higher than in larvae and adults
(Tmax) (A), lower tem- (LMM, P < 0.0001; Fig. 4B). Thermal respon-
perature limits (Tmin) siveness of embryos (mean Ea, 0.87 eV; 95% CI,
(B), and thermal toler- 0.83 to 0.91 eV) also exceeds the range pre-
ance ranges (Trange = dicted by the universal temperature dependence
Tmax − Tmin) (C) of concept (0.6 to 0.7 eV) (14). The correlation
spawners (black), between Ea and Trange (GAMM, P < 0.0001;
embryos (blue), larvae Fig. 4C) supports the hypothesis that the metab-
(orange), and adults olism of stenotherms is more responsive to
(red) as a function of temperature changes than that of eurytherms
absolute latitude. (4, 13). The correlation between Ea and Trange
Regression fits (solid is also consistent within life stages (embryos
lines) with 95% CIs and adults) and within individual species such
(colored shadings) are as Atlantic cod (fig. S5). These results suggest
based on generalized that temperature-rate responses do not strictly
Downloaded from http://science.sciencemag.org/ on August 12, 2020
additive models (GAM, conform to statistical thermodynamics (14)
P < 0.0001; n = 698 to but instead may reflect an outcome of energetic
735 for each life stage), optimizations (reduction of costs) and trade-
accounting for uncer- offs related to lifestyle and ontogeny (10).
tainty related to phylo- Biophysical models using a generalized Ea of
genetic data imputation 0.6 to 0.7 eV (14, 28) rather than the actual
(22). Only the correla- responsiveness of fish species or life stages may
tion between latitude therefore lead to imprecise projections of eco-
and Trange of embryos logical processes. For example, a scenario that
(C) is not significant assumes 3°C warming and an embryonic Ea of
(P > 0.05). (D to 0.65 eV would underestimate the change in
F) Corresponding to (A) to (C), box plots indicate differences in Tmax, Tmin, and Trange between life stages. Boxes and development time of Atlantic cod embryos
whiskers show 25th to 75th and 10th to 90th percentiles, respectively; white lines indicate the median. When (Ea = 0.92 eV) (29) and associated probability
accounting for geographic variation (latitude and marine versus freshwater; table S4), life stages differ significantly in functions (e.g., predation mortality) by ~80%
terms of Tmax, Tmin, and Trange (two-sided pairwise comparisons with Tukey correction, all P < 0.05). (fig. S6).
Safety margins of critical life stages define
for spawners and embryos than for larvae and Thermal responsiveness is inversely correlated species’ vulnerability to warming
adults (GAM, P < 0.0001; Fig. 2C and table S4). with thermal tolerance The vulnerability of species to climate warm-
Ontogenetic differences in thermal tolerance Thermal responsiveness and its correlation with ing is often assessed according to the difference
metrics are also consistent across latitudes thermal tolerance (Trange) were assessed on the between the upper thermal tolerance limit
(Fig. 3, A to C) and aquatic realms (i.e., marine basis of the temperature dependence of devel- (Tmax) of adult life stages and the maximum
and freshwater) (fig. S3). In support of the cli- opment rate (DR) and oxygen consumption habitat temperature during summer—a metric
mate variability hypothesis (11), Trange tends to rate (MO2) of embryos (DR and MO2, 83 spe- called the thermal safety margin (TSM). How-
decrease toward high and low latitudes (Fig. cies), larvae (MO2, 16 species) and adults (MO2, ever, the tolerance of adults to summer heat
3C and table S4), with the most stenothermal 54 species) (26). Direct comparison of the tem- is potentially less critical for the persistence of
species found in the Antarctic Ocean (Antarctic perature dependences of DR and MO2 revealed species than the ultimate temperature limit
icefishes, Notothenioidei) and the most eury- no systematic difference between them (fig. for reproduction, which we assessed on the basis
thermal ones in temperate freshwater systems S4). Only experimental data measured under of Tmax of spawners and embryos. Specifically,
(killifishes, Fundulidae) (Fig. 2A). Thermal tol- controlled, noncritical temperature conditions we compared current and future TSMs of adults
erance ranges of freshwater species and their were used (22). Individual responses (Fig. 4A) (the difference between Tmax and the mean
life stages are on average ~1°C wider than for were evaluated using the Boltzmann-Arrhenius temperature of the warmest summer month)
marine species (GAM, P < 0.0001; fig. S3), function (27), in which the scaling of physio- with the TSMs of spawners and embryos, esti-
probably reflecting higher temperature varia- logical rates (R) with temperature (T) is mated as the difference between their Tmax and
bility in lakes and rivers than in oceans. When the mean temperature of the coldest month
Ea
accounting for geographic variation in thermal R ¼ R0 exp ð1Þ during the species-specific spawning season
tolerance metrics, mean Trange values [±95% kT [mainly spring or monsoon time (22)]. In
confidence intervals (CIs)] increase by more Thermal responsiveness is given by the value this way, future TSMs of spawners and em-
than 20°C from spawners (7.2° ± 0.3°C) and of −Ea in electron volts (eV, positivized here- bryos indicate whether climate change will
embryos (8.4° ± 0.4°C) to larvae (22.3° ± 0.7°C) after), which is the activation energy of the affect the ability of species to reproduce at
and adults (27.5° ± 0.4°C) (Fig. 3F). These re- rate-limiting biochemical (metabolic) process, preferred times and locations. Seasonal habitat
sults clearly identify the temperature require- R0 is an organism-specific coefficient, and k is temperatures of adults, spawners, and embryos
ments of spawners and embryos as critical Boltzmann’s constant. Analyses of ontoge- [630 species (26)] are spatial averages accord-
bottlenecks in the life cycle of fish. netic differences in Ea (linear mixed-effect ing to distribution records, depth preferences,
Dahlke et al., Science 369, 65–70 2(2020) 3 July 2020 3 of 6RES EARCH | R E S E A R C H A R T I C L E
Fig. 4. Thermal responsiveness is higher in
stenothermal life stages. (A) Exponential
temperature responses of embryos (blue), larvae
(orange), and adults (red) based on Eq. 1.
Thermal responsiveness is indicated by the slope
of individual responses (thin lines). Thick lines
indicate the median responsiveness of different
life stages. Normalization (response values esti-
mated at any temperature divided by their value at
15°C) was done for illustrative purposes. (B) Thermal
responsiveness expressed as Arrhenius activation
energy (Ea in electron volts, eV). Box plots (as in
Fig. 3) with different letters indicate significant
differences between life stages (two-sided pairwise
comparisons with Tukey correction, P < 0.05).
(C) Correlation between thermal responsiveness and thermal tolerance of different life stages (colored symbols). The regression fit (line with 95% CIs as shading)
accounts for phylogenetic nonindependence (generalized additive mixed-effect model, GAMM).
Fig. 5. Smaller safety margins of spawners and
embryos versus adults. (A) Thermal safety
Downloaded from http://science.sciencemag.org/ on August 12, 2020
margins (TSMs) of spawners (black), embryos
(blue), and adults (red) based on recent habitat
(water) temperatures (1981 to 2000) as a
function of absolute latitude. Regression fits
(colored lines) with 95% CIs as shadings are based
on generalized additive models (GAM, P < 0.0001;
n = 543 for spawners, 554 for embryos, 580 for
adults; 630 species in total), taking into account
uncertainty related to phylogenetic data imputation
(24). (B) Corresponding to (A), box plots (as in
Fig. 3) with different letters indicate significant
differences between TSMs of different life stages
(two-sided pairwise comparisons with Tukey
correction, P < 0.05).
spawning times and locations, and temperature marine and freshwater species from different political commitments (SSP 4–6.0) would still
data of atmospheric and ocean reanalyses (cur- latitudes may already experience critically warm threaten more than one-third of the marine
rent TSMs, 1981 to 2000) and SSP climate projec- temperature conditions for reproduction. Al- and freshwater species under consideration
tion scenarios (future TSMs, 20-year averages though we note that the horizontal resolution (Fig. 6B). A positive outlook is that the per-
until 2100) (22). Deep-sea species (>500 m) and of observed and simulated habitat temperatures centage of species at risk could be reduced to
species with unknown spawning times were (1° × 1°) is not always sufficient to capture 10 to 15% if global warming is limited to 1.5°C
excluded. Selected SSPs include a low radiative specific microclimates, the cutoff threshold for (SSP 1–1.9; Fig. 6B), in line with the Paris
forcing scenario consistent with 1.5°C warming considering a species at risk from future warm- Agreement (30). For comparison, when con-
by 2100 (SSP 1–1.9), a medium-forcing scenario ing is set to TSM ≤ 0.0°C. sidering adult TSMs only, the fraction of
(SSP 4–6.0), and a high-forcing scenario (SSP Projected changes in TSMs of the most sen- species below the cutoff threshold is below
5–8.5) representing a warming of about 5°C sitive life stage (67% spawners and 33% em- 5% under SSP 5–8.5 (Fig. 6B). Accordingly,
relative to preindustrial levels (23). bryos) differ considerably between species and although assessments based on adult tem-
Current TSMs (mean ± 95% CI; Fig. 5) are emission scenarios (Fig. 6 and figs. S7 to S9). By perature limits or proxies thereof (e.g., species
significantly narrower for spawners (4.1° ± 0.3°C) the end of this century, more than 60% (me- distribution records) can provide important
and embryos (4.5° ± 0.4°C) than for adults dian of five models) of marine and freshwater information on the geographical distribution
(11.6° ± 0.3°C) (GAM, P < 0.0001; n = 1677) species considered in this study could be con- of climatic vulnerability (19–21), such analyses
(table S5). Differences in TSMs of marine and fronted with water temperatures exceeding miss the most sensitive life stages and are
freshwater species are not significant (GAM, tolerance limits in their current habitat (TSM ≤ likely to underestimate impact risks at the
P = 0.0663), and large variability found at all 0.0°C) if emissions continue to rise unabated species level.
latitudes implies that regional climatology (SSP 5–8.5; Fig. 6B). TSMs below zero indicate
plays a less important role than microclimatic that reproduction at preferred seasons and Discussion
conditions in shaping stage-specific TSMs of locations is no longer possible, forcing species This study identifies spawners and embryos as
marine and freshwater species. The narrowest to adapt or shift their spawning activity into the most temperature-sensitive stages in the
TSMs of spawners and embryos (TSM between cooler seasons or regions to avoid extinction. life cycle of fish. The observed ontogenetic
1° and 0°C, n = 37; Fig. 5) indicate that some Emission pathways consistent with current shift in thermal tolerance is consistent with
Dahlke et al., Science 369, 65–70 (2020) 3 July 2020 4 of 6RES EARCH | R E S E A R C H A R T I C L E
environmental factors such as hypoxia, salinity
stress, and CO2-driven acidification (29, 34).
When adults become sexually mature, additional
metabolic loads for gamete production [often
>20% of body mass (35)] are expected to cause
a concomitant decrease in thermal tolerance
due to warming-induced loss in aerobic capa-
city (2, 7). Hypoallometric growth of aerobic
capacity relative to body mass may also lead
to a narrowing of tolerance ranges and a shift
toward lower optimal temperatures in large,
nonreproducing adults, as suggested by ex-
periments with Atlantic cod (36) and field ob-
servations in eelpout (Zoarces viviparus) (5).
Indirect evidence of reduced aerobic capacity
of spawners relative to nonreproductive adults
comes from experiments indicating increased
sensitivity to hypoxia at the final stage of gonadal
development (37). In addition to oxygen limitation,
temperature stress can directly impair gonadal
Downloaded from http://science.sciencemag.org/ on August 12, 2020
development by affecting the production and
release of sex hormones (38). Narrow tolerance
ranges of spawners may therefore reflect a
combination of thermal constraints on aerobic
metabolism and endocrine processes related
to gametogenesis. The pattern of stage-specific
thermal tolerance demonstrated in this study
may also apply to other ectothermic animals (39),
although oxygen limitation as a causal principle
may be more relevant for aquatic versus ter-
restrial organisms, owing to the much lower
concentration and diffusivity of oxygen in water.
The higher thermal responsiveness of steno-
thermal species relative to eurythermal spe-
cies and life stages implies a mechanistic link
between physiological thermodynamics and
organismal thermal tolerance in fish (10, 13).
This prediction is based on the idea that ele-
vated activation energies (kinetic barriers) of
rate-limiting reactions in the citric acid cycle
constrain metabolic flux and cost and promote
resource efficiency (13). However, as relatively
small temperature changes have a marked im-
Fig. 6. Shrinking safety margins of critical life stages put many fish species at risk in their current pact on metabolic and developmental rates, such
habitat. (A) Cladogram for investigated fish species with tips colored according to estimated TSMs for an energetic optimization associated with toler-
recent conditions (1981 to 2000), and future Shared Socioeconomic Pathway (SSP) scenarios considering ance to a restricted temperature range (i.e.,
the TSM of the most critical life stages (~67% spawners, ~33% embryos) in their respective habitats. SSP stenothermality) is beneficial only when envi-
scenarios were developed during the sixth phase of the Coupled Model Intercomparison Project (CMIP6), ronmental temperature variability is low (Fig.
representing low (SSP 1–1.9), intermediate (SSP 4–6.0), and high (SSP 5–8.5) radiative forcing pathways 4C). Eurythermal organisms are thermally less
(23). (B) Median percentage of marine (n = 367) and freshwater species (n = 263) with TSMs less responsive and have wider tolerance ranges,
than or equal to 0.0°C. Black lines consider TSMs of the most sensitive life stage; green lines indicate which promote an active lifestyle in habitats
adult TSMs ≤ 0.0°C. Gray shadings denote the range between lower and upper percentile bounds of the with daily, seasonal, and/or vertical temper-
climate model ensemble scenarios. ature gradients and variability. For instance,
low responsiveness allows relatively constant
levels of performance and thus foraging ability
previous analyses of smaller datasets (17, 31) supply to tissues and thus improves tolerance in summer and winter as well as across depth-
and corresponds to the concept of oxygen- and to temperature extremes (8). In addition, the related temperature gradients. The trade-off
capacity-limited thermal tolerance (4), suggest- development of homeostasis functions (e.g., ion in this case may involve elevated baseline energy
ing that ontogenetic changes in aerobic capacity regulation) and repair mechanisms, including turnover, as seen in many eurythermal species
lead to corresponding changes in upper and heat shock responses, may contribute to an with an active pelagic lifestyle (40). Accord-
lower temperature limits (2). Increases in increase in tolerance to extreme temperatures ingly, in contrast to the concept of universal
aerobic capacity from egg to adult follow the from egg to adult (32, 33). Immature aerobic and temperature dependence (14), we argue that
development of the cardiorespiratory system homeostatic capacities of fish embryos and thermal responsiveness is adaptive and shaped
(heart and gills), which facilitates effective O2 larvae also explain their sensitivity to other to meet environmental conditions and ecological
Dahlke et al., Science 369, 65–70 2(2020) 3 July 2020 5 of 6RES EARCH | R E S E A R C H A R T I C L E
requirements (9). Building on the indirect evi- climate change factors such as deoxygenation, 33. F. Dahlke et al., J. Exp. Biol. 223, jeb212589 (2020).
dence presented here (correlation between Ea acidification, and temperature extremes during 34. R. Przeslawski, M. Byrne, C. Mellin, Glob. Change Biol. 21,
2122–2140 (2015).
and Trange; Fig. 4C), further experimental work stochastic heat waves (30) is not considered. 35. D. R. Barneche, D. R. Robertson, C. R. White, D. J. Marshall,
and analyses that take into account potentially Science 360, 642–645 (2018).
relevant traits (e.g., body mass, activity, trophic Conclusion 36. B. Björnsson, A. Steinarsson, Can. J. Fish. Aquat. Sci. 59,
494–502 (2002).
level) are necessary to confirm a general rela- Phylogenetic, geographic, and ontogenetic pat- 37. R. S. Wu, in Fish Physiology, vol. 27 (Elsevier, 2009),
tionship among energy efficiency, metabolic terns in thermal physiology revealed in this pp. 79–141.
thermal responsiveness, and thermal toler- study suggest that many fish species face greater 38. N. W. Pankhurst, P. L. Munday, Mar. Freshw. Res. 62,
1015–1026 (2011).
ance range. risks due to global warming than previously 39. B. S. Walsh et al., Trends Ecol. Evol. 34, 249–259
Narrow thermal safety margins of spawners expected. Narrow temperature ranges for re- (2019).
and embryos indicate that the temperature re- production in relation to future warming sce- 40. B. A. Seibel, J. C. Drazen, Philos. Trans. R. Soc. London Ser. B
362, 2061–2078 (2007).
quirements for reproduction define the climate narios underscore the urgency to investigate
41. M. J. J. Angilletta, Thermal Adaptation: A Theoretical and
change vulnerability of fish. For many species, the adaptive potential of species and popula- Empirical Synthesis (Oxford Univ. Press, 2009).
the highest warming trajectory (SSP 5–8.5) tions while taking measures to protect existing 42. M. L. Pinsky, B. Worm, M. J. Fogarty, J. L. Sarmiento,
represents a major threat, as water temper- and alternative (spawning) habitats from human S. A. Levin, Science 341, 1239–1242 (2013).
43. A. Bruge, P. Alvarez, A. Fontán, U. Cotano, G. Chust, Front. Mar. Sci.
ature may exceed their current tolerance limit impacts (48). Very clearly, many fish species and 3, 86 (2016).
for reproduction (Fig. 6). Coping with climate people who depend on healthy fish stocks would 44. M. Byrne, S. A. Foo, P. M. Ross, H. M. Putnam, Glob. Change Biol.
change would be achieved through changes in benefit from intensified efforts to stabilize global 26, 80–102 (2020).
45. H.-O. Pörtner et al., Ocean systems. In Climate Change 2014:
thermal tolerance [through acclimatization of warming at 1.5°C or even less. Impacts, Adaptation, and Vulnerability. Part A: Global and
individuals, or through evolutionary adapta- Sectoral Aspects. Contribution of Working Group II to the Fifth
Downloaded from http://science.sciencemag.org/ on August 12, 2020
tion across generations (41)] and by shifting the RE FERENCES AND NOTES Assessment Report of the Intergovernmental Panel on Climate
Change (Cambridge Univ. Press, 2014).
timing and/or location of spawning to cooler 1. A. Clarke, Principles of Thermal Ecology: Temperature, Energy
46. A. B. Neuheimer, B. R. MacKenzie, M. R. Payne, Sci. Adv. 4,
and Life (Oxford Univ. Press, 2017).
seasons or regions [niche tracking (42, 43)]. eaar4349 (2018).
2. H.-O. Pörtner, A. P. Farrell, Science 322, 690–692 (2008).
However, adaptation over generations is prob- 47. R. J. Wootton, C. Smith, Reproductive Biology of Teleost Fishes
3. J. M. Sunday, A. E. Bates, N. K. Dulvy, Nat. Clim. Change 2,
(Wiley, 2014).
ably too slow to cope with major anthropogenic 686–690 (2012).
48. C. M. Duarte et al., Nature 580, 39–51 (2020).
change (44, 45). In addition, shifts in spawning 4. H.-O. Pörtner, Comp. Biochem. Physiol. A 132, 739–761
49. H.-O. Pörtner et al., Clim. Res. 37, 253–270 (2008).
(2002).
times and locations can be problematic and in 5. H.-O. Pörtner, R. Knust, Science 315, 95–97 (2007).
some cases impossible, depending on species' 6. H.-O. Pörtner, C. Bock, F. C. Mark, J. Exp. Biol. 220, 2685–2696 AC KNOWLED GME NTS
reproductive strategy and geographical distribu- (2017). We thank D. Storch for constructive comments on an earlier
7. H.-O. Pörtner, M. A. Peck, J. Fish Biol. 77, 1745–1779 version of this manuscript. The Earth System Grid Federation
tion (18). For instance, to provide offspring with (2010). is acknowledged for providing access to CMIP6 climate
suitable feeding conditions, spawning times are 8. P. J. Rombough, in Fish Physiology, vol. 11 (Elsevier, 1988), model output. Funding: Supported by the research project
usually synchronized with seasonal peaks in pp. 59–161. METAFISCH of the German Federal Ministry of Education and
9. A. Clarke, Trends Ecol. Evol. 18, 573–581 (2003). Research (BMBF grant FZK01LS1604A to H.-O.P. and F.T.D.)
plankton productivity (46), especially outside the 10. H.-O. Pörtner et al., Physiol. Biochem. Zool. 79, 295–313 and by the Deutsche Forschungsgemeinschaft (Po 278/16-1
tropics (18). Moreover, spawning locations may (2006). and -2) as part of the Research Unit Tersane (FO 2332).
provide essential substrates for egg deposition 11. D. H. Janzen, Am. Nat. 101, 233–249 (1967). S.W. was funded through HIFMB based on the collaboration
12. J. Sunday et al., Philos. Trans. R. Soc. London Ser. B 374, between the Alfred Wegener Institute, Helmholtz Centre for Polar
and hydrographic features that ensure disper- 20190036 (2019). and Marine Research, and the Carl von Ossietzky University
sal of pelagic eggs and larvae toward suitable 13. H.-O. Pörtner, M. Lucassen, D. Storch, Fish Physiol. 22, 79–154 Oldenburg, initially funded by the Ministry for Science and
nursery habitats (47). This means that despite (2005). Culture of Lower Saxony and the Volkswagen Foundation through
14. J. H. Brown, J. F. Gillooly, A. P. Allen, V. M. Savage, G. B. West, the Niedersächsisches Vorab grant program (grant ZN3285).
more suitable temperature conditions, alterna-
Ecology 85, 1771–1789 (2004). Author contributions: H.-O.P. and F.T.D. conceived the
tive spawning seasons and locations may not 15. A. I. Dell, S. Pawar, V. M. Savage, Proc. Natl. Acad. Sci. U.S.A. research idea; F.T.D. collated thermal tolerance and thermal
necessarily meet the ecological requirements 108, 10591–10596 (2011). responsiveness data and coordinated all analyses and
for successful reproduction (18). Relative to most 16. T. P. Smith et al., Nat. Commun. 10, 5124 (2019). visualizations; S.W. compiled distribution data and conducted
17. J. Brett, Q. Rev. Biol. 31, 75–87 (1956). phylogenetic imputation of thermal tolerance data, including
marine species, freshwater fishes are less flexible 18. L. Ciannelli, K. Bailey, E. M. Olsen, ICES J. Mar. Sci. 72, visualization; M.B. compiled and analyzed climate model data,
in terms of niche tracking because of geographic 285–296 (2015). including the calculation of habitat temperatures; and F.T.D.
barriers between habitats and anthropogenic 19. M. L. Pinsky, A. M. Eikeset, D. J. McCauley, J. L. Payne, drafted the manuscript. All authors wrote and edited the
J. M. Sunday, Nature 569, 108–111 (2019). manuscript. Competing interests: The authors declare that they
habitat degradation (e.g., dams, hydroelectric 20. L. Comte, J. D. Olden, Nat. Clim. Change 7, 718–722 (2017). have no competing interests. Data and materials availability:
power plants, and pollution) (20). 21. C. H. Trisos, C. Merow, A. L. Pigot, Nature 580, 496–501 All data needed to evaluate the conclusions in the paper are
Note that quantitative risk assessments for (2020). present in the paper and/or the supplementary materials and
22. See supplementary materials. data files. The raw data supporting the findings of this study are
individual species or populations (e.g., changes 23. M. Gidden et al., Geosci. Model Dev. 12, 1443–1475 (2019). available from PANGAEA, a member of the ICSU World Data
in abundance and productivity) may require 24. D. L. Rabosky et al., Nature 559, 392–395 (2018). System, at https://doi.org/10.1594/PANGAEA.917796.
not only information on sublethal temperature 25. E. W. Goolsby, J. Bruggeman, C. Ané, Methods Ecol. Evol. 8,
22–27 (2017).
thresholds constraining functional scope (e.g., 26. See the acknowledgments (data and materials availability). SUPPLEMENTARY MATERIALS
indicated by reduced growth performance) (5), 27. R. M. Sibly, J. H. Brown, A. Kodric-Brown, Metabolic Ecology:
science.sciencemag.org/content/369/6499/65/suppl/DC1
but also more detailed data on acclimatization A Scaling Approach (Wiley, 2012).
Materials and Methods
28. M. E. Dillon, G. Wang, R. B. Huey, Nature 467, 704–706 (2010).
and adaptation potential, spawning ecology, Figs. S1 to S10
29. F. T. Dahlke et al., Sci. Adv. 4, eaas8821 (2018).
population structure, habitat connectivity, and Tables S1 to S6
30. O. Hoegh-Guldberg et al., Science 365, eaaw6974
References (50–127)
microclimatic conditions than are available for (2019).
31. P. J. Rombough, in Seminar Series—Society for Experimental View/request a protocol for this paper from Bio-protocol.
most species considered in this study. Further-
Biology, vol. 61 (Cambridge Univ. Press, 1997), pp. 177–224.
more, our qualitative risk assessment is prob- 32. A. Hamdoun, D. Epel, Proc. Natl. Acad. Sci. U.S.A. 104, 4 September 2019; accepted 14 May 2020
ably conservative because exposure to additional 1745–1750 (2007). 10.1126/science.aaz3658
Dahlke et al., Science 369, 65–70 (2020) 3 July 2020 6 of 6Thermal bottlenecks in the life cycle define climate vulnerability of fish
Flemming T. Dahlke, Sylke Wohlrab, Martin Butzin and Hans-Otto Pörtner
Science 369 (6499), 65-70.
DOI: 10.1126/science.aaz3658
Some cope better than others
Increasingly, research is revealing how organisms may, or may not, adapt to a changing climate. Understanding
the limitations placed by a species's physiology can help to determine whether it has an immediate potential to deal with
rapid change. Many studies have looked at physiological tolerance to climate change in fishes, with results indicating a
range of responses. Dahlke et al. conducted a meta-analysis to explore how life stage may influence a species's ability
Downloaded from http://science.sciencemag.org/ on August 12, 2020
to tolerate temperature change (see the Perspective by Sunday). They found that embryos and breeding adult fishes are
much more susceptible to temperature change than those in other life stages and that this factor must therefore be
considered in evaluations of susceptibility.
Science, this issue p. 65; see also p. 35
ARTICLE TOOLS http://science.sciencemag.org/content/369/6499/65
SUPPLEMENTARY http://science.sciencemag.org/content/suppl/2020/07/01/369.6499.65.DC1
MATERIALS
RELATED http://science.sciencemag.org/content/sci/369/6499/35.full
CONTENT
REFERENCES This article cites 102 articles, 13 of which you can access for free
http://science.sciencemag.org/content/369/6499/65#BIBL
PERMISSIONS http://www.sciencemag.org/help/reprints-and-permissions
Use of this article is subject to the Terms of Service
Science (print ISSN 0036-8075; online ISSN 1095-9203) is published by the American Association for the Advancement of
Science, 1200 New York Avenue NW, Washington, DC 20005. The title Science is a registered trademark of AAAS.
Copyright © 2020, American Association for the Advancement of ScienceYou can also read