The impact of climate change on snow conditions in mainland Australia - Kevin Hennessy, Penny Whetton, Ian Smith, Janice Bathols, Michael ...
←
→
Page content transcription
If your browser does not render page correctly, please read the page content below
The impact of climate change on
snow conditions in mainland Australia

Kevin Hennessy, Penny Whetton, Ian Smith, Janice Bathols,
         Michael Hutchinson and Jason Sharples

                      August 2003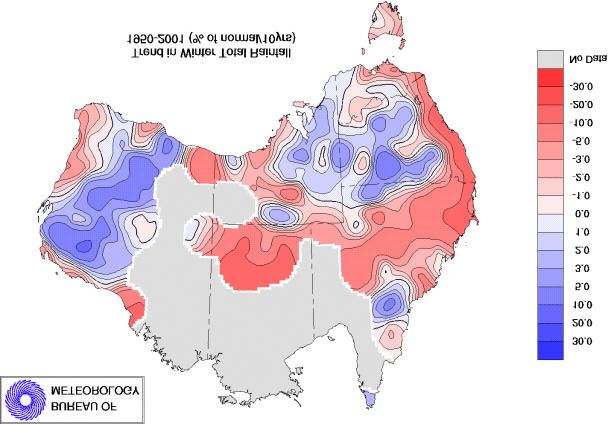
The impact of climate change on snow conditions in
mainland Australia
Kevin Hennessy, Penny Whetton, Ian Smith, Janice Bathols,
Michael Hutchinson* and Jason Sharples*
Published by CSIRO Atmospheric Research, Aspendale, Victoria, Australia.
A report for the Victorian Department of Sustainability and Environment, Victorian Greenhouse
Office, Parks Victoria, New South Wales National Parks and Wildlife Service, New South Wales
Department of Infrastructure, Planning and Natural Resources, Australian Greenhouse Office and
Australian Ski Areas Association.
CSIRO 2003
* Australian National University Centre for Resource and Environmental Studies
Address for correspondence:
Mr Kevin Hennessy
CSIRO Atmospheric Research
PMB 1
Aspendale Victoria 3195
Telephone: (03) 9239 4536
Fax: (03) 9239 4444
E-mail: Kevin.Hennessy@csiro.au
CSIRO Atmospheric Research (http://www.dar.csiro.au) conducts research into weather, climate
and atmospheric pollution, concentrating on environmental issues affecting Australia. Our research
is directed toward meeting the needs of government, industry and the community. We address
issues such as urban and regional air pollution, acid deposition, the enhanced greenhouse effect,
ozone depletion, climatic variability and severe weather. See
http://www.dar.csiro.au/division/docs/DivisionalBrochure.pdf.
The Australian National University Centre for Resource and Environmental Studies
(http://cres.anu.edu.au) addresses resource and environmental issues of national and international
importance through the development and application of interdisciplinary concepts, theories and
methods involving biophysical and socio-economic dimensions. CRES undertakes research and
postgraduate training and conducts consultancies for industry and all levels of government.
Disclaimer
The projections in this report are based on results from computer models that involve
simplifications of real physical processes that are not fully understood. Accordingly, no
responsibility will be accepted by CSIRO for the accuracy of the projections inferred from this
report or for any person’s interpretations, conclusions or actions based on this information.
i
Contents

Executive Summary                                        1

Summary                                                  3

Introduction                                             8

Analysis of alpine climate trends since the mid 1950s   10

Projected changes in natural snow conditions            16

Projected changes in snow making requirements           28

Conclusions                                             37

Research needed to address gaps in knowledge            38

Acknowledgements                                        39

References                                              39

Appendix 1 Methodology: Collection and preparation of   41
     observed climate databases

Appendix 2 Intergovernmental Panel on Climate Change    45
     (IPCC) scenarios on global warming

                                       ii
Executive Summary
The primary aim of this study was to improve the current understanding of the impacts of past and
future climate change on natural snow cover in Australia. A secondary aim was to assess the role of
snow-making in countering projected changes in snow conditions.

Past changes in natural snow cover
Trends in alpine temperature, precipitation and snow depth were analysed over regions or sites for
which data were available. Alpine temperature data at four sites over the past 35 years revealed that
warming trends are slightly greater at higher elevations. Alpine precipitation data for the past 50
years showed evidence of small increases in New South Wales, and small decreases in Victoria.
Snow depth data from four alpine sites from 1957-2002 indicated a weak decline in maximum snow
depths at three sites. A moderate decline in mid-late season snow depths (August-September) was
evident at three sites. This may reflect the tendency for mid-late season snow depth to be driven by
ablation (melt and evaporation) while early season snow depth is precipitation driven.

Future changes in natural snow cover
Simulations of future snow conditions in the Australian alpine regions were prepared for the years
2020 and 2050, based on climate change projections published by CSIRO in 2001. A new climate-
driven snow model was developed and applied to this study.
The results for 2020 are of greatest relevance to future management of both ski resorts and sites of
biological significance due to the much smaller range of uncertainty associated with the projected
changes in temperature and precipitation. Information for 2050 provides some indication of the
future but is associated with a far greater range of uncertainty.
Two scenarios were used in the model, both of which were equally likely, but associated with
uncertainties. The low impact scenario used the lowest projected warming combined with the
highest estimate of increased precipitation. The high impact scenario used the highest projected
warming with the highest estimate of decreased precipitation. We have very high (at least 95%)
confidence that the low impact limits will be exceeded and that the high impact limits will not be
exceeded.
Under the low impact and the high impact scenarios respectively, the total alpine area with an
average of at least one day of snow cover decreases 10-39% by 2020, and 22-85% by 2050. The
area with at least 30 days of snow cover decreases 14-54% by 2020, and 30-93% by 2050. The area
with at least 60 days of cover shrinks 18-60% by 2020, and 38-96% by 2050.
At all sites, the low impact scenario for 2020 only has a minor impact on snow conditions. Average
season lengths are reduced by around five days. Reductions in peak depths are usually less than
10%, but can be larger at low sites (e.g. Mt Baw Baw and Wellington High Plains). The high impact
scenario for 2020 leads to reductions of 30-40 days in average season lengths. At higher sites such
as Mt Hotham, this can represent reductions in season duration of about 25%, but at lower sites
such as Mt Baw Baw the reduction can be more significant (up to 60%). Impacts on peak depth
follow a similar pattern: moderate impacts at higher elevation sites, large impacts at lower elevation
sites. There is also a tendency for the time of maximum snow depth to occur earlier in the season
under warmer conditions. For example, the results for Thredbo show this occurring about 20 days
earlier under the high impact scenario.

                                                  1
Future requirements for snow-making by 2020
Snow-making at ski resorts will be one of the major ways of adapting to greenhouse warming. We
assessed the effect of warmer conditions on the number of hours suitable for snow-making by 2020,
and the Potential Volume of snow that could be made using two types of snow-guns (Brand A and
Brand B, names withheld for commercial reasons) at each resort. The average number of hours
suitable for snow-making declines by 2-7% for the low impact scenario and by 17-54% for the high
impact scenario. The potential snow-making volume is reduced by 3-10% under the low impact
scenario, and by 18-55% under the high impact scenario.
Based on target snow-depth profiles for May to September nominated by snow-making managers at
each resort, the snow model was able to simulate the amount of man-made snow required, taking
into account natural snowfall, snow-melt and the pre-existing natural snow depth. We computed the
Target Volume of man-made snow required over a typical ski run at each resort to achieve the
target profile in 90% of years.
Using information about the Potential Volumes of snow that could be made, the number of snow-
guns needed to achieve the Target Volumes was estimated, under present and 2020 conditions. The
results are significantly influenced by the elevations at which snow-making hours were computed,
i.e. 1340 metres at Lake Mountain and Mt Thredbo, 1460 metres at Mt Baw Baw, 1550 metres at
Mt Selwyn, 1642 metres at Falls Creek and 1720 metres at Mt Buller and Mt Perisher. About one
Brand A gun per ski run is needed at Mt Perisher under present conditions, 1.8 at Falls Creek,
almost three at Mt Selwyn and Mt Buller, and 15 at Lake Mountain. An increase of 11-24% in the
number of Brand A snow-guns would be required for the low impact scenario, and 73-200% for the
high impact scenario. Brand B snow-guns produce slightly less snow than Brand A. Under present
conditions, about one Brand B gun per ski run is needed at Mt Perisher, 2.6 at Falls Creek and Mt
Thredbo, 4.2 at Mt Selwyn and Mt Buller, and 21 at Lake Mountain. An increase of 11-27% in the
number of these snow-guns would be required for the low impact scenario, and 71-188% for the
high impact scenario. Therefore, with sufficient investment in snow-guns, the Australian ski
industry will be able to manage the impact of projected climate change on snow cover until at least
2020, bearing in mind the limitations outlined below.
This study required some simplifying assumptions (e.g. only two snow-guns, operated
automatically) and exclusion of various factors that were not easily included in our model, i.e:
• likely improvements in snow-making technology;
• continuing improvements in snow-making operations such as:
− optimized snow-gun start-up temperatures;
− management of the number of pumps and pressure gradients to minimize water heating;
− increased efficiency of water cooling systems;
− snow-plume placement;
− elevation of snow guns on towers;
− additives to enhance conversion of water to snow;
− snow grooming and snow-farming.
• the effect of cold air drainage on snow-making capacity at lower elevations;
• the effect of topographic aspect on natural snow deposition;
• less rapid snow-melt rate for man-made snow relative to natural snow;
• possible water-supply limitations due to projected reductions in precipitation and increased
evaporation in south-east Australia;
• acceptable levels of environmental impact, e.g. likely increase in demand for water and energy
due to increased snow-making.
2Summary
Scope of this report
This assessment of past and future changes in snow conditions was prepared by CSIRO and the
Australian National University (ANU) based on completion of the following tasks:
1. Collection and preparation of climate databases;
2. Analysis of databases for trends in alpine conditions;
3. Modification of CSIRO’s existing snow model and its application to the estimation of
natural snow cover by the years 2020 and 2050;
4. Preliminary assessment of the implications of the findings for future snow-making.
Aims of this study
The primary aim of this study was to improve the current understanding of the impacts of past and
future climate change on natural snow cover in Australia.
A secondary aim was to assess the role of snow-making as an adaptive response in countering
projected changes in snow conditions.
Past changes in natural snow cover
Trends in alpine temperature, precipitation and snow depth were analysed over regions or sites for
which data were available. Alpine temperature data at four sites over the past 35 years revealed that
warming trends are slightly greater at higher elevations. Alpine precipitation data for the past 50
years showed evidence of small increases in New South Wales, and small decreases in Victoria.
Snow depth data from four alpine sites from 1957-2002 indicated a weak decline in maximum snow
depths at three sites. A moderate decline in mid-late season snow depths (August-September) was
evident at three sites. This may reflect the tendency for mid-late season snow depth to be driven by
ablation (melt and evaporation) while early season snow depth is precipitation driven.
Climate change projections used in this study
The most recent projections for climate change in Australia were released by CSIRO in May 2001.
Application of these projections in CSIRO’s snow model has provided estimates of changes in
snow conditions for 2020 and 2050 under two different scenarios, 'low impact' and 'high impact',
with projected changes in temperature and precipitation as described in Table 1S. The low impact
scenario used the lowest projected warming combined with the highest estimate of increased
precipitation. The high impact scenario used the highest projected warming with the highest
estimate of decreased precipitation.
3Table 1S: Changes in alpine temperature and precipitation for 2020 and 2050, relative to 1990.
Scenario Projected Change Projected Change in
(Year) in Temperature Precipitation
(°C) (%)
Low impact (2020) +0.2 +0.9
High Impact (2020) +1.0 -8.3
Low impact (2050) +0.6 +2.3
High impact (2050) +2.9 -24.0
It should be noted that the values within the ranges shown in Table 1S are equally probable. We
have very high confidence (at least 95%) that the low impact scenarios for 2020 and 2050 will be
exceeded and that the high impact scenarios will not be exceeded.
Relevance of the data to managers of ski resorts and natural resources
Results for 2020 are of greatest relevance to future management of both ski resorts and sites of
biological significance due to the smaller range of uncertainty in the projected changes in
temperature and precipitation. Projections to 2050 provide an indication of the future but are
associated with a far greater range of uncertainty.
Future changes in natural snow cover
A new version of CSIRO’s climate-driven snow model was developed and applied to this study.
Standard outputs of the snow model are:
• snow depth;
• snow cover duration;
• snow ablation-rate;
• snow-to-rainfall ratio;
• regional maps and site-specific snow-depth profiles;
• probability of snow depth at a given date;
• snow-line elevation.
Simulations of future snow conditions in the Australian alpine regions were prepared for the years
2020 and 2050, based on climate change projections published by CSIRO in 2001, applied to the
new snow model.
Under the low impact and the high impact scenarios respectively, the total alpine area with an
average of at least one day of snow cover decreases 10-39% by 2020, and 22-85% by 2050. The
area with at least 30 days of snow cover decreases 14-54% by 2020, and 30-93% by 2050. The area
with at least 60 days of cover shrinks 18-60% by 2020, and 38-96% by 2050.
The low impact scenario for 2020 has a minor impact on snow conditions. Average season lengths
are reduced by around five days. Reductions in peak depths are usually less than 10%, but can be
larger at lower sites (e.g. Mt Baw Baw and Wellington High Plains). The high impact scenario for
2020 leads to reductions of 30-40 days in average season lengths. At higher sites such as Mt
Hotham, this can represent reductions in season duration of about 25% (Figure 1S), but at lower
sites such as Mt Baw Baw the reduction can be more significant (up to 60%). Impacts on peak
depth follow a similar pattern: moderate impacts at higher elevation sites, large impacts at lower
elevation sites. There is also a tendency for the time of maximum snow depth to occur earlier in the
season under warmer conditions. For example, the results for Thredbo show this occurring about 20
days earlier under the high impact scenario.
4140
now Mt Hotham
120
2020 low
100 2020 high
Snow depth (cm) 2050 low
80
2050 high
60
40
20
0
p
n
v
t
l
l
ug
ug
ep
n
n
ct
Oc
-Ju
-Ju
No
Ju
Se
-Ju
-Ju
-O
-A
-A
-S
5-
1-
13
27
2-
7-
19
15
29
10
24
21
Date
Figure 1S: Simulated 20-year average snow-depth profiles at Mt Hotham (1,882 m) for present
(1979-1998), 2020 and 2050.
The snowline is expected to rise with global warming. For example, at Mt Kosciuszko, the snowline
elevation on 1 September is predicted to rise from the present average of 1,461 metres to between
1,488 and 1,624 metres by 2020. The probability of exceeding a natural snow depth of 30 cm each
day also declines with greenhouse warming. For example, at Mt Hotham on 1 July, the probability
drops from the present value of 65% to 15-60% by 2020.
Under the low impact scenario for 2050, season durations are decreased by 15-20 days at most sites.
Such reductions are relatively minor at high sites but can represent a substantial impact at low sites.
The reductions in peak depths range from around 10% at the highest sites to more than 80% at low
sites such as Mt Baw Baw. The high impact scenario for 2050 leads to very large reductions in
season duration and peak depth at all sites. Season durations are typically reduced by around 100
days, which leaves only the highest sites with durations of more than ten days. Maximum depths
shrink to less than 10% of their present value and occur much earlier in the season.
Future requirements for snow-making by 2020
Adaptation to greenhouse warming will be needed in natural and managed systems. Adaptation
strategies for native fauna and flora are beyond the scope of this report but have been discussed in
other literature (e.g. Brereton et al., 1995). One of the various adaptation options at ski resorts is
increased use of snow-making to maintain adequate snow depths.
We assessed the effect of warmer conditions on the number of hours suitable for snow-making and
the Potential Volume of snow that could be made with two types of snow-guns typically used at
Australian resorts (brand-names withheld for commercial reasons). Brand A snow-guns produced
more snow at each resort than Brand B. The results are significantly influenced by the elevations at
which snow-making hours were computed, i.e. 1340 metres at Lake Mountain and Mt Thredbo,
1460 metres at Mt Baw Baw, 1550 metres at Mt Selwyn, 1642 metres at Falls Creek and 1720
metres at Mt Buller and Mt Perisher. On average each year, Mt Perisher could produce about
50,000 cubic metres of snow per Brand A snow-gun. Mt Thredbo, Mt Selwyn, Mt Buller and Falls
Creek could produce about 20,000 cubic metres of snow per Brand A snow-gun (Figure 2S), and
about 15,000 cubic metres per Brand B snow-gun. Baw Baw could produce about half these
amounts, and Lake Mountain could produce about one quarter. For both snow-guns, the average
number of hours suitable for snow-making declines by 2-7% for the low impact scenario and by 17-
54% for the high impact scenario. The potential snow volumes are reduced by 4-10% under the low
impact scenario, and by 27-55% under the high impact scenario.
550000
Average snow volume (m )
3
Brand A snow-gun
now
40000
2020 lo
30000 2020 hi
20000
10000
0
Perisher Thredbo Selwyn Buller Falls Baw Baw Lake
Creek Mountain
1720 m 1340 m 1550 m 1720 m 1642 m 1460 m 1340 m
Figure 2S: Average potential volume of snow (cubic metres) that could have been made during
May to September by each Brand A snow-gun when wet-bulb temperatures were below -2oC for
present and 2020. No wet-bulb temperature data were available for Mt Hotham.
Based on target snow-depth profiles nominated by snow-making managers at each resort (Table
2S), we used the snow model to simulate the amount of man-made snow required, taking into
account natural snowfall, snow-melt and the pre-existing natural snow depth. June was the month
with greatest need for man-made snow. Using data for 1950 to 1998, we computed the Target
Volume of man-made snow required at each resort to achieve the target profile in 90% of Junes
over a typical ski run (500 metres long and 40 metres wide).
Table 2S: Target snow-depths (cm) defined by snow-making managers at each ski resort.
Results for Mt Hotham and Baw Baw are not shown since monthly wet-bulb temperature data
were unavailable. * The target depth at Selwyn and Lake Mountain was set at 0 cm on 15 Sept.
Resort 1 June 30 June 31 July 31 August 30 Sept
Perisher 1 30 60 100 40
Thredbo 1 30 60 100 40
Selwyn 1 20 30 45 0*
Falls Creek 1 30 60 100 40
Mt Buller 1 30 50 90 20
Lake Mountain 1 30 30 30 0*
Using information about the Potential Volumes of snow that could be made, the number of snow-
guns needed to achieve the Target Volumes was estimated, under present and 2020 conditions.
About one Brand A snow-gun per ski run is needed at Mt Perisher under present conditions, 1.8 at
Falls Creek, almost three at Mt Selwyn and Mt Buller, and 15 at Lake Mountain. An increase of 11-
24% in the number of Brand A snow-guns would be required for the low impact scenario, and 73-
200% for the high impact scenario (Figure 3S). Brand B snow-guns produce slightly less snow than
Brand A. Under present conditions, about one Brand B snow-gun per ski run is needed at Mt
Perisher, 2.6 at Falls Creek and Mt Thredbo, 4.2 at Mt Selwyn and Mt Buller, and 21 at Lake
Mountain. An increase of 11-27% in the number of these snow-guns would be required for the low
impact scenario, and 71-188% for the high impact scenario. Therefore, with sufficient investment in
snow-guns, the Australian ski industry will be able to manage the impact of projected climate
change on snow cover until at least 2020, bearing in mind the limitations outlined below.
67
Brand A snow-gun
6
Snow-guns per ski run now
5 2020 lo
2020 hi
4
3
2
1
0
Perisher Thredbo Selwyn Buller Falls Creek
1720 m 1340 m 1550 m 1720 m 1642 m
Figure 3S: Number of Brand A snow-guns needed to achieve resort-specific target snow-depth
profiles (Table 1S) in 90% of Junes on a typical ski-run, for present and 2020 conditions.
Limitations of the model in relation to snow making
This study required some simplifying assumptions, whilst excluding a number of physical and
management effects that are not easily included in CSIRO’s modeling framework. Apart from
limiting the results to two types of snow-guns, other physical and management exclusions were:
• likely improvements in snow-making technology;
• continuing improvements in snow-making operations such as:
− optimized snow-gun start-up temperatures;
− management of the number of pumps and pressure gradients to minimize water heating;
− increased efficiency of water cooling systems;
− snow-plume placement;
− elevation of snow guns on towers;
− additives to enhance conversion of water to snow;
− snow grooming and snow-farming.
• the effect of cold air drainage on snow-making capacity at lower elevations;
• the effect of topographic aspect on natural snow deposition;
• less rapid snow-melt rate for man-made snow relative to natural snow;
• possible water-supply limitations due to projected reductions in precipitation and increased
evaporation in south-east Australia;
• acceptable levels of environmental impact, e.g. likely increase in demand for water and energy
due to increased snow-making.
7Introduction
Global warming
Since the Industrial Revolution in the 18th century, human activities have increased the levels of the
main greenhouse gases – carbon dioxide, water vapour, methane, nitrous oxide and ozone in the
lower atmosphere, and chlorofluorocarbons. The growth of carbon dioxide emissions is derived
largely from the burning of fossil fuels and land clearing, results in about half of carbon dioxide
remaining in the atmosphere, with the remaining half taken up almost equally between the oceans
and vegetation.
The present carbon dioxide concentration is greater than any recorded level for the past 420,000
years. During the past 100 years, the Earth’s average temperature has risen by about 0.6oC, with
1998 being the warmest on record, 2002 the second warmest and the 1990s being the warmest
decade (WMO, 2002). The Intergovernmental Panel on Climate Change (IPCC) has concluded that
“an increasing body of observations gives a collective picture of a warming world and other
changes in the climate system”. The other changes include a 10 to 20 cm rise in global-average sea-
level since 1900, warming of the deep ocean and the lowest 8 km of the atmosphere, and a
reduction in snow cover and the area of sea-ice.
Australia's alpine regions and climate change
Greenhouse warming has the potential to reduce snow cover in the Australian Alps (Figure 1),
however the large annual variability in snow season characteristics at various locations makes it
difficult to detect trends. Traditionally, data have been collected from a small number of alpine sites
and analysed statistically to estimate trends.
Canberra
New South Wales
km
10 0 10 20 30 40 50 60 70 80
LEGEND Three Mile Dam snow course
Land above 1400 metres in elevation Mt Selwyn
(this area is usually snow covered for
at least one month a year) Deep Creek snow course
Mt Jagungal
Whites River Valley
Spencer’s Creek snow course Perisher Valley
Mt Kosciuszko (2229m)
Thredbo
Mt Buffalo
Mt Nelse
Falls Creek
Rocky Valley Dam
Mt Hotham (1860m)
Mt Buller (1809m)
Mt Wellington Victoria
Lake Mountain (1463m)
Melbourne Mt Baw Baw (1563m)
Figure 1: Study region and alpine sites referred to in this report. From Ruddell et al. (1990).
8Ruddell et al. (1990) showed that snow depths had declined at some sites from the 1950s to 1989,
but no trends were statistically significant the 90% confidence level. Given that most of south-
eastern Australia has continued to warm over the past decade, an updated assessment of snow trends
is needed to show whether there has been any change in the rate of decline, and whether these
trends are consistent with projections based on greenhouse warming. This has been assessed in the
current study.
The most recent projections of natural snow cover taking into account greenhouse warming were
published by Whetton (1998), based upon CSIRO’s (1996) climate change scenarios and CSIRO’s
snow model (Whetton et al. 1996). Since 1998, CSIRO has released new Australian climate change
projections (May 2001) and the snow model has been modified to give a broader range of outputs
and more reliable projections of natural snow (See Appendix 1).
The current study updates information on observed changes in climate and snow in the Australian
Alps since 1950. It also brings together the improved snow model and updated climate projections
(CSIRO, 2001) to estimate potential changes in natural snow cover and depth by 2020 and 2050.
An assessment is made of the ability for ski resorts to adapt through increased snow-making.
9Analysis of alpine climate trends since the mid-1950s
The databases and methods used to assess alpine climate trends are described in Appendix 1.
Changes in maximum and minimum temperature, precipitation and natural snow depth since the
1950s are outlined below.
Temperature changes
Australia has warmed by 0.7oC since 1910, with most of the warming occurring since 1950. Grided
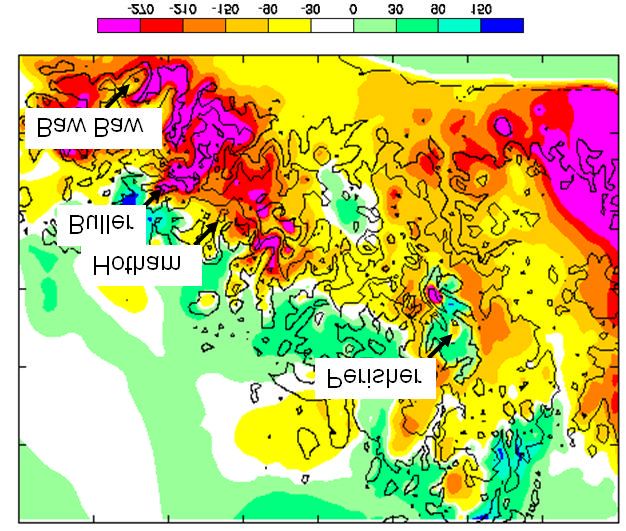
data from the Bureau of Meteorology from 1950 to 2001 (Figure 2) show an increase in winter
maximum temperature in south-east Australia with little change in minimum temperature. However,
Cabrumurra was the only alpine site included in this grided dataset.
Figure 2: Trends in winter maximum (left) and minimum (right) temperature (ºC/decade) from
1950 to 2001, based on Bureau of Meteorology Reference Climate Stations.
In the current study, temperature data were analysed at eight high altitude sites in south-east
Australia for which reliable temperature data were available, four of which were above 1,300
metres. Trends in minimum and maximum temperatures from June to September were calculated
over various periods between 1962 and 2001 (Table 1). Positive trends were evident in most months
at Cabramurra, Perisher Valley, Thredbo Automatic Weather Station (AWS) and Thredbo Village
(Figures 3 and 4), especially for July and September. The alpine trends over approximately 35 years
were close to +0.02oC per year. At sites below 1,000 metres, trends were weak and inconsistent.
Table 1: Maximum and minimum temperature trends averaged over June to September at four
sites above 1,300 metres elevation.
Site Elevation Period Tmax trend Tmin trend
(m) (years) oC/yr oC/yr
Cabrumurra 1,480 1962-1998 +0.023 +0.004
Perisher 1,735 1976-2001 +0.057 +0.034
Thredbo AWS 1,957 1967-2001 +0.020 +0.021
Thredbo Village 1,380 1967-2001 +0.035 +0.031
10Elevation (metres) Elevation (metres)
Figure 3: Trends for June, July, August and September maximum and minimum temperatures at
eight sites in south-east Australia for various periods between 1962 and 2001 (see Table 1).
From left to right in each panel, the stations are Rutherglen, Mt Beauty, Canberra, Rubicon,
Thredbo Village, Cabrumurra, Perisher and Thredbo Automatic Weather Station (AWS).
Figure 4: Time series of winter (June-Aug) maximum (red) and minimum (blue) temperature
(oC) at three alpine sites.
Precipitation changes
Annual average precipitation has decreased over most of eastern Australia and south-western
Australia, and increased over north-western Australia since 1950. The grided precipitation data
from the Bureau of Meteorology for 1950 to 2001 (Figure 5) show a decrease over the southern
Alps and an increase over the northern Alps. Although these results are based on interpolation of
data from non-alpine sites, they were confirmed using the finer resolution ANU CRES grided
precipitation data that include some alpine sites (Figure 6). For June to September between 1951
and 2000, small changes in alpine precipitation tended toward increases in the New South Wales
Alps and decreases in the Victorian Alps, consistent with the lower than average rainfall seen in
southern parts of Victoria over the past seven years.
11Figure 5: Trends in winter precipitation (%/decade) from 1950-2001, based on Bureau of
Meteorology Reference Climate Stations. The “normal” reference period is 1961-1990.
Figure 6: Trends in June to September precipitation (mm/century) from 1951 to 2000, based
on the ANU CRES interpolation of data from the Bureau of Meteorology.
12Changes in depth of natural snow
Analysis of maximum snow depth data from 1957 to 2002 at Deep Creek (NSW), Three Mile Dam
(NSW), Rocky Valley Dam (Vic) and Spencers Creek (NSW) gave trends of +0.09, -0.07, -0.33 and
–0.43 cm/year, respectively (Figure 7). These trends represented percentage changes per decade of
+0.7, -1.3, -2.8 and –2.2 respectively. None of the trends was statistically significant at the 90%
confidence level.
To compare these results with those of Ruddell et al. (1990), we needed to convert snow depth data
to water equivalent data using an average snow-density factor of 0.4. Table 2 shows that the decline
in maximum snow depth has slowed in the 1990s at Three Mile Dam, Rocky Valley Dam and
Spencers Creek, and reversed at Deep Creek.
Slater (1995) estimated that snow depth had declined 25% at Spencers Creek between 1954 and
1993. Davis (1998) found a decrease in the number of Snowy Mountain snow-days from 1970 to
1996, particularly in May and August and Green (2000) noted a decreasing trend in integrated
weekly snow depth at Spencers Creek from 1959 to 1999.
Figure 7: Maximum snow depth (cm) at Spencers Creek (1,830 m), Deep Creek (1,620 m),
Rocky Valley Dam (1,650 m) and Three-Mile Dam (1,460 m).
13Table 2: Trends in water-equivalent maximum snow depth (cm/yr and %/decade) at Deep
Creek, Spencers Creek, Three-Mile Dam and Rocky Valley Dam.
Site 1957-19891 1957-19891 1957-2002 1957-2002
cm/yr %/decade cm/yr %/decade
Deep Creek -0.05 -1.00 +0.04 +0.70
3 Mile Dam -0.05 -2.90 -0.03 -1.30
Rocky Valley Dam -0.54 -11.10 -0.13 -2.80
Spencers Creek -0.68 -7.40 -0.17 -2.20
1Values for 1957-1989 taken from Ruddell et al. (1990).
Because maximum snow depth usually occurs during late August, trends in maximum snow depth
may not be the best indicator of changes in the snow profile at other times of the year, nor of the
length of the season. Since the mid-1950s, trends in snow depth on 1 July, 1 August and 1
September at Spencers Creek, Three Mile Dam and Deep Creek showed a decline from August to
September (Table 3 and Figure 8). Daily data for Rocky Valley Dam were unavailable. The August
1 decrease was 0.56 to 0.91 cm/year, while the September 1 decrease was 0.27 to 0.46 cm/year.
Table 3: Trends in snow depth (cm/yr) on 1 July, 1 August and 1 September at Deep Creek,
Spencers Creek and Three-Mile Dam. Daily data for Rocky Valley Dam were unavailable.
Site Elevation Period 1 July 1 Aug 1 Sept
(m) (years)
Spencers Creek 1,830 1954-2002 -0.43 -0.91 -0.46
Deep Creek 1,620 1957-2002 +0.56 -0.56 -0.27
Three Mile Dam 1,460 1955-2002 +0.03 -0.57* -0.26
* significant at the 97% confidence level.
In summary, warming trends at four alpine sites over the past 35 years are greater than the trends
assessed at lower elevations. Over the past 50 years, there is evidence of small increases in New
South Wales alpine precipitation and small decreases in Victorian alpine precipitation. A small
decline in maximum snow depths is evident at three of the four alpine sites in the years between
1957 and 2002. A moderate decline in August and September snow depths is evident at three sites,
possibly indicative of the tendency for mid to late season snow depth to be determined by
temperature-dependent ablation (melt and evaporation), whereas the depth of early season snow is
determined by precipitation.
14Figure 8: Snow depth (cm) on 1 July, 1 August and 1 September at Spencers Creek (1,830 m),
Deep Creek (1,620 m) and Three Mile Dam (1,460 m).
15Projected changes in natural snow conditions
Whetton (1998) estimated that the total area with snow cover for at least 30 days in south-east
Australia would decline by 18 to 66% by 2030 and by 39 to 96% by 2070. This was based on the
1994 version of CSIRO’s snow model and the 1996 version of CSIRO’s climate change projections
for the alpine region (a warming of 0.3 to 1.3oC and a precipitation change of between 0 and -8% by
2030, and a warming of 0.6 to 3.4oC and a precipitation change of between 0 and -20% by 2070).
Since the snow model and climate change projections have been updated, a new assessment of
projected impacts on natural snow conditions was needed.
CSIRO climate change projections for the Australian Alps in 2020 and 2050
The IPCC (2001) provided estimates of global warming for the 21st century (Appendix 2). Each of
the IPCC climate models gave a unique climate response for a given increase in greenhouse gases –
some models have a greater global warming than others. To estimate climate change in the
Australian alpine region, model results were compared by expressing the regional climate responses
as a change per oC of global-average warming. To estimate regional changes in temperature and
precipitation for 2020 and 2050, the regional changes per oC of global warming were multiplied by
global warming values for 2020 and 2050 (Figure 2-A2 in Appendix 2). Alpine climate change
projections are shown in Table 4. For snow, the low impact scenario is the combination of the
lowest warming and the greatest precipitation increase, while the high impact scenario is the highest
warming combined with the greatest precipitation decrease. We have very high confidence (at least
95%) that the low impact scenarios will be exceeded and the high impact scenarios will not be
exceeded. Values within the ranges shown in Table 4 are equally probable.
Table 4: Changes in alpine temperature and precipitation for 2020 and 2050, relative to 1990.
Scenario Projected Change Projected Change in
(Year) in Temperature Precipitation
(°C) (%)
Low impact (2020) +0.2 +0.9
High Impact (2020) +1.0 –8.3
Low impact (2050) +0.6 +2.3
High impact (2050) +2.9 –24.0
Simulated natural snow depth and duration
An improved version of the snow model (Appendix 1) has been used with the climate change
projections in Table 4. Simulated regional patterns of maximum snow depth and snow-cover
duration are shown in Figures 9 and 10, respectively, for the present, 2020 and 2050. The total area
with an average of at least 1 day of snow cover decreases 10-39% by 2020, and 22-85% by 2050
(Table 5). The area with at least 30 days of snow cover decreases 14-54% by 2020, and 30-93% by
2050. The area with at least 60 days of cover decreases 18-60% by 2020, and 38-96% by 2050.
Table 5: Percentage change in area with at least 1, 30 or 60 days simulated annual-average
snow-cover duration for 2020 and 2050, relative to 1990.
Snow duration 2020 lowa 2020 highb 2050 lowa 2050 highb
At least 1 day –9.9 –39.3 –22.0 –84.7
At least 30 days –14.4 –54.4 –29.6 –93.2
At least 60 days –17.5 –60.3 –38.1 –96.3
a b
low impact scenario, high impact scenario
16Site-specific results have been calculated for the alpine resorts, each of which has significant
biological attributes such as populations of the Mountain Pygmy-possum and Alpine She-oak
Skink, as well as alpine snow-patch communities. These resorts are:
• Mt Baw Baw (Victoria);
• Lake Mountain (Victoria);
• Mt Buller (Victoria);
• Mt Buffalo (Victoria);
• Falls Creek (Victoria);
• Mt Hotham (Victoria);
• Mt Thredbo (New South Wales);
• Mt Perisher (New South Wales);
• Mt Selwyn (New South Wales).
The distribution of flora and fauna is expected to change under greenhouse climate effects at the
sub-continental level (Brereton et al. 1995) and in the Alps (Green and Pickering, 2002). Snow
conditions, depth and snowline can have important implications for the distribution and persistence
of biodiversity in the alpine area, so identification of potential changes in conditions can inform
future management.
Present
Centimetres
2020 low 2020 high 2020 high
2050 low 2050 high
Figure 9: Simulated maximum snow depth (cm) for present, 2020 and 2050.
17Present
Days
2020 low 2020 high
2050 low 2050 high
Figure 10: Simulated snow-cover duration (days) for present, 2020 and 2050.
To augment the ecological value of the datasets, five additional non-resort areas were selected to
provide site specific data on:
• a broader geographical range across the alps (e.g. Mt Kosciuszko, Wellington High Plains);
• specific biological attributes or ecological processes (e.g. Long Plain-Jagungal - tree line
inversion, Mt Nelse - snowpatch);
• sites of scientific interest for which limited data were already available and amenable to longer
term monitoring.
The additional five sites were:
• Wellington high plains (Victoria);
• Mt Nelse (Victoria);
• Whites River valley (New South Wales);
• Mt Jagungal (New South Wales);
• Mt Kosciuszko (New South Wales).
Figures 11 to 24 present the snow depth profiles averaged over 20 years for the various alpine sites.
Profiles for present conditions were averaged over the period from 1979 to 1998 and profiles for the
future were created using climate data from the same 20 years modified by the climate change
scenarios. Table 6 shows average duration of snow cover at all sites.
18Results for 2020 are of greatest relevance to future management of both ski resorts and sites of
biological significance due to the smaller range of uncertainty in the projected changes in
temperature and precipitation. Projections to 2050 remain useful as an indication of the future but
are associated with a far greater range of uncertainty.
The low impact scenario for 2020 has a minor impact on snow conditions. Average season lengths
are reduced by around five days. Reductions in peak depths are usually less than 10%, but can be
larger at lower sites (e.g. Mt Baw Baw and Wellington High Plains). The high impact scenario for
2020 leads to reductions of 30-40 days in average season lengths, with smaller impacts at higher
elevations and larger impacts at lower elevations. For example, at higher sites such as Mt Hotham,
this can represent reductions in season duration of about 25%, but at lower sites such as Mt Selwyn
the reduction can be more significant (up to 60%). Impacts on peak depth follow a similar pattern:
moderate impacts at higher elevation sites, large impacts at lower elevation sites. There is also a
tendency for the time of maximum snow depth to occur earlier in the season under warmer
conditions. For example, the results for Mt Thredbo show this occurring about 20 days earlier under
the high impact scenario. There is also a tendency for depth reductions to be larger in the late
season than in the early season. This pattern is consistent with observed trends.
Under the low impact scenario for 2050, season durations are decreased by 15-20 days at most sites.
Such reductions are relatively minor at high sites but can represent a substantial impact at low sites.
The reductions in peak depths range from around 10% at the highest sites to more than 80% at low
sites such as Mt Baw Baw. The high impact scenario for 2050 leads to very large reductions in
season duration and peak depth at all sites. Season durations are typically reduced by around 100
days, which leaves only the highest sites with durations of more than ten days. Maximum depths
shrink to less than 10% of their present value and occur much earlier in the season.
140
now Mt Hotham
120
2020 low
100 2020 high
Snow depth (cm)
2050 low
80
2050 high
60
40
20
0
n
v
p
t
l
l
ug
ep
n
n
ug
ct
-Ju
-Ju
Oc
No
Ju
Se
-Ju
-Ju
-O
-A
-S
-A
5-
1-
13
27
2-
7-
19
15
29
24
21
10
Date
Figure 11: Simulated 20-year average snow-depth profiles at Mt Hotham (1,882 m) for present
(1979-1998), 2020 and 2050.
19180
Perisher
160 now
140 2020 low
2020 high
Snow depth (cm)
120
2050 low
100
2050 high
80
60
40
20
0
p
n
v
n
t
n
l
ep
l
ug
ug
ct
-Ju
-Ju
Oc
No
Se
Ju
-Ju
-Ju
-O
-S
-A
-A
5-
1-
27
13
2-
7-
19
29
15
21
24
10
Date
Figure 12: Simulated 20-year average snow-depth profiles at Mt Perisher (1,835 m) for present
(1979-1998), 2020 and 2050.
160
now Falls Creek
140
2020 low
120 2020 high
Snow depth (cm)
100 2050 low
2050 high
80
60
40
20
0
n
p
v
t
l
l
n
ug
ug
ep
n
ct
-Ju
-Ju
Oc
No
Ju
Se
-Ju
-Ju
-O
-A
-A
-S
5-
1-
13
27
2-
7-
19
15
29
10
24
21
Date
Figure 13: Simulated 20-year average snow-depth profiles at Falls Creek (1,797 m) for present
(1979-1998), 2020 and 2050.
140
now Thredbo
120
2020 low
100 2020 high
Snow depth (cm)
2050 low
80
2050 high
60
40
20
0
n
p
v
t
l
n
n
l
ug
ug
ep
ct
-Ju
-Ju
Oc
No
Ju
Se
-Ju
-Ju
-O
-A
-A
-S
5-
1-
27
13
7-
2-
19
15
29
10
24
21
Date
Figure 14: Simulated 20-year average snow-depth profiles at Mt Thredbo (1,715 m) for present
(1979-1998), 2020 and 2050.
20100
90 now Mt Buller
80 2020 low
2020 high
Snow depth (cm)
70
2050 low
60
2050 high
50
40
30
20
10
0
un
ep
ov
l
ct
l
n
n
ug
ug
ep
ct
-Ju
-Ju
-Ju
-Ju
5-O
-O
2-N
7-S
1-J
-A
-A
-S
13
27
19
29
15
24
10
21
Date
Figure 15: Simulated 20-year average snow-depth profiles at Mt Buller (1,740 m) for present
(1979-1998), 2020 and 2050.
45
Mt Baw Baw
40 now
35 2020 low
2020 high
Snow depth (cm)
30
2050 low
25
2050 high
20
15
10
5
0
t
n
v
p
n
l
l
ug
ep
n
ct
ug
Oc
-Ju
-Ju
No
Ju
Se
-Ju
-Ju
-O
-A
-S
-A
5-
1-
13
27
2-
7-
19
29
15
10
21
24
Date
Figure 16: Simulated 20-year average snow-depth profiles at Mt Baw Baw (1,560 m) for
present (1979-1998), 2020 and 2050. See Appendix 2 for limitations of these data.
40
now Lake Mountain
35
2020 low
30
2020 high
Snow depth (cm)
25 2050 low
2050 high
20
15
10
5
0
n
t
p
v
n
n
ug
ug
ep
l
l
ct
Oc
-Ju
-Ju
No
Ju
Se
-Ju
-Ju
-O
-A
-A
-S
5-
1-
13
27
7-
2-
19
15
29
10
24
21
Date
Figure 17: Simulated 20-year average snow-depth profiles at Lake Mountain (1,400 m) for
present (1979-1998), 2020 and 2050. See Appendix 2 for limitations of these data.
2160
now Mt Selwyn
50 2020 low
2020 high
Snow depth (cm)
40 2050 low
2050 high
30
20
10
0
n
p
v
t
n
n
l
l
ep
ug
ug
ct
-Ju
-Ju
Oc
No
Ju
Se
-Ju
-Ju
-O
-S
-A
-A
5-
1-
13
27
2-
7-
19
15
29
21
10
24
Date
Figure 18: Simulated 20-year average snow-depth profiles at Mt Selwyn (1,604 m) for present
(1979-1998), 2020 and 2050.
70
Mt Buffalo
now
60
2020 low
50
Snow depth (cm)
2020 high
2050 low
40
2050 high
30
20
10
0
p
n
t
n
ov
l
l
n
ug
ug
ep
ct
-Ju
-Ju
Oc
Se
Ju
-Ju
-Ju
-O
2-N
-A
-A
-S
5-
1-
13
27
7-
19
29
15
10
24
21
Date
Figure 19: Simulated 20-year average snow-depth profiles at Mt Buffalo (1,516 m) for present
(1979-1998), 2020 and 2050.
60
now Wellington
High Plains
50 2020 low
2020 high
Snow depth (cm)
40 2050 low
2050 high
30
20
10
0
n
p
v
t
l
ug
n
n
ct
ug
l
ep
-Ju
Oc
-Ju
No
Ju
Se
-Ju
-Ju
-O
-A
-A
-S
5-
1-
27
13
7-
2-
19
15
29
10
24
21
Date
Figure 20: Simulated 20-year average snow-depth profiles at Wellington High Plains (1,560 m)
for present (1979-1998), 2020 and 2050. See Appendix 2 for limitations of these data.
22200
now Mt Nelse
180
160 2020 low
2020 high
Snow depth (cm)
140
2050 low
120
2050 high
100
80
60
40
20
0
v
p
n
l
l
t
n
n
ep
ug
ug
ct
-Ju
-Ju
Oc
No
Se
Ju
-Ju
-Ju
-O
-S
-A
-A
5-
13
27
1-
2-
7-
19
15
29
21
10
24
Date
Figure 21: Simulated 20-year average snow-depth profiles at Mt Nelse (1,829 m) for present
(1979-1998), 2020 and 2050.
160
now Whites River Valley
140
2020 low
120 2020 high
Snow depth (cm)
100 2050 low
2050 high
80
60
40
20
0
p
n
v
l
l
t
ug
n
ug
ep
n
ct
-Ju
-Ju
Oc
No
Se
Ju
-Ju
-Ju
-O
-A
-A
-S
5-
13
27
1-
2-
7-
19
29
15
10
24
21
Date
Figure 22: Simulated 20-year average snow-depth profiles at Whites River Valley (1,746 m) for
present (1979-1998), 2020 and 2050.
250
Jagungal
now
200 2020 low
Snow depth (cm)
2020 high
150 2050 low
2050 high
100
50
0
n
p
v
t
n
n
l
l
ep
ug
ug
ct
-Ju
-Ju
Oc
No
Ju
Se
-Ju
-Ju
-O
-S
-A
-A
5-
1-
13
27
2-
7-
19
15
29
21
10
24
Date
Figure 23: Simulated 20-year average snow-depth profiles at Mt Jagungal (2,061 m) for
present (1979-1998), 2020 and 2050.
23250
Mt Kosciuszko
now
200 2020 low
2020 high
Snow depth (cm)
150 2050 low
2050 high
100
50
0
p
n
t
v
ug
ay
l
n
ug
ep
ov
l
n
ov
ct
Oc
-Ju
-Ju
No
Se
Ju
-Ju
-Ju
-O
-M
-N
-N
-A
-A
-S
5-
13
1-
27
7-
2-
19
29
15
10
24
21
16
30
18
Date
Figure 24: Simulated 20-year average snow-depth profiles at Mt Kosciuszko (2,228 m) for
present (1979-1998), 2020 and 2050.
Table 6: Simulated average duration (days) of at least 1 cm of snow-cover at selected resorts
(some with results for low, mid and high elevations) and sites of biological significance.
Site (elevation) Present 2020 2050
Lake Mountain (1,400 m) 74 30-66 1-48
Mt Baw Baw (1,560 m) 80 32-71 1-53
Mt Buller low (1,383 m) 33 7-25 0-15
Mt Buller mid (1,560 m) 76 36-67 1-56
Mt Buller high (1,740 m) 108 70-102 7-89
Mt Buffalo low (1,477 m) 70 29-63 0-50
Mt Buffalo mid (1,516 m) 80 39-73 1-59
Mt Buffalo high (1,723 m) 113 78-108 10-96
Mt Wellington high plains (1,560 m) 82 38-75 2-59
Mt Nelse (1,829 m) 133 101-128 27-117
Falls Creek low (1,504 m) 77 41-71 2-59
Falls Creek mid (1,643 m) 105 68-99 8-87
Falls Creek high (1,797 m) 125 92-120 18-108
Mt Hotham low (1,400 m) 51 15-44 0-29
Mt Hotham mid (1,650 m) 98 59-92 4-77
Mt Hotham high (1,882 m) 129 97-124 21-114
Mt Perisher low (1,605 m) 90 53-87 4-69
Mt Perisher mid (1,835 m) 131 100-125 30-115
Mt Perisher high (2,021 m) 151 122-146 56-136
Mt Thredbo low (1,350 m) 32 8-26 0-17
Mt Thredbo mid (1,715 m) 113 80-108 13-97
Mt Thredbo high (2,023 m) 153 122-148 56-138
Mt Selwyn (1,604 m) 81 43-74 3-60
Whites River valley (1,746 m) 118 88-113 18-103
Mt Jagungal (2,061 m) 156 128-151 65-141
Mt Kosciuszko (2,228 m) 183 153-178 96-169
24More detailed analysis of future snow conditions at selected sites
Elevation of the snowline
The daily elevation of the snowline was estimated for Mt Hotham by identifying the lowest snow-
covered grid-point within 25 km. Results were averaged over the 20-year period 1979 to 1998 and
plotted as a snowline profile throughout the year (Figure 25). For example, the snowline is
predicted to rise from the present average of 1,412 metres on 1 September, to between 1,440 and
1,600 metres by 2020. At Mt Selwyn, the snowline on 1 September rises from 1,415 metres at
present to between 1,500 and 1,660 metres by 2020. At Mt Kosciuszko, the snowline on 1
September rises from 1,460 metres at present to between 1,490 and 1,625 metres by 2020. As
expected, there was little variation between sites in the behaviour of the snowline with warming.
2500
Mt Hotham
2000
Snowline (m)
1500
Present
1000 2020 low
2020 high
2050 low
500
2050 high
0
n
l
l
l
ug
ug
n
ep
ep
ct
ct
Ju
-Ju
-Ju
Ju
-Ju
-O
-O
-A
-A
-S
-S
1-
16
31
1-
14
29
16
15
30
14
29
Date
2500
Mt Selwyn
2000
Snowline (m)
1500
Present
1000 2020 low
2020 high
500 2050 low
2050 high
0
n
l
l
l
n
ug
ug
ep
ep
ct
ct
Ju
-Ju
-Ju
Ju
-Ju
-O
-O
-A
-A
-S
-S
1-
1-
16
31
29
14
16
15
30
14
29
Date
2500
Mt Kosciuszko
2000
Snowline (m)
1500
Present
1000 2020 low
2020 high
500 2050 low
2050 high
0
n
l
n
l
ep
l
ep
ug
ug
ct
ct
Ju
-Ju
-Ju
Ju
-Ju
-O
-O
-S
-S
-A
-A
1-
1-
16
31
14
29
16
14
29
15
30
Date
Figure 25: Simulated average snow-line elevation for Mt Hotham, Mt Selwyn and Mt Kosciuszko
for present (1979-1998), 2020 and 2050. High impact scenarios are truncated when no snow is
simulated.
25Probability of exceeding 30 cm natural snow depth
The probability of exceeding a natural snow depth of 30 cm each day was calculated for Mt Hotham
using data for 1979 to 1998 (Figure 26). For example, on 1 September, 18 of the 20 years had at
least 30 cm of snow, so the present probability is 90%. By 2020, this probability is predicted to
decline to between 60 and 85%. On 1 July, the probability drops from the present value of 65% to
15-60% by 2020.
Probability of > 30 cm snow depth (%)
100
Mt Hotham
90
80
70
60
50 Present
40 2020 low
30 2020 high
2050 low
20
2050 high
10
0
n
p
t
l
ep
n
l
ug
ug
n
ct
-Ju
-Ju
Oc
Ju
Se
-Ju
-Ju
-O
-S
-A
-A
5-
1-
27
13
7-
19
29
15
21
10
24
Date
Figure 26: Simulated profiles of the probability of exceeding 30 cm natural snow depth at Mt
Hotham (1,882 m) for present (1979-1998), 2020 and 2050.
Ratio of snow to rain
A decrease in the ratio of snow to rain in each precipitation event is expected as the climate warms,
i.e. precipitation will tend to fall as rain rather than snow. The simulated ratio of snow to rain was
calculated for Mt Hotham for the present (1979-1998), 2020 and 2050 (Figure 27). Changes by
2020 are small for the low impact scenario but significant for the high impact scenario. For
example, on 1 September, the ratio declines from the present value of 4.2 to between 4.0 and 2.9 by
2020. This represents a decrease of 5-31%. On 1 July and 1 August, the present ratios are 5.2 and
5.7, respectively, and the decreases by 2020 are 0-16% and 1-23%, respectively.
7
Mt Hotham
6
now
Ratio of snow to rain
5 2020 low
2020 high
4 2050 low
2050 high
3
2
1
0
t
n
p
v
n
l
l
ug
ug
ep
n
ct
Oc
-Ju
-Ju
No
Ju
Se
-Ju
-Ju
-O
-A
-A
-S
5-
1-
13
27
7-
2-
19
29
15
10
24
21
Date
Figure 27: Simulated profiles of the ratio of snow to rain at Mt Hotham (1,882 m) for present
(1979-1998), 2020 and 2050. An 11-day running mean has been used to smooth the data.
26Daily rate of snow ablation
Greenhouse warming is likely to enhance the rate of ablation in future. The simulated daily rate of
ablation was calculated at Mt Hotham (Figure 28). The low impact scenario for 2020 shows little
change from present, but the high impact scenario for 2020 shows substantial increases during
September, e.g. a 58% increase on 1 September. Results for a lower site (Mt Selwyn) and a higher
site (Mt Kosciuszko) are also shown in Figure 28.
70
now Mt Hotham
Snow ablation rate (mm/day)
60
2020 low
50 2020 high
40 2050 low
2050 high
30
20
10
0
n
t
p
v
l
l
n
ct
ug
n
ug
ep
-Ju
-Ju
Oc
No
Ju
Se
-Ju
-Ju
-O
-A
-A
-S
5-
1-
13
27
7-
2-
19
15
29
10
24
21
Date
80
Mt Selwyn
70 now
Snow ablation rate (mm/day)
2020 low
60
2020 high
50
2050 low
40 2050 high
30
20
10
0
n
p
t
v
ct
l
l
n
n
ug
ug
ep
Oc
-Ju
-Ju
No
Ju
Se
-Ju
-Ju
-O
-A
-A
-S
5-
1-
13
27
7-
2-
19
15
29
10
24
21
Date
45
Mt Kosciuszko
40 now
Snow ablation rate (mm/day)
35 2020 low
2020 high
30
2050 low
25 2050 high
20
15
10
5
0
n
p
t
v
n
n
l
l
ug
ug
ep
ct
Oc
-Ju
-Ju
No
Ju
Se
-Ju
-Ju
-O
-A
-A
-S
5-
1-
13
27
7-
2-
19
15
29
10
24
21
Date
Figure 28: Simulated profiles of the daily snow ablation rate at Mt Hotham, Mt Selwyn and Mt
Kosciuszko for present (1979-1998), 2020 and 2050. Units are water-equivalent mm per day.
27Projected changes in snow-making requirements
A recent report on the Swiss ski industry (Elsasser and Bürki, 2002) notes that 85% of
Switzerland’s current ski resorts can be designated as having reliable natural snow, and this may
decline to 44% over the coming decades if the elevation of reliable snow rose 600 metres due to
greenhouse warming. The report concludes that climate change should be viewed as a catalyst for
reinforcing and accelerating the pace of structural changes in alpine tourism. Various adaptation
strategies are outlined (Figure 29) – adopting a fatalistic attitude toward climate change is unlikely
since consumers and suppliers will undoubtedly alter their behaviour. Greenhouse warming over the
coming decades will require adaptation by the ski industry through various operational and
technical advances, many of which have been ongoing in the past decade, such as snow-making.
Develop higher
Ski slope design
terrain
Artificial
snow-making Co-operation
Maintain ski industry
Annual Business
contributions
Adaptation strategies as usual
Subsidies Fatalism
Single grant Alternatives to skiing Give up skiing
Non-snow
All-year tourism
related
Hikes, tennis
activities
Figure 29: Possible adaptation strategies. Adapted from Elsasser and Bürki (2002).
Snow-making is used in Australia to supplement natural snow cover on heavily used or low-
elevation ski runs and lift access areas (NPWS, 2001). Snow is usually guaranteed for the opening
of the season in early June due to the availability of man-made snow. Snow-guns may be triggered
automatically, by selected wet-bulb temperatures, or operated manually, with location, flow-rate
and duration optimized to suit prevailing conditions. Snow fences and grooming are also important
for creating and placing snow in the right location with some resorts selectively using nucleating
agents to enhance snow-making efficiency (NPWS, 2001).
Scott et al. (2003) investigated the vulnerability of the southern Ontario (Canada) ski industry to
climate change, including adaptation through snow-making. They used a 17-year record of daily
snow conditions and operations from a major ski area to calibrate a ski season model including
snow-making and operational decision rules based on interviews with ski area managers. The
average ski season duration was projected to decline 0-16% by 2020, requiring a compensating
28increase in snow-making by 36-144%. They concluded that the southern Ontario ski areas could
remain operational in a warmer climate within existing business planning and investment time
horizons (into the 2020s). In our assessment for Australia, we have used a similar methodology to
Scott el al. (2003).
Future demand for snow making will be influenced by:
1. Fewer hours with temperatures cold enough for making snow;
2. Less natural snow cover;
3. Faster ablation of snow;
4. Improvements in snow-making technology and operations;
5. The effect of cold air drainage on snow-making capacity at lower elevations;
6. The effect of topography and aspect on natural snow deposition; and
7. Possible water supply limitations and increased demand for water and power.
In our study, results are presented for the effects of factors 1, 2 and 3. The effect of factor 1 is
presented first, followed by results for the combination of factors 1, 2 and 3. The exclusion of
factors 4-7 are limitations of this study, outlined in more detail in the Conclusions.
Impact of greenhouse warming on potential snow-making hours and volume
Sub-zero wet-bulb temperatures are necessary for snow-making. Unlike dry-bulb temperature, wet-
bulb temperature is influenced by humidity. Snow-making managers at most resorts were able to
supply data showing the number of hours with wet-bulb temperatures in the range –2 to –12oC, in
0.1oC intervals, for May to September in various years between 1997 and 2002. Temperatures are
lower at higher elevations, as shown by the annual number of hours below -5oC in Figure 30, and
this has a significant effect on the apparent snow-making capacity of each resort. Hence it is
important to note the elevations at which the wet-bulb temperatures were measured (Table 7). Data
for Mt Perisher and Mt Buller relate to a much higher elevation (1720 metres) than data for other
resorts (e.g. 1340 metres at Mt Thredbo and Lake Mountain).
Wet-bulb warming scenarios for 2020 were derived from the output of ten climate models
(Hennessy and Whetton, 2001) and applied to the observed hourly wet-temperature data at each
resort. The warming was 0.2-0.9oC at Mt Hotham and Falls Creek, and 0.1-0.7oC at the other
resorts. These changes are less than those for dry-bulb temperature (Table 4) due to regional
changes in humidity associated with greenhouse warming. The average number of hours suitable for
snow-making declines by 2-7% for the low impact scenario and by 17-54% for the high impact
scenario (Figure 31).
29You can also read