Effects of Industrial Agriculture and Urbanization on Structure and Functional Organization of Macroinvertebrate of Coastal Streams in Cameroon
←
→
Page content transcription
If your browser does not render page correctly, please read the page content below
Journal of Water Resource and Protection, 2021, 13, 154-171
                                                                                              https://www.scirp.org/journal/jwarp
                                                                                                           ISSN Online: 1945-3108
                                                                                                             ISSN Print: 1945-3094

Effects of Industrial Agriculture and
Urbanization on Structure and Functional
Organization of Macroinvertebrate of
Coastal Streams in Cameroon

Fils Mamert Onana1*, Antoine Arfao Tamsa2, Siméon Tchakonte3, Ernest Koji4,
Nectaire Lié Nyamsi Tchatcho1, Yannick Nkouefuth Nfongmo1, Serge Hubet Zebaze Togouet2
1
  Department of Aquatic Ecosystems Management, Institute of Fisheries and Aquatic Sciences, University of Douala, Douala,
Cameroun
2
  Department of Animal Biology and Physiology, Faculty of Science, University of Yaoundé I, Yaoundé, Cameroon
3
  Microbiology and Biotechnology Laboratory, Saint Jerome Polytechnic Institute, Saint Jerome Catholic University of Douala,
Douala, Cameroon
4
  Department of Animal Biology and Physiology, Faculty of Sciences, University of Douala, Douala, Cameroon

How to cite this paper: Onana, F.M.,           Abstract
Tamsa, A.A., Tchakonte, S., Koji, E., Nyamsi
Tchatcho, N.L., Nkouefuth Nfongmo, Y.          The impact of land use changes on watercourses is poorly documented in
and Zebaze Togouet, S.H. (2021) Effects of     Cameroon. Therefore, this study examines the effects of agriculture and ur-
Industrial Agriculture and Urbanization on
                                               banization on water quality, the structure and functional organization of ma-
Structure and Functional Organization of
Macroinvertebrate of Coastal Streams in
                                               croinvertebrates of streams in the coastal zone of Cameroon. Nine sampling
Cameroon. Journal of Water Resource and        stations including three per catchment area with different land occupations
Protection, 13, 154-171.                       (agricultural, urban and forest) were selected. Benthic macroinvertebrates
https://doi.org/10.4236/jwarp.2021.132009
                                               were sampled monthly from February to July 2018 and the physicochemical
Received: January 7, 2021
                                               variables were measured simultaneously. The urban and agricultural streams
Accepted: February 23, 2021                    showed highly polluted waters with high nutrient and suspended matter con-
Published: February 26, 2021                   tent, whereas the forest stream waters are moderately polluted. In addition,
                                               the hierarchical ascending classification indicated a proximity in water quali-
Copyright © 2021 by author(s) and
Scientific Research Publishing Inc.
                                               ty between the agricultural and forest streams for which the main physico-
This work is licensed under the Creative       chemical variables did not vary significantly. With regards to macroinverte-
Commons Attribution International              brates, the forest watercourse is characterized by the proliferation of pollu-
License (CC BY 4.0).
                                               tion-sensitive taxa, high diversity indices and complex trophic structuring,
http://creativecommons.org/licenses/by/4.0/
                                               indicating its good ecological status. In contrast the urban watercourse, heav-
                Open Access
                                               ily polluted is characterized by low diversity indices reflecting a simplification
                                               of the structure of stands dominated by the pollution-tolerant collector-gatherer
                                               stands. The majority of biological indices and functional feeding groups were
                                               not significantly different between the agricultural and forest streams, sug-

DOI: 10.4236/jwarp.2021.132009 Feb. 26, 2021                     154                     Journal of Water Resource and Protection
F. M. Onana et al.

                                   gesting a less pronounced impact of agriculture on macroinvertebrates. Our
                                   results showed that, riparian vegetation even though constituted of perennial
                                   crops, reduces the effects of agricultural inputs on streams and promotes the
                                   establishment of diversified macroinvertebrate communities.

                                   Keywords
                                   Industrial Agriculture, Urbanization, Macroinvertebrates, Water Quality,
                                   Riparian Vegetation, Perennial Crops

                                 1. Introduction
                                 Changes in land occupation are manifested by the gradual replacement of natu-
                                 ral areas by agricultural areas [1], by the extension of artificial surfaces and asso-
                                 ciated infrastructures through urbanization [2]. These changes in land occupa-
                                 tion have consequences on aquatic ecosystems, such as habitat fragmentation
                                 and the resulting effects on the viability of animal and plant population evolving
                                 in these habitats [3].
                                    In industrialized countries, the impact of agriculture, urbanization, industria-
                                 lization and poor waste management on aquatic environments are well docu-
                                 mented [4] [5] [6] [7]. In Cameroon, on the other hand, studies are very patchy,
                                 with most of the work carried out so far having been limited to assessing the ef-
                                 fects of urbanization on streams [8]-[13]. So far, no study has been devoted to
                                 assessing the effects of industrial agriculture on the ecological integrity of streams.
                                 Therefore, the present study was tackled under a comparative approach, which
                                 makes it possible to distinguish between the effect of industrial agriculture on
                                 watercourses and the effect of urbanization.
                                    In this study, physico-chemical parameters of water and macro-invertebrates
                                 were used as indicators because of their predictable responses to changes in the
                                 catchment area [14] [15] [16]. Physico-chemical analyses provide information
                                 on the concentration of pollutants in a hydrosystem and thereby evaluating the
                                 environment capacity to host biocenosis. Among the freshwater biota, macroin-
                                 vertebrates are good tools for stream monitoring because they occupy a wide range
                                 of trophic levels and are pollution tolerant, providing solid information for the
                                 interpretation of cumulative effects due to exposure to pollutants and their se-
                                 dentary life style makes it possible to reflect the local conditions of the environ-
                                 ment, and to give a significant image of the quality of the habitat over time [17]
                                 [18].
                                    The main objective of this study is to assess the effects of industrial agriculture
                                 and urbanization on the assemblages and functional organization of macroin-
                                 vertebrates in two streams (Ekouma and Tongo’o Bassa) using a forest stream
                                 (Miana) in the same ecological region as a reference. The specific objectives of
                                 this study are: 1) to determine the effects of industrial agriculture and urbanisa-
                                 tion on stream water quality; 2) to identify the differences in macroinvertebrate

DOI: 10.4236/jwarp.2021.132009                         155                     Journal of Water Resource and Protection
F. M. Onana et al.
community structures using biological indices and functional feeding groups
between agricultural, urbanized and forest streams; 3) to establish relationships
between biological indicators, functional feeding groups and water quality.
2. Methods
2.1. Study Area and Sampling Stations
Investigations were carried out in three streams (Miana, Ekouma, Tongo’o Bas-
sa) located in the administrative zone of Littoral Region in Cameroon. Littoral
Region has an equatorial climate of Guinean type and Cameroonian coastal sub-
type, with an annual average precipitation of about 4000 mm [19]. This climate
has two main seasons, a long rainy season from March to November and short
dry season from December to February. Temperatures vary between 23˚C to
33.5˚C with a monthly average of about 28˚C [19]. Table 1 presents the charac-
teristics of sampling stations.
The Miana stream is located in the district of Yabassi. Yabassi is one of the
least populated districts in the Littoral region with 4.77 inhabitants per km2 and
85% of its surface area occupied by a dense primary forest composed of large
trees. The main human activity in Yabassi is subsistence farming. Three sam-
pling stations coded M1, M2 and M3 were positioned respectively in the upper,
middle and lower sections of the Miana stream (Figure 1).
The Ekouma stream, located in the Njombe-Penja district which covers a sur-
face area of about 260 km2. The population density in Njombe-Penja is 139.57
inhabitants per km2. The Ekouma watershed is mainly characterized by the
presence of industrial plantations such as the “Plantation du Haut Penja” (PHP)
which covers a surface area of about 70 Km2. These industries mainly grow des-
sert bananas, rubber, pineapple, flowers and white pepper and using chemical
Table 1. Characteristics of the sampling stations.
Catchment Altitude Width Dominant
Land use Latitude N Longitude E Depth (m)
attribute (m) (m) Substrate
Miana
M1 Forest 4˚33'35.20” 9˚58'05.46” 71 1.51 0.22 Sand, gravel
M2 Forest 4˚30'40.80” 9˚57'24.68” 34 3.44 0.33 Sand, Sand
M3 Forest 4˚30'14.05” 9˚54'16.86” 19 9.23 1.12 Sand, Mud
Ekouma
E1 Agriculture 4˚38'44.21” 9˚40'32.35” 154 2.87 1 Pebble, Mud
E2 Agriculture 4˚37'17.03” 9˚41'35.62” 111 4.78 1.4 Boulders, sand
E3 Agriculture 4˚36'10.26” 9˚41'11.90” 106 15.13 1.85 Sand, Mud
Tongo’o Bassa
T1 Urban 4˚2'42.50” 9˚43'47.11” 17 2.8 0.48 Sand, Mud
T2 Urban 4˚3'52.00” 9˚44'6.55” 11 12.5 0.81 Sand, Mud
T3 Urban 4˚5'13.96” 9˚43'21.90” 2 13.59 1.62 Sand, Mud
DOI: 10.4236/jwarp.2021.132009 156 Journal of Water Resource and ProtectionF. M. Onana et al.
Figure 1. Map of the study area showing the different sampling stations.
fertilizers and pesticides. In the Ekouma stream, three sampling stations were
also chosen (E1, E2 and E3) and located respectively in the upper, middle and
lower sections of the stream (Figure 1).
The Tongo’o Bassa is the largest watershed among the 12 that make up the
city of Douala. The harbor city of Douala is characterized by a fast and anarchis-
tic urbanization, an increasingly demography (3033.59 inhabitants per km2), and
an industrial sector in full expansion that generate wastewaters which are dis-
charged into streams without any preliminary treatment. The Tongo’o Bassa
catchment area is occupied by very unstructured neighbourhoods and is charac-
terized by the presence of several markets and chemical food processing, textile
and brewing industries. Three sampling stations were positioned on the Tongo’o
Bassa stream: T1, T2 and T3 located respectively in the upper, middle and lower
sections of the stream (Figure 1).
2.2. Physicochemical Analyses
Measurements of the physicochemical parameters were carried out monthly at
each site from February to July 2018, between 6:00am and 9:00am, following the
recommendations of Rodier et al. [20]. Physicochemical parameters like Water
temperature (T), pH, Electrical conductivity (EC) and Dissolved oxygen (DO)
were measured on site with a HANNA HI 9829 multi-parameter, because they
DOI: 10.4236/jwarp.2021.132009 157 Journal of Water Resource and ProtectionF. M. Onana et al.
are likely to change on transit to the laboratory. For physicochemical laboratory
analyses, after the sampling in a pre-clean double-capped polyethylene bottle of
250 ml, water was preserved in refrigerated conditions at 4˚C until variables
such as Turbidity (Turb), Suspended Solids (SS), Orthophosphate (PO4), Am-
monium (NH4) and Nitrite (NO2) were measured in the laboratory, using a
HACH DR/3900 spectrophotometer. Organic pollution was assessed using the
Organic Pollution Index (OPI) which was calculated based of three ion concen-
trations (NH4, NO2, and PO4) [21].
2.3. Macroinvertebrates Sampling, Metrics and Indices
Benthic macroinvertebrates were collected at each sampling station once a
month between February and July, following protocols described by Starck et al.
[22]. A long-handled kick net (30 cm × 30 cm side, 400-µm mesh size and 45 cm
of depth) was used in all the microhabitats (leaf packs, branches, macrophyte
beds, sand, mud, pebble and rafts) of each sampling station. At each sampling
station, macroinvertebrates were collected over a surface area of 6 m2 by making
20 drags of the kick net in all available micro-habitats, each drag consisted of
pulling the net over a distance of approximately 1 m, i.e. a surface area of 0.3 m2
for each drag. The collected macroinvertebrates were fixed with 70% ethanol and
preserved in the plastic bottles. In laboratory, for each station, the animals were
identified to the lowest possible taxonomic level under a stereomicroscope, with
the use of appropriate taxonomic keys proposed by De Moor et al. [23], De
Moor et al. [24], Tachet et al. [25] and Tachet et al. [26].
2.4. Data Analyses
The ecological integrity of the three studied streams was assessed by calculating
18 indices on the basis on abundances and taxonomic richness of macroinverte-
brates, i.e.: 11 community structure indices, 5 functional feeding groups (FFG)
and 2 diversity indices.
The community structure indices used in this study were: total number of in-
dividuals (TA); total taxa richness (S); Ephemeroptera-Plecoptera-Trichoptera
(S-EPT), Plecoptera-Odonata-Ephemeroptera-Trichoptera (S-POET) and Dip-
tera (S-Dip) taxa richness; relative EPT abundance (%-EPT); relative abundance
of Insecta (%-Ins); relative abundance of Chironomidae (%-Chir), relative ab-
undance of Non Diptera Insecta (%-N-Dip-Ins), relative abundance of Diptera
(%-Dip) and relative abundance of Oligochaeta (%-Olig).
Concerning FFG, we used the classifications made by Mandaville [27], Cum-
mins et al. [28] and Thorp and Covich [29] based on the mechanisms of obtain-
ing food and the particle size of the food eaten to assign each organism identified
to one of the five functional feeding groups (FFG): shredders (shr), scrapers
(scr), collector-gatherers (c-g), collectors-filterers (c-f) and predators (prd). This
functional approach examines changes in the trophic structure of the macroin-
vertebrate community of each ecological section of the watercourses.
DOI: 10.4236/jwarp.2021.132009 158 Journal of Water Resource and ProtectionF. M. Onana et al.
Lastly, two biodiversity indices (Shannon-Weaver’s diversity index and the
Piélou’s evenness) were calculated, so as to highlight the numerical importance
of taxa.
Hierarchical Cluster Analysis (HCA) was used to classify the sampling sta-
tions according to the physicochemical water quality of the 54 water samples
collected during the 6-month study period. The physicochemical variables of the
different clusters obtained by the HCA were compared using the Kruskal-Wallis
test, after a study of the normality of the data by the Shapiro Wilk test. Assuming
that abiotic water variables structure aquatic stands, statistical differences be-
tween macroinvertebrate indices of clusters identified by HCA were investigated
using the Kruskal-Wallis test, after a study of the normality of the data by the
Shapiro Wilk test. Potential links between physicochemical parameters and ma-
croinvertebrate indices were searched using Pearson correlation test and Ca-
nonical Redundancy Analysis (RDA). The statistical analyses were carried out
using the XLSTAT 2014 software.
3. Results
3.1. Water Quality
The HCA grouped the 54 water samples collected during the study into 3 clus-
ters based on the physicochemical variables (Figure 2). Cluster I is composed of
the 18 samples collected from the Tongo’o Bassa urban stream. Cluster II is
made up of the 18 water samples from the forest stream Miana and cluster III is
made up of the 18 water samples from the agricultural stream Ekouma.
Cluster II (Miana) groups globally the least polluted stations (moderate or-
ganic pollution) with less warm, well oxygenated, low mineralization and low
organic matter (higher OPI) waters. Temperature and electrical conductivity
Figure 2. Classification of the sampling sites according to the physicochemical quality of the wa-
ter of the 54 water samples collected during the 6 months of the study through a hierarchical
cluster analysis, using the Bray-Curtis dissimilarity method (fe, ma, ap, my, ju and jl represent
respectively sampling months February, March, April May, June and July).
DOI: 10.4236/jwarp.2021.132009 159 Journal of Water Resource and ProtectionF. M. Onana et al.
were significantly lower in Miana, while dissolved oxygen was significantly higher
(Table 2). Cluster I, which comprises stations of the Tongo’o Bassa urban wa-
tercourse, had heavily polluted waters, with high turbidity, high organic matter
loadings (lowest OPI) and low dissolved oxygen concentrations. Thus, values for
turbidity, suspended solids, ammonium and orthophosphates are significantly
higher in Tongo’o Bassa than in Miana and Ekouma (Table 2). Cluster III, which
includes all the samples from the Ekouma agricultural stream, shows waters with
significantly higher mineralization and an intermediate quality between that of
the Miana and Tongo’o Bassa. In addition, the Kruskall-Wallis test revealed a
certain proximity of water quality between the forest stream Miana and the
agricultural stream Ekouma (Table 2).
3.2. Macroinvertebrates Communities’ Structure
A total of 2562 macroinvertebrate individuals were collected from the three
streams studied. They were divided into 50 taxa and grouped in 3 phyla (37
Arthropods, 7 Annelids, 6 Molluscs). 18 taxa have been identified at the species
level, 28 taxa at the genus level and 4 taxa at the family level. The total taxonom-
ic richness during the study in the Miana, Ekouma and Tongo’o Bassa streams
were 16, 29 and 28 taxa respectively. In the Ekouma agricultural stream, no EPT
taxa were inventoried, whereas in the Tongo’o Bassa and Miana streams, the
number of EPT families recorded was 1 and 8 respectively. Thus, S-EPT is sig-
nificantly higher in the forest stream Miana (Table 3).
Similarly, S-POET was significantly higher in Miana than in Tongo’o Bassa and
Ekouma. S-EPT and S-POET did not differ significantly between Tongo’o Bassa
and the Ekouma streams (Table 3). S-Dip, was significantly higher in Tongo’o
Bassa, but does not differ statistically between Miana and Ekouma (Table 3).
Table 2. The status of water quality for cluster I, II and III derived from HCA.
Physicochemical Clusters
K-W
parameters I (Tongo’o bassa) II (Miana) III (Ekouma)
T 26.92 ± 2.10a 19.82 ± 1.26b 27.24 ± 0.73c,a 35.40
pH 6.76 ± 0.2a 6.93 ± 0.49b,a 7.68 ± 0.49c 23.31
DO 52.00 ± 10.26a 64.11 ± 1.63b 26.77 ± 25.51c,a 20.66
EC 341.46 ± 132.53 a
23.04 ± 3.27 b
5381 ± 1207.71 c
47.13
SS 28.39 ± 28.50 a
6.72 ± 6.78 b
9.78 ± 7.13 c,b
18.69
Turb 34.28 ± 25.19a 2.61 ± 3.31b 9.83 ± 10.35c,b 25.31
NO2 1.19 ± 1.98a 0.02 ± 0.02b 0.66 ± 0.34c,a 23.01
PO4 4.49 ± 5.16 a
0.79 ± 0.68 b
0.17 ± 0.13 c,b
25.47
NH4 4.05 ± 2.11 a
0.2 ± 0.16 b
0.1 ± 0.15 c,b
37.40
IPO 2.06 ± 0.72a 3.41 ± 0.59b 2.96 ± 0.44c,b 25.60
Values represent mean ± standard deviation. a,b,cDifferences among the three clusters as tested with the
Kruskal-Wallis test. Values with different superscripts indicate significant differences. p < 0.05.
DOI: 10.4236/jwarp.2021.132009 160 Journal of Water Resource and ProtectionF. M. Onana et al.
Table 3. Macroinvertebrate indices for cluster I, II and III derived from HCA analysis.
Values represent mean ± standard deviation. Kruskal-Wallis (K-W) tests were used to
evaluate differences among the three clusters.
Cluster
Metric K-W
I (Tongo’o Bassa) II (Miana) III (Ekouma)
Community structure Indices
S 6.5 ± 2.36a 7.44 ± 1.65b,a 5.11 ± 1.81c,a 11.65
S-EPT 0.06 ± 0.24 a
1.67 ± 1.19 b
0 c,a
33.58
S-POET 0.39 ± 0.61 a
2.67 ± 1.57 b
1.06 ± 0.73 c,a
23.06
S-Dip 1.44 ± 0.62 a
0.06 ± 0.24 b
0 c,b
47.82
TA 77.33 ± 45.66a 28.28 ± 12.36b 36.72 ± 15.98c,b 20.91
%-EPT 0.19 ± 0.83a 17.17 ± 19.31b 0c,a 33.83
%-Ins 50.55 ± 25.89a 48.41 ± 20.80b,a 19.19 ± 20.29c 18.60
%-N-Dip-Ins 10.01 ± 14.81 a
48.32 ± 20.69 b
19.19 ± 20.29 c,a
24.32
%-Dip 40.54 ± 27.31 a
0.09 ± 0.39 b
0 c,b
48.61
%-Chir 38.81 ± 27.49 a
0 b
0 c,b
50.22
%-Olig 8.04 ± 11.34a 0.09 ± 0.39b 0c,b 20.94
Diversity indices
H' 1.83 ± 0.77a 2.29 ± 0.39b 1.63 ± 0.47c,a 13.72
J 0.68 ± 0.2 0.8 ± 0.10 0.73 ± 0.13
Functional feeding groups
%-Shredders 1.53 ± 2.93a 20.91 ± 13.03b 37.07 ± 31.38c,b 18.98
%-Scrapers 1.3 ± 2.95a 22.64 ± 26.57b 36.06 ± 39.57c,b 16.99
%-Collectors-gatherers 86.06 ± 16.33 a
17.01 ± 18.50 b
5.91 ± 10.72 c,b
37.59
%-Collectors-filterers 0.77 ± 1.77 0.28 ± 1.18 2.12 ± 4.35
%-Predators 10.35 ± 12.07 a
39.16 ± 19.58 b
18.69 ± 19.94c,a 20.43
Values with different superscripts (a, b, c) indicate significant differences. p < 0.05.
In terms of abundance, the urban Tongo’o Bassa stream has the highest total
abundance (1392 individuals), with a strong proliferation of pollution-tolerant
taxa such as Chironomus sp. (Chironomidae; 41.31%) and Physa acuta (Physi-
dae; 28.88%). In the agricultural stream Ekouma (661 individuals), Caridina af-
ricana (Atyidae; 36.16%), Biomphalaria pfeifferi (Planorbidae; 16.49%), Mela-
noides tuberculata (Melaniidae; 12.71%) and Cleopatra sp. (Thiaridae; 10.29%)
were the dominant taxa. In the forest stream Miana (509 individuals), Cleopatra
sp. (Thiaridae; 23.38%), Lymnaea natalensis (Lymnaeidae; 12.57%), Caridina af-
ricana (Atyidae; 11.59%) and Neoperla spio (Perlidae; 10.81%) constituted the
main part of the stand. %-EPT and %-N-Dip-Ins are statistically higher in the
forest stream Miana than in the anthropized Tongo’o Bassa and agricultural
stream Ekouma (Table 3). In contrast, %-Chir, %-Olig and %-Dip were signifi-
cantly higher in the urban Tongo’o Bassa stream, but did not differ statistically
DOI: 10.4236/jwarp.2021.132009 161 Journal of Water Resource and ProtectionF. M. Onana et al.
between the Miana and the Ekouma (Table 3). In addition, Chironomidae and
Oligochaeta were not recorded in the agricultural stream Ekouma. Similarly, no
Chironomidae were recorded in the forest stream Miana.
The Shannon and Weaver diversity index (H’) was significantly higher in the
Miana forested stream (2.29 ± 0.39 bits/ind.), whereas in the Ekouma agricultur-
al stream, lowest values of this index were noted (1.64 ± 0.47 bits/ind) (Table 3).
In the urban stream Tongo’o Bassa, the H’ value is 1.83 ± 0.77 bits/ind. Even
though not varying statistically from one stream to another, the J index revealed
a better distribution of individuals within the stands of the Miana forest stream
(0.80 ± 0.10). J values in the Ekouma (0.73 ± 0.13) and Tongo’o Bassa streams
(0.69 ± 0.20) (Table 3), reflected a poorer distribution of individuals within the
taxa of these two anthropised streams.
3.3. Distribution of FFG According to the Longitudinal Zonation of
Watercourses
The contributions of FFG to the macroinvertebrate community as a function of
the longitudinal zonation (upper, middle and lower streams) of the Miana,
Ekouma and Tongo’o Bassa streams are shown in Figure 3. In each of the sec-
tions, a simplification of the trophic structure of macroinvertebrates was ob-
served with increasing pollution. In the superior section, if at M1 (Miana),
shredders, scrapers, collector-gatherers and predators can be distinguished with
Figure 3. Relative contribution of trophic functional groups to benthic macroinvertebrate
communities as a function of the longitudinal zonation of the rivers studied.
DOI: 10.4236/jwarp.2021.132009 162 Journal of Water Resource and ProtectionF. M. Onana et al.
relative abundances of 21.39% ± 15.92%, 19.61% ± 25.02%, 18.70% ± 22.81%
and 40.30% ± 19.66% respectively, in stations E1 (Ekouma) and T1 (Tongo’o
Bassa) one trophic group is largely preponderant. These involve scrapers (89.25%
± 10.76%) at station E1 and collector-gatherers (94.14% ± 70%) at station T1. In
their middle section, the Miana (M2) and Ekouma (E2) are dominated respec-
tively by predators (44.55% ± 22.49%) and shredders (58.40% ± 20.37%). Other
FFG can be distinguished in these two streams. Involving shredders (16.35% ±
10.33%), scrapers (19.47% ± 25.40%) and collector-gatherers (18.80% ± 17.76%)
in the Miana, while in the Ekouma they are scrapers (13.17% ± 7.47%), collec-
tor-gatherers (8.33% ± 17.04%) and predators (19.70% ± 12.37%). Station T2 of
the middle Tongo’o Bassa River is largely dominated by collector-gatherers (88.70%
± 9.69%). In the lower sections, in the Miana station (M3), individuals are mainly
distributed in four FFG with relatively similar abundances: shredders (24.99% ±
13.09%), scrapers (28.85% ± 32.56%), collector-gatherers (13.52% ± 17.48%) and
predators (32.64% ± 18.01%). At E3 (Ekouma), shredders (52.81% ± 21.00%)
and predators (32.90% ± 26.25%) dominate the macroinvertebrates, while at T3
(Tongo’o Bassa), collector-gatherers (75.34% ± 22.93%) dominate. In the three
land-use catchment areas, collector-gatherers are essentially dominated by Lym-
naea natalensis (Lymnaeidae), Physa acuta (Physidae), and Chironomus sp. (Chi-
ronomidae), while the shredders are dominated mainly by Caridina africana
(Atyidae) and predators are mainly composed of Odonata (Bratinopyga sp., Icti-
nogomphus ferox, Somatochlora pro parte, Cordulegaster sp. Coenagrion pro
parte) and Hemiptera (Gerris sp., Ranatra linearis, Ilyocoris cimicoides, Plea sp.,
Rhagovelia reitteri).
Overall, collector-gatherers dominated significantly in Tongo’o Bassa urban
stream where they represent 86.06% ± 16.33% of benthic macroinvertebrates
(Table 3). The scrapers and shredders comprised a significantly greater percen-
tage at Ekouma agricultural stream than in Tongo’o Bassa urban stream, while
predators, scrapers and shredders had a significantly greater percentage at Miana
than in Tongo’o Bassa stream (Table 3).
3.4. Relationships between Water Quality and Macroinvertebrate
Metrics
The main correlations between physicochemical parameters and macroinverte-
brate indices are summarized in Table 4.
DO was positively and significantly (p < 0.01) correlated with S, S-EPT,
S-POET, %-EPT and %-Ins. NH4 was negatively and significantly (p < 0.01) linked
with S-EPT, S-POET, %-N-Dip-Ins, %-Shr, %-scr and %-prd, but positively and
significantly (p < 0.01) correlated with TA, S-Dip, %-Chir, %-Olig, %-Dip
and %-c-g. The same, NO2 showed negative and significant (p < 0.05) correla-
tions with S-EPT, but positive and significant (p < 0.01) correlations with
S-Dip, %-Chir and %-Dip. PO4 only showed positive and significant (p < 0.01)
correlations with S-Dip, %-Chir, %-Olig, %-Dip and %-c-g. Turbidity showed
negative and significant correlations with indicators of good water quality such
DOI: 10.4236/jwarp.2021.132009 163 Journal of Water Resource and ProtectionF. M. Onana et al.
Table 4. Pearson’s correlation coefficient between the physicochemical variables and biological metrics. Significant correlation (*:
p < 0.05; **: p < 0.01) are indicated by asterisk.
Variables T pH DO EC SS Tur NO2 PO4 NH4 OPI
S −0.281* −0.129 0.355** −0.423** 0.086 0.174 −0.033 0.087 0.041 0.039
TA 0.329* −0.180 0.060 −0.175 0.117 0.330* 0.250 0.218 0.597** −0.455**
H’ −0.312* −0.199 0.267 −0.319* 0.006 0.024 −0.148 0.014 −0.078 0.203
S-EPT −0.722** −0.069 0.402** −0.412** −0.194 −0.318* −0.277* −0.116 −0.300* 0.393**
S-POET −0.668** 0.127 0.271* −0.227 −0.296* −0.364** −0.251 −0.201 −0.437** 0.461**
S-Dip 0.383** −0.380** 0.108 −0.403** 0.632** 0.781** 0.293* 0.471** 0.679* −0.577**
%-EPT −0.581** −0.070 0.324* −0.318* −0.135 −0.247 −0.214 −0.084 −0.233 0.265
%-Ins −0.282* −0.358** 0.332* −0.579** 0.114 0.061 0.113 0.173 0.244 −0.137
%-Chir 0.245 −0.409** 0.173 −0.341* 0.365** 0.392** 0.349** 0.387** 0.621** −0.542**
%-N-Dip-Ins −0.557** 0.035 0.183 −0.269* −0.277* −0.361** −0.235 −0.216 −0.372** 0.405**
%-Olig 0.211 −0.169 0.023 −0.218 0.214 0.303* 0.160 0.386** 0.423** −0.399**
%-Dip 0.256 −0.417** 0.170 −0.348** 0.399** 0.426** 0.356** 0.400** 0.632** −0.551**
%-shr 0.028 0.589** −0.183 0.326* −0.209 −0.206 −0.130 −0.323* −0.470** 0.259
%-scr −0.097 0.063 −0.204 0.497** −0.228 −0.335* −0.115 −0.257 −0.373** 0.336
%-c-g 0.283* −0.457** 0.216 −0.500** 0.415** 0.545** 0.265 0.494** 0.782** −0.619**
%-c-f 0.164 0.204 0.057 0.304* 0.210 0.262 −0.019 0.039 −0.146 0.010
%-prd −0.438** 0.042 0.106 −0.217 −0.221 −0.315 −0.170 −0.169 −0.337* 0.353**
as S-EPT (p < 0.05), S-POET (p < 0.01) and %-N-Dip-Ins (p < 0.01), while the correla-
tions between turbidity and polluted water indicators (S-Dip, %-Chir, %-Olig, %-Dip
and %-c-g) were positive and significant (p < 0.01). At the opposite, OPI, showed
positive and significant (p < 0.01) correlations with indicators of good water qual-
ity such as S-EPT, S-POET and %-N-Dip-Ins, but negative and significant (p <
0.01) correlation with polluted water indicators (S-Dip, %-Chir, %-Olig, %-Dip
and %-c-g). Except for S-EPT and scr, SS showed significant correlations with the
same metrics as turbidity. The temperature, negatively and significantly corre-
lated with S (p < 0.05); H’ (p < 0.05), S-EPT (p < 0.01), S-POET (p < 0.01), %-EPT
(p < 0.01), %-Ins (p < 0.05), %-N-Dip-Ins (p < 0.01) and %-prd (p < 0.01), was
positively and significantly correlated with TA (p < 0.05), S-Dip (p < 0.01)
and %-c-g (p < 0.05). Except for shr, c-f and scr with which EC is positively and
significantly correlated, all other significant correlations established between EC
and macroinvertebrate metrics were negative.
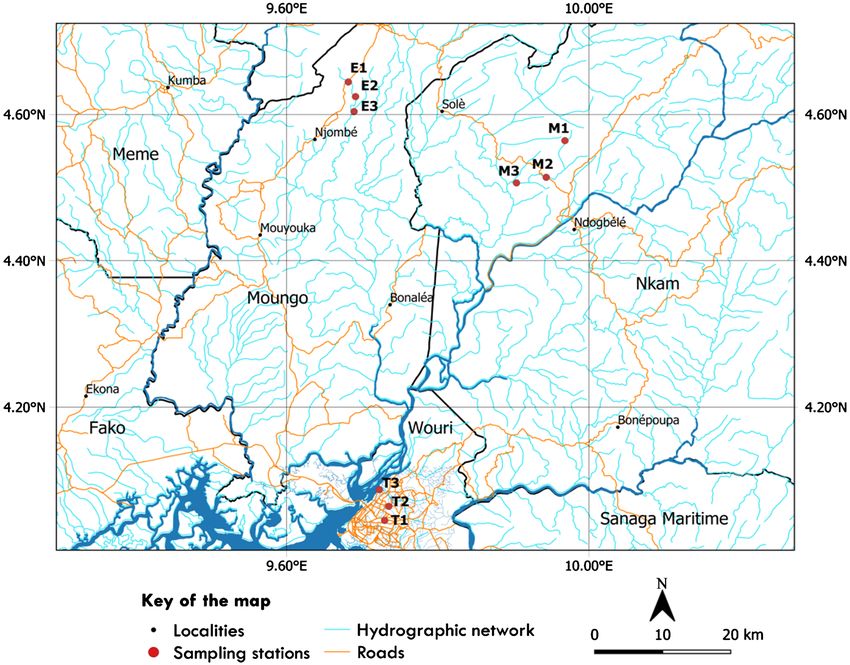
The Redundancy analysis results (Figure 4) revealed that the relationships
between the macroinvertebrate indices and the physicochemical variables of the
sampled stations are explained by the first two axes (F1 = 69.93%; F2 = 17.48%)
which accounts for 87.41% of the information (Figure 4). According to the first
axis (F1), the Tongo’o Bassa stations are characterized by high concentrations of
ammonium, orthophosphates and high turbidity, which are favourable for the
DOI: 10.4236/jwarp.2021.132009 164 Journal of Water Resource and ProtectionF. M. Onana et al.
Figure 4. Redundancy analysis showing the relationships between macroinvertebrate
metrics and environmental variables: see Figure 2 and “Materials and methods” section
for abbreviations.
proliferation of Branchiura sowerbyi (Tubificidae), Chironomus sp. (Chirono-
midae), other Diptera and all the collector-gatherers taxa, mainly Physa acuta,
Lymnaea natalensis and Sphaerium capense (Figure 4). Axis F2 shows that the
proliferation of Ephemeroptera, Plecoptera, Trichoptera, Odonata and other
non-Diptera Insects in the waters of the Miana forest stream is associated with
their high DO and OPI values (low organic matter content) (Figure 4). Converse-
ly, on the same axis and on the negative side, scrappers and collector-filterers seem
to multiply in the waters of Ekouma, which are high electrical conductivity
(Figure 4).
4. Discussion
4.1. Water Quality
The physico-chemical analyses indicated little difference between the water
quality of the Ekouma agricultural stream and that of the Miana forest stream.
This small difference would be linked to the presence of vegetation in the cat-
chment areas of the two streams. Indeed, if in the Miana watershed a primary
forest is observed, in the Ekouma watershed, the vegetation is linked to the
presence of perennial crops. Such crops do not induce drastic changes in water
quality, but like all riparian forests, they play an important role in the retention
of pollutants, but less than that of primary forests. Riparian forests limit the ex-
posure of watercourses to solar radiation, reduce soil erosion, and reduce the
amount of nutrients and organic matter reaching the watercourses [30]. Gerth et
al. [7], working in agricultural areas in Oregon (USA), showed that perennial
plants reduce the effects of agriculture on streams. In contrast, the impact of ur-
DOI: 10.4236/jwarp.2021.132009 165 Journal of Water Resource and ProtectionF. M. Onana et al.
banisation on the Tongo’o Bassa urban watercourse is pronounced. The lack of
vegetation in the Tongo’o Bassa catchment area, coupled with the discharge of
untreated domestic, municipal and industrial wastewater seems to be responsible
for the high concentrations of suspended solids, nutrients and organic matter.
Hepp et al. [31], Tchakonté et al. [9] and Tchakonté et al. [10], in their studies
carried out respectively in urban rivers in Brazil and Cameroon, implied that the
same discharges changes the water quality in urban streams.
4.2. Community Structure and Influence of Land Usage Types
The forest stream Miana showed the highest diversity indices (H’ and J) and thus
a better distribution of individuals within taxa. In contrast, the anthropised
streams of Tongo’o Bassa and Ekouma showed lower diversity indices, indicat-
ing stands dominated by a small number of taxa. It is known that the destruction
of riparian vegetation causes sediment discharge to watercourses, thus modify-
ing their morphology, and the available substrates become more unstable and
less complex, leading to a decrease in habitat diversity and trophic resources [15]
[32]. For example, impacts in the urban Tongo’o Bassa stream, whose catchment
area has been artificialized by the construction of urban infrastructures, are
more exacerbated by various pollutants that are drained directly into the stream
through runoffs. In the Ekouma stream, the impact of industrial agriculture on
macroinvertebrates is less important because the perennial crops that occupy its
watershed help to retain pollutants linked to the use of fertilizers and pesticides.
Couceiro et al. [33] showed that deforestation and water pollution causes reduc-
tion in taxonomic abundance and a simplification of invertebrate communities.
The results of the present study are similar to those obtained for other streams in
the Araucanía Region, Chile [34] and for temporary streams in Oregon, USA
[7].
The good ecological condition of the forest stream Miana is also highlighted
by the preponderance of pollution-intolerant taxa such as EPT orders and
non-Diptera Insects. Their pre-eminence in forest streams would be associated
with the good oxygenation of their waters; hence, the positive and significant
correlations between S-EPT, %-EPT, %-N-Dip-Ins and the high concentrations
of dissolved oxygen. Our results corroborate those of Rios and Bailey [15] who
showed that riparian vegetation increases the diversity of EPT taxa. However,
the deterioration of the habitat quality of anthropised streams is demonstrated
by the near absence of EPT taxa and Non-Diptera Insects, which are replaced by
Chironomus sp. and Physa acuta in Tongo’o Bassa, and by Caridina africana,
Melanoides tuberculata and Biomphalaria pfeifferi in the agricultural stream
Ekouma. In fact, several studies have highlighted the role of the EPT orders as
bioindicators of the good health of lotic hydrosystems [9] [35] [36], because the
taxonomic richness and abundances of these animals decreases drastically in
watersheds where urban pollutions are observed. In Tongo’o Bassa, high densi-
ties of Chironomus sp. and Physa acuta have been regarded as excellent bioindi-
DOI: 10.4236/jwarp.2021.132009 166 Journal of Water Resource and ProtectionF. M. Onana et al.
cators of poor water quality, in which the increase in their density is in response
to organic enrichment by anthropic actions [25] [37]. Positive and significant
correlations have thus been obtained between %-Chir and organic matter indi-
cators (Turb, NO2, PO4, and NH4). However, in the Ekouma stream, the domi-
nant Caridina africana, Melanoides tuberculata and Biomphalaria pfeifferi are
not classified in the literature as either tolerant or intolerant taxa [38]. Manda-
ville [27] give them an intermediate tolerance, between tolerant and intolerant
taxa. Our results are in line with those of Hepp et al. [31], who describe interme-
diate models of macroinvertebrate communities in Brazilian agricultural streams,
which fall between forest and urban river models.
Dosskey et al. [39] showed that, changes in ripaprian vegetation alter the
amount of organic material entering aquatic systems, subsequently modifying
the trophic structure of aquatic food webs. Thus, organic pollution derived from
anthropogenic activities and the absence of riparian vegetation would be respon-
sible for the marked alteration of the trophic structure of macroinvertebrate
communities in the urban Tongo’o Bassa stream, where collector-gatherers, what-
ever the ecological section considered, are clearly favoured to the detriment of
shredders, scrappers and predators that dominate in the Ekouma agricultural
and the Miana forest streams. Indeed, collector-gatherers, which are predomi-
nant in Tongo’o Bassa, generally proliferate in aquatic environments with high
loads of decomposing organic matter [28]. The relatively high abundance of
shredders and predators is a typical characteristic of streams within forested re-
gions [16] [40]. The variances between the trophic structure of Tongo’o Bassa
and the Miana forest stream revealed a clear disturbance in the functioning of
this urban watercourse. On the other hand, the trophic structures of the Miana
and Ekouma streams differ slightly, which shows a lesser alteration of the Ekouma
agricultural watercourse. Several studies have highlighted ruptures in the eco-
logical discontinuity of benthic invertebrates along the longitudinal profile of
streams by human activities [16] [41] [42] [43].
5. Conclusions
Ecological monitoring of forest, urban and agricultural streams has contributed
to the understanding of the effects of different land uses on the biodiversity in
lotic ecosystems of Cameroon. Physicochemical analyses have shown that, the
waters of the urban stream are highly polluted with high concentrations of NH4,
PO4, NO3 and SS. As regards the agricultural stream, although its waters are also
highly loaded in organic matter, most of the values of the organic pollution pa-
rameters (Turb, OPI, SS, NH4, PO4) of this stream did not vary significantly
from the values of the forest stream, whose waters are moderately loaded in or-
ganic matter. The macroinvertebrate communities of the forest stream are more
diversified (H’ = 2.29 ± 0.39; J = 0.8 ± 0.10), while that of agricultural (H’ = 1.83
± 0.77; J = 0.68 ± 0.2) and urban (H’ = 1.63 ± 0.47; J = 0.73 ± 0.13) streams
communities are less diversified. As regard to FFG, forest and agricultural streams
DOI: 10.4236/jwarp.2021.132009 167 Journal of Water Resource and ProtectionF. M. Onana et al.
were dominated by 4 and 3 FFG respectively out of the 5 groups defined in this
work. In the urban watercourse, only one FFG is widely represented with 86.06%
of the individuals harvested.
Finally, the results of our study showed that the primary vegetation seems to
support a good ecological status of forest streams with rich and diverse stands
presenting a better distribution of individuals within taxa. In contrast, urban and
agricultural impacts affect water quality and macroinvertebrates by reducing their
diversity and simplifying their organizational and functional structures. However,
while the impact of urbanisation on macroinvertebrates and water quality is more
pronounced due to the artificialisation of watersheds that are completely defo-
rested, the impact of agriculture on water quality and macroinvertebrates is less
due to the presence of vegetation consisting of perennial crops that reduce the
quantity of pollutants entering the watercourse.
Acknowledgements
The authors would like to thank the Department of Animal Biology and Physi-
ology of the University of Douala in which the macroinvertebrate identifications
were carried out. The authors would also like to thank the Cameroonian gov-
ernment, which partially financed this study through the special fund for the
modernization of university research for the year 2018.
Conflicts of Interest
The authors declare no conflicts of interest regarding the publication of this pa-
per.
References
[1] Lepers, E., Lambin, E.F., Janetos, A.C., Defries, R., Achard, F., Ramankutty, N. and
Scholes, R.J. (2005) A Synthesis of Information on Rapid Land-Cover Change for
the Period 1981-2000. BioScience, 55, 115-124.
https://doi.org/10.1641/0006-3568(2005)055[0115:ASOIOR]2.0.CO;2
[2] Vandevelde, J.C. (2014) Les instruments d’évaluation des impacts sur la biodiver-
sité: Entre aménagement du territoire et conservation: Le cas des grands projets
ferroviaires. Doctorat Thesis, University of Orleans, Orleans.
[3] Fahrig, L. (2003) Effects of Habitat Fragmentation on Biodiversity. Annual Review
of Ecology, Evolution and Systematics, 34, 487-515.
https://doi.org/10.1146/annurev.ecolsys.34.011802.132419
[4] Hepp, L.U. and Santos, S. (2009) Benthic Communities of Streams Related to Dif-
ferent Land Uses in a Hydrographic Basin in Southern Brazil. Environmental Mon-
itoring and Assessment, 157, 305-318. https://doi.org/10.1007/s10661-008-0536-7
[5] Rasmussen, J.J., Baattrup-Pedersen, A., Wiberg-Larsen, P. and Kronvang, B. (2011)
Buffer Strip Width and Agricultural Pesticide Contamination in Danish Lowland
Streams: Implications for Stream and Riparian Management. Ecological Engineer-
ing, 37, 1990-1997. https://doi.org/10.1016/j.ecoleng.2011.08.016
[6] Moraes, A.B., Wilhelm, A.E., Boelter, T., Stenert, C., Schulz, U.H. and Maltchik, L.
(2014) Reduced Riparian Zone width Compromises Aquatic Macroinvertebrate Com-
DOI: 10.4236/jwarp.2021.132009 168 Journal of Water Resource and ProtectionF. M. Onana et al.
munities in Streams of Southern Brazil. Environmental Monitoring and Assess-
ment, 186, 7063-7074. https://doi.org/10.1007/s10661-014-3911-6
[7] Gerth, W.J., Judith, L. and Giannico, G.R. (2017) Agricultural Land Use and Ma-
croinvertebrate Assemblages in Lowland Temporary Streams of the Willamette Val-
ley, Oregon, USA. Agriculture, Ecosystems and Environment, 236, 154-165.
https://doi.org/10.1016/j.agee.2016.11.010
[8] Foto Menbohan, S., Koji, E., Ajeagah, G.A., Bilong Bilong, C.F. and Njiné, T. (2012)
Impact of Dam Construction on the Diversity of Benthic Macroinvertebrates Com-
munity in a Periurban Stream in Cameroon. International Journal of Biosciences,
11, 137-145.
[9] Tchakonté, S., Ajeagah, G.A., Diomande, D., Camara, I.A. and Ngassam, P. (2014)
Diversity, Dynamic and Ecology of Freshwater Snails Related to Environmental
Factors in Urban and Suburban Streams in Douala-Cameroon (Central Africa).
Aquatic Ecology, 48, 379-395. https://doi.org/10.1007/s10452-014-9491-2
[10] Tchakonté, S., Ajeagah G.A., Camara, A.I., Diomandé, D., Nyamsi Tchatcho, N.L.
and Ngassam, P. (2015) Impact of Urbanization on Aquatic Insect Assemblages in
the Coastal Zone of Cameroon: The Use of Biotraits and Indicator Taxa to Assess
Environmental Pollution. Hydrobiologia, 755, 123-144.
https://doi.org/10.1007/s10750-015-2221-5
[11] Onana, F.M., Zébazé Togouet, S.H., Koji, E., Nyamsi Tchatcho, N.L. and Tcha-
konté, S. (2016) Influence of Municipal and Industrial Pollution on the Diversity
and the Structure of Benthic Macro-Invertebrates Community of an Urban River in
Douala, Cameroon. Journal of Biodiversity and Environmental Sciences, 8, 120-133.
[12] Koji, E., Noah Ewoti, O.V., Onana, F.M., Tchakonté, S., Lontsi Djimeli, C., Tamsa
Arfao, A., Bricheux, G., Sime-Ngando, T. and Nola, M. (2017) Influence of Anth-
ropogenic Pollution on the Abundance Dynamics of Some Freshwater Invertebrates
in the Coastal Area of Cameroon. Journal of Environmental Protection, 8, 810-829.
https://doi.org/10.4236/jep.2017.87051
[13] Onana, F.M., Zebaze Togouet, S.H., Tamsa, A.A., Nyamsi Tchatcho, N.L., Tcha-
konte, S., Koji, E., Yemtsa Yemeli, A.W. and Mouto Makong, A.N.S. (2019) Com-
paring Freshwater Benthic Macroinvertebrate Communities in Forest and Urban
Streams of the Coastal Ecological Region of Cameroon. Open Journal of Ecology, 9,
521-537. https://doi.org/10.4236/oje.2019.912034
[14] Weigel, B.M., Lyons, J., Paine, L.K., Dodson, S.I. and Undersander, D.J. (2000) Us-
ing Stream Macroinvertebrates to Compare Riparian Land Use Practices on Cattle
Farms in Southwestern Wisconsin. Journal of Freshwater Ecology, 15, 93-106.
https://doi.org/10.1080/02705060.2000.9663725
[15] Rios, S.L. and Bailey, R.C. (2006) Relationship between Riparian Vegetation and
Stream Benthic Communities at Three Spatial Scales. Hydrobiologia, 553, 153-160.
https://doi.org/10.1007/s10750-005-0868-z
[16] Zhang, Y., Zhao, R., Kong, W., Geng, S., Bentsen, C.N. and Qu, X. (2013) Relation-
ships between Macroinvertebrate Communities and Land Use Types within Differ-
ent Riparian Widths in Three Headwater Streams of Taizi River, China. Journal of
Freshwater Ecology, 28, 307-328. https://doi.org/10.1080/02705060.2013.779941
[17] Barbour, M.T., Gerritsen, J., Snyder, B.D. and Stribling, J.B. (1999) Rapid Bioas-
sessment Protocols for Use in Stream and Wadeable Rivers: Periphyton, Benthic
Macroinvertebrates and Fish. U.S. Environmental Protection Agency, Washington
DC.
[18] Gresens, S.E., Belt, K.T., Tang, J.A., Gwinn, D.C. and Banks, P.A. (2007) Temporal
DOI: 10.4236/jwarp.2021.132009 169 Journal of Water Resource and ProtectionF. M. Onana et al.
and Spatial Responses of Chironomidae (Diptera) and Other Benthic Invertebrates
to Urban Stormwater Runoff. Hydrobiologia, 575, 173-190.
https://doi.org/10.1007/s10750-006-0366-y
[19] Suchel, J. (1972) Les climats du Cameroun. Doctorat Thesis, University of Bordeaux
III, Bordeaux.
[20] Rodier, J., Legube, B. and Merlet, N. (2009) The Water Analysis. 9th Edition, Du-
nod, Paris.
[21] Leclercq, L. and Maquet, B. (1987) Two New Chemical and Diatomic Indices of
Running Water Quality. Application to Samson and Its Tributaries (Belgian Meuse
Basin) Comparison with Other Chemical, Biocenotic and Diatomic Indices. Royal
Institute of Natural Sciences of Belgium, Bruxelles.
[22] Stark, J.D., Boothroyd, K.G., Harding, J.S., Maxted, J.R. and Scarsbrook, M.R. (2001)
Protocols for Sampling Macroinvertebrates in Wadeable Streams. New Zealand: Ma-
croinvertebrates Working Group, Report No. 1, Ministry for the Environment.
[23] De Moor, I.J., Day, J.A. and De Moor, F.C. (2003a) Guides to the Freshwater Inver-
tebrates of Southern Africa, Volume 7: Insecta I. Ephemeroptera, Odonata, Plecop-
tera. Pretoria: WRC Report No. TT 207/03.
[24] De Moor, I.J., Day, J.A. and De Moor, F.C. (2003b) Guides to the Freshwater Inver-
tebrates of Southern Africa, Volume 8: Insecta II. Hemiptera, Megaloptera, Neu-
roptera, Trichoptera and Lepidoptera. Pretoria: WRC Report No. TT 214/03.
[25] Tachet, H., Richoux, P., Bournaud, M. and Usseglio-Polatera, P. (2006) Freshwater
Invertebrates: Systematic, Biology and Ecology. CNRS Edition, Paris.
[26] Tachet, H., Richoux, P., Bournaud, M. and Usseglio-Polatera, P. (2010) Freshwater
Invertebrates: Systematic, Biology and Ecology. CNRS Edition, Paris.
[27] Mandaville, S.M. (2002) Benthic Macroinvertebrates in Freshwaters-Taxa Tolerance
Values, Metrics and Protocols. Soil and Water Conservation Society of Metro Hali-
fax.
[28] Cummins, K.W., Merritt, R.W. and Andrade, P.C.N. (2005) The Use of Invertebrate
Functional Groups to Characterize Ecosystem Attributes in Selected Streams and
Rivers in South Brazil. Studies on Neotropical Fauna and Environment, 40, 69-89.
https://doi.org/10.1080/01650520400025720
[29] Thorp, J.H. and Covich, A.P. (2010) Ecology and Classification of North American
Freshwater Invertebrates. 3rd Edition, Academic Press, San Diego.
[30] Allan, J.D. and Castillo, M.M. (2007) Stream Ecology: Structure and Function of
Running Waters. 2nd Edition, Springer, Dordrecht.
[31] Hepp, L.U., Milesi, S.V., Biasi, C. and Restello, R.M. (2010) Effects of Agricultural
and Urban Impacts on Macroinvertebrates Assemblages in Streams (Rio Grande do
Sul, Brazil). Zoologia, 27, 106-113.
https://doi.org/10.1590/S1984-46702010000100016
[32] Orlinskiy, P., Münze, R., Beketov, M., Gunold, R., Paschke, A., Knillmann, S. and
Liess, M. (2015) Forested Headwaters Mitigate Pesticide Effects on Macroinverte-
brate Communities in Streams: Mechanisms and Quantification. Science of the To-
tal Environment, 524, 115-123. https://doi.org/10.1016/j.scitotenv.2015.03.143
[33] Couceiro, S.R.M., Hamada, N., Luz, S.L.B., Forsberg, B.R. and Pimentel, T.P. (2007)
Deforestation and Sewage Effects on Aquatic Macroinvertebrates in Urban Streams
in Manaus, Amazonas, Brazil. Hydrobiologia, 575, 271-284.
https://doi.org/10.1007/s10750-006-0373-z
[34] Fierro, P., Bertrán, C., Mercado, M., Peña-Cortés, F., Tapia, J., Hauenstein, E., Ca-
DOI: 10.4236/jwarp.2021.132009 170 Journal of Water Resource and ProtectionF. M. Onana et al.
puto, L. and Vargas-Chacoff, L. (2015) Landscape Composition as a Determinant of
Diversity and Functional Feeding Groups of Aquatic Macroinvertebrates in South-
ern Rivers of the Araucanía, Chile. Latin American Journal of Aquatic Research, 43,
186-200. https://doi.org/10.3856/vol43-issue1-fulltext-16
[35] Molozzi, J., Hepp, L.U. and Dias, A.S. (2007) Influência da cultura de arroz sobre a
comunidade bentônica no vale do Itajaí (Santa Catarina, Brasil). Acta Limnologica
Brasilensia, 19, 383-392.
[36] Bacey, J. and Spurlock, F. (2007) Biological Assessment of Urban and Agricultural
Streams in the California Central Valley. Environmental Monitoring Assessment,
130, 483-493. https://doi.org/10.1007/s10661-006-9438-8
[37] Virbickas, T., Pliūraitė, V. and Kesminas, V. (2011) Impact of Agricultural Land
Use on Macroinvertebrate Fauna in Lithuania. Polish Journal of Environmental
Studies, 20, 1327-1334.
[38] MDDEFP (Ministère du Développement Durable, de l’Environnement, de la Faune
et des Parcs) (2013) Guide de surveillance biologique basée sur les macroinvertébrés
benthiques d’eau douce du Québec—Cours d’eau peu profonds à substrat grossier.
2e édition, Direction du suivi de l’état de l’environnement, Quebec.
[39] Dosskey, M.G., Vidon, P., Gurwick, N.P., Allan, C.J., Duval, T.P. and Lowrance, R.
(2010) The Role of Riparian Vegetation in Protecting and Improving Chemical
Water Quality in Streams. Journal of the American Water Resources Association,
46, 261-277. https://doi.org/10.1111/j.1752-1688.2010.00419.x
[40] Miserendino, M.L. and Masi, C.I. (2010) The Effects of Land Use on Environmental
Features and Functional Organization of Macroinvertebrate Communities in Pata-
gonian Low Order Streams. Ecological Indicators, 10, 311-319.
https://doi.org/10.1016/j.ecolind.2009.06.008
[41] Benitez-Mora, A. and Camargo, J.A. (2014) Ecological Responses of Aquatic Ma-
crophytes and Benthic Macroinvertebrates to Dams in the Henares River Basin
(Central Spain). Hydrobiologia, 728, 167-178.
https://doi.org/10.1007/s10750-014-1816-6
[42] Fierro, P., Bertrán, C., Tapia, J., Hauenstein, E., Peña-Cortés, F., Vergara, C., Cerna,
C. and Vargas-Chacoff, L. (2017) Effects of Local Land-Use on Riparian Vegetation,
Water Quality, and the Functional Organization of Macroinvertebrate Assemblages.
Science of the Total Environment, 609, 724-734.
https://doi.org/10.1016/j.scitotenv.2017.07.197
[43] Sabo, J.L., Caron, M., Doucett, R., Dibble, K.L., Ruhi, A., Marks, J.C., Hungate, B.A.
and Kennedy, T.A. (2018) Pulsed Flows, Tributary Inputs and Food-Web Structure
in a Highly Regulated River. Journal of Applied Ecology, 55, 1884-1895.
https://doi.org/10.1111/1365-2664.13109
DOI: 10.4236/jwarp.2021.132009 171 Journal of Water Resource and ProtectionYou can also read