The Effect of Feed Composition on the Structure of Zooplankton Communities in Fishponds - MDPI
←
→
Page content transcription
If your browser does not render page correctly, please read the page content below
water
Article
The Effect of Feed Composition on the Structure of
Zooplankton Communities in Fishponds
Flórián Tóth 1,2, *, Katalin Zsuga 3 , Éva Kerepeczki 1 , László Berzi-Nagy 1 ,
Zsuzsanna Jakabné Sándor 4 and László Körmöczi 2
 1   Department of Hydrobiology, National Agricultural Research and Innovation Centre—Research Institute for
     Fisheries and Aquaculture, 5540 Szarvas, Hungary; kerepeczki.eva@haki.naik.hu (E.K.);
     berzi.nagy.laszlo@haki.naik.hu (L.B.-N.)
 2   Department of Ecology, Faculty of Science and Informatics, University of Szeged, 6720 Szeged, Hungary;
     kormoczi@bio.u-szeged.hu
 3   Agrint Kft, 2100 Gödöllő, Hungary; zsuga.katalin@gmail.com
 4   Department of Fish Biology, National Agricultural Research and Innovation Centre—Research Institute for
     Fisheries and Aquaculture, 5540 Szarvas, Hungary; jakabne.sandor.zsuzsanna@haki.naik.hu
 *   Correspondence: toth.florian@haki.naik.hu; Tel.: +36-66-515-300

 Received: 27 March 2020; Accepted: 5 May 2020; Published: 8 May 2020

 Abstract: With the intensification of aquaculture, the structure and dynamics of aquatic ecosystems
 are highly affected. At the same time, for a pond fish farmer, one of the most important tasks
 is to establish and maintain stable and favourable zooplankton populations. In this paper, we
 assess the effects of different supplementary feed types on zooplankton communities in freshwater
 fishponds. In an outdoor, experimental fishpond system, carp individuals of 2+ years of age were
 stocked and fed with either a fishmeal-based diet (FF), a plant meal containing experimental feed
 (PF) or cereals (CT). To compare the diversity of the zooplankton communities, we used the Shannon
 diversity index, and to assess the effects of environmental factors and the feed ingredients, we applied
 canonical correspondence analysis. We described the dynamics of zooplankton communities, where
 the biodiversity of rotifera and Crustacean communities showed temporal differences. In order to
 examine the effects of feed ingredients, temporal clustering was applied. The different diets did
 not consistently alter the composition of zooplankton communities. Consequently, the plant meal
 containing experimental feed had no negative effect on the planktonic biodiversity, which makes it
 suitable as an alternative feed source for fishponds at the applied level.

 Keywords: cladocera; copepoda; rotifera; fishponds; aquaculture; carp; Shannon diversity; CCA

1. Introduction
      The human population is constantly growing, leading to a steady increase in the developments
of agriculture and aquaculture. Nowadays, aquaculture is the fastest growing livestock sector in
the world [1]. In parallel, our ecosystems worldwide are rapidly losing their functional, genetic
and phylogenetic diversity due to habitat changes, human exploitation of natural resources and
the spread of pathogens, exotic and domestic animals and plants [2]. In addition to the economic
approach to technological development in fisheries, the ecological approach should not be overlooked.
The global fish production was over 171 million tonnes, 47% of which (around 80 million tonnes)
were accounted for by aquaculture in 2016. In that year, the world aquaculture carp production was
4.5 million tonnes [1]. In recent decades, carp production has intensified in Europe and other parts of
the world [3,4].
      In Hungary, carp (Cyprinus carpio Linnaeus, 1758) production is dominant in the production
of fish for consumption. In 2018, it reached 11,400 tonnes, accounting for 79.5% of pond-farmed

Water 2020, 12, 1338; doi:10.3390/w12051338                                       www.mdpi.com/journal/water
Water 2020, 12, 1338                                                                                 2 of 14

fish [5]. As aquaculture production increases with feed intake and waste, the amounts of organic
matter, nutrients and suspended solids also increase [6]. There is a growing concern about the potential
negative environmental impacts of aquaculture [7], in particular, the discharge of nutrients from the
effluent of such systems. The impact of feed ingredients on water quality has been widely studied in
different systems in as much as they affect the water quality and growth performance of fish in the
receiving water [8–11]. Extensive systems are under pressure to intensify due to market demands.
The sustainable intensification requires feed types where the highest yields can be achieved with the
least nutrient loading on the ecosystem.
      A traditional practice to achieve that is supplementary feeding with manuring, which increases
both production and natural productivity in the semi-intensive fishpond systems [3,4,12,13]. Replacing
cereals with complex feeds makes production more profitable and has a positive impact on fish flesh
quality [14–16], however, conventional fish feeds are often made from fishmeal and oil, and the use of
such ingredients is unsustainable [17]. The use of fishmeal-based feeds has started to decline in recent
years. Compared to the 1990–2000s, the proportion of fishmeal in carp feeds has been reduced by 1–2%
in recent years [18–20]. As a result, the aquaculture feed industry has turned to alternative sources [17].
Plant-based ingredients have been used lately. However, the inclusion of alternative plant ingredients
has its own challenges in terms of product quality [21–23] and environmental impacts [24].
      One of the most important finfish species in global freshwater aquaculture is the common carp.
It is the oldest domesticated fish and the most widespread cyprinid species in aquaculture [25,26].
The most common production technology in Europe is carp monoculture grown in earthen ponds [27].
Farming of carp in extensive and semi-intensive pond aquaculture is based on natural production and
feeding with cereals. In this case, the most important task of the fish farmer is to establish and maintain
a continuously growing zooplankton population using agro-technological tools [28]. Carp adapts well
to semi-intensive pond farming conditions and this technology has less environmental impact than
other intensive systems [29]. These fishponds are generally shallow, artificially created water bodies
designed for fish production purposes. In addition, they make a major contribution to freshwater
biodiversity. It is important to monitor the fishponds physically and chemically to understand their
impact on aquatic ecosystems [30]. These fishponds are heavily influenced by human activities and
weather conditions [31,32].
      Today’s intensification in aquaculture is affecting the structure and dynamics of aquatic ecosystems
and those of zooplankton communities. This group of organisms also contributes to the growth
of economically important fish species. They are main supporters of the energy transfer between
phytoplankton and fish [33]. Zooplankton is considered to be a significant source of amino acids,
protein, fatty acids, lipids, enzymes and minerals [34,35]. While cereal feed itself is protein-poor and
has high carbohydrate content, zooplankton is rich in protein and carbohydrate-poor [36]. However,
zooplankton also acts against uneven growing [37] and fish health. The composition and abundance of
zooplankton communities can be considered both as indicators of water quality and productivity [38],
and useful for managing successful and predictable fish yields [39]. Such bioindicators are often
used because they show rapid changes due to environmental factors [40]. Zooplankton communities
in fishponds have been studied previously, but these were not related to the effects of different
feed ingredients. Pechar et al. [41] noted that over the past 50 years, the dominance of fishpond
zooplankton species has shifted towards smaller species. Ruttkay [42,43] described the differences
between zooplankton communities in mono- and polyculture of carp. Donászy [44] measured the
zooplankton biomass formed in the fishponds with different treatments (fish-cum-duck technology,
wheat feeding, enhanced fertilization) with a large sample number. Körmendi [45] described the
rotifera fauna of fishponds in the Southern Transdanubia region of Hungary. He showed 63 taxa, of
which Asplachna and Brachionus species were dominant.
      The main goal of this paper is to assess the effect of different supplementary feed types on
zooplankton communities. In an outdoor, experimental fishpond system stocked with 2-plus-year-old
carps, three different feeds were utilised: 1) fishmeal- and fish oil-based feed (FF) as a conventional and
that of conventional and traditional feeds, and thus experimental feed does not pose a greater
environmental burden, and therefore can be recommended as a sustainable alternative to
conventional fishmeal-based feeds.
2. Materials and Methods
Water 2020, 12, 1338 3 of 14
2.1. Experimental Design
commercial Thefeed,
experiment
2) plant was
meal-conducted
and plantinoil-containing
fishponds of feed
uniform
(PF)size
as anonexperimental,
the site of the National diet
sustainable
Agricultural Research and Innovation Centre, Research Institute for Fisheries and Aquaculture
and 3) cereals, the traditional supplementary feed as control (CT). We hypothesised that the 2impact of
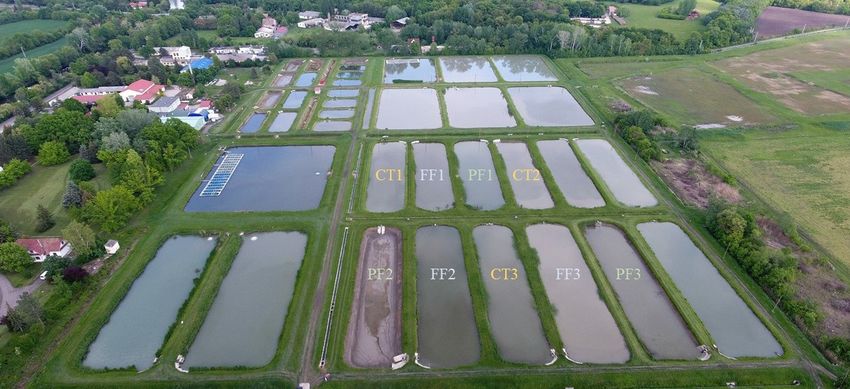
(NAIK HAKI, Szarvas, Hungary) (Figure 1) in 2015. The average area of ponds was 1754 ± 74 m and
experimental feed on community composition does not differ from that of conventional and traditional
the average depth was 1.3 m. The feed used for the experiment was compiled according to the semi-
feeds,intensive
and thusbreeding
experimental feedof
conditions does
the not
fish.pose
The aproportion
greater environmental
of ingredientsburden, and therefore
in the experimental can be
and
recommended as a sustainable alternative to conventional fishmeal-based feeds.
conventional feeds is shown in Table 1. The two feed types had practically the same crude protein
and crude fat concentrations. The main difference between the two feeds was in the content of
2. Materials
fishmeal and Methods
and soy. The third type of feed was cereal (CT), which is traditionally used in Hungary. The
experiment was carried out in nine earthen ponds, three replicates per feed. The ponds were filled
2.1. Experimental Design
from the nearby oxbow lake of River Körös. Each pond contained 200 individuals of 2-plus-year-old
carpexperiment
The (average weight: 745 ± 80 g). in fishponds of uniform size on the site of the National Agricultural
was conducted
Research and Innovation Centre, Research Institute for Fisheries and Aquaculture (NAIK HAKI, Szarvas,
Table 1. The ingredients of the experimental and conventional, commercial feeds.
Hungary) (Figure 1) in 2015. The average area of ponds was 1754 ± 74 m2 and the average depth
was 1.3 m. The feed used for Fishmeal-Based
the experiment Feedwas
(FF) compiled
Plant Meal-Based
according Feed (PF)
to the semi-intensive breeding
(conventional and commercial feed) (experimental feed)
conditions of the fish. The proportion
Ingredient
of ingredients
%
in the experimental
Ingredient %
and conventional feeds
is shown in Table 1. The two feed60 types had14.0
Fishmeal practically the same
Fishmeal 60 crude
0.0 protein and crude fat
Winter wheat
concentrations. The main difference between the 20.5two feeds
Winter
waswheat 16.5
in the content of fishmeal and soy.
Maize 27.5 Maize 27.5
The third type of feed was cereal (CT),
Full-fat soy which is traditionally
6.5 used
Full-fat soy in Hungary.
9.5 The experiment was
carried out in nine earthen ponds,
Extrudedthree
soy replicates
17.5 per feed. Thesoy
Extruded ponds were29.5 filled from the nearby
Blood meal 5.0 Blood meal 8.0
oxbow lake of River Körös. Each pond contained 200 individuals of 2-plus-year-old carp (average
Fish oil 2.0 Linseed oil 2.0
weight: 745 ± 80 g). Other 7.0 Other 7.0
Figure 1. 1.The
Figure experimental
The experimental design
design atsite
at the theof site of the Agricultural
the National National Agricultural Research and
Research and Innovation
Centre, Centre,
Innovation ResearchResearch
Institute for Fisheriesfor
Institute andFisheries
Aquacultureand(NAIK HAKI); CT—Control;
Aquaculture (NAIK HAKI);FF—Fishmeal-
CT—Control;
based feed; PF—Plant
FF—Fishmeal-based feed;meal-based
PF—Plantfeed.meal-based feed.
Table 1. The ingredients of the experimental and conventional, commercial feeds.
Fishmeal-Based Feed (FF) Plant Meal-Based Feed (PF)
(Conventional and Commercial Feed) (Experimental Feed)
Ingredient % Ingredient %
Fishmeal 60 14.0 Fishmeal 60 0.0
Winter wheat 20.5 Winter wheat 16.5
Maize 27.5 Maize 27.5
Full-fat soy 6.5 Full-fat soy 9.5
Extruded soy 17.5 Extruded soy 29.5
Blood meal 5.0 Blood meal 8.0
Fish oil 2.0 Linseed oil 2.0
Other 7.0 Other 7.0Water 2020, 12, 1338 4 of 14
2.2. Sample Collection.
The zooplankton community was sampled three times in 2015 (June, August and September).
Each time, 50 litres of surface water were taken and filtered using 50 µm mesh plankton net, then
concentrated to 100 ml. Samples were preserved with added formaldehyde (4% final concentration)
and stored at 4 ◦ C until identified by light microscope following standard keys [46–53]. Density was
measured with a 5 ml counter chamber. The specific dry mass values needed for biomass estimation
were based on literature data [54].
Simultaneously with the zooplankton sampling, the whole water column was sampled and water
chemistry parameters were analysed. Total nitrogen (TN) [55], ammonium nitrogen (TAN) [56], total
phosphorus (TP) [57], total suspended solids (TSS) [58], chlorophyll-a (Cl_a) [59] and conductivity
(CON) [60] were measured according to the standards of the Hungarian Standards Institution in the
National Agricultural Research and Innovation Centre, Research Institute of Irrigation and Water
Management (NAIK ÖVKI, Szarvas, Hungary) Laboratory for Environmental Analytics.
2.3. Diversity Evaluation
To compare the diversity of the zooplankton communities of the experimental ponds, we used the
Shannon diversity index in R software environment (© The R Foundation, Vienna, Austrua) [61] with
vegan package [62].
2.4. Statistics
For statistical evaluation, the effects of environmental factors on the structure of zooplankton
communities were analysed by canonical correspondence analysis (CCA) in R with vegan package.
Estimated biomass was used for species variables, while environmental variables included
concentrations of water chemistry parameters (total ammonium nitrogen, total, nitrogen, total
phosphorus, total suspended solids, electrical conductivity, chemical oxygen demand, chlorophyll-a)
and total feed components (fishmeal and soy component, wheat feed).
3. Results
3.1. Abundance
The highest density of zooplankton occurred in pond FF1 during the study period (22 September).
The bulk of the zooplankton population was the common crustacean, Bosmina longirostris, accounting
for 31.7% of the total population. Looking at the averages of total number of individuals per treatment,
the highest density of zooplankton was measured for the treatment with fish oil-based feed in June.
The lowest density was also in the FF1 pond in August, while the lowest average density was for the
wheat feed as control at the same time (Figure 2). The density ratio of zooplankton groups varied
throughout the year. The proportion of rotifera in CT1 and PF3 ponds was about 50% in August
and 30–40% in June in PF1, PF2, FF2 ponds. Their share in the zooplankton community was low for
ponds FF1, CT2, CT3, FF3 and below 20% for the studied period. In terms of treatments, the rotifera
proportion was between 10% and 30% with the peak in August, except in the case of feed containing
fishmeal, where this was seen in June. Cladocera assemblages were highly variable, but in September
they dominated the zooplankton community in all ponds. With each treatment, their proportion was
constantly increasing. The density ratio of copepoda organisms greatly varied between ponds and also
seasons (20–90%), but in general for all treatments, their dominance in June was reduced by September.Water 2020, 12, 1338 5 of 14
Water 2020, 12, x 5 of 14
Water 2020, 12, x 1,200,000 5 of 14
3)
(ind/m(ind/m
1,000,000
1,200,000
3)
800,000
1,000,000
of individuals
600,000
800,000
of individuals
400,000
600,000
Number
200,000
400,000
Number
0
200,000
CT FF PF
0
24 June 5 August 22 September
CT FF PF
Figure
Figure 2. Averagenumber
2. Average numberof of individuals
individuals of24of zooplankton
the the zooplankton species
species per per treatment
treatment at each sampling
at each sampling
June 5 August 22 September
time;
time; CT—Control; FF—Fishmeal-based
CT—Control; FF—Fishmeal-based feed;
feed; PF—Plant
PF—Plant meal-based
meal-based feed. feed.
Figure 2. Average number of individuals of the zooplankton species per treatment at each sampling
3.2.
3.2.Biomass
Biomass
time; CT—Control; FF—Fishmeal-based feed; PF—Plant meal-based feed.
The
The highest
highest biomass
biomass was was recorded
recordedininpond pondFF1 FF1(22 (22September)
September) during
during thethe study
study period,
period, andand most
was 3.2.given
most Biomass
was given by Bosmina
by Bosmina longirostris. Examining
longirostris. Examining per per treatment,
treatment, the average
the averagebiomass of ponds
biomass ofwith
ponds with
fishmeal
fishmeal The feed
feed was the
was biomass
highest highest
the highest wasinin June (Figure
June (Figure
recorded in pond 3). On
3).FF1 average,
On (22average, this treatment
this treatment
September) produced
during theproduced almost
study period,almost1.7
and1.7 times
times higher
most biomass
higher biomass
was giventhan than
by Bosmina the
the other other two
longirostris.
two feed feed
Examiningtypes
types in per in the season.
thetreatment,
season. At At
thethethe time
average
time of of sampling
biomass
sampling in
of ponds early
with August,
in early
August,
the pondsthe
fishmeal ponds
feed
had washad
low thelow zooplankton
highest
zooplankton June masses,
inmasses, with with
(Figure 3). On
the theaverage,
smallestthis
smallest value
value occurringproduced
treatment
occurring ininPF1.
PF1. There
almost
There were
were1.7also low
also low
times values
higher similar
biomass to
thaneach
theother
otherin CT1
two and
feed CT2
types ponds.
in the The difference
season. At the between
time of the highest
sampling in and
early
values similar to each other in CT1 and CT2 ponds. The difference between the highest and lowest
lowest
August,average biomass
the ponds was zooplankton
had low greater than 2.9-fold.
masses, withThe lowest average
the smallest biomass
value was in
occurring found
PF1. in the case
There were
average
ofalso
thelowbiomass was
plant-based feed greater
in than(Figure
August 2.9-fold.3). Theproportion
The lowest average of biomass
rotifera was was found
negligible in in
thethe case of the
total
values similar to each other in CT1 and CT2 ponds. The difference between the highest and
plant-based
biomass feedstudied
of the
lowest average
in August
biomassgroups,
(Figure
and it3).
was greater
The
was
than
proportion
hardly
2.9-fold. measurable of rotifera was
in comparison
The lowest average
negligible
biomasstowas
in the total
crustaceans.
found in the
biomass of
In the
case
the studied
zooplankton groups,
community, and it was
the hardly
biomasses measurable
of cladocera in comparison
and copepoda to crustaceans.
were
of the plant-based feed in August (Figure 3). The proportion of rotifera was negligible in the total dominant, In the
but zooplankton
their
community,
biomass of the
proportions biomasses
varied fromgroups,
the studied pond of cladocera
toand
pond. and
Ponds
it was copepoda
hardlyCT1-FF1,
measurable wereindominant,
PF1-CT2-FF2 but their proportions
and CT3-FF3-PF3
comparison to crustaceans. wereInthethe varied
most
from similartoinpond.
pond
zooplankton their tendency,
community, Pondsthe while
CT1-FF1, the PF1-CT2-FF2
biomasses annual biomassand
of cladocera change was different
andCT3-FF3-PF3
copepoda indominant,
were
were PF2.
the mostbut similar
their in their
tendency,
proportions 4 varied
while the annual
from pond biomass change
to pond. Ponds was different
CT1-FF1, in PF2. and CT3-FF3-PF3 were the
PF1-CT2-FF2
most similar in their tendency, while the annual biomass change was different in PF2.
4
3
(g/m3) (g/m )
3
3
2
Biomass
2
Biomass
1
1
0
CT FF PF
0 24 June 5 August 22 September
CT FF PF
Figure 3. Average biomass of the zooplankton
24 June species per treatment
5 August at each sampling time; CT—
22 September
Control; FF—Fishmeal-based feed; PF—Plant meal-based feed.
Figure 3. Average biomass of the zooplankton species per treatment at each sampling time; CT—Control;
Figure 3. Average biomass of the zooplankton species per treatment at each sampling time; CT—
FF—Fishmeal-based feed; PF—Plant
Control; FF—Fishmeal-based meal-based
feed; PF—Plant feed. feed.
meal-basedWater 2020, 12, 1338 6 of 14
3.3. Rotifera Assemblage
Twenty-three rotifera taxa were found in the studied fishponds (Table S1), with the smallest
number occurring in FF1. The species pool of the other ponds was similar. The dominant elements
changed according to the phenological rhythm. The Asplanchna intermedia and Asplanchna pridonta
reached their peak in June, but later only sporadically appeared. The A. intermedia did not occur in the
ponds treated with fishmeal feed from August on, while A. pridonta was absent in the control ponds
during the whole experiment. As of June, Brachionus angularis, Brachionus calyciflorus, Brachionus falcatus
were dominant elements throughout the study period. From this genus, Brachionus diversicornis was
not found in FF ponds in August and September, whereas Brachionus urceolaris behaved in a contrary
way. Beside them, the populations of the warm stenothermic Filinia opoliensis, Keratella tropica and
Polyarthra euryptera, also known as the summer plankton [47,48], were significant. In September,
in addition to Keratella cochlearis, the presence of Keratella irregularis, which is very similar to the
former species, could be detected in the rotifera assemblage, in some cases outnumbering K. cochlearis.
In June 2015, the less common Brachionus variabilis, which was not previously registered in Hungary
and which was present in large numbers in CT1 and FF1 ponds, was found in the rotifera community,
but with little abundance in CT2, CT3, FF3 units. Many species appeared only sporadically; Lecane luna,
Lepadella rhomboids, Testudinella patina, Pompholyx sulcate, Trichocerca pusilla were present only in one or
two ponds, and their quantity was low. The same applied to Hexarthra mira, which only occurred in
control ponds.
3.4. Cladocera Assemblage
Altogether, 14 cladocera taxa were found in the studied fishponds (Table S2) and 3 to 9 taxa per
pond formed this assemblage. Among the species, Bosmina longirostris was a decisive element of
the cladocera community throughout the year, and in June, the proportion of Daphnia cucullata was
significant, which decreased later. Moina micrura dominated in August and September. In a preliminary
survey, we recorded the presence of Daphnia ambigua in one of the ponds for which occurrence has
not been published from Hungary previously [63]. This species was also present in the 2015 study
period and was a stable member of the zooplankton community during the May and June sampling,
except for in pond FF2. Preliminary samplings also revealed the occurrence of Daphnia parvula, which
was previously known on the American continent. It has appeared in several places in Europe in
recent decades [60]. In the 2015 collections, a small number of individuals were present in CT1 and
FF2 ponds. In the present study, we recorded the presence of a cladocera species—Ceriodaphnia rigaudi
(syn: Ceriodaphnia cornuta f. rigaudi Sars, 1896)—whose geographical distribution, according to Bledzki
and Rybak [64], was found only in Spain on the European continent. According to our investigation,
a significant number of reproductive individuals and stable populations of the species could be found
in the ponds during this period. In the population, the summer was characterised by the presence of
juveniles and females with subitan eggs. Males were present from the end of August, and in September
the proportion of females with resting eggs was significant. The species is small; females are 0.4 mm
long on average, with a typical rostriform rostrum on the head. In the ephippium, there is one resting
egg. The end of the postabdomen is inclined obliquely, with 4–6 spines growing towards the end of the
body, and the postabdominal claw is smooth.
3.5. Copepoda Assemblage
From June onwards, in all ponds, Acanthocyclops robustus was a typical, dominant organism, with a
large proportion of the total zooplankton biomass given by individuals of this species at different life
stages. Next to it, the presence of Cyclops vicinus was detected in two FF ponds in low abundance and
only in September, therefore, despite its large size, it did not have a significant biomass. This species is
especially characteristic in the winter plankton communities.Water 2020, 12, 1338 7 of 14
Water 2020, 12, x 7 of 14
3.6. Diversity Evaluation
3.6. Diversity Evaluation
In terms of the Shannon diversity indices of the assemblages, the biodiversities of rotifera and
In terms of the Shannon diversity indices of the assemblages, the biodiversities of rotifera and
Crustaceans (cladocera and copepoda) differed from each other at different sampling dates (Figure 4).
Crustaceans (cladocera and copepoda) differed from each other at different sampling dates (Figure
With the fishmeal-based treatment, the rotifera community clearly showed a higher degree of diversity
4). With the fishmeal-based treatment, the rotifera community clearly showed a higher degree of
than with the other two treatments in June. However, in the case of Crustacean communities’ diversity,
diversity than with the other two treatments in June. However, in the case of Crustacean
a clear order of plant-based feed > control > fishmeal-based feed could be identified. In the other
communities’ diversity, a clear order of plant-based feed > control > fishmeal-based feed could be
samples, the control had the highest diversity in the case of the rotifera communities, followed by
identified. In the other samples, the control had the highest diversity in the case of the rotifera
plant-based feed and then fishmeal-based feed. In the case of cladocera and copepoda communities,
communities, followed by plant-based feed and then fishmeal-based feed. In the case of cladocera
the control showed the highest diversity. In August, this was approached by FF treatment, while PF
and copepoda communities, the control showed the highest diversity. In August, this was
was much lower. The difference between the latter two disappeared by September and a reversed
approached by FF treatment, while PF was much lower. The difference between the latter two
order was outlined.
disappeared by September and a reversed order was outlined.
Figure 4. Changes in the Shannon diversity (H(S)) indices of the assemblages of rotifera and
Figure 4. Changes
Crustacean in the Shannon diversity (H(S)) indices of the assemblages of rotifera and
communities.
Crustacean communities.
3.7. Zooplankton—Environment Relationships
3.7. Zooplankton—Environment Relationships
The effects of seven water chemistry and three feed ingredient parameters were assessed on the
The effects
distribution of sevenand
of rotifera water chemistry
Crustacea and threeand
(cladocera feed ingredientusing
copepoda) parameters
CCA. The were assessed
results on the
are shown
distribution
along the firstofand
rotifera
second andaxes,
Crustacea (cladocera
where species and copepoda)
are represented using
by dots, andCCA. The resultsvariables
environmental are shown by
along
arrows.theBy
first and second
placing axes, whereofspecies
the communities are represented
Crustaceans (cladocerabyand dots, and environmental
copepoda) of each ponds variables
to the
by arrows. By
ordination placing
space the communities
according to their water of chemistry
Crustaceans (cladocerathe
parameters, and copepoda)
individual of each
points areponds
grouped to
the ordination
according to thespace according
sampling times, to
buttheir water chemistry
the composition of the parameters,
feed ingredientsthe had
individual
no effect points are
on group
grouped
formationaccording
(Figure 5a). to the
Thesampling times, but
total ammonium the composition
nitrogen, of the
total nitrogen, feed
total ingredients
phosphorus, hadsuspended
total no effect
on group
solids andformation (Figure 5a).
the chlorophyll-a hadThe total ammonium
an opposite effect to nitrogen, totalconductivity
the electrical nitrogen, totalandphosphorus,
chemical oxygentotal
suspended
demand. The solids
former andgroup
the chlorophyll-a had an the
positively influenced opposite
communityeffectcomposition
to the electrical conductivity
in September, whileand
the
chemical
latter twooxygen
parametersdemand. The former
negatively. group positively
Accordingly, influenced
water chemistry hadthe community
little effect on thecomposition
formation in or
September,
separation of while the latter two
the community inparameters
the other two negatively.
months. Accordingly, waterclustering
A partial temporal chemistrycan hadbe little effect
observed
on
whentheexamining
formation the or effects
separation of the community
of treatments (Figure 5b). inThe
the values
other two
of Junemonths. A partial
and August show temporal
a slight
clustering
overlap. In can becase,
this observed whencontent,
the plant examiningwhichthe was
effects of treatments
typical (Figure feed
to experimental 5b). The
andvalues
controlofwheat
June
and August
feeding, show a slight
negatively overlap.
correlated withInthe
thisgroup
case, of
theAugust,
plant content, which
while the was typicalfishmeal
conventional to experimental
feed did
feed and control
the opposite with thewheat feeding, composition
community negatively correlated
of September. withThus,
the group of August,
the plant-based dietwhile
mightthebe
conventional
responsible for fishmeal feed didofthe
the separation theopposite
groups ofwithJunethe
and community
August. composition of September. Thus,
the plant-based diet might be responsible for the separation of the groups of June and August.
There is also a temporal clustering in the ordination space by examining the effect of water
chemistry parameters on sets of points representing rotifera communities (Figure 5c). The values for
each month are grouped into different quarters of the ordination space, but the confidence ellipses
fitted to the values of September and June minimally overlap. The composition of communities of
September showed a positive correlation and the communities of August showed a negative
correlation with chlorophyll concentration and total suspended solids, while the other parametersWater 2020, 12, x 8 of 14
showed a negative correlation with the communities of June. Examining the feed components, there
is a temporal clustering of rotifera communities, but there is some overlap (Figure 5d). The samples
of August form a discrete set, soy being the one to distinguish it from the September samples, and
wheat
Water 2020,from June samples. In the case of this planktonic group, feed had a smaller effect, but soybean
12, 1338 8 of 14
had the largest impact among the ingredients.
Figure 5. Canonical Correspondence Analysis (CCA) results of the effect of water chemistry
Figure 5. Canonical Correspondence Analysis (CCA) results of the effect of water chemistry and feed
and feed ingredient parameters on the distribution of rotifera and Crustacean (cladocera and
ingredient parameters on the distribution of rotifera and Crustacean (cladocera and copepoda)
copepoda) communities. Abbreviations of water chemistry parameters (a–d): TN—Total nitrogen;
communities. Abbreviations of water chemistry parameters (a–c): TN—Total nitrogen; TAN—
TAN—ammonium nitrogen; TP—total phosphorus; TSS—total suspended solids; Cl_a—Chlorophyll-a;
ammonium nitrogen; TP—total phosphorus; TSS—total suspended solids; Cl_a—Chlorophyll-a;
CON—conductivity.
CON—conductivity. Abbreviations
Abbreviations of
of feed
feed ingredients: Cer—Cereals;FM—Fishmeal.
ingredients: Cer—Cereals; FM—Fishmeal. Confidence
Confidence
ellipses are drawn according to months.
ellipses are drawn according to months.
There is also a temporal clustering in the ordination space by examining the effect of water
Looking at the community-scale effect of feed ingredients at a monthly level (Figure 6a–f), the
chemistry
crustaceanparameters
and rotiferaon communities
sets of pointsresponded
representing rotifera communities
differently. In the case of (Figure 5c). the
the former, Theellipses
values for
each
fitted in the ordination space do not separate without overlap in any month (Figure 6a–c). There fitted
month are grouped into different quarters of the ordination space, but the confidence ellipses is
to no
theclear
values of September
effect and Juneon
of feed ingredients minimally
communityoverlap. The composition
composition. A completeofclustering
communities of September
cannot be said
showed a positive
for rotifera under correlation
the influenceand the communities
of feed of August
ingredients (Figure 6d–f),showed a negative
but in two months, correlation
characteristic with
chlorophyll concentration and total suspended solids, while the other parameters showed
communities of certain feed components have emerged. In August, the effect of fishmeal-based feed a negative
correlation with the communities of June. Examining the feed components, there is a temporal
clustering of rotifera communities, but there is some overlap (Figure 5d). The samples of August form
a discrete set, soy being the one to distinguish it from the September samples, and wheat from June
samples. In the case of this planktonic group, feed had a smaller effect, but soybean had the largest
impact among the ingredients.
Looking at the community-scale effect of feed ingredients at a monthly level (Figure 6a–f),
the crustacean and rotifera communities responded differently. In the case of the former, the ellipsesWater 2020, 12, 1338 9 of 14
fitted in the ordination space do not separate without overlap in any month (Figure 6a–c). There is
no clear effect of feed ingredients on community composition. A complete clustering cannot be said
for rotifera under the influence of feed ingredients (Figure 6d–f), but in two months, characteristic
Water 2020, 12, x 9 of 14
communities of certain feed components have emerged. In August, the effect of fishmeal-based feed is
separated from the
is separated fromother two treatments
the other (Figure
two treatments 6e), while
(Figure in September,
6e), while grain-fed
in September, ponds
grain-fed developed
ponds
a rotifera community
developed a rotiferathat sharplythat
community separated
sharply from the other
separated twoother
from the treatments (Figure(Figure
two treatments 6f). However,
6f). in
view of all this,
However, no general
in view claims
of all this, can be claims
no general made during the growing
can be made during theseason about
growing the difference
season about the in the
difference
effects of feedinon thezooplankton
effects of feedcommunities.
on zooplankton communities.
Figure 6. Cont.Water 2020, 12, 1338 10 of 14
Water 2020, 12, x 10 of 14
Figure 6. Canonical Correspondence Analysis (CCA) results of the community-scale effect of feed
Figure 6. Canonical Correspondence Analysis (CCA) results of the community-scale effect of feed
ingredient parameters on the distribution of rotifera and Crustacean (cladocera and copepoda)
ingredient parameters on the distribution of rotifera and Crustacean (cladocera and copepoda)
communities by months.
communities by months.Abbreviations
Abbreviationsof
ofwater
water chemistry parameters
chemistry parameters (a–f):
(a–c): TN—Total
TN—Total nitrogen;
nitrogen;
TAN—ammonium nitrogen; TP—total phosphorus; TSS—total suspended solids;
TAN—ammonium nitrogen; TP—total phosphorus; TSS—total suspended solids; Cl_a— Cl_a—Chlorophyll-a;
CON—conductivity. Abbreviations of Abbreviations
Chlorophyll-a; CON—conductivity. feed ingredients: Cer—Cereals;
of feed FM—Fishmeal.
ingredients: Cer—Cereals; FM—Fishmeal.
4. Discussion andand
4. Discussion Conclusion
Conclusion
In anInattempt
an attemptto replace fishmeal-
to replace fishmeal-and andfish
fishoil-containing aquafeed
oil-containing aquafeed with
with a plant-based
a plant-based diet,diet,
we we
investigated the dynamics
investigated the dynamics of zooplankton
of zooplanktoncommunities,
communities, which whichrepresent
represent thethe natural
natural foodfood source
source of of
fishponds. In the ponds, based on “uneaten” zooplankton density and
fishponds. In the ponds, based on “uneaten” zooplankton density and biomass, the communities were biomass, the communities
formedwere in formed
quantity in (0.06–70
quantity (0.06–70 g/mand
g/m3 ) [65]
3) [65] and quality (dominance of Bosmina spp. and Cyclopidae
quality (dominance of Bosmina spp. and Cyclopidae [42])
typical to common carp monoculture. Bosmina isBosmina
[42]) typical to common carp monoculture. too small is too small
in size forincarp,
size Cyclopidae’s
for carp, Cyclopidae’s
movement is
movement is too intensive. The density of larger species of cladocera (Ceriodaphnia, Daphnia), which
too intensive. The density of larger species of cladocera (Ceriodaphnia, Daphnia), which ensure a primary
ensure a primary food source for carp, was initially higher, but later became sporadic. Due to the
food source for carp, was initially higher, but later became sporadic. Due to the faster growth of
faster growth of Moina micrura, it can be subdominant throughout the year [43]. After the appearance
Moinaofmicrura, it can be subdominant
the alien Ceriodaphnia throughout
rigaudi, its significant stocksthe year in
survived [43]. After theFrom
all fishponds. appearance of the alien
a fish production
Ceriodaphnia
point of rigaudi,
view, theits significant
quantity stocksofsurvived
and quality zooplankton in all fishponds.were
communities From a fish production
adequate in the studiedpoint
of view,
ponds,the and
quantity
there and
was quality of zooplankton
no significant difference incommunities
structure betweenweretreatments.
adequate in Thethe studied
number ponds,
of 23
and there was no significant difference in structure between treatments. The number of 23 rotifera,
rotifera, 14 cladocera and 2 copepoda species were similar to the fishpond zooplankton study of
Körmendi and Hancz [66] (25, 12 and 1 species, respectively), but 12
14 cladocera and 2 copepoda species were similar to the fishpond zooplankton study of Körmendi andcommon rotifera species and
Hancz only
[66]4 common
(25, 12 and cladocera species
1 species, were found inbut
respectively), both 12studies.
common Thisrotifera
distribution of the
species andspecies
onlynumber
4 common
in a nearby natural ecosystem, the River Hármas-Körös, was 70, 11 and 2 species, respectively [67].
cladocera species were found in both studies. This distribution of the species number in a nearby
This river creates the base of the oxbow lakes that are the source of the experimental fishponds.
natural ecosystem, the River Hármas-Körös, was 70, 11 and 2 species, respectively [67]. This river
Several alien species were present in the community composition. Among the Rotifers,
creates the base of the oxbow lakes that are the source of the experimental fishponds.
Brachionus variabilis was determined to be episodic (adhering to the surface of Daphnia, Ceriodaphnia)
Several
or has aalien specieslifestyle
free-living were present
[46,48].in
Atthethecommunity composition.Daphnia
time of its appearance, Among the Rotifers,
cucullata Brachionus
and Daphnia
variabilis was determined to be episodic (adhering to the surface of Daphnia,
longispina were found in large numbers in the cladocera assemblages, not adhering to them, but rather Ceriodaphnia) or has
a free-living lifestyle
free-living. [46,48].
In the later At the
period, time
it was notof and by thatDaphnia
its appearance,
recorded time thecucullata
abundance and Daphniaspecies
of Daphnia longispina
was notinconsiderable.
were found large numbers We indid not
the find Brachionus
cladocera variabilisnot
assemblages, in ponds
adheringtreated with plant-based
to them, feeds,
but rather free-living.
In thewhile
laterinperiod,
two of these
it was ponds, Daphnia species
not recorded and by were
thatpresent.
time theBased on this, theofconnection
abundance betweenwas
Daphnia species the not
considerable. We did not find Brachionus variabilis in ponds treated with plant-based feeds,arewhile
two species cannot be excluded. Among the cladocera, Daphnia ambigua and Daphnia parvula
widespread on the American continent [63] but they had only recently appeared in Europe. It can be
in two of these ponds, Daphnia species were present. Based on this, the connection between the
concluded from the results that establishment, survival and reproduction of Daphnia species were
two species cannot be excluded. Among the cladocera, Daphnia ambigua and Daphnia parvula are
successful in this area. According to a new classification, both organisms are considered invasive
widespread on the American continent [63] but they had only recently appeared in Europe. It can be
species [68,69]. The most surprising occurrence of this zooplankton taxon was Ceriodaphnia rigaudi,
concluded from the results that establishment, survival and reproduction of Daphnia species were
successful in this area. According to a new classification, both organisms are considered invasive
species [68,69]. The most surprising occurrence of this zooplankton taxon was Ceriodaphnia rigaudi,
which, according to the literature, is typical to the warmest, tropical and subtropical zones [70–74].Water 2020, 12, 1338 11 of 14
It has not yet been detected from the filling oxbow lake, but its monitoring is recommended in any
case as it may be related to climate change.
Based on the diversity indices, the temporal states showed that rotifera and Crustacean diversities
are different, as was expected. The diversity of each group was quite variable over time, but the
treatments had no significant effect, except in August, when the rotifera diversity in the treated sites was
substantially lower than in the controls. In the case of Crustacea, diversity was reduced to a lesser extent
in PF treatment compared to the other two feeds. Examining the environmental background factors
and the feed components, the different treatments had little effect on the community composition,
corresponding to our hypothesis. The structure of the community was determined by season rather
than by the treatment. In general, communities are not associated with different diets.
All in all, the different treatments did not represent special conditions for the zooplankton
communities, which would cause a change in their composition in both positive and negative
directions. Similarly to fishmeal-based commercial feed, the typical zooplankton communities for carp
monoculture were formed, which correspond to the fish’s natural diet, and have been developed using
experimental feed. Based on these results, the plant-based experimental feed had no negative effect on
planktonic assemblages, which makes it suitable as a sustainable fish feed in pond aquaculture.
Supplementary Materials: The following are available online at http://www.mdpi.com/2073-4441/12/5/1338/s1,
Table S1: The list of rotifera species of the fishponds according to the treatments, and the calculated number of
individuals; CT—Control; FF—Fishmeal-based diet; PF—Plant meal-based diet (PF); SD—Standard deviation;
Table S2: The list of Crustacea species of the fishponds according to the treatments, and the calculated number of
individuals; CT—Control; FF—Fishmeal-based diet; PF—Plant meal-based diet (PF); SD—Standard deviation
Author Contributions: Conceptualization, É.K. and Z.J.S.; methodology, L.K.; software, L.K.; validation, L.K.;
formal analysis, F.T.; writing—original draft preparation, F.T.; writing—review and editing, L.K., K.Z., É.K., L.B.-N.
and Z.J.S.; visualization, L.K., F.T.; supervision, K.Z., Z.J.S.,; project administration, Zs.J.S; data analysis, F.T.,
L.B.-N.; sampling, F.T., L.B.-N.; zooplankton identification, K.Z. All authors have read and agreed to the published
version of the manuscript.
Funding: This research was funded by EU FP 7 Collaborative project (ARRAINA—Advanced Research Initiatives
for Nutrition & Aquaculture, Grant Agreement number 288925). The views expressed in this work are the sole
responsibility of the authors and do not necessary reflect the views of the European Commission.
Acknowledgments: The authors thank the SME partner of the project Aranykárász Bt. for the field work and the
NAIK HAKI staff for the help in sampling.
Conflicts of Interest: The authors declare no conflict of interest.
References
1. FAO. The State of World Fisheries and Aquaculture 2018—Meeting the sustainable development goals; Food and
Agriculture Organisation: Rome, Italy, 2018; Available online: http://www.fao.org/3/i9540en/I9540EN.pdf
(accessed on 3 May 2020).
2. Naeem, S.; Duffy, J.E.; Zavaleta, E. The functions of biological diversity in an age of extinction. Science 2012,
336, 1401–1406. [CrossRef]
3. Pechar, L. Impacts of long-term changes in fishery management on the trophic level water quality in Czech
fishponds. Fish. Manag. Ecol. 2000, 7, 23–31. [CrossRef]
4. Potužák, J.; Hůda, J.; Pechar, L. Changes in fish production effectivity in eutrophic fishponds—Impact of
zooplankton structure. Aquac. Int. 2007, 15, 201–210. [CrossRef]
5. Kiss, G. Statistical Reports—Catch Report—Year 2018; NAIK Research Institute of Agricultural Economics:
Budapest, Hungary, 2019. (In Hungarian)
6. Edwards, P. Aquaculture environment interactions: Past, present and likely future trends. Aquaculture 2015,
447, 2–14. [CrossRef]
7. Naylor, R.L.; Goldburg, R.J.; Primavera, J.H.; Kautsky, N.; Beveridge, M.C.M.; Clay, J.; Folke, C.; Lubchenco, J.;
Mooney, H.; Troell, M. Effect of aquaculture on worldfish supplies. Nature 2000, 405, 1017–1024. [CrossRef]
8. Wahab, M.A.; Rahman, M.M.; Milstein, A. Environmental effects of common carp (Cyprinus carpio L.) and
mrigal Cirrhinus mrigala (Hamilton) as bottom feeders in major Indian carp polycultures. Aquac. Res. 2002,
33, 1103–1117. [CrossRef]Water 2020, 12, 1338 12 of 14
9. Ćirić, M.; Subakov-Simić, G.; Dulić, Z.; Bjelanović, K.; Čičovački, S.; Marković, Z. Effect of supplemental feed
type on water quality, plankton and benthos availability and carp (Cyprinus carpio L.) growth in semi-intensive
monoculture ponds. Aquac. Res. 2015, 46, 777–788. [CrossRef]
10. Davidson, J.; Barrows, F.T.; Kenney, P.B.; Good, C.; Schroyer, K.; Summerfelt, S.T. Effects of feeding
a fishmeal-free versus a fishmeal-based diet on post-smolt Atlantic salmon Salmo salar performance, water
quality, and waste production in recirculation aquaculture systems. Aquac. Eng. 2016, 74, 38–51. [CrossRef]
11. Nagy, Z.; Havasi, M.; Gál, D.; Hancz, C. Effects of different European catfish feeds on production parameters
and water quality in limnocorrals. Acta Agrar. Kaposváriensis 2017, 21, 15–27.
12. Kaushik, S.J. Nutrient requirements, supply and utilization in the context of carp culture. Aquaculture 1995,
129, 225–241. [CrossRef]
13. Tacon, A.G.J. Feed formulation and evaluation for semi-intensive culture of fishes and shrimps in the
tropics. In Feeds for Small-Scale Aquaculture, Proceedings of the National Seminar-Workshop on Fish Nutrition and
Feeds, Iloilo, Philippines, 1–2 June 1994; Santiago, C.B., Coloso, R.M., Millamena, O.M., Borlongan, I.G., Eds.;
SEAFDEC Aquaculture Department: Iloilo, Philippines, 1996; pp. 29–43.
14. Dickson, M.; Nasr-Allah, A.; Kenawy, D.; Kruijssen, F. Increasing fish farm profitability through aquaculture
best management practice training in Egypt. Aquaculture 2016, 465, 172–178. [CrossRef]
15. Marković, Z.; Stanković, M.; Rašković, B.; Dulić, Z.; Živić, I.; Poleksić, V. Comparative analysis of using
cereal grains and compound feed in semi-intensive common carp pond production. Aquac. Int. 2016, 24,
1699–1723. [CrossRef]
16. Stoycheska, A.M.; Stamenkovska, I.J. Profitability of carp production on Macedonia and Serbia. Biotechnol.
Anim. Husb. 2017, 33, 103–113. [CrossRef]
17. Welker, T.L.; Lim, C.; Barrows, F.T.; Liu, K. Use of distiller’s dried grains with solubles (DDGS) in rainbow
trout feeds. Anim. Feed Sci. Technol. 2014, 195, 47–57. [CrossRef]
18. Searchinger, T.; Hanson, C.; Ranganathan, J.; Lipinski, B.; Waite, R.; Winterbottom, R.; Dinshaw, A.;
Heimlich, R.; Boval, M.; Chemineau, P.; et al. Creating A Sustainable Food Future. A Menu of Solutions to
Sustainably Feed More than 9 Billion People by 2050. World Resources Report 2013-14: Interim Findings; World
Resources Institute: Washington, DC, USA, 2014.
19. Waite, R.; Beveridge, M.; Brummett, R.; Castine, S.; Chaiyawannakarn, N.; Kaushik, S.; Mungkung, R.;
Nawapakpilan, S.; Philips, M. Improving Productivity and Environmental Performance of Aquaculture. Working
Paper, Installment 5 of Creating a Sustainable FoodFuture; World Resources Institute: Washington, DC, USA, 2014.
20. Tacon, A.G.; Metian, M. Feedmatters: Satisfying the feed demand of aquaculture. Rev. Fish. Sci. Aquac. 2015,
23, 1–10. [CrossRef]
21. Mráz, J.; Máchová, J.; Kozák, P.; Pickova, J. Lipid content and composition in common carp–optimization of
n-3 fatty acids in different pond production systems. J. Appl. Ichthyol. 2012, 28, 238–244. [CrossRef]
22. Steffens, W.; Wirth, M. Influence of nutrition on the lipid quality of pond fish: Common carp (Cyprinus carpio)
and tench (Tinca tinca). Aquac. Int. 2007, 15, 313–319. [CrossRef]
23. Trbović, D.; Marković, Z.; Milojković-Opsenica, D.; Petronijević, R.; Spirić, D.; Djinović-Stojanović, J.; Spirić, A.
Influence of diet on proximate composition and fatty acid profile in common carp (Cyprinus carpio). J. Food
Compos. Anal. 2013, 31, 75–81. [CrossRef]
24. Hardy, R.W. Utilization of plant proteins in fish diets: Effects of global demand and supplies of fishmeal.
Aquac. Res. 2010, 41, 770–776. [CrossRef]
25. Balon, E.K. Origin and domestication of the wild carp, Cyprinus carpio: From Roman gourmets to the
swimming flowers. Aquaculture 1995, 129, 3–48. [CrossRef]
26. Balon, E.K. The common carp, Cyprinus carpio: Its wild origin, domestication in aquaculture, and selection as
colored nishikigoi. Guelph Ichthyol. Rev. 1995, 3, 1–55.
27. Szűcs, I.; Stündl, L.; Váradi, L. Carp farming in Central and Eastern Europe and a case study in multifunctional
aquaculture. In Species and System Selection for Sustainable Aquaculture; Leung, P.S., Lee, C.S., O’Bryan, P.J.,
Eds.; Blackwell Publishing: Ames, Iowa, 2007; pp. 389–413.
28. Horváth, L.; Béres, B.; Urbányi, B. Ecological Pond Management, Fish Farming Based on Hydrobiology; Szent
István University, Department of Aquaculture: Gödöllő, Hungary, 2011. (In Hungarian)
29. Kestemont, P. Different systems of carp production and their impacts on the environment. Aquaculture 1995,
129, 347–372. [CrossRef]Water 2020, 12, 1338 13 of 14
30. Das, D.; Pathak, A.; Pal, S. Diversity of phytoplankton in some domestic wastewater-fed urban fish pond
ecosystems of the Chota Nagpur Plateau in Bankura, India. Appl. Water Sci. 2018, 8, 84. [CrossRef]
31. Kopp, R.; Řezníčková, P.; Hadašová, L.; Petrek, R.; Brabec, T. Water quality and phytoplankton communities
in newly created fishponds. Acta Univ. Agric. Silvic. Mendel. Brun. 2016, 64, 71–80. [CrossRef]
32. Hall, D.J.; Cooper, W.E.; Werner, E.E. An experimental approach to the production dynamics and structure of
freshwater animal communities. Limnol. Oceanogr. 1970, 15, 839–928. [CrossRef]
33. Howick, G.L. Zooplankton and Benthic Microinvertebrates in Lake Carl Blackwell. Proc. Okla. Acad. Sci.
1984, 64, 63–65.
34. Watanabe, T.; Kitajima, C.; Fujita, S. Nutritional values of live organisms used in Japan for mass propagation
of fish: A review. Aquaculture 1983, 34, 115–143. [CrossRef]
35. Millamena, O.M.; Peñaflorida, V.D.; Subosa, P.F. The macronutrient composition of natural food organisms
mass cultured as larval feed for fish and prawns. Isr. J. Aquac. 1990, 42, 77–83.
36. Ruttkay, A. Ecological study of carp nutrition. Kísérletügyi közlemények 1975, 67, 133–156. (In Hungarian)
37. Ruttkay, A. Fish growth rate and the food. Halászat 1973, 19, 131. (In Hungarian)
38. Bhuiyan, A.S.; Nessa, Q. Seasonal variation in the occurrence of some zooplankton in a fish pond. Bangladesh
J. Fish. Res. 1998, 2, 201–203.
39. Jhingran, V.G. Fish and Fisheries of India; Hindustan Publishing Corporation (India): New Delhi, India, 1975.
40. Marbà, N.; Krause-Jensen, D.; Alcoverro, T.; Birk, S.; Pedersen, A.; Neto, J.M.; Orfanidis, S.; Garmendia, J.M.;
Muxika, I.; Borja, A.; et al. Diversity of European seagras indicators: Patterns within and across regions.
Hydrobiologia 2013, 704, 265–278. [CrossRef]
41. Pechar, L.; Prikryl, I.; Faina, R. Hydrobiological evaluation of trebon fishponds since the end of the nineteenth
century. In Freshwater Wetlands and Their Sustainable Future: A Case Study of Trebon Basin Biosphere Reserve;
Kvet, J., Jneík, J., Soukopová, L., Eds.; The Parthenon Publishing Group: New York, NY, USA, 2002; Volume 28,
p. 31.
42. Ruttkay, A. Interactions between carp and zooplankton. XX. Halászati Tudományos Tanácskozás Halászatfejlesztés
1996, 19, 151–170. (In Hungarian)
43. Ruttkay, A. Polyculture, or the skeleton of a long research process. XXVII. Halászati Tudományos Tanácskozás,
Halászatfejlesztés 2003, 2, 187–194. (In Hungarian)
44. Donászy, E. A Zooplankton in Fishponds in Hungary; Országos Mezőgazdasági Minőségvizsgáló Intézet
Vízélettani Osztály: Budapest, Hungary, 1965; pp. 71–103. (In Hungarian)
45. Körmendi, S. Dél-Dunántúli halastavak kerekesféreg (Rotatoria) faunája. Nat. Som. 2010, 17, 77–82.
46. Koste, W. Rotatoria Die Radertiere Mitteleuropas; Gebruder Borntraeger: Stuttgart, Germany, 1978.
47. Bancsi, I. Identification keys for Rotifera, I. In Vízügyi Hidrobiológia; Országos Vízügyi Hivatal: Budapest,
Hungary, 1986; Volume 15. (In Hungarian)
48. Bancsi, I. Identification keys for Rotifera II. In Vízügyi Hidrobiológia; Országos Vízügyi Hivatal: Budapest,
Hungary, 1988; Volume 17. (In Hungarian)
49. Gulyás, P. Identification keys for Cladocera. In Vízügyi Hidrobiológia; Országos Vízügyi Hivatal: Budapest,
Hungary, 1974; Volume 2. (In Hungarian)
50. Gulyás, P.; Forró, L. Identification keys for Cladocera Vízi Természet- és Környezetvédelem 9; Környezetgazdálkodási
Intézet, TOI Környezetvédelmi Tájékoztató Szolgálat: Budapest, Hungary, 1999. (In Hungarian)
51. Flössner, D. Krebstiere, Crustacea: Kiemen- und Blattfüsser, Branchiopoda, Fischläuse, Branchiura, Die Tierwelt
Deutschlands 60; VEB Gustav Fischer Verlag: Jena, Germany, 1972.
52. Dévai, I. Identification keys for Copepoda (Calanoida and Cyclopoida). In Vízügyi Hidrobiológia; Országos
Vízügyi Hivatal: Budapest, Hungary, 1977; Volume 5. (In Hungarian)
53. Gulyás, P.; Forró, L. Identification keys for Copepoda (Calanoida and Cyclopoida). Vízi Természet- és Környezetvédelem
14; Környezetgazdálkodási Intézet, TOI Környezetvédelmi Tájékoztató Szolgálat: Budapest, Hungary, 2001.
(In Hungarian)
54. Németh, J. Methods of biological water classification. In Vízi Természet- és Környezetvédelem 7;
Környezetgazdálkodási Intézet, TOI Környezetvédelmi Tájékoztató Szolgálat: Budapest, Hungary, 1998;
pp. 139–143. (In Hungarian)
55. ISO. Water Quality—Determination of Nitrogen—Part 1: Method Using Oxidative Digestion with Peroxodisulfate;
International Organization for Standardization: Geneva, Switzerland, 1997.You can also read


