Model-Based Analysis of Nitrate Concentration in the Leachate-the North Rhine-Westfalia Case Study, Germany
←
→
Page content transcription
If your browser does not render page correctly, please read the page content below
Article

Model-Based Analysis of Nitrate Concentration in
the Leachate—the North Rhine-Westfalia Case Study,
Germany
Frank Wendland 1,*, Sabine Bergmann 2, Michael Eisele 2, Horst Gömann 3, Frank Herrmann 1,
Peter Kreins 4 and Ralf Kunkel 1
 1 Forschungszentrum Juelich, IBG-3, 52425 Juelich, Germany; f.herrmann@fz-juelich.de (F.H.); r.kunkel@fz-
   juelich.de (R.K.)
 2 LANUV NRW, 47051 Duisburg, Germany; Sabine.Bergmann@lanuv.nrw.de (S.B.);

   michael.eisele@lanuv.nrw.de (M.E.)
 3 LWK NRW, 50765 Köln-Auweiler, Germany; Horst.Goemann@LWK.NRW.DE

 4 Thünen-Institute, 38116 Braunschweig, Germany; peter.kreins@thuenen.de

 * Correspondence: f.wendland@fz-juelich.de

 Received: 20 December 2019; Accepted: 11 February 2020; Published: 15 February 2020

 Abstract: Reaching the EU quality standard for nitrate (50 mg NO3/L) in all groundwater bodies is
 a challenge in the Federal State of North Rhine-Westfalia (Germany). In the research project
 GROWA+ NRW 2021 initiated by the Federal States’ Ministry for Environment, Agriculture, Nature
 and Consumer Protection, amongst other aspects, a model-based analysis of agricultural nitrogen
 inputs into groundwater and nitrate concentration in the leachate was carried out. For this purpose,
 the water balance model mGROWA, the agro-economic model RAUMIS, and the reactive N
 transport model DENUZ were coupled and applied consistently across the whole territory of North
 Rhine-Westfalia with a spatial resolution of 100 m × 100 m. Besides agricultural N emissions, N
 emissions from small sewage plants, urban systems, and NOx deposition were also included in the
 model analysis. The comparisons of the modelled nitrate concentrations in the leachate of different
 land use influences with observed nitrate concentrations in groundwater were shown to have a
 good correspondence with regard to the concentration levels across all regions and different land-
 uses in North Rhine-Westphalia. On the level of ground water bodies (according to EU ground
 water directive) N emissions exclusively from agriculture led to failure of the good chemical state.
 This result will support the selection and the adequate dimensioning of regionally adapted
 agricultural N reduction measures.

 Keywords: nitrate; groundwater; source apportionment; modelling; nitrogen sources; leachate rate

1. Introduction
     Excessive nitrate inputs into groundwater have been recognized as a main reason for failing
drinking water standards for decades [1–6]. Agricultural N emissions originating from mineral or
organic fertilizers are regarded as the most relevant source of nitrate in groundwater worldwide [7].
Accordingly, strategies to cope with the nitrate pollution of groundwater are focused on controlling
the agricultural sources of nitrate [8,9]. In Europe, this is reflected in the water legislation at the EU
level, that is, the EU Water Framework Directive (EU-WFD) [10], the EU Marine Strategy Framework
Directive [11], and the EU Nitrates Directive [12], obliging the polluter to implement measures to
reduce the nitrogen impact on groundwater.

Water 2020, 12, 550; doi:10.3390/w12020550                                       www.mdpi.com/journal/water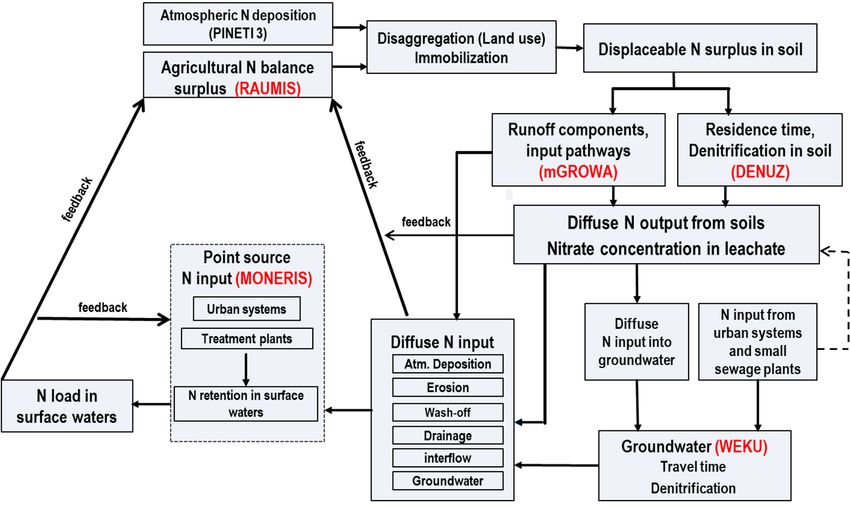
Water 2020, 12, 550                                                                               2 of 18

      The EU-WFD [10] requires the assessment of the groundwater status at the level of groundwater
bodies for both quantitative and qualitative status. The latter is assessed by comparing measured
concentrations and trends at groundwater observation wells to groundwater quality standards or
threshold values [13] and by extrapolating the findings at the monitoring sites to the area represented
by these monitoring sites. As suggested by the European Commission in a guidance document on
groundwater status and trend assessment [14] groundwater bodies in the EU are classified as being
not in good status in cases of 20% or more of the total groundwater body area being polluted [15–17].
Consequently, a groundwater body is classified as failing in terms of good status due to nitrate in
cases where the area represented by the monitoring station(s) shows nitrate concentrations above 50
mg NO3/L and/or rising trends exceed 20% of the total groundwater body area.
      In the groundwater bodies failing in terms of good status due to nitrate, measures reducing the
nitrogen input into the aquifer have to be implemented [10,11]. Taking nitrate concentrations in
groundwater above 50 mg NO3/L as a reference, the implementation of measures is limited to
oxidized aquifers. Significant denitrification capacities are lacking in oxidized aquifers, and thus
nitrate concentrations in the upper groundwater are directly correlated to the nitrate input [18,19].
      In reduced aquifers, such a relationship is missing due to denitrification processes [20–23], and
thus the related groundwater bodies are in good status with regard to nitrate in spite of high nitrogen
inputs. Consequently, no measures to reduce N input have to be implemented in such cases. In North
Rhine-Westfalia, such aquifers occur in the Northern parts of the Lower Rhine Embayment and parts
of the Westphalian lowland. In this context, it must be remembered that the fossil pyrite and/or lignite
particles involved in the denitrification process in aquifers are exhaustible resources [24,25]. Once
this inventory of an aquifer is consumed, a dramatic nitrate concentration rise in groundwater can be
observed [26,27]. Therefore, it is in generally not expedient to allow higher nitrogen inputs for
reduced aquifers as is done for oxidized aquifers [28].
      In order to ensure that the nitrate concentrations in oxidized aquifers will not exceed 50 mg/L
and to conserve the natural denitrification capacity of reduced aquifers, the German Working Group
on water issues of the Federal States and the Federal Government (LAWA) requires that the nitrate
concentration in the leachate should not exceed 50 mg NO3/L [28]. Similar considerations are reflected
in the groundwater strategies of other countries [29,30]. Against this background, the nitrate
concentration in the leachate can be considered as the decisive starting-point to determine the N
reduction required [31].
      In order to implement measures efficiently, a stepwise procedure can be used [18,32]. At first,
the source areas contributing to measured nitrogen concentrations in groundwater beyond quality
standards are identified within the groundwater bodies failing good chemical status. This is achieved
by using modeled land use specific nitrate concentrations in the leachate to indicate nitrogen emission
into groundwater. Subsequently, the absolute N reduction required to reach the groundwater quality
target in the areas concerned is determined. Finally, regionally adapted and accurately dimensioned
N reduction measures are selected and implemented.
      Thus far, the model approach developed by the authors has focused on N emissions from
agriculture, assuming that these N sources mainly have to be considered for determining the N
reduction need [33–35]. The predominance of agricultural N sources in rural areas is quite obvious.
In densely populated and industrialized regions, however, there are clear indications that also non-
agricultural N sources may contribute to high nitrate concentrations [36,37].
      With an average population density of 525 inhabitants/km2 [38], the Federal State of North
Rhine-Westfalia represents a prime example for a densely populated region in Germany. In light of
the above, there is a debate as to what extent non-agricultural N emissions contribute to high nitrate
concentrations. In cases where the nitrate concentrations in the leachate above 50 mg/L can be
attributed to N sources other than agricultural N sources, agriculture alone cannot be obliged to
implement N reduction measures according to EU-WFD requirements [10]. In the regions where this
is the case, N reduction measures to counteract non-agricultural N sources would have to be
implemented.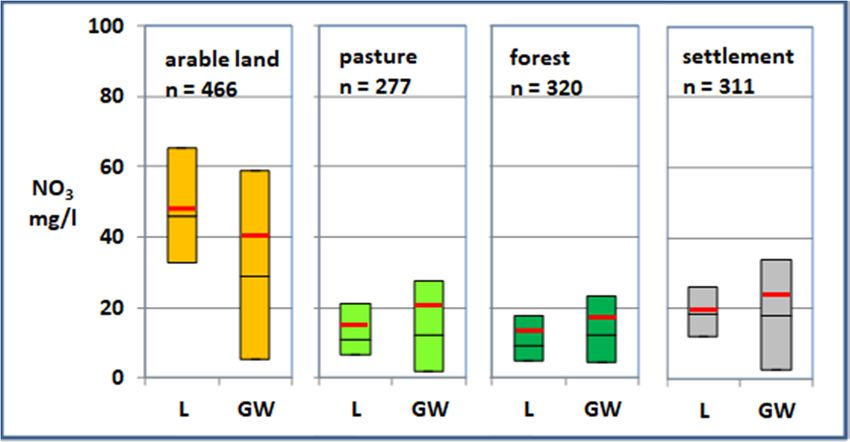
Water 2020, 12, 550                                                                                     3 of 18

      Against this background, a simultaneous consideration of the N emissions from all relevant N
sources is indispensable for assessing the entire N loading of the leachate as well as the N inputs into
groundwater and surface waters. In practical terms, this means that in addition to the agriculturally
produced N emissions (agricultural N balance surplus, atmospheric NHx deposition), the N
emissions from urban systems; small sewage treatment plants seeping into groundwater; and the
atmospheric NOx deposition from industry, household, and traffic should also be determined, doing
so enables the identification of the “hot-spot areas”, wherein the nitrate concentration in the leachate
exceeds 50 mg/L. Additionally, the proportion of the individual N sources with regard to the
modelled nitrate concentration in the leachate in a certain region can be assessed objectively. The
latter is an important prerequisite for addressing the regionally relevant N emission source(s) and for
deriving correctly dimensioned N reduction measures.

2. Materials and Methods
     The co-operation project GROWA+ NRW 2021 initiated by the Federal States’ Ministry for
Environment, Agriculture, Nature and Consumer Protection started at the end of 2015. In the context
of the GROWA+ NRW 2021 project, the coupled agro-economic-hydrologic model network RAUMIS-
mGROWA-DENUZ-WEKU-MONERIS [31] is applied and further developed in order to support the
implementation process of the EU-Water Framework Directive, the EU Nitrates Directive, and the
EU Marine Strategy Framework Directive in the Federal State of North Rhine-Westphalia. The
questions to be answered in the GROWA+ NRW 2021 project include
•     The determination of the actual N input into groundwater and surface waters;
•     The identification of actual “hot spot” areas of N pollution;
•     The assessment of the necessary reduction of N emissions to reach the EU quality standards;
•     The prediction of the time lags until N reduction measures will show effect (target achievement).
     Nitrate concentration in the leachate is determined within the framework of an area-
differentiated modeling of the diffuse and point source N inputs into groundwater and surface
waters. For this purpose, the model system [31,32], which had already proven its suitability in macro-
scale applications on the level of States and river basins in Germany, was applied in NRW on the
basis of statewide available input data. The individual sub-models and their interplay are
documented in the literature [32–36] and will only be briefly described here. The interplay of the
individual sub-models is summarized in Figure 1.

      Figure 1. Simulation of nitrate concentration in the leachate in the framework of the coupled model
      system RAUMIS-mGROWA-DENUZ-WEKU-MONERIS.
Water 2020, 12, 550 4 of 18
In the agricultural sector model RAUMIS [39], a set of agro-environmental indicators is linked
to agricultural production. Currently, the model comprises indicators such as fertilizer surplus
(nitrogen, phosphorus, and potassium), pesticides expenditures, a biodiversity index, and corrosive
gas emissions. These indicators help to evaluate direct and indirect environmental impacts of policy-
driven changes in agricultural production. Regarding diffuse water pollution, the indicator “nitrogen
surplus” is of particular importance. Agricultural statistics with data, for instance on crop yields,
livestock farming, and land use, were used to balance the nitrogen supplies and extractions for the
agricultural area. The long-term nitrogen balance averaged over several vegetation periods is
calculated by considering the organic nitrogen fertilization, the mineral nitrogen fertilization, the
symbiotic N fixation, the atmospheric N inputs, the compost and sewage sludge spreading, and the
N removal with the crop substance [40,41]. As a rule, the difference between nitrogen supplies,
primarily by mineral fertilizers and farm manure, and nitrogen extractions, primarily by field crops,
leads to a positive N balance.
A certain amount of the mineral N surpluses in soils is denitrified to molecular nitrogen.
Denitrification losses in the soil are calculated using the DENUZ model as a function of the diffuse N
surpluses, denitrification conditions, and the residence time of percolation water in the soil according
to Michaelis–Menten kinetics [31,34]. The kinetical parameters are assessed on the basis of observed
denitrification rates in soils [42,43] according to the geological substrate, the influence of
groundwater, and perching water of the soils and the average residence time of perching water in
the soil.
In order to determine the diffuse N inputs into groundwater and surface waters according to
individual pathways, the N outputs from soil were subsequently coupled to runoff components. The
latter were quantified with the water balance model mGROWA [44,45]. The mGROWA modelling
approach comprises several sequential parts. Within the basic part, the hydrologic processes at the
earth’s surface and in the root zone of soil are simulated. In particular, soil moisture dynamics
including percolation water movement, capillary rise from groundwater to the root zone, actual
evapotranspiration, and total runoff generation are calculated on the basis of the multilayer soil water
balance model BOWAB [46]. Total runoff values are used to derive runoff components including the
leachate rate and input pathways for nutrients into groundwater and surface water.
Nitrate inputs into an aquifer may be reduced in groundwater by denitrification processes in a
reduced (oxygen-free) groundwater milieu. This reactive nitrate transport in reduced groundwater
is modelled using the WEKU model [47,48] assuming a first-order denitrification kinetics depending
on the nitrate inputs and the residence time in groundwater with a reaction constant of 0.17–0.56 a-1
[49–51].
N inputs from point sources and urban areas were taken into account using the procedures
elucidated in the MONERIS model [52]. The nitrogen load in surface waters within a catchment is
calculated by integration of the diffuse nitrogen inputs into the surface waters via the considered
pathways calculated for each grid cell over the catchment area of the considered station plus the sum
of the N inputs from point sources. The observed N loads, however, are influenced by nitrogen
retention processes in the river itself, which may reduce the nitrogen loads of rivers. Nitrogen
conversion in rivers is considered using the size of the catchment area, total runoff, the size of open
water areas and temperature as inputs [53].
The summation of the modelled N inputs from diffuse and point sources minus the riverine N
retention were compared to the measured N loads from monitoring stations. The observed discharge
and N total concentrations were transformed into Ntot-loads according to the OSPAR method [54].
The results of three sub-models were used for the simulation of the nitrate concentration in the
leachate, namely, the mean long-term leachate rate determined with the water balance model
mGROWA [44], the agricultural N balance surplus assessed on the basis of the agro-economic model
RAUMIS [39], and the reactive N transport in soils determined on the basis of the DENUZ model
[31].
Atmospheric N deposition was taken into account, separated for the agricultural-related NHx
emission and the atmospheric NOx deposition originating from households, industry, and transportWater 2020, 12, 550 5 of 18
[55]. Both atmospheric N sources contribute to the diffuse N output from soils. Additionally, the N
emissions from urban systems and small sewage treatment plants were considered.
Equation (1) shows the general relation between the N sources and the leachate rate in order to
determine the nitrate concentration in the leachate. For an area covering analysis on the Federal State
level, the individual terms of Equation (1) were determined:
(1)
where
CNO3: nitrate concentration in the leachate (mg/L);
Qsw: leachate rate (mm/year);
KKA: N emissions from small sewage treatment plants (kg N/(KKA and year));
KS: N emissions from urban systems (kg N/(community and year));
Nsoil: diffuse N output from soils (kg N/(ha and year));
4.43: factor to convert nitrate-N (mg/L) to nitrate-NO3 (mg/L)(-);
0.01: factor to convert mm in liter (-).
The leachate rate (QSW) was determined on the basis of the mGROWA model [39], which
simulates in the basic part the hydrologic processes at the earth’s surface and in the root zone of soils.
In particular, soil moisture dynamics including the movement of the leachate in soils, capillary rise
from groundwater to the root zone, actual evapotranspiration, and total runoff generation were
calculated in daily time steps on the basis of grass reference evapotranspiration, land use-specific
crop coefficients, and a topography correction function. Additionally, mGROWA calculated the
water balance for impervious surfaces (e.g., sealed surfaces in urban areas) and open water surfaces
using approaches adapted to specific storage characteristics. The second part in mGROWA separated
total runoff into the direct runoff components (natural interflow, drainage runoff, surface runoff,
direct runoff from urban areas) and groundwater recharge from the total runoff by using base flow
indices [56]. The leachate rate results from the difference between surface runoff including runoff
from urban areas and total runoff and designates the water volume leaving the root zone downwards.
It is in this regard not identical to groundwater recharge, which designates the water volume
infiltrating into the aquifer.
The diffuse N output from soil (Nsoil) included N originating from two N sources, on one hand
the N output from soil originating from agriculture (Nsoil(agri)), and on the other hand the N output
from soil originating from NOx deposition. The diffuse N output from soil originating from
agriculture (Nsoil(agri)) was derived according to Equation (2a) considering the agricultural-related
N loads. The corresponding diffuse N output from soil originating from NOx (Nsoil (NOx)) was
derived according to Equation (2b). In both cases, two important processes controlling the N losses
from soils, these being N immobilization (NI) and denitrification (ND), needed to be considered.
The diffuse N output from soil originating from agriculture (Nsoil(agri)) included the
agricultural N balance surplus (Nu) on a community level averaged over several vegetation periods
provided by the regionally differentiating agricultural sector model RAUMIS [40]. As a rule, the
difference between nitrogen supplies, primarily by organic and mineral fertilizers, and the nitrogen
extractions, primarily by field crops, leads to a positive N balance for the agriculturally used areas
(Nu).
(2)
(3)
where
Nsoil (agri): N output from soil originating from agriculture (kg N/ha·year);
Nsoil (NOx): N output from soil originating from NOx (kg N/ha·year);Water 2020, 12, 550 6 of 18
NU: mean agricultural N balance surplus (kg N/ha·year);
NHx: mean atmospheric NHx deposition (kg N/ha·year);
NI: mean N immobilization in soil (kg N/ha·year);
ND: mean denitrification in soil (kg N/ha·year).
The NHx emission (NHx), particularly from livestock, is the second most important agricultural
N source that contributes to the diffuse N output from soil originating from agriculture (see Equation
(2a)). It can be assumed that the entire agricultural share in atmospheric deposition was represented
by the NHx deposition. Equivalent to the NHx deposition, it was assumed that the entire NOx
deposition originating from households, traffic, and industry represented the diffuse N output from
soil originating from non-agriculture N sources (Nsoil(NOx)).
Both NHx and NOx were derived from an official German-wide dataset on atmospheric
Ndeposition determined in the framework of the PINETI project series (PINETI-3, Pollutant INputan
EcosysTemImpact) [55] for the time series 2013-2015. In order to adapt the spatial resolution of the
PINETTI-3 datasets to the spatial resolution of the modelling on NRW scale, the land-use specific
NHx and NOx values available as 1 × 1km grids were disaggregated according to the land use grids
of 100 × 100 m. Apart from its impact on agriculturally used land, the atmospheric NHx and NOx
deposition also affected forests and settlement areas, and thus it had to be considered as area-
covering data in the modelling of the nitrate concentration in the leachate.
The NOx deposition, as well as the sum of agricultural N balance surpluses and atmospheric
NHx deposition, do not correspond to the diffuse N output from soils as two important processes
controlling the N losses from soils, that is, N immobilization (NI) and denitrification (ND) have to be
considered. For pasture and forested areas, it is assumed that a certain part of the N input into soils
is immobilized in the soil organic matter [57] and contributes to the development of biomass. The
immobilization rates depend on the interplay of certain site conditions, for instance, leachate rates,
soil texture, and topography. They can consequently be regarded as regionally variable and are
determined in the framework of the model calibration for pasture and forested areas. For arable land,
however, a significant N immobilization in soil can be neglected [33].
The N load resulting from the summation of agricultural N balance surplus, atmospheric NHx
and NOx deposition, and N immobilization in soil is defined as the displaceable N surplus in soil (see
Figure 1). From this intermediate result, the N output from soil is derived by subtracting the N losses
in soil due to denitrification. In contrast to N immobilization, denitrification in soil takes place
independent from the type of land cover. Equation (3) specifies the DENUZ approach to determine
denitrification rates in soil.
(4)
where
Nstsoil: N output from soil from agricultural N sources and NOx deposition after residence time (tsoil)
(kg N/(ha·year));
tsoil: residence times in soil (year);
Dmax: maximum yearly denitrification rate in soil (kg N/(ha·year));
k: Michaelis-constant (kg N/(ha·year));
0: displaceable N surplus in soils (kg N/(ha·year)).
Using observed denitrification rates as a reference, the maximum denitrification rate (Dmax) was
assessed [18]. This was performed on the basis of a ranking of the soils predominantly according to
their groundwater and perching water influence, as well as their organic carbon content [34,35].
Denitrification rates in soils were determined as a relationship between the realizable maximum
annual denitrification rates assigned by the denitrification conditions and the related soil-specific
reaction rates of denitrification (k) under consideration of the effective residence times of the leachate
in the root zone (t). In this way, it is assumed that, for example, in a case were the residence time in aWater 2020, 12, 550 7 of 18
certain soil amounts to 6 months, the extent of denitrification is half of the maximum denitrification
rate per year for the given soil.
The final result of the DENUZ model, that is, the diffuse N output from soils from agricultural
N sources and NOx deposition, was subsequently used to calculate the nitrate concentration in the
leachate according to Equation (1). Additionally, the N outputs from urban systems (KS) and small
sewage treatment plants (KKA) (see Equation (1)) were derived from directories about inhabitants
and data about water management facilities (for the North Rhine-Westfalia-specific numbers, see
Section 3.2.1).
3. Results
All input parameters and model results to calculate the nitrate concentration in the leachate were
processed as area-covering data for the entire state of Northrhine-Westfalia with a spatial resolution
of 100 m × 100 m. This resulted in a subdivision of the area of the Federal State into around 3.4 Mio
individual grids.
The leachate rate (see figure 2) diluted the N emissions from agricultural and non-agricultural
N sources, as specified in Equation (1). It was calculated with the mGROWA model [39] for the
hydrological reference period of 1981–2010. Using mean long-term leachate rates as a reference has
two advantages with regard to the modelled nitrate concentrations in the leachate. On one hand, as
a short-term climate-induced blurring of leachate rates was excluded, the modelled nitrate
concentrations in the leachate were representative of the regional long-term hydrologic conditions.
On the other hand, the regional varying N emissions were related to a uniform leachate rate, which
was of importance when the impact of N reduction measures was assessed.
Figure 2. Mean long-term leachate rate of the hydrologic period of 1981–2010.Water 2020, 12, 550 8 of 18
The mean long-term leachate rates shown in Figure 2 reveal wide disparities between the
regions. Whereas leachate rates of 600 mm/year or more frequently occurred in all consolidated rock
regions (e.g., Rhenish Massif), leachate rates of less than 200 mm/year may have occurred in the
southern part of the Lower Rhine embayment. There, the dilution of N emissions from the different
N sources was up to three times higher in the consolidated rock regions.
3.1. Nitrogen Emissions from Agricultural Sources and Resulting Nitrate Concentrations in the Leachate
3.1.1. Agricultural N Sources
The N sources taken into account for determining the N output from soil originating from
agriculture, that is, the agricultural N balance surplus and the atmospheric NHx deposition, are
shown in Figure 3a,b, respectively.
(a) (b)
Figure 3. (a) Agricultural N balance surplus and (b) atmospheric NHx deposition.
In order to guarantee that crop- and withdrawal-related fluctuations were biased out, the
agricultural N balance surplus on a community level provided by the RAUMIS model [40] was
determined as an averaged value for the period of 2014–2016. In total, the agricultural N balance
surplus in North Rhine-Westphalia summed up to around 82.400 t N/a. Major differences became
evident in cases where this sum was considered regionally differentiated (see Figure 3a). Agricultural
N balance surpluses of less than 25 kg N/ha and year were found in regions where extensive grassland
dominates (e.g., Rhenish Massif). In the food crop cultivation regions (e.g., Lower Rhine Embayment),
where the N demand was predominantly covered by well-controllable mineral fertilizer applications,
the agricultural N balance surpluses ranged between 25 and 50 kg N/ha per year. In contrast, nitrogen
surpluses above 50 kg N/ha per year were determined for regions where livestock density was so
high that the amount of organic fertilizers (and additionally applied mineral fertilizers) exceed the N
demand of the agriculturally used land. Areas in white indicate the non-agriculturally used forest
and settlement areas.
In the agricultural regions with intensive livestock production in the north, the atmospheric NHx
deposition provided by the PINETI model summed up to more than 20-25 kg N/ha per year and
locally to more than 30 kg N/ha per year [58] (see Figure 3b). To the south, that is, in greater distance
from the regions with intensive livestock production, NHx deposition rates between 10 and 20 kg
N/ha per year predominated. This region extended from the northern part of the Lower RhineWater 2020, 12, 550 9 of 18
embayment in the west to the Weserbergland in the east. In the southern part of the Lower Rhine
Embayment, crop farms predominate. There, the atmospheric NHx deposition rarely exceeded 10 kg
N/ha per year. The same NHx deposition rates were determined for the most southern parts of the
Rhenish Massif situated in the lee of the Sauerland Mountains. Averaged over the entire Federal State
of North Rhine-Westfalia, the atmospheric NHx deposition corresponded to a total of around 44,000
t N/a.
3.1.2. N Output from Soils Originating from Agricultural N Emission Sources
In order to determine the N output from soils, N immobilization and denitrification (in soil) was
considered. N immobilization is related to the sum of the agricultural N balance surpluses and
atmospheric NHx deposition. Whereas the determined N immobilization rates comprised around
50% for the land-use category pasture, the N immobilization rates for the land-use categories of
coniferous forests and deciduous forests were in the range of 10% and 20%, respectively. Averaged
over the entire Federal State of North Rhine-Westfalia, N immobilization retained around 18.500 tons
N/a. Consequently, the displaceable N surplus in soil, that is, the sum of agricultural N balance
surpluses plus atmospheric NHx deposition minus N immobilization was in the range of around
108,000 t N/a.
The displaceable N surplus in soil minus the N losses in soil due to denitrification modeled with
the DENUZ model (figure 4a) determined the N output from soils (see Figure 4b). In the shallow
brown earth soils of the Rhenish Massif, denitrification reduced the displaceable N surplus in soil to
less than 25%. The low denitrification rates were due to the interaction of small residence times in the
soil (often less than 3 months) and poor denitrification conditions in the soil.
(a) (b)
Figure 4. (a) Denitrification losses in soil relative to the displaceable N surplus in soil, and (b) N output
from soils originating from agricultural sources.
In the fertile loess regions of North Rhine-Westfalia (Lower Rhine embayment, Soester Börde),
up to 50% of the agricultural N input into soils was denitrified. Although the denitrification capacity
of the predominantly occurring luvisol was quite unfavorable, these soils displayed a high water
storage capacity and relatively low leachate rates (see Figure 2). Consequently, residence times in soil
was often in the range of 1 year (or more), and thus the maximum possible denitrification rates in soil
could nearly be reached or even be exceeded. As shown in Figure 4b, the resulting N output from
soils in these regions ranged between 25 and 50 kg N/ha per year.Water 2020, 12, 550 10 of 18
Generally, high displaceable N surpluses in soil occurred in the Münsterland basin in the
Northern part of North Rhine-Westfalia. There, sandy podzol soils showing poor denitrification
capacities alternated with loamy lowland soils (e.g., Gleyic soils) showing high denitrification
capacities. Consequently, denitrification losses of more than 75% may be achieved in the lowland
soils, whereas denitrification rates in the pozol soils hardly exceeded 25% (see Figure 4a).
Accordingly, soils with N outputs of less than 25 kg N/ha per year and soils with N losses of more
than 75 kg N/ha per year occurred closely adjacent to one another (see Figure 4b). In the core of the
Münsterland, vast areas with N outputs from the soil in the range of 75 kg N/ha per year were
identified. There, soils with moderate denitrification capacities coincided with very high displaceable
N surpluses in soil. Clearly recognizable in Figure 4b is the metropolitan area Rhein-Ruhr. As there
were no other agricultural N inputs other than the atmospheric NHx deposition, the N output from
soil that can be assigned to agricultural N emissions was below 5 kg N/ha per year.
Averaged over the entire Federal State of North Rhine-Westfalia, around 45% of the displaceable
N surplus in soil (around 108,000 t N/a) was denitrified, and thus the N output from soil originating
from agricultural N emissions was reduced to approximately 69,000 t N/a.
3.1.3. Nitrate Concentration in the Leachate Originating from Agricultural Sources
The N output from soil attributed to agricultural N emissions (Figure 4b) were combined with
the leachate rates (Figure 2) to determine the nitrate concentration in the leachate originating from
agricultural sources (see Figure 5a). In Figure 5b, the areas where a nitrate concentration in the
leachate exceeded 50 mg NO3/L are highlighted.
(a) (b)
Figure 5. (a) Nitrate concentration in the leachate originating from agricultural sources, and (b) areas
showing nitrate concentrations in the leachate above 50 mg NO3/L due to agricultural N emissions.
For many areas in the Münsterland, particularly high values arose due to the high livestock
density, which led to an accordingly high nitrogen balance surplus. In the Lower Rhine Embayment,
nitrate concentrations in the leachate between 50 and 75 mg/L predominated. There, moderate
nitrogen balance surpluses arising from cash crop farms were combined with low leachate rates.
Nitrate concentrations in the leachate below 25 mg/L could be found in the urbanized areas of North
Rhine-Westfalia, as well as in the Rhenish Massif, where high leachate rates coincided with low N
emissions. Figure 5b illustrates in this regard how yet again there was a remarkable extent of areas
with nitrate concentrations in the leachate above 50 mg/L in the Lower Rhine Embayment and the
Münsterland.Water 2020, 12, 550 11 of 18
3.2. Nitrogen Emissions from Non-Agricultural Sources and Resulting Nitrate Concentrations in the
Leachate
The calculation of the nitrate concentration in the leachate due to non-agricultural N sources
included on one hand the N emission from small sewage treatment plants and urban systems. On the
other hand, it included the N outputs from soil attributed to the NOx deposition from industry, traffic,
and households (see Equation (2b)).
3.2.1. Non-Agricultural N sources
The N output from urban systems (Figure 6a) was quantified on the basis of data provided by
an actual management report about the development and level of sewage disposal in North Rhine-
Westphalia [59]. According to this report, the total amount on nitrogen emitted from municipal waste
water disposals (including indirect discharges) divided by all inhabitants resulted in 11 g N per day.
Under the assumption that 15% of this disposal was released into groundwater due to leakage from
the waste water systems, a uniform nitrogen release from urban systems into groundwater of 1.65 g
N per inhabitant per day was estimated. The N losses from urban systems determined in this way
ranged between 10 kg and 50 kg N/ha per year. The highest values occurred, as expected, in densely
populated regions along the river Rhine and the Ruhr area. On Federal State scale, the total N losses
from urban systems accumulated to approximately 11.200 t N/a.
(a) (b)
Figure 6. (a) Nitrogen output from urban systems and small sewage treatment plants, and (b)
atmospheric NOx deposition (2013–2015).
For considering the N output from small sewage treatment plants, the recorded annual N
emissions of around 20,000 individual facilities emitting into groundwater were taken into account
[60]. For this purpose, the recorded N loads were assigned to the corresponding 100 × 100 m grids. In
most of all grids concerned, the N outputs from small sewage treatment plants showed values below
25 kg N/ha per year. Higher N outputs occurred locally only, but could reach 100 kg N/ha per year
and more. At the Federal State level, the total N loss of the small sewage treatment plants summed
up to around 500 t N/a. As the visibility of the individual 100m grids was limited, the N outputs from
small sewage treatment plants are shown in Figure 6a, together with the N output from urban
systems.
The atmospheric NOx deposition originating from households, industry, and transport was
provided from a Germany-wide dataset on atmospheric N deposition [58]. Depending on the region,
the N output from soils from NOx deposition ranged between 10 kg N/ha per year (see FigureWater 2020, 12, 550 12 of 18
6b). For the total area of NRW, this relatively low average annual atmospheric NOx deposition
summed up to around 20,000 tons of N/a.
3.2.2.. Nitrate Concentration in the Leachate Originating from Non-Agricultural N Sources
The N output attributed to urban systems and small sewage treatment plants (Figure 6a), as well
as the N output from soil resulting from NOx deposition (Figure 6b) was combined with the leachate
rates (Figure 2) to determine the nitrate concentration in the leachate originating from non-
agricultural sources (Figure 7).
(a) (b)
Figure 7. (a) Nitrate concentration in the leachate originating from urban systems and small sewage
treatment plants, and (b) nitrate concentration in the leachate originating from the N output from soil
due to NOx deposition.
Figure 7a shows that the nitrate concentration in the leachate originating from urban systems
and small sewage treatment plants ranged in most areas between 10 and 25 mg/L (e.g., in the entire
Ruhr area). It was evident that the nitrate concentration in the leachate originating from these sources
only to a minor extent and locally exceeds 50 mg/L. As the areas concerned did not exceed 20% of the
area of a groundwater body, no measures to reduce the N emissions from urban systems and small
sewage treatment plants had to be included in the program of measures according to EU-WFD
requirements [14]. This, however, does not detract from the fact that measures to reduce N output
from urban systems may be necessary to improve surface water quality.
Figure 7b shows the nitrate concentration in the leachate originating from NOx deposition. For
the latter, the denitrification in soil was accounted for as described in Equation (2b). In most areas of
North Rhine-Westfalia, the nitrate concentration in the leachate originating from NOx deposition was
less than 10 mg/L. In the southern part of the Lower Rhine Embayment, values of up to 25 mg/L
occurred due to the low leachate rates (Figure 2). In conclusion, NOx deposition did not at all lead to
NO3 concentrations in the leachate above 50 mg/L.
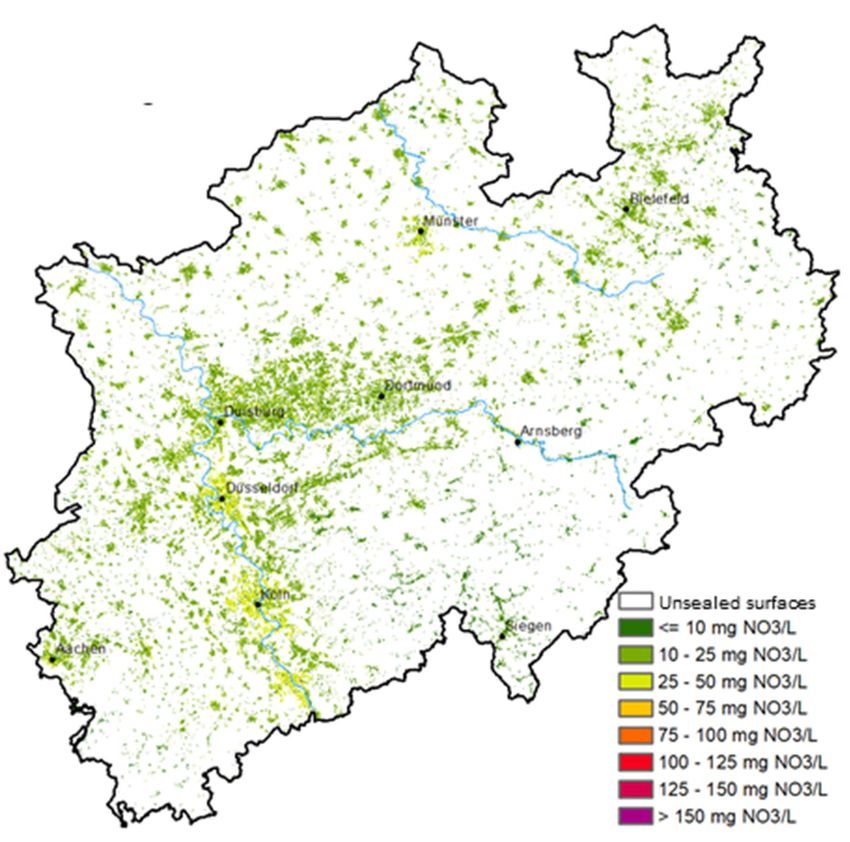
3.3. Plausibility Check of Modelled Nitrate Concentration in the Leachate
For comparing (modeled) nitrate concentrations in the leachate with (observed) nitrate
concentrations in groundwater, it was necessary to merge the N emissions from the individual N
sources. The corresponding nitrate concentrations in the leachate are represented in Figure 8 as the
underlying colored areas.Water 2020, 12, 550 13 of 18
Figure 8. Plausibility check of the mean annual nitrate concentration in the leachate. The dots show
observed values at groundwater monitoring sites—the underlying colored areas are the modelled
nitrate concentrations in the leachate per grid.
The modelled nitrate concentration in the leachate was compared to nitrate concentrations
observed at around 1500 groundwater monitoring stations from the upper aquifer for the period 2014
to 2017. In Figure 8, the mean values of the observed nitrate concentrations at the groundwater
monitoring stations are represented as dots. For the comparison, the same class widths and the same
color gradation were selected for both the underlying areas and the dots. The proportion of the main
land use types (e.g., arable land, pasture, forest, settlement) occurring in North Rhine-Westfalia was
approximately reflected by the distribution of the monitoring stations within these land use types,
thus guaranteeing representability.
As can be seen from Figure 8, the modeled values in the Lower Rhine Embayment, the
Weserbergland, and the Rhenish Massif corresponded spatially and with regard to their
concentration levels very well to the observed nitrate concentrations in groundwater.
In the Münsterland, however, the modeled nitrate concentration in the leachate systematically
exceeded the observed nitrate concentrations in groundwater (see Figure 8). There, due to the
occurrence of denitrification capacities in the aquifers, the nitrate concentration in the leachate was
decreased once the leachate entered into the groundwater. Consequently, the apparent disagreement
between (high) modeled nitrate concentrations in the leachate and (low) observed nitrate
concentrations in groundwater was attributable to the considerable denitrification capacity of
reduced aquifers and did not indicate wrong model results [24].
The plausibility check described above was accompanied by a statistical evaluation of the
modelled nitrate concentrations in leachate and the observed nitrate concentrations at monitoring
stations for different land uses (Figure 9).Water 2020, 12, 550 14 of 18
Figure 9. Comparison of modelled nitrate concentrations in the leachate (L) and observed nitrate
concentrations in groundwater at monitoring stations (GW) for different land use types. The lower
and upper end of the bars indicate the statistical distribution with the 25th percentile and 75th
percentile, respectively, and the lines inside the bars mark the median (black line) and mean (red line).
Figure 9 shows that the 25th percentile and 75th percentile values, as well as the median and
mean values of the modelled nitrate concentrations in the leachate and the observed nitrate
concentrations in groundwater corresponded quite well for the land use classes of pasture, forests,
and urban areas. For the land use class of arable land, however, the observed nitrate concentrations
in groundwater showed lower values than the modelled nitrate concentrations in the leachate.
A more detailed analysis showed that the absence of denitrification capacities in aquifers
explained the good agreement for the land use classes of pasture, forests, and settlements.
Groundwater samples from these land use types showed oxidized groundwater, and thus the nitrate
concentration in the leachate was preserved after infiltration into the upper aquifer [18,31].
A considerable number of the groundwater monitoring stations from the land use class of arable
land were, however, located in aquifers displaying high denitrification capacities, mainly in
Münsterland (see Figure 8). As denitrification in groundwater was not accounted for in the modelled
nitrate concentrations in the leachate, it was obvious that the modelled nitrate concentration in the
leachate showed higher vales than the overserved nitrate concentrations in groundwater.
4. Discussion
The application of Equation (1) at the Federal State level was indispensable for assessing the
entire N loading of the leachate as well as the N inputs into groundwater and surface waters. The
grids showing nitrate concentrations in the leachate above 50 mg NO3/L represent the hot-spot areas
of nitrate pollution of groundwater. The good correspondence of the modelled nitrate concentrations
in the leachate with the observed nitrate concentrations in groundwater detected in the course of the
plausibility check demonstrated that the model results were appropriate in indicating the nitrate
pollution of groundwater at the Federal State level. Consequently, the modelled nitrate concentration
in the leachate can be regarded as a reliable starting point for scenario analyses, for instance as an
adequate reference value for assessing the extent to which a nitrate reduction is necessary to reach
the EU-WFD quality target for groundwater.
Inside the groundwater bodies failing good quality status due to nitrate, the areas showing
nitrate concentrations in the leachate above 50 mg/L were predestined for implementing N reduction
measures. Modelling nitrate concentration in the leachate apportioned between the individual
agricultural and non-agricultural N sources facilitated the identification of the main polluter in a
certain region. It was obvious that only the latter had to implement measures to reduce the nitrogen
impact on groundwater according to EU-WFD requirements.
Results of the model analysis in North Rhine-Westfalia proved that N emissions from small
sewage plants, urban systems, and NOx deposition only locally caused nitrate concentrations in the
leachate above 50 mg NO3/L, in spite of the high population density (525 inhabitants/km2).Water 2020, 12, 550 15 of 18
Consequently, as the areas concerned did not exceed 20% of the area of a groundwater body, the
focus relied on agricultural measures to reduce nitrogen losses. This, however, did not detract from
the fact that the implementation of measures to reduce the N output from urban systems may have
been necessary, but not within the program of measures according to EU-WFD.
Model analysis confirmed instead that N emissions from agriculture exclusively led to extended
areas of nitrate concentrations > 50 mg NO3/L, especially in the north (Münsterland) and the west
(Lower Rhine Embayment). As in general more than 20% of the areas in the respective groundwater
bodies were concerned, the implementation of measures to reduce agricultural N emissions in the
context of the WFD program of measures was necessary.
Results presented for the Federal State of Northrhine-Westfalia clearly illustrated the importance
of systematically considering not only agricultural N emissions in modelling nitrate concentrations
in the leachate. Especially in densely populated regions, the consideration of the N inputs from all N
sources (as shown in the maps) was the only way to objectively assess the relevant polluter(s) in a
region and to evaluate the relative contribution of each polluter to the overall N pollution. The latter
was once again important to dimension appropriate polluter-specific N reduction measures.
A comparison of modelled nitrate concentrations in the leachate and observed nitrate
concentrations in groundwater at monitoring stations for different land use types showed that the
modelled nitrate concentration in the leachate showed higher vales than the overserved nitrate
concentrations in groundwater due to denitrification processes in groundwater. The modelled high
nitrate concentrations in the leachate were an indication that the N emissions in groundwater have
to be reduced. Even in cases where the observed nitrate concentrations in groundwater were found
to be considerably below 50 mg NO3/L, a reduction of the N emissions in groundwater is the only
way to conserve the natural denitrification capacity of reduced aquifers for as long as possible [28].
Although the model can be recommended for large-scale assessments on the level of states or
entire river basins, the use of the model results for local issues is subjected to several constraints. Most
important are limitations in the local representativeness of the model input parameters derived from
statewide available databases. It is evident that, for instance, on-site occurring soil properties may
not be represented in a statewide available soil map at a scale of 1:50,000. Consequently, local
obviously deviating model results may have been due to databases being insufficiently accurate for
local issues. Therefore, an effective monitoring network and local expert knowledge will remain
indispensable for implementing local nitrogen strategies. In this regard, it must also be remembered,
that the modelled values represent reference values characterizing mean long-term conditions rather
than fixed values tracing specific nitrate concentrations at certain sites and at certain times.
Author Contributions: Conceptualization: F.W., S.B., M.E., H.G., F.H., P.K., R.K.; Initial manuscript writing:
F.W.; Review: S.B., M.E., H.G., F.H., P.K., R.K.; Methodology and investigation: F.W., S.B., M.E., H.G., F.H., P.K.,
R.K.; Visualization: M.E., R.K., F.W. All authors have read and agreed to the published version of the manuscript.
Funding: This research was funded by the Ministry for Environment, Agriculture, Conservation and Consumer
Protection of the State of North Rhine-Westphalia in the framework of the cooperation project GROWA+ NRW
2021.
Conflicts of Interest: The authors declare no conflict of interest.
References
1. Strebel, O.; Duynisveld, W.H.M.; Böttcher, J. Nitrate pollution of groundwater in Western Europe. Agric.
Ecosyst. Environ. 1989, 26, 189–214.
2. Sutton, M.A.; Howard, C.M.; Erisman, J.W.; Billen, G.; Bleeker, A.; Grennfelt, P.; van Grinsven, H.; Grizzetti,
B. The European Nitrogen Assessment: Sources, Effects and Policy Perspectives; Cambridge University Press:
Cambridge, UK, 2011; p. 612.
3. Power, J.F.; Schepers, J.S. Nitrate contamination of groundwater in North America. Agric. Ecosyst. Environ.
1989, 26, 165–187.
4. Rosenstock, T.S.; Liptzin, D.; Dzurella, K.; Fryjoff-Hung, A.; Hollander, A.; Jensen, V.; King, A.; Kourakos,
G.; McNally, A.; Stuart Pettygrove, G.; et al. Agriculture’s contribution to nitrate contamination of
Californian groundwater (1945–2005). J. Environ. Qual. 2014, 43, 895–907.Water 2020, 12, 550 16 of 18
5. Thorburn, P.J.; Biggs, J.S.; Weier, K.L.; Keating, B.A. Nitrate in groundwaters of intensive agricultural areas
in coastal Northeastern Australia. Agric. Ecosyst. Environ. 2003, 94, 49–58.
6. Wu, M.; Wu, J.F.; Liu, J.; Wu, J.C.; Zheng, C.M. Effect of groundwater quality on sustainability of
groundwater resource: A case study in the North China plain. J. Contam. Hydrol. 2015, 179, 132–147.
7. Haller, L.; McCarthy, P.; O’Brien, T.; Riehle, J.; Stuhldreher, T. Nitrate Pollution of Groundwater. Alpha Water
Systems Inc.: Paramount, CA, USA, 2013. Available online: http://www.reopure.com/nitratinfo.html
(accessed on 10 July 2019).
8. Bechmann, M.; Blicher-Mathiesen, G.; Kyllmar, K.; Iital, A.; Lagzdins, A.; Salo, T. Nitrogen application,
balances and the effect on nitrogen concentrations in runoff from small catchments in the Nordic-Baltic
countries. Agric. Ecosyst. Environ. 2014, 198, 104–113.
9. Billen, G.; Garnier, J.; Lassaletta, L. The nitrogen cascade from agricultural soils to the sea: Modeling
nitrogen transfers at regional watershed and global scales. Philos. Trans. R. Soc. B 2013, 368, 1–13,
doi:10.1098/rstb.2013.0123.
10. EU-WFD. Directive 2000/60/EC of the European Parliament and the Council of 23 October 2000 Establishing a
Framework for Community Action in the Field of Water Policy; Official Journal of the European Communities,
2000, L 327, 1–73.
11. EU-MSFD. Directive 2008/56/EC of the European Parliament and the Council of 17 June 2008 Establishing a
Framework for Community Action in the Field of Marine Environmental Policy; Official Journal of the European
Communities 2008, L 164/19, 1-40.
12. European Parliament and Council of the European Union. Council Directive 91/676/EEC of 12 December 1991
Concerning the Protection of Waters against Pollution Caused by Nitrates from Agricultural Sources; Official
Journal of the European Communities; European Parliament and Council of the European Union, 1991, No
L 375 / 1, 1-8.
13. Müller, D.; Blum, A.; Hart, A.; Hookey, J.; Kunkel, R.; Scheidleder, A.; Tomlin, F.; Wendland, F. Final Report
for a Methodology to Set Up Groundwater Threshold Values in Europe; Report D18, 1-63; Specific Targeted EU—
Research Project Bridge: Vienna, Austria, 2006.
14. European Commission. Guidance on Groundwater Status and Trend Assessments, CIS Guidance Document No.
18, Luxembourg: Office for Official Publications of the European Communities; European Commission: Brussels,
Belgium, 2009; p. 84.
15. Bikšel, J. Retikel, I. An approach to delineate groundwater bodies at risk: Seawater intrusion in Liepāja
(Latvia). E3S Web Conf. 2018, 54, doi:10.1051/e3sconf/20185400003.
16. Garrido, T.; Iglesias, M.; Fraile, J.; Munne, A. Chemical status assessment of groundwater bodies and
measures proposed within the framework of the Catalan River basin district management plan. In
Proceedings of the European Groundwater Conference, Madrid, Spain, 20–21 May 2010.
17. LAWA. Fachliche Umsetzung der Richtlinie zum Schutz des Grundwassers vor Verschmutzung und
Verschlechterung 2006/118/EG; Sachstandsbericht vom 31.01.2008; LAWA-Unterausschuss, Fachliche
Umsetzung der Grundwassertochterrichtlinie: Berlin, Germany, 2008.
18. Kuhr, P.; Haider, J.; Kreins, P.; Kunkel, R.; Tetzlaff, B.; Vereecken, H.; Wendland, F. Model based
assessment of nitrate pollution of water resources on a federal state level for the dimensioning of agro-
environmental reduction strategies: The North Rhine-Westphalia (Germany) case study. Water Resour.
Manag. 2013, 27, 885–909.
19. Wendland, F.; Bogena, H.; Goemann, H.; Hake, J.F.; Kreins, P.; Kunkel, R. Impact of nitrogen reduction
measures on the nitrogen loads of the river Ems and Rhine (Germany). Phys. Chem. Earth 2009, 30, 527–541.
20. van Berk, W.; Fu, Y. Redox roll-front mobilization of geogenic uranium by nitrate input into aquifers: Risks
for groundwater resources. Environ. Sci. Technol. 2017, 51, 337−345.
21. Rivett, M.O.; Buss, S.R.; Morgan, P.; Smith, J.W.N.; Bemment, C.D. Nitrate attenuation in groundwater: A
review of biogeochemical controlling processes. Water Res. 2008, 42, 4215–4232.
22. Højberg, A.L.; Lausten Hansen, A.; Wachniew, P.; Żurek, A.J.; Virtanen, S.; Arustiene, J.; Strömqvist, J.;
Rankinen, K.; Refsgaard, J.C. Review and assessment of nitrate reduction in groundwater in the Baltic Sea
Basin. J. Hydrol. Reg. Stud. 2017, 12, 50–68.
23. Kolbe, T.; de Dreuzy, J.R.; Abbott, B.W.; Aquilina, L.; Babey, T.; Green, C.T.; Fleckenstein, J.H.; Labasque, T.;
Laverman, A.M.; Marçais, J.; et al. Stratification of reactivity determines nitrate removal in groundwater.
Proc. Natl. Acad. Sci. USA 2019, 116, 2494–2499, doi:10.1073/pnas.1816892116.Water 2020, 12, 550 17 of 18
24. Kunkel, R., Bach, M.; Behrendt, H.; Wendland, F. Groundwater-borne nitrate intakes into surface waters in
Germany. Water Sci. Technol. 2004, 49, 11–19.
25. Kunkel, R., Wendland, F.; Albert, H. Zum Nitratabbau in den grundwasserführenden Gesteinsschichten
des Elbeeinzugsgebietes. Wasser Boden 1999, 51, 16–19.
26. Cremer, N.; Schindler, R.; Greven, K. Nitrateintrag ins Grundwasser und Abbaumechanismen an
verschiedenen Fallbeispielen. Korresp. Wasserwirtsch. 2018, 11–16, 352–360.
27. Rohmann, U.; Sontheimer, H. Nitrat im Grundwasser: Ursachen, Bedeutung, Lösungswege; DVGW-
Forschungsstelle am Engler-Bunte-Institut der Universität Karlsruhe: Karlsruhe, Germany, 1985; p. 468.
28. LAWA. Empfehlungen für eine harmonisierte Vorgehensweise zum Nährstoffmanagement
(Defizitanalyse, Nährstoffbilanzen, Wirksamkeit landwirtschaftlicher Maßnahmen) in
Flussgebietseinheiten. Produktdatenblätter 2017, 35–37, 42.
29. Fraters, D.; van Leeuwen, T.; Boumans, L.; Reijs, J. Use of long-term monitoring data to derive a relationship
between nitrogen surplus and nitrate leaching for grassland and arable land on well-drained sandy soils
in the Netherlands. Acta Agric. Scand. B Soil Plant 2005, 65, 144–154, doi:10.1080/09064710.2014.956789.
30. Dalgaard, T.; Hansen, B.; Hasler, B.; Hertel, O.; Hutchings, N.J.; Jacobsen, B.H.; Stoumann Jensen, L.;
Kronvang, B.; Olesen, J.E.; Schjørring, J.K.; et al. Policies for agricultural nitrogen management—Trends,
challenges and prospects for improved efficiency in Denmark. Environ. Res. Lett. 2014, 9, 115002.
31. Wendland, F.; Behrendt, H.; Gömann, H.; Hirt, U.; Kreins, P.; Kuhn, U.; Kunkel, R.; Tetzlaff, B.
Determination of nitrogen reduction levels necessary to reach groundwater quality targets in large river
basins: The Weser basin case study. Nutr. Cycl. Agroecosyst. 2009, 85, 63–78.
32. Hirt, U.; Kreins, P.; Kuhn, U.; Mahnkopf, J.; Venohr, M.; Wendland, F. Management options to reduce
future nitrogen emissions into rivers: A case study of the Weser river basin, Germany. Agric. Water Manag.
2012, 115, 118–131.
33. Andelov, M.; Kunkel, R.; Uhan, J.; Wendland, F. Determination of nitrogen re-duction levels necessary to
reach groundwater quality targets in Slovenia. Int. J. Environ. Sci. 2014, 29, 1806–1818.
34. Kunkel, R.; Herrmann, F.; Kape, H.E.; Keller, L.; Koch, F.; Tetzlaff, B.; Wendland, F. Simulation of terrestrial
nitrogen fluxes in Mecklenburg-Vorpommern and scenario analyses how to reach N-quality targets for
groundwater and the coastal waters. Environ. Earth Sci. 2017, 76, 146, doi:10.1007/s12665-017-6437-8.
35. Wendland, F.; Kunkel, R.; Gömann, H.; Kreins, P. Water fluxes and diffuse nitrate pollution at the river
basin scale: Interfaces for the coupling of agroeconomical models with hydrological approaches. Water Sci.
Technol. 2007, 55, 133–142.
36. Wakidaa, F.T.; Lerner, D.N. Non-agricultural sources of groundwater nitrate: A review and case study.
Water Res. 2005, 39, 3–16.
37. Zhang, Q.; Sun, J.; Liu, J.; Huang, G.; Lu, C.; Zhang, Y. Driving mechanism and sources of groundwater
nitratecontamination in the rapidly urbanized region of south China. J. Contam. Hydrol. 2015, 182, 221–230.
38. Available online: https://de.wikipedia.org/wiki/Metropolregion_Rhein-Ruhr (accessed on 20 November
2019).
39. Henrichsmeyer, W.; Cypris, C.; Löhe, W.; Meudt, M.; Sander, R.; von Sothen, F.; Isermeyer, F.; Schefski, A.;
Schleef K-H.; Neander, E.; Fasterding F.; Helmke, B.; Neumann, M.; Nieberg, H.; Manegold, D.; Meier, Th.:
Entwicklung Eines Gesamtdeutschen Agrarsektormodells RAUMIS96. Endbericht zum Kooperationsprojekt;
Forschungsbericht für das BML (94 HS 021); vervielfältigtes Manuskript Bonn/Braunschweig; 1996.
40. Kreins, P.; Gömann, H.; Herrmann, S.; Kunkel, R.; Wendland, F. Integrated agricultural and hydrological
modeling within an intensive livestock region. Adv. Econ. Environ. Res. 2007, 7, 113–142.
41. Heidecke, C.; Hirt, U.; Kreins, P.; Kuhr, P.; Kunkel, R.; Mahnkopf, J.; Schott, M.; Tetzlaff, B.; Venohr, M.;
Wagner, A.; et al. Endbericht zum Forschungsprojekt “Entwicklung eines Instrumentes für ein flussgebietsweites
Nährstoffmanagement in der Flussgebietseinheit Weser” AGRUM+-Weser; Thünen Report 21; Johann Heinrich
von Thünen-Institut: Braunschweig, Germany, 2015; 380p, doi:10.3220/REP21.
42. Wendland, F. Die Nitratbelastung in den Grundwasserlandschaften der “Alten” Bundesländer (BRD); Berichte
aus der Ökologischen Forschung 8; Forschungszentrum Jülich Germany: Juelich, Germany, 1992; p. 150.
43. Wienhaus, S.; Höper, H.; Eisele, M.; Meesenburg, H.; Schäfer, W. Nutzung Bodenkundlich-Hydrogeologischer
Informationen zur Ausweisung von Zielgebieten für den Grundwasser-Schutz—Ergebnisse Eines Modellprojektes
(NOLIMP) zur Umsetzung der EG—Wasserrahmenrichtlinie; Landesamt für Bergbau, Energie und Geologie,
Hannover, Germany; GeoBerichte 9; 2008; 56p.You can also read