Impacts of Organic Farming on the Efficiency of Energy Use in Agriculture - An Organic Center State of Science Review August 2006
←
→
Page content transcription
If your browser does not render page correctly, please read the page content below
Efficiency of Energy Use SSR                            The Organic Center

                      Impacts of Organic Farming on
                      the Efficiency of Energy Use in
                      Agriculture

                                  An Organic Center
                               State of Science Review

                                           By
                                    David Pimentel
                                   Cornell University
                                      Ithaca NY

                                    August 2006
I. FOCUS STATEMENT

        Each year, the food system utilizes about 19 percent
of the total fossil energy burned in the United States
(Pimentel et al., 2006) (Figure 1). Of this 19 percent, about
7 percent is expended for agricultural production, 7 percent
for processing and packaging, and 5 percent for distribution
and food preparation by consumers (Pimentel et al., 2006).
If forestry production and utilization are included, the total
for the food, fiber, and forestry sectors of the economy
rises another 5 percent, to 24 percent of national fossil
energy use. This amount of energy (24 percent) is similar
to that consumed by automobiles each year in America
(USCB, 2004-2005).

      The total fossil energy used in U.S. conventional crop
production is approximately 1,000 liters per hectare (107
gallons per acre) (Pimentel et al., 2002). Of this, about
one-third is for fertilizers, another third is for mechanization
to reduce labor, and about a third covers all other activities
and inputs, including pesticides. Past studies on energy
use in alternative and sustainable corn and soybean
production systems have pointed to nitrogen fertilizer and
pesticides as the inputs leading to the biggest differences in
energy use and efficiency, compared to conventional
production systems (Pimentel et al., 2005; Pimentel and
Pimentel, 1996).

      The high degree of reliance of conventional farming
systems on cheap energy became a pressing concern in the
wake of rapidly growing oil demand by the U.S., China, and
India, and damage to Gulf Coast energy infrastructure in
the summer and fall of 2005. In addition, Congress passed
a major energy bill in 2005, extending costly subsidies for
ethanol production, and dramatically increasing goals for
energy production from ethanol and other biofuels, mostly
derived from corn. The more than $3-a-gallon gasoline,
the war in Iraq, continued instability in the Middle East, and
declining global energy reserves in the face of strongly
growing worldwide demand, have further elevated the
prominence of energy use and efficiency on both the
agriculture and energy policy agendas.

                   1
Rising energy costs have doubled the cost of many farm inputs and
routine farming operations compared to just a year ago, and both fuel and
natural gas prices are projected to increase another 30 percent to 50 percent in
2006 (USCB, 2004-2005). Across the country, farmers are deeply worried over
energy-driven increases in their production costs. This State of Science Review
(SSR) analyzes the extent to which:

      • Conversion to organic farming systems will reduce the dependence of
      farmers on energy; and
      • Organic farming can increase the efficiency of energy use per unit of
      production.

                                                             Transport
                                                             Residential
                                                             Food Sys.
                                                             C ommercial
                                                             Industry

             Figure 1. The relative percentages of the approximately 100
             quads of fossil energy that is utilized in the United States each year.
             Note that about 19% is consumed in the food system.

        Both organic and conventional farming systems are dependent on fossil
and solar energy. In several respects and in carrying out many routine tasks,
energy use actually does not differ significantly on conventional and organic
farms. The energy cost of trucking grain to market is the same per mile. The
same amount of energy is needed to manufacture and run a tractor (these
lifecycle costs have been included in the 19 percent above). The energy cost of
pumping irrigation water is the same per acre-foot on a conventional and organic
farm. The energy tied up in seed, or livestock-breeding stock differs little
between conventional and organic farms.

       On the other hand, energy use on conventional and organic farms differs
substantially in several ways. The largest and most readily measured differences
are associated with the energy required to manufacture, ship, and apply
pesticides and nitrogen-based fertilizers. Other often-significant differences are

                                              2
harder to quantify and include the impact of organic and conventional farming
systems on soil quality and health, and on the conservation of water.

    This SSR focuses on the production of corn and soybeans under organic and
conventional systems. Data are also presented on the energy inputs in the
production of several other major crops grown under conventional systems. The
energy inputs in U.S. livestock production systems are also discussed.

Energy Dependence Has Steadily Grown

        Yields of most U.S. crops have increased approximately four-fold since the
1940s (USDA, 1940, 2004). Steady yield gains have been the result of
technological changes rooted in the breeding of higher-yielding plant varieties,
increases in the number of seeds planted per acre, more intensive use of
fertilizers and pesticides, and more extensive irrigation of cropland. All of these
new production technologies depend on the use of significant amounts of fossil
energy.

      The availability of ample quantities of fossil energy and new farm
technologies has reduced the human labor required to grow and harvest a
hectare (2.47 acres) of row crops like corn and soybeans from approximately
1,200 hours per hectare prior to the introduction of farm machinery, to about 11
hours now (Pimentel and Pimentel, 1996; Pimentel and Patzek, 2005).

        Comparing labor and energy use across time periods and agricultural
systems is tricky. Often, the energy required at a production facility to
manufacture a ton of fertilizer is reported as the total energy cost of that
fertilizer, ignoring the energy required to ship the fertilizer to the farmer, and the
cost of energy embedded in the tanks and equipment needed to handle and
apply the fertilizer. In calculating the total energy expended in major crop
production on the farm, the additional energy expended by workers who mined
and refined the oil, plus that of the workers who made the tractors and other
farm equipment, are typically not included.

     The energy data for most of the workers who play a role in bringing energy-
intensive inputs to the farm remain extremely difficult to obtain. If all human
labor that supports conventional farm production is included, an estimated 30
hours of human labor are expended in order to produce a hectare of corn. Even
so, the estimated 30 hours of labor are significantly less than the average 1,200
hours expended when corn is raised by hand (Pimentel and Pimentel, 1996).

     Peak oil and natural gas supplies are projected for the year 2007, and the
resulting decline in energy supplies will change lifestyles and impose economic
stresses on all sectors of the economy, including agriculture over several decades

                                          3
(Youngquist and Duncan, 2003; Campbell, 2005). The decline in fossil energy
resources will surely result in increasing prices for fuel, fertilizer, and other
essential farming inputs for both organic and conventional farmers.

      Both oil and natural gas prices are projected to increase from 30 percent to
50 percent during the year 2006. Economic pressures on farmers triggered by
rising energy processes will intensify interest in the identification of farming
system alternatives that will consistently increase energy efficiency, and hence
reduce the amount of energy needed to produce a given quantity of a particular
crop. This SSR highlights the contributions that organic farming practices can
make in this quest for more energy-efficient farming systems.

                                         4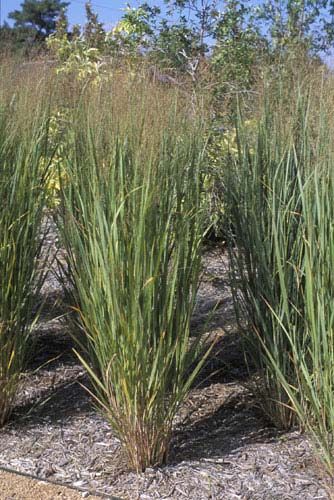
II. MEASURING ENERGY USE AND EFFICIENCY

       Plants, humans and other animals, plus microbes, all depend on energy
for their survival. Only plants can collect solar energy and convert it into food for
their own use. Humans, and indeed nearly all the other organisms on earth,
depend on plants, directly or indirectly through animal products, for their energy
needs and caloric intake. Adult humans require about 2,500 kcal per day to
meet their energy needs.

       Plants are not particularly efficient at collecting solar energy; for instance,
green plants covering a hectare of land collect on average less than 0.1 percent
of the solar energy reaching them. Yet, this is all the solar energy the plant
needs to drive photosynthesis and support plant growth, and plants have found
ways to adapt to their environment and survive for millions and millions of years.
Of course, if plants could collect 100 to 200 times more solar energy each year,
their usefulness for capturing and providing needed energy would be greatly
enhanced.

       On farms throughout the developed world, considerable fossil energy is
invested in the course of agricultural production. On average in the U.S., about
2 kcal of fossil energy is invested to harvest 1 kcal of a crop. This high degree of
dependence on fossil energy per hectare of crop harvested in America arises
more from how food is grown, coupled with the pursuit of ever-higher yields,
rather than the inherent physiological dependence of major agronomic crops on
energy-based inputs. It also reflects a lack of concern and focus on energy use
and efficiency in farm production over the last half century, a period during
which most people took for granted, almost as a birthright, ample supplies of
affordable fossil energy.

        Sound data on energy inputs in crop and livestock production are difficult
to find. With crop production, for instance, anywhere from 10 to 15 different
energy inputs are required to produce a hectare of a given crop. In addition, it is
difficult to find exact energy input values for some inputs in crop production. For
example, the exact energy requirements for a specific insecticide, herbicide, or

                                          5
fungicide are difficult or impossible to find in the literature, and thus, average
values must be used. Also, some investigators omit certain inputs in crop
production, like the energy inputs to produce and repair farm machinery. Farm
machinery -- even prorated over several years of service and tens of thousands
of acres covered -- still represents a substantial energy need. Indeed, it may
account for about 20 percent of the total energy expenditure in crop production.

         Additionally, crop-yields vary from state to state. For example, corn
yields average about 140 bushels per acre across the entire U.S., but between
regions, average from between 46 bushels to 190 bushels per acre (USDA,
2003). These differences influence energy accounting.

        Each year, the United States consumes more than twice the amount of
fossil energy than the solar energy that is captured by all the plants in the U.S.
This includes all the plants in agriculture, forestry, and all other plant-life in the
natural environment (Pimentel and Pimentel, 1996). Understanding this
relationship is essential because it explains why biomass-based fuels like ethanol
and biodiesel, which depend on solar energy, are unable to substitute for finite
oil as a transport fuel (Pimentel and Patzek, 2005).

A. Energy Inputs for Organic Corn and Soybean Crops

       Organic and conventional corn and soybean cropping systems are
addressed in detail in this SSR because these are major crops often grown in
rotation on some of the nation’s most fertile cropland. Plus, this rotation of
crops covers extensive acreage, is energy-intensive, and has been the focus of
several studies assessing energy use and efficiency.
.
       Corn: Corn is the major
grain crop grown in the U.S. and is
the food-energy backbone of the
country’s food system. It is used
primarily to feed livestock, providing
70 percent of livestock feed (USCB,
2004-2005). The manufacture of
corn oil, corn syrup, and ethanol are
the three other major products
derived from corn, although over
200 products are made wholly or in
part from corn or the byproducts
from corn processing.

                                          6
Corn is both a high-yield crop and delivers more kilocalories of energy in
the harvested grain, per kilocalorie invested in production, than any other major
crop. Note the remarkable range in kilocalorie output per unit of input in the
production of several crops in Table 1 – from 7.7 in the case of organic corn
grown in Pennsylvania, 5.1 for conventional corn, down to 0.26 for conventional
tomatoes.

Table 1. A comparison of rate of return in calories per fossil fuel
invested in production for major crops. (See tables 2 thru 11 for
details on energy outputs per inputs)
                                                  Yield             Labor              Energy          kcals
Crop                   Technology              t/ha                hrs/ha            kcal x 106     output/input
Corn                   Organic1                7.7                 14                3.6            7.7
Corn                   Conventional2           7.4                 12                5.2            5.1
Corn                   Conventional3           8.7                 11.4              8.1            4.0
Soybean                Conventional4           2.7                 12                2.1            4.6
Soybean                Organic5                2.4                 14                2.3            3.8
Soybean                Conventional6           2.7                 7.1               3.7            3.2
Rice                   Conventional            7.4                 24                11.8           2.2
Wheat, winter          Conventional            2.7                 7.8               4.2            2.1
Potato                 Conventional            40.7                35                17.7           1.3
Cabbage                Conventional            27.3                60                11.0           1.3
Orange                 Conventional7           46.0                210               23.0           1.0
Apple                  Conventional8           55.0                385               50.2           0.61
Tomato                 Conventional            41.8                363               32.3           0.26

1)   Average   of two organic systems over 20 years in Pennsylvania (Pimentel et al., 2005).
2)   Average   of conventional corn system over 20 years in Pennsylvania (Pimentel et al., 2005).
3)   Average   U.S. corn (Table 3).
4)   Average   conventional soybean system over 20 years in Pennsylvania (Pimentel et al., 2005).
5)   Average   of two organic systems over 20 years in Pennsylvania (Pimentel et al., 2005).
6)   Average   of U.S. soybean system (Table 5).
7)   Average   of Florida orange system (Table 10).
8)   Average   of eastern apple system (Table 11).

      Table 2 estimates the energy inputs and outputs within a typical, or
“model” organic corn production system that produces 8,700 kilograms of corn
her hectare (130 bushels per acre). Each kilogram of corn contains about 3.58
kcals of energy, or 31,132 kcals from the corn produced on a hectare. A total of
5,377 kcals of energy are required to produce this volume of corn from a
hectare, leading to the “harvest” of 5.8 kcal of corn energy per kcal of fossil
energy invested in producing the corn (Figure 2) (Table 2). Conventional corn
production is somewhat less energy efficient, yielding 4.0 kcal of corn energy per
kcal of fossil energy invested (Table 3).

                                                              7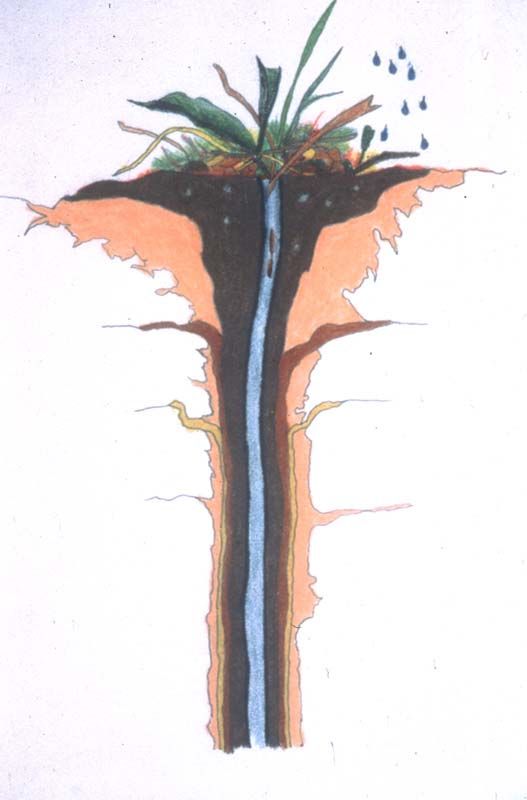
Table 2. Average energy inputs of a model organic corn production
system per hectare in the United States employing a vetch cover
crop.
Inputs                           Quantity                Kcal x 1000
Labor                            15 hrs                  600
Machinery                        55 kg                   1,018
Diesel                           90 L                    1,026
Gasoline                         40 L                    405
Phosphorus                       48 kg                   200
Potassium                        57 kg                   186
Lime                             1,120 kg                315
Seeds, corn                      21 kg                   520
Seeds, vetch                     14 kg                   930
Electricity                      13.2 kWh                34
Transport                        204 kg                  169
TOTAL                                                    5,377
Corn Yield = 8,700 kg/ha                                 31,132 kcal   input:output = 1:5.79

 Note that the labor input in the organic corn system, compared to the
conventional corn system, was 32 percent greater (Tables 2 and 3). This
additional energy cost was offset because of the reduced soil erosion and the
reduced loss of phosphorus and potassium nutrients. A comparison of the model
organic and conventional system suggests a 31 percent energy saving in the
organic system, similar to the 22-year organic and conventional corn system at
the Rodale Institute.

               7

               6

               5

               4

               3

               2

               1

               0
                   Organ. Corn      Conv. Corn       Organ. Soy    Conv. Soy

            Figure 2. The food energy output (kcal) per fossil energy input (kcal) for
            organic corn, conventional corn, organic soybean, and conventional soybean.

                                                 8
Table 3. Average energy inputs of conventional corn production
system per hectare in the United States.
Inputs                      Quantity             Kcal x 1000
Labor                       11.4 hrs             462
Machinery                   55 kg                1,018
Diesel                      88 L                 1,003
Gasoline                    40 L                 405
Nitrogen                    153 kg               2,448
Phosphorus                  65 kg                270
Potassium                   77 kg                251
Lime                        1,120 kg             315
Seeds, corn                 21 kg                520
Herbicides                  6.2 kg               620
Insecticides                2.8 kg               280
Electricity                 13.2 kWh             34
Transport                   204 kg               169
TOTAL                                            7,795
Corn Yield = 8,700 kg/ha                         31,132 kcal   input:output = 1:3.99

        The 31 percent reduction in energy inputs per hectare of corn on organic
farms, compared to conventional production systems, translates into about a 64-
gallon fossil fuel saving per hectare for the organic system. If 10 percent of all
U.S. corn were grown organically, this would save the nation approximately 200
million gallons of oil-equivalents, or 4.6 million barrels of oil per year. While a
significant savings, this represents just 0.06 percent of total vehicle fuel use.

       Although the crop yields with corn and soybeans in both the organic and
conventional systems were similar, the energy inputs in the two systems were
quite different. The organic corn and soybean systems relied on cover crops
and/or livestock manure for the required fertilizer nutrients and used no
pesticides for production. The conventional corn and soybean systems required
commercial fertilizer nutrients and annual applications of usually several
pesticides. Thus, both the organic and conventional systems produced about the
same food calories, but required different amounts of fossil energy inputs for
production.

Comments on the Energy Inputs in Corn Production

       Labor- The only labor included in the tables projecting corn energy
outputs and inputs was on-farm labor; no attempt was made to include the labor
tied up in manufacturing farm machinery, fertilizers, and pesticides. The 11.4
hours of labor per hectare for conventional corn was only a portion of the 2,000
hours that the average farm laborer works each year (Table 3). If a laborer
worked exclusively on corn production for 2,000 hours per year, that worker
could produce about 175 hectares (433 acres of corn).

                                         9
How much non-farm
energy should be
assigned to that
worker? The
average energy use
per person in the
U.S. is about 8,000
liters of oil-
equivalents per
year. This energy
represents inputs for
roads, schools,
police, fire
protection and
others. It does not
include any energy inputs for the family. The worker covering 175 hectares of
corn in a year burns about 22,400 liters of gasoline and diesel (128 liters per
hectare of corn, times 175 hectares). While a liter of fuel is not equivalent to a
liter of oil-equivalent, it is still clear that non-farm energy use by this farm worker
accounts for a significant share of on farm use of liquid fuels.
Machinery Operation- The total weight of the machinery was used to
calculate the energy required to manufacture the farm machinery. It was
assumed that the machinery lasts for 10 years and was used on 160 hectares
annually and was prorated accordingly.
Diesel and Gasoline- Mostly diesel fuel was used in the tractors and
harvesters. However, some gasoline was also used according to the USDA and
others.
Nitrogen, Phosphorus, and Potassium- The application rates per
hectare of corn were obtained from the USDA. The energy inputs required to
produce a kilogram of each of these fertilizers was based on
research by various investigators.
Lime- The application rate of lime per hectare is
relatively large, but the energy required to produce a kilogram
of lime is relatively small.
Corn Seeds- All corn planted today is hybrid corn and
the production is relatively energy-intensive, and the energy
data were obtained from the literature.
10Herbicides and Insecticides- The average application rates of
herbicides and insecticides to corn were obtained from the USDA and other
sources. Average energy inputs for the production of these chemicals were used
because energy production data for the specific herbicides and insecticides used
are not available.
Electricity- Electricity used on a farm was obtained from the USDA. It
was assumed that it takes about 3 kcal of fossil energy to produce 1 kcal of
electricity.
Transport of Agricultural Goods- Most of the agricultural inputs had
the transport energy inputs included, except for machinery, fuels and seeds. It
was assumed that these goods were shipped an average of 1000 km.
Soybean: Because of its high protein
content (about 34 percent), the soybean is the
single most important protein crop grown
worldwide. Two-thirds of all soybeans produced
are grown in the United States, China, and
Brazil. In the United States, very little of the
soybean crop is used directly as human food, but
instead is processed for oil, while soybean meal
is fed to livestock (USCB, 2004-2005). Also, raw
soybeans and soybean products are major U.S.
agricultural exports (USDA, 2003).
Table 4. Energy inputs for a model organic soybean production
system per hectare in the U.S.
Inputs Quantity Kcal x 1000
Labor 9 hrs 360
Machinery 22 kg 360
Diesel 38.8 L 442
Gasoline 35.7 L 270
Phosphorus 24.2 kg 100
Potassium 8.6 kg 28
Lime 1,229 kg 338
Seeds 69.3 kg 554
Electricity 4.8 kWh 14
Transport 135 kg 35
TOTAL 2,501
Soybean yield = 2,668 kg/ha 9,605 kcal input:output 1:3.84
After corn, soybeans produced the most kilocalories of food energy per
kcal of fossil energy input (Tables 1 and 4). The model organic soybeans yielded
an average of 3.8 kcal of soybeans per kcal fossil energy invested (Figure 2,
11page 7) (Tables 1 and 4). The conventional soybean production system produced
about 3.2 kcal of soybean per kcal fossil energy invested (Figure 2) (Tables 1
and 5). Relatively large quantities of lime were applied to the soybean crop
because this crop does best in a soil with a pH of 6 or higher (Troeh et al., 1999;
Rehm et al., 2002), whereas little or no commercial nitrogen is necessary (hence
the lack of reliance on nitrogen as an input in Tables 4 and 5).
Table 5. Energy inputs in conventional soybean system production
per hectare in the U.S.
Inputs Quantity Kcal x 1000
Labor 7.1 hrs 284
Machinery 20 kg 360
Diesel 38.8 L 442
Gasoline 35.7 L 270
LP Gas 3.3 L 25
Nitrogen 3.7 kg 59
Phosphorus 37.8 kg 156
Potassium 14.8 kg 48
Lime 2,240 kg 616
Seeds 69.3 kg 554
Herbicides 1.3 kg 130
Electricity 10 kWh 29
Transport 154 kg 40
TOTAL 3,013
Soybean yield = 2,668 kg/ha 9,605 kcal input:output 1:3.19
B. Energy Inputs for Major Conventionally Grown Crops
Detailed data on the energy inputs in other organic crops are not
available, so an energy analysis was made of some other conventionally grown
food crops that are important in the United States food system. These include:
two grains (rice and winter wheat); two vegetables, (potato and cabbage); and
three fruits (oranges, apples, and tomatoes.
Rice: Worldwide, rice is the staple food for about 3 billion people, most
of whom live in developing countries. As with the conventional production of
other grains in the United States, rice requires large fossil energy inputs of
fertilizers, pesticides, irrigation, and machinery for production (Table 6). Average
U.S. rice production yielded 2.2 kcal rice energy per 1 kcal of fossil energy
invested (Tables 1 and 6).
Wheat: Throughout the world, more wheat is eaten than any other
cereal grain produced. Average U.S. wheat production yielded 2.1 kcal of wheat
energy per 1 kcal of fossil energy invested. Although the energy inputs for
producing conventional wheat are less than those for conventional corn, the
wheat yield is low, or less than a third per hectare than corn (Tables 1 and 7).
12In part, this is because the production of wheat in the arid regions of the U.S. is
low and the energy inputs are also low.
Table 6. Energy inputs and costs of rice production per hectare in the
United States.
Inputs Quantity kcal x 1000 Costs
Labor 24 hrsa 972c $240.00 f
Machinery 38 kga 742d 150.00 g
Diesel 225 La 2,573 d 47.25 h
Gasoline 55 La 558 d 15.95 h
Nitrogen 150 kgb 2,789 e 93.00 h
Phosphorus 49 kgb 203 d 26.95 h
Potassium 56 kgb 183 e 17.36 h
Sulfur 20 kgb 30 p 1.00 p
Seeds 180 kga 772 d 90.00 i
Herbicides 7 kgb 700 d 280.00 j
Insecticides 0.1 kgb 10 d 4.00 k
Fungicides 0.16 kgb 16 d 6.40 k
Irrigation 250 cma 2,139a 294.00 l
Electricity 33 kwh a 85a 2.31 m
Transportation 451 kga 116a 135.30 n
TOTAL 11,838 $1,403.52
Rice Yield = 7,367 kgo 26,522 kcal input:output = 1:2.24
a) Pimentel & Pimentel, (1996).
b) USDA, (1997).
c) It is assumed that a person works 2,000 hrs per year and utilizes an average of 8,100 liters of oil equivalents per year.
d) Pimentel, (1980).
e) FAO, (1999).
f) We assume that a farm laborer is awarded $10.00 per hour.
g) Estimated.
h) Hinman, et al., (1992).
i) Seeds were estimated to cost 50c per kg.
j) Hinman & Schiriman, (1997).
k) Insecticides and fungicides were estimated to cost $40 per kg.
l) 1 cm of irrigation water applied was estimated to cost $1.18.
m) Price of electricity is 7c per kwh (USCB, 2004).
n) Transportation was estimated to be 30c per kg transported 1,000 km.
o) USDA, (2004).
p) Based on the estimate that sulfur costs 5c per kg (Myer, 1997); it was calculated that the fossil energy input to
produce a kg was 1,500 kcals.
Potato: White potato is one of the 15 most heavily consumed vegetable
foods in the world. Even in the United States, where a wide variety of
vegetables are available, more potatoes are eaten than any other vegetable, or
about 22 kg per person per year (USDA, 1998). Equally important, potatoes
contain significant calories, protein, and vitamin C.
13Although the yield of potatoes averages nearly 41 t/ha, the yield in food
energy is 1.3 kcal of energy from potatoes per 1 kcal fossil energy invested, in
part because of the 80 percent water content (Tables 1 and 8).
Table 7. Energy inputs and costs of winter wheat production per
hectare in the United States.
Inputs Quantity kcal x 1000 Costs
a
Labor 7.8 hrs 316 d $78.00 a
Machinery 50 kgj 800 e 182.00 b
Diesel 49.5 Lk 565 e 10.40 b
Gasoline 34.8 Lk 352 e 9.98 b
Nitrogen 68.4 kgc 1,272 f 41.93b
Phosphorus 33.7 kgc 140 f 18.53 b
Potassium 2.1 kgc 7f 0.65 b
Seeds 60 kga 218 e 16.77 b
Herbicides 4 kga 400 e 11.83 a
Insecticides 0.05 kgc 5e 0.80 g
Fungicides 0.004 kgc 0.4 e 0.20 g
Electricity 14.3 kwh e 41 e 1.00 h
Transportation 197.9 kgi 123e 59.37i
TOTAL 4,239 $431.46
Winter Wheat Yield = 2,670 kgl 9,035e kcal input:output = 1:2.13
a) Willet & Gary, (1997).
b) Hinman et al., (1992).
c) USDA, (1997)
d) It is assumed that a person works 2,000 hrs per year and utilizes an average of 8,100 liters of oil equivalents per year.
e) Pimentel, (1980).
f) FAO, (1999).
g) It is assumed that insecticides and fungicides cost and average of $40 per kg.
h) Price of electricity is 7c per kwh (USCB, 2004)
i) The goods transported include machinery, fuels, and seeds and it is assumed that they were transported an average
distance of 1,000 km that cost about 30c per kg. For energy inputs see footnote e.
j) Estimated.
k) Pimentel & Pimentel, (1996).
l) USDA, (2000).
Cabbage: Cabbage is grown worldwide and is an excellent source of
many important nutrients, especially vitamin A, vitamin C, and iron. Cabbage
yields 1.3 kcal in food energy per 1 kcal fossil energy invested (Tables 1 and 9).
This is a similar yield to that of the potato.
Oranges: Oranges are a nutritious fruit but are very costly to produce,
about $3,000 per hectare (Table 10). Although, per hectare, oranges provide
more than double the vitamin C content of white potatoes, Americans obtain half
of their vitamin C from white potatoes and half from citrus (USDA, 2000).
Oranges are not generally consumed for calories but are a favorite source of
vitamin C. About 1 kcal in orange energy is obtained per 1 kcal fossil energy
invested in orange production (Tables 1 and 10).
14Table 8. Energy inputs and costs of potato production system per
hectare in the United States.
Inputs Quantity kcal x 1000 Costs
Labor 35 hrsa 1,964d $350.00g
Machinery 31 kga 574 e 300.00 h
Diesel 152 La 1,735e 31.92h
Gasoline 272 La 2,750e 78.88h
Nitrogen 231 kgb 4,294f 142.60h
Phosphorus 220 kgb 911f 121.00h
Potassium 111 kgb 362f 34.41h
Seeds 2,408 kge 1,478e 687.00h
Sulfuric acid 64.8a 0i 73.00i
Herbicides 1.5 kgk 150e 13.50h
Insecticides 3.6 kgk 360e 14.40h
Fungicides 4.5 kgk 450e 180.00h
Electricity 47 kwha 135e 3.29j
Transportation 2,779 kgc 2,307e 833.70l
TOTAL 17,470 $2,863.70
Potato Yield = 40,656 kgk 23,296 kcal input:output = 1:1.33
a) Pimentel & Pimentel, (1996).
b) USDA, (1997).
c) A sum of the quantity values for machinery, fuels, and seeds (all converted to mass units).
d) It is assumed that a person works 2,000 hrs per year and utilizes an average of 8,100 liters of oil equivalents per year.
e) Pimentel, (1980).
f) FAO, (1999).
g) Farm labor costs were estimated to be $10.00 per hour.
h) Hinman et al., (1992).
i) Sulfuric acid production is an exothermic process. The cost of sulfuric acid was $73.00/ha. Reference source is
cking@micron.net, December 2, 1999.
j) Price of electricity is 7c per kwh (USCB, 2004).
k) USDA, (2004).
l) 30c/kg of goods transported.
Apples: Apples are another economically valuable fruit crop produced in
the U.S., and they cost about $7,725 to produce per hectare (Table 11). Apples
are an appetizing fruit and are not produced for food energy. Only 0.61 kcal of
apple fruit is produced per 1 kcal of fossil energy invested (Tables 1 and 11).
Tomatoes: Tomatoes are valued for flavor as well as for their vitamin C,
vitamin A, and iron. About 42 t/ha are produced but tomatoes are mostly water,
about 94 percent. Only 0.26 kcal of food energy is produced per 1 kcal of fossil
energy invested (Tables 1 and 12).
15Table 9. Energy inputs and costs of cabbage production system per
hectare in the United States.
Inputs Quantity kcal x 1000 Costs
Labor 60 hrsa 2,673d $600.00g
Machinery 60 kgb 960c 200.00 b
Fuel 285 La 2,881a 71.25h
Nitrogen 180 kga 3,346f 111.60i
Phosphorus 45 kga 186f 24.75i
Potassium 40 kga 130f 12.40i
Seeds 4 kga 16a 44.00b
Herbicides 1.9 kgc 190e 76.00k
Insecticides 2.2 kgc 220e 88.00k
Fungicides 0.4 kgc 40e 16.00k
Electricity 234 kwha 300a 16.38l
Transportation 249 kga 64a 74.70m
TOTAL 11,006 $1,335.08
Cabbage Yield = 27,345 kg/han 13,782 kcal input:output = 1:1.25
a) Data for another cole crop, Brussel sprouts. Pimentel & Pimentel, (1996).
b) Estimated.
c) USDA, (1997).
d) It is assumed that a person works 2,000 hrs per year and utilizes an average of 8,100 liters of oil equivalents per year.
e) Pimentel, (1980).
f) FAO, (1999).
g) Farm labor costs were estimated to be $10.00 per hour.
h) Fuel is assumed to cost 25c/liter.
i) Helsel, (1987).
j) Lime costs 15c/kg.
k) Pesticides were assumed to cost $40 per kg.
l) Price of electricity is 7c per kwh (USCB, 2004).
m) 30c/kg of goods transported.
n) USDA, (2004).
16Table 10. Energy inputs and costs of orange production system per
hectare in Florida.
Inputs Quantity kcal x 1000 Costs
Labor 210 hrsa 9,354d $2,100.00h
Machinery 30 kga 480e 180.00 i
Diesel 90 La 1,096e 18.90j
Gasoline 96 La 960e 27.84j
Nitrogen 228 kgb 4,239f 111.00b
Phosphorus 54 kgb 224f 62.00b
Potassium 228 kgb 783f 49.00b
Herbicides 11 kgb 1,000e 231.00b
Insecticides 9 kgb 900e 103.49b
Nematicides 37 kgb 3,700e 91.00b
Electricity 66 kwhc 57a 4.62k
Transportation 500 kgc 128a 45.00l
TOTAL 22,921 $3,024.05
Orange Yield =46,000 kgb 23,519 kcal input/output = 1:1.02
a) Estimated.
b) Muraro & Matthews, (1987).
c) Estimated.
d) It is assumed that a person works 2,000 hrs per year and utilizes an average of 8,100 liters of oil equivalents per year.
e) Pimentel, (1980).
f) FAO, (1999).
g) Estimated.
h) Farm labor costs were estimated to be $10.00 per hour.
i) Machinery costs were assumed to be $180.00.
j) Diesel fuel was assumed to cost 21c/liter and gasoline was assumed to cost 29c/liter.
k) Price of electricity is 7c per kwh (USCB, 2004).
l) The cost of transport was assumed to be 30c/kg.
17Table 11. Energy inputs and costs of apple production per hectare in
eastern United States.
Inputs Quantity kcal x 1000 Costs
Labor 385 hrsa 17,150b $3,850.00d
Machinery 88 kga 1,408 c
320.00d
Diesel 483 La 5,506c 101.43e
Gasoline 1,346 La 13,406 c
390.34e
Nitrogen 45 kga 837 j
27.90f
Phosphorus 114 kga 472 j
62.70f
Potassium 114 kga 372 j
35.34f
Herbicides 6 kga 600 c
120.00g
Insecticides 47 kga 4,700 c
940.00g
Fungicides 49 kga 4,900c 980.00g
Electricity 66 kwha 57c
4.62h
Transportation 2,974 kga 787 c
892.20i
TOTAL 50,195 $7,724.53
Apple Yield = 55,000 kga 30,660 kcal output/kcal input = 0.61
a) Estimated.
b) It is assumed that a person works 2,000 hrs per year and utilizes an average of 8,100 liters of oil equivalents per year
(BP, 1999).
c) Pimentel, (1980).
d) Farm labor costs were estimated to be $10.00 per hour.
e) Diesel fuel was assumed to cost 21c/liter and gasoline was assumed to cost 29c/liter.
f) Hinman, et al., (1992).
g) All the pesticides were assumed to cost $20 per kg.
h) Price of electricity is 7c per kwh (USCB, 2004).
i) Transport of goods was assumed to cost 30c per kg.
j) FAO, (1999).
18Table 12. Energy inputs and costs of processing tomato production
system per hectare in the United States.
Inputs Quantity kcal x 1000 Costs
Labor 363 hrsa 14,580h $3,630.00l
Machinery 100 kgb 1,600 i
950.00a
Diesel 246 Lc 2,808 i
51.66m
Gasoline 628 Lc 6,348 i
182.12m
Nitrogen 200 kgd 3,000j 124.00n
Phosphorus 100 kgd 300 i
55.00n
Potassium 150 kgd 225 j
46.00n
Lime 50 kgc 16i
7.50
Seedlings 13,600a 100e 952.00a
Herbicides 1.5 kgf 150 k
60.00o
Insecticides 1.5 kgf 150 k
60.00o
Fungicides 16 kg 1,600k 640.00o
Irrigation 125 cmc 1,010 c
251.51p
Electricity 77.5 kwhc 200 c
5.43q
Transportation 1,024 kgg 272 i
322.20r
TOTAL 32,389 $7,337.42
Tomato Yield = 41,778 kga 8,358 kcal output/kcal input = 0.26
a) USDA, (2004).
b) Estimated based on the costs of machinery.
c) Pimentel & Pimentel, (1996).
d) Fertilizer quantities of N, P, and K were estimated based on the total costs of fertilizers.
e) Energy inputs estimated.
f) USDA, (1997).
g) Goods transported were machinery, fuel and seedlings.
h) It is assumed that a person works 2,000 hrs per year and utilizes an average of 8,100 liters of oil equivalents per year
(BP, 1999).
i) Pimentel, (1980).
j) Helsel, (1987).
k) Estimated energy inputs based on data from reference i.
l) Farm labor costs were estimated to be $10.00 per hour.
m) Diesel fuel was assumed to cost 21c/liter and gasoline was assumed to cost 29c/liter.
n) The fertilizer input was estimated to cost in total $225 based on data from reference a.
o) All the pesticides were assumed to cost $40 per kg.
p) Estimated.
q)Price of electricity is 7c per kwh (USCB, 2004).
r) Transportation was calculated to cost 30c per kg.
19C. Energy Inputs in Livestock Product Productions
Each year, an estimated 45 million tons of plant protein are fed to U.S.
livestock to produce approximately 7.5 million tons of animal protein (meat, milk,
and eggs) for human consumption (Pimentel, 2004). This includes about 28
million tons of plant protein from grains and 17 million tons from forages fed to
livestock. Thus, for every kilogram of high-quality animal protein produced,
livestock are fed nearly 6 kg of plant protein (Pimentel, 2004). There are major
differences in the inputs of feed and forage in the production of animal products.
For example, 13 kg of grain and 30 kg of forage are required to produce 1 kg of
beef; 1 kg of pork requires 5.9 kg of grain, whereas 1 kg of broiler chicken
requires only 2.3 kg of grain (Figure 3)(Table 13).
14
12
10
8
6
4
2
0
Beef Eggs Pork Broiler Milk
Figure 3. Grain inputs in kilograms per kilograms of livestock products produced.
.
In the conversion of plant protein into animal protein, there are two
principle categories of energy and economic costs: (1) the direct production
costs of the harvested animal, including the grain and forage feed; and (2) the
indirect costs of maintaining the breeding herd animals.
Either organic or conventional forage can be fed to ruminant animals, like
cattle and lamb, because they can convert the forage cellulose into digestible
nutrients through microbial fermentation. The total plant protein produced as
20forage on good U.S. pasture and fed to ruminants is about 60 percent of the
amount of protein produced by grains that are fed to animals (Pimentel, 2004).
Of course, there is variability between grain and forage crops. The yield per
hectare of forage is less than the yield per hectare of grain; and thus, the grass-
fed livestock would require more land.
Table 13. Grain and forage inputs per kilogram of animal product
produced, and fossil energy inputs (kcals) required to produce 1 kcal
of animal protein.
Livestock Grain (kg) Forage (kg) kcal input / kcal protein
Lamb 21 30 57:1
Beef cattle 13 30 40:1
Eggs 11 -- 39:1
Grass-fed beef cattle -- 200 20:1
Swine 5.9 -- 14:1
Dairy (milk) 0.7 1 14:1
Turkeys 3.8 -- 10:1
Broilers 2.3 -- 4:1
From: Pimentel, D. 2004. Livestock production and energy use. In, Encyclopedia of Energy,
Matsumura, R. (ed.), Elsevier, San Diego, CA. pages 671-676.
Diverse combinations of grains, forages, and legumes, including soybeans,
are fed to livestock to produce meat, milk, and eggs (Tables 1 and 13). The
major fossil energy inputs for grain and forage fed to animals include fertilizers,
farm machinery, fuel, irrigation, and pesticides. The energy inputs vary
according to the particular grain or forage being grown and fed -- as only grain
or forage and/or a mixture of grain and forage.
21There are many types of hay (dried forage), including grasses and forage
legumes. For example, switchgrass, a native grass, is used as livestock forage.
It yields about 10 t/ha with the application of fertilizers and when grown on
fertile soil (Table 14). This hay provides about 14 kcal in hay feed per 1 kcal
invested in fossil energy. Although 10 t is an excellent yield, it is still relatively
small when compared to corn, when both the corn grain and corn stover total
nearly 18 t/ha.
In the United States, the average protein yield of the major grains (plus
soybeans) fed to livestock is about 700 kg/ha. On average, to produce a
kilogram of plant protein fed to livestock requires about 10 kcal of fossil energy
(Pimentel, 2004).
As mentioned, feeding beef a combination
of grain and forage requires 40 kcal to produce 1
kcal of beef protein. However, the production of
beef protein on good organic pasture requires
one-half as much energy as grain-fed beef
production, or only 20 kcal (Figure 4)(Table 13).
Clearly, beef animal protein production on good
pasture uses significantly less energy than if the
animals are fed grain protein, because forage
production requires significantly less energy than
grain production (Pimentel, 2004).
Of the livestock systems evaluated, conventional and organic chicken-
broiler production is the most energy efficient, with 1 kcal of broiler protein
produced with an input of 4 kcal of fossil energy (Figure 4) (Table 13). Broilers
are a grain-only livestock system. Turkey production is also a grain-only system
and is next in efficiency with a 1:10 ratio.
Conventional milk production,
based on a mixture of grain and
forage feed, also is relatively
efficient with 1 kcal of milk protein
produced per 14 kcal of fossil
energy invested (Figure 4) (Table
13). Although nearly all the feed
protein consumed by broilers is
from grain, milk production uses
about two-thirds grain. Of course,
100 percent of milk production
could be produced using hay and/or pasture as feed.
22Table 14. Average inputs and energy inputs per hectare per year for
hay (switchgrass) production system.
Input Quantity 103 kcal Dollars
a b
Labor 5 hr 20 $65.00c
Machinery 30 kgd 555 50.00a
Diesel 100 Lc 1,000 50.00
Nitrogen 50 kge 800 28.00e
Seeds 1.6 kgf 100a 3.00f
Herbicides 3 kgg 300h 30.00a
TOTAL 10,000 kg yieldi 2,775 $226.00j
40 million kcal yield input:output ratio = 1:14.4k
a) Estimated.
b) It is assumed that a person works 2,000 hrs per year and utilizes about 8,000 liters of oil equivalents. Prorated this
works out to be 20,000 kcals.
c) The agricultural labor is paid $13.00 per hour
d) The machinery estimate also includes 25% more for repairs
e) Calculated based on data from David Parrish (Virginia Technology University), (2005).
f) Data from Samson, (1991).
g) Calculated based on data from Henning, (1993).
h) 100,000 kcals per kg of herbicide.
i) Samson et al.,(2000).
j) Brummer et al., (2000). Estimated a cost of about $400.00/ha for switchgrass production. Thus, the $226 total cost is
about 56% of the total that Brummer et al. estimate and this includes several inputs not included in Brummer et al.
k) Samson et al., (2000). Estimated an input per output return of 1:14.9, but have added several inputs not included in
Samson et al. Still the input/output returns are similar.
23In a Swedish organic milk production system, 29 percent less fossil energy
per unit of milk was used than the conventional milk production system.
However, significantly more land was required for the organic system (Cederberg
and Mattsson, 2000). Similarly in Denmark, an organic milk production system
required 35 percent less fossil energy per unit of milk than the conventional milk
production system (Refsgaar et al., 1998). Assuming similar fossil energy
reductions in organic milk production in the U.S., based on the Swedish and
Demark research, this would reduce the energy inputs required to produce a liter
of milk from about 2,000 kcal to about 1,400 kcal of fossil energy.
Both pork and egg
production depend primarily on
grain feed (Figure 4) (Table 13).
Producing 1 kcal of pork protein
requires 14 kcal of fossil energy
input. In contrast, egg production
is relatively costly in terms of feed
energy; 39 kcal of fossil energy is
expended for 1 kcal of egg
protein produced (Figure 4)
(Table 13).
45
40
35
30
25
20
15
10
5
0
Feed-Lot Grass-fed
Figure 4. Fossil energy input (kcal) per kcal of beef protein
produced in feed-lot compared to organic grass-fed beef.
24The two U.S. livestock systems that depend most heavily on forage, but
still use significant amounts of grain, are the beef and lamb production systems
(Table 13). Based on various combinations of grain and forage, 1 kcal of lamb
protein requires an input of 57 kcal of fossil energy; while for 1 kcal of beef, an
input of 40 kcal of fossil energy is required. If these animals were fed only on
good-quality forage, the energy inputs could be reduced by about half,
depending on the nutritional conditions of the pasture forage and the
management practices. This result is based on the production of beef fed 200 kg
of forage and no grain. The fossil energy input per 1 kcal beef protein in this
case required only 20 kcal of energy (Figure 4) (Table 13). Ample rainfall and
more land are critical for all productive pasture-forage systems, indeed for all
agricultural production.
Under a Swedish livestock production system, organic beef production
was less energy costly than conventional beef production, but required
significantly more land for production (Kumm, 2002). However, the
requirements for additional pasture can be offset by the reduced need for land to
grow feed grain.
Based on the analysis of a grass-fed
livestock production system in the United
States, it was estimated that about half of
current animal protein could be produced
on forage (Pimentel et al., 1980). In such
a grass-fed system, 60 percent less fossil
energy was required as well as 8 percent
less land. The extra land and energy were
used primarily for the production of the
grain crops necessary under the regular
grain/forage livestock production system.
The fossil energy input for all
animal protein production systems
analyzed averaged about 25 kcal of fossil
energy for each kcal of animal protein
produced (Figure 4) (Table 13). This
energy input is more than 10 times greater
than the average energy input to produce
grain protein. As a food for humans, animal protein has about 1.4 times the
biological value as a food, compared to grain protein, based on the availability of
the essential amino acids.
25III. WATER AND ENERGY USE IN CROPS
Past and current rainfall provides all the water required by humans and
their managed and natural ecosystems. All plants require water for
photosynthesis, growth, and reproduction. Water used by plants is essentially
non-recoverable, because some water becomes a part of the chemical makeup of
the plant, while the remainder is released as a vapor into the atmosphere. Both
the process of carbon dioxide fixation and temperature control require growing
plants to transpire enormous amounts of water.
Each year, U.S. agriculture consumes for crop production approximately 80
percent of all the fresh water utilized for various purposes (Pimentel et al.,
2004). A U.S. corn crop producing 9,000 kg/ha utilizes about 10 million liters of
water (Pimentel et al., 2004).
Worldwide only 17 percent of cropland is irrigated, but this irrigated land
produces 40 percent of the world’s food (FAO, 2002). In the U.S. about 16
percent of cropland is irrigated and provides 34 percent of the value of all crops
produced (USDA, 2003). Irrigation requires an ample source of water plus large
amounts of fossil energy, both for pumping and for delivering water to crops.
Overall, the amount of energy expended in irrigated crop production is significant
(Pimentel et al., 2004).
For example, irrigated wheat requires the expenditure of more than three
times the energy needed to produce the same yield of rainfed wheat. Rainfed
conventional wheat requires an energy input of only about 4.2 million kcal of
energy per hectare per year, while a hectare of irrigated wheat requires 14.3
million kcal per year to supply fossil fuel-based fertilizers and other inputs, plus
5.5 million liters of water (Figure 5) (Pimentel et al., 2004).
2616
14
12
10
8
6
4
2
0
Rainfed Irrigated
Figure 5. Total fossil energy input (million kcal) per hectare for about the same
wheat yield produced under rainfed conditions compared with irrigated wheat.
27IV. IMPROVING ENERGY EFFICIENCY IN ORGANIC FARMING SYSTEMS
Soil Organic Matter: Maintaining high levels of soil organic matter is
beneficial for all agriculture, but is especially critical on organic farms. On
average, the amount of soil organic matter is significantly higher in organic
production than in conventional farming.
Typical conventional farming systems with satisfactory soil generally have 3
percent to 4 percent soil organic matter, whereas organic systems soil averages
from 5.2 percent to 5.5 percent soil organic matter (Troeh et al., 1999). In the
22-year experiments at the Rodale Institute, the conventional farming system
averaged 4 percent, whereas the organic farming systems averaged 30 percent
higher, or 5.2 percent (Figure 6) (Pimentel et al., 2005). This high level of soil
organic matter in the organic systems is directly related to the high energy
efficiencies observed in organic farming systems; organic matter improves water
infiltration and thus reduces soil erosion from surface runoff, and it also
diversifies soil-food webs and helps cycle more nitrogen from biological sources
within the soil.
6.00%
5.00%
4.00%
3.00%
2.00%
1.00%
0.00%
Conv. Organic
Figure 6. Soil organic matter in the conventional and organic farming systems
after the 22-year experiments at the Rodale Institute.
28In the Rodale organic farming systems, the amount of organic matter in
the upper 15 cm of soil weighed approximately 110,000 kg per hectare (Pimentel
et al., 2005). Sullivan (2002) reported that approximately 41 percent of the
volume of the organic matter in the organic systems consisted of water,
compared with only 35 percent in the conventional systems. The soil in the
upper 15 cm of the Rodale experiments was estimated to weigh about 2.2 million
kg per hectare. The amount of water held in the Rodale organic system was
estimated to be at 816,000 liters per hectare. The large amount of soil organic
matter and water present in the organic systems is considered the major factor
in making these systems more tolerant of droughts. This was observed in the
Rodale organic systems, where corn-yields were about 30 percent higher than
those in the conventional corn system during drought years (Figure 7) (Pimentel
et al., 2005).
The 110,000 kg per hectare of soil organic matter in the organic corn
system could sequester 190,000 kg of carbon dioxide per hectare. This is 67,000
kg more carbon dioxide sequestered than in the conventional corn system. This
is the amount of carbon dioxide emitted by 10 cars that averaged 20 miles per
gallon and traveled 12,000 miles per year (USCB, 2004-2005).
8000
7000
6000
5000
4000
3000
2000
1000
0
C onv. C orn Organ. C orn C onv. Soy Organ. Soy
Figure 7. Drought year yields conventional corn, organic corn, conventional
soybeans, and organic soybeans (kilograms per hectare per year).
In the Rodale experiments, soil organic (soil carbon) matter was
significantly higher in both the organic animal and the organic legume systems
than in the conventional system (Pimentel et al., 2005). Soil carbon increased
29about 28 percent in the organic animal system and 15 percent in the organic
legume system, but only 9 percent in the conventional farming system.
Reduced Pesticide Use: Certified organic farming systems apply no
synthetic pesticides (Pimentel et al., 2005). Thus, in the 22-year experiments at
Rodale, no synthetic insecticides or herbicides were applied in the corn and
soybean organic plantings. Weed control in the organic systems was achieved
by crop rotations, cover crops, and mechanical cultivation (Pimentel et al., 2005).
Obviously, because no herbicides and insecticides were used in the organic
farming systems, this improved energy efficiency in the organic systems, when
compared to the conventional system.
.
Weed control with one pass of a
cultivator and one pass with a rotary hoe
would cost in terms of fossil energy
approximately 300,000 kcal/ha. However,
with herbicide weed control (6.2 kg/ha of
herbicide), plus the sprayer application,
this would total about 720,000 kcal/ha, or
about twice the energy compared with
mechanical weed control.
In general, organic farming systems collect about 1.8 times more solar
energy than conventional production systems because most use cover crops.
The cover crops growing on the land after the crop is harvested nearly double
the amount of solar energy that is harvested per hectare per year. Furthermore,
the cover crops also protect the land from soil erosion and water runoff, thereby
conserving soil nutrients and water.
Livestock Manure Use: The Rodale organic system that utilized livestock
manure represented a typical livestock operation in which grain crops were
grown for animal feed, not for cash sale (Pimentel et al., 2005). The rotation
used in this Rodale livestock system was more complex than the typical rotation
used in the conventional farming system. The Rodale grain-rotation systems
included corn, soybeans, corn silage for the cattle, wheat, and red clover-alfalfa
hay for the cattle, as well as a rye-cover crop before the corn silage and
soybeans were planted (Pimentel et al., 2005).
30The aged cattle manure served as the soil nitrogen source and was applied
at a rate of 5.6 tons per hectare, during two out of every five years. The
manure was applied immediately before plowing the soil for planting corn
(Pimentel et al., 2005). Additional nitrogen was supplied by the mow-down of
the legume-hay crops. The total amount of nitrogen applied per hectare in this
manure system was about 40 kg of
nitrogen per year (or a total of 198
kg of nitrogen per hectare for any
given year with a corn crop).
Crop Rotations and Cover
Crops: Crop rotations are beneficial
to all agricultural production systems
because they help control soil
erosion (Troeh et al., 1999; Delgado,
2005). They also help control insect
and plant pathogen pests as well as
control weeds (Pimentel et al.,
1993). They also facilitate the
effective use of available soil
nutrients (Troeh et al., 1999).
As mentioned, the use of cover
crops helps protect the exposed soil
from erosion after the main crop is
harvested (Troeh et al., 1999). In
addition, if the cover crops are
legumes, they add essential nitrogen
to the soil when plowed under.
Cover crops also aid organic agriculture in collecting more solar energy than in a
conventional farming system. In addition to soil organic matter, the use of cover
crops significantly reduced soil erosion in all the Rodale organic farming systems,
compared with the conventional farming systems that used no cover crops
(Pimentel et al., 2005). Cover crops that reduced soil erosion and conserved
soil organic matter increased the level of soil nitrogen and soil carbon in organic
systems compared with conventional systems.
For example, the Rodale organic investigation of nitrogen levels in organic
farming systems, compared with a conventional system, confirmed that the soil
nitrogen levels in the organic systems were 43 percent for the organic farming
systems compared with only 17 percent in the Rodale Institute conventional
system (Pimentel et. al., 2005).
31Biodiversity and Soil Organic Matter: Abundant soil organic matter is
a beneficial characteristic of productive organic farming soils and indeed all
sustainable agriculture. This is because soil organic matter is an important source
of soil nutrients and also helps increase biodiversity, which provides many
essential ecological services including crop protection from pests (Pimentel et al.,
2005; Pimentel et al., 1992; Troeh and Thompson, 1993; Lavelle and Spain,
2001; Mader et al., 2002).
For instance, earthworms and
arthropods are beneficial in constructing large
vertical holes in the soil that facilitate the
percolation of water down into the soil. This
decreases water runoff and increases water
availability for crops. The number of arthropods
in organic soils ranges per hectare from 2 million
to 5 million, and earthworms from 1 million to 5
million (Blakemore, 2000; Lavelle and Spain,
2001; Gray, 2003). In Denmark, microarthropods
and earthworms were reported to be twice as
abundant in organic farming than in
conventional agricultural systems (Hansen et al.,
2001). The biomass weight of earthworms per
hectare in agricultural soils can range from 2,000
to 4,000 kg (Lavelle and Spain, 2001). There
can be as many as 1,000 earthworm and insect
holes per square meter of land in organic
farming systems.
The addition of compost and other organics to the soil increases the number
of species of microbes present in the agroecosystem (van Elsen, 2000). This
significantly reduces crop diseases (Cook, 1988: Hoitink et al., 1991). The
Rodale experimental organic systems, which used no synthetic pesticides or
commercial fertilizers, resulted in minimizing the harmful effects of agricultural
chemicals on soil organisms (Pimentel et al., 2005).
Improved Energy Efficiency in Organic Farming Systems: The two
prime factors responsible for the reduced fossil energy expenditures in the
Rodale Institute organic systems during their 22-year experiments were: 1) the
replacement of the fossil-based commercial nitrogen used in the conventional
farming system with legume and/or livestock manure; 2) the reduced use of
fossil energy-based insecticides and herbicides in the organic farming systems
compared with the conventional farming systems (Pimentel et al., 2005). A third
important factor was improved overall management of the soil and nutrients by
using cover crops, especially legumes, which not only increased soil nitrogen and
32organic matter, but also helped conserve water resources throughout the
growing season and especially the drought years.
33V. CONCLUSIONS
Organic farming systems significantly reduce the fossil energy inputs in
production and also improve several aspects of agriculture’s environmental
performance compared with conventional farming systems.
This SSR reports several key findings:
• Fossil energy inputs in organic corn production were 31 percent lower
than conventional corn production, and the energy inputs for organic
soybean production were 17 percent lower than conventional soybean
production.
• No commercial nitrogen was used in the organic corn and soybean
production systems.
• No synthetic pesticides were used in the organic corn and soybean
production systems.
• Soil erosion was significantly reduced in the organic production
systems compared with the conventional production systems, thus
conserving nitrogen, phosphorus, and potassium.
• Water resources were conserved in the organic production systems
compared with the conventional production systems.
• Corn and soybean organic farming system-yields during drought years
were 30 percent and 50 percent higher than the conventional corn and
soybean-yields, respectively.
• Soil organic matter in the organic farming systems was 54 percent
higher than in the conventional farming systems.
• The organic corn farming system collected 180 percent more solar
energy than the conventional corn farming system.
• The organic beef grass-fed system required 50 percent less fossil
energy than the conventional grain-fed beef system.
34VI. BIBLIOGRAPHY
Blakemore, R.J. 2000. Ecology of earthworms under the “Haughley Experiment”
of organic and conventional management regimes. Biological Agriculture
and Horticulture 18: 141-159.
BP. 1999. British Petroleum Statistical Review of World Energy. British Petroleum
Corporate Communications Services, London.
Brummer, E.C., Burras, C.L., Duffy, M.D., and Moore, K.J. 2000. Switchgrass
Production in Iowa: Economic Analysis, Soil Suitability, and Varietal
Performance: Iowa State University, Ames, Iowa.
Campell, C.J. 2005. The Coming Oil Crisis. Multiscience Publishing Co. Essex, UK.
Cederberg, C. and Mattsson, B. 2000. Life cycle assessment of milk production
– a comparison of conventional and organic farming. Journal of Cleaner
Production 8: 49-60.
Cook, R.J. 1988. Biological control and holistic plant-health care in agriculture.
American Journal of Alternative Agriculture 3(2/3): 51-62.
Delgado, J.A. 2005. Keeping our Soil in Place with the Right Crop Rotation.
Erosion Control. http://www.forester.net/ec_0106_keep.html (11/4/05).
FAO. 1999. Agricultural Statistics. Food and Agriculture Organization. United
Nations. http://apps.fao.org/cgi_bin/nph-db.pl?subset-agriculture (4/10/01).
FAO. 2002. Crops and drops: making the best use of water for Agriculture.
Rome: FAO. www.fao.org/DOCREP/005/Y3918E/Y3918E00.htm (5/8/04)
Gray, M. 2003. Influence of Agricultural Practices on Earthworm
Populations. http://www.ag.uiuc.edu/cespubs/pest/articles/200305d.html. (8/2/03).
Hansen, B., Alroe, H.F. and Steen, K.E. 2001. Approaches to assess the
environmental impact of organic farming with particular regard to
Denmark. Agriculture Ecosystems and Environment 83(1-2): 11-26.
Helsel, Z.R. (ed.) 1987. Energy in Plant Nutrition and Pest Control. Volume 2.
Amsterdam, Elsevier Science Publisher. 239 pp.
Henning, J.C. 1993. Big Bluestem, Indiangrass and Switchgrass. Department of
Agronomy, Campus Extension, University of Missouri, Columbia, MO.
Hinman, H., Pelter, G., Kulp, E., Sorensen, E., and Ford, W. 1992. Enterprise
Budgets for Fall Potatoes, Winter Wheat, Dry Beans and Seed Peas under
Rill Irrigation. Farm Business Management Reports, Columbia,
Washington State University, Pullman, WA.
Hinman , H. and Schiriman, R. 1997. Enterprise Budgets. Summer Fallow-Winter
Wheat-Spring Barley Rotation, Columbia County, Washington State
University, Pullman, WA.
Hoitink, H.A.J., Inbar, Y. and Boehm, M.J. 1991. Status of compost-amended
potting mixes naturally suppressive to soil borne diseases of floricultural
crops. Plant Diseases 75(9): 869-873.
Kumm, K.I. 2002. Sustainability of organic meat production under Swedish
conditions. Agriculture, Ecosystems & Environment 88(1): 95-101.
35You can also read