Energy labels that make cents - Testing energy rating labels on appliances sold online - Behavioural Economics Team of the ...
←
→
Page content transcription
If your browser does not render page correctly, please read the page content below
Energy labels
                                                          that make cents
                                                          Testing energy rating labels
                                                          on appliances sold online

                                                          March 2018

Behavioural Economics Team of the Australian Government                                  1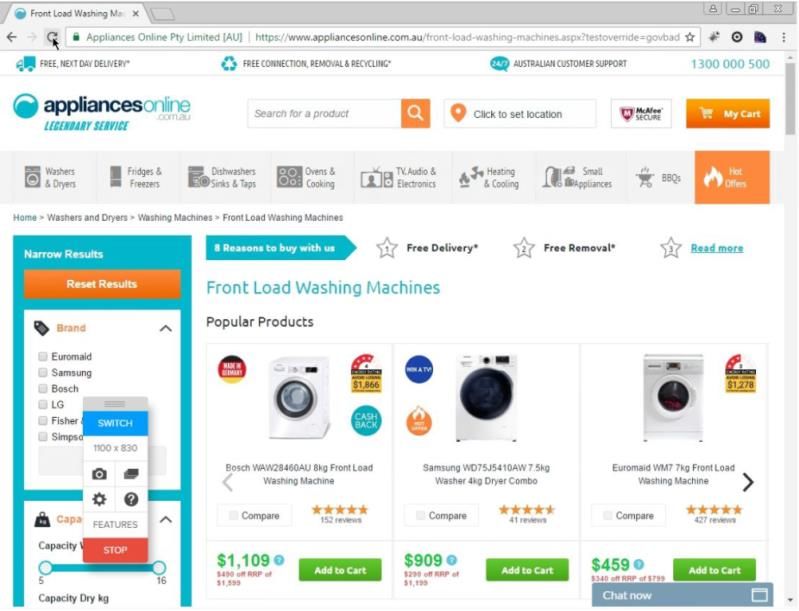
Energy labels that make cents: testing energy rating labels on appliances sold online

Who
Who are we?
We are the Behavioural Economics Team of the Australian Government, or BETA.
We are the Australian Government’s first central unit applying behavioural
economics to improve public policy, programs and processes.
We use behavioural economics, science and psychology to improve policy
outcomes. Our mission is to advance the wellbeing of Australians through the
application and rigorous evaluation of behavioural insights to public policy and
administration.

What is behavioural economics?
Economics has traditionally assumed people always make decisions in their best
interests. Behavioural economics challenges this view by providing a more realistic
model of human behaviour. It recognises we are systematically biased (for example,
we tend to satisfy our present self rather than planning for the future) and can make
decisions that conflict with our own interests.

What are behavioural insights and how are they useful for policy
design?
Behavioural insights apply behavioural economics concepts to the real world by
drawing on empirically-tested results. These new tools can inform the design of
government interventions to improve the welfare of citizens.
Rather than expect citizens to be optimal decision makers, drawing on behavioural
insights ensures policy makers will design policies that go with the grain of human
behaviour. For example, citizens may struggle to make choices in their own best
interests, such as saving more money. Policy makers can apply behavioural insights
that preserve freedom, but encourage a different choice – by helping citizens to set a
plan to save regularly.

Behavioural Economics Team of the Australian Government                                  2
Energy labels that make cents: testing energy rating labels on appliances sold online

Contents
Executive summary                                                                        4

Why?                                                                                     6

What we did                                                                              8

Results                                                                                 12

Limitations                                                                             15

Discussion and conclusion                                                               16

Appendices                                                                              17
    Appendix A – Prior research on energy label
    effectiveness on consumer purchasing behaviour                                      17
    Appendix B – Trial design and technical details                                     19
    Appendix C – List of experimental appliances                                        23
    Appendix D – Interpretation of results, trial limitations,
    and additional results                                                              25

References                                                                              33

Behavioural Economics Team of the Australian Government                                      3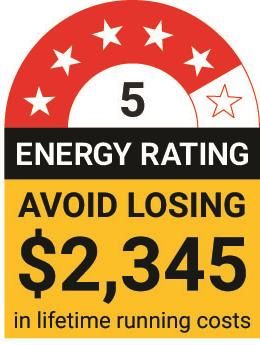
Energy labels that make cents: testing energy rating labels on appliances sold online

Executive summary
In 2015, Australian households contributed 11.1 per cent of Australia’s carbon
emissions (Commonwealth of Australia, 2017), with about 45 per cent of these
carbon emissions accounted for by household appliances and equipment (Reidy and
Milne, 2017). Lower efficiency appliances contribute greater emissions and cost
consumers more to run.
To encourage production of more energy efficient appliances and assist consumers
to make more informed choices, the Australian Government requires an Energy
Rating Label on appliances sold in stores. This requirement does not extend to
appliances sold online.
Energy labels can provide important information on energy consumption and running
costs, which consumers may otherwise be unaware of when making decisions about
which appliances to buy. Absence of this information could lead them to undervalue
more efficient appliances. Higher energy efficient appliances often cost more
up-front, but over time can lower household energy bills and reduce overall
emissions. The Energy Rating Label aims to help consumers compare the energy
efficiency of similar appliances by providing information on average annual energy
use in kilowatt-hours (kWh) and assigning a star rating to each appliance.
In partnership with the Department of the Environment and Energy (DoEE) and
Appliances Online we conducted a randomised controlled trial (RCT) to test the
impact of energy labels on decisions made by Australian consumers shopping for
appliances in an online environment. We assessed the impact of the Energy Rating
Label and we used behavioural insights to design and test an alternative label.
Growing evidence from behavioural economics shows most people have difficulty
making decisions when they have to weigh immediate costs against future benefits
accruing slowly over time, and comparing multiple options with multiple attributes. To
address this, we designed a simple, more salient label to inform consumers of how
much money they could avoid losing by buying a more efficient appliance compared
to the lowest rated, one-star appliance of the same size and capacity.
Information on the alternative label was expressed in simple dollar terms rather than
the more abstract kWh metric. We expected this form of labelling would make
consumers more aware of hip-pocket costs – for example, a person buying a
four-star top mount fridge could avoid losing $1,700 in lifetime running costs
compared to a one-star top mount fridge.

Behavioural Economics Team of the Australian Government                                  4
Energy labels that make cents: testing energy rating labels on appliances sold online

We found energy labels have positive effects on consumer behaviour compared to
no labels. These effects are large enough to warrant consideration by policy makers
interested in the twin policy goals of reducing carbon emissions and household
energy costs. For example, consumers who viewed the labels were 11 per cent more
likely to add higher efficiency appliances to the cart and 20 per cent more likely to
purchase higher efficiency appliances than consumers who did not see a label.
However, most of our estimates are not ‘statistically significant’ according to
conventional tests, so for these and related reasons, we only have moderate
statistical confidence in this conclusion.
Our alternative behaviourally-informed label – presenting lifetime running costs as
avoided losses – was not found to be any more effective than the Energy Rating
Label at encouraging consumer interest in higher efficiency appliances. A possible
explanation for this result is the way the information was presented. Framing
information about lifetime running costs as ‘avoided losses’ may have confused
consumers. In an online environment, consumers may be more familiar with simple
calls to action to ‘save’ money rather than to ‘avoid losing’ money.

 Box 1: Appliances Online

 Established in 2005, Appliances Online is an Australian online retailer of white goods and
 home appliances. The company is a subsidiary of the family-run Winning Group,
 encompassing Big Brown Box and Winning Appliances.
 Appliances Online’s product range includes fridges, freezers, washers, dryers,
 dishwashers, ovens and TVs.
 The company has more than 300,000 consumers nation-wide.

Behavioural Economics Team of the Australian Government                                       5
Energy labels that make cents: testing energy rating labels on appliances sold online

Why?
Policy context
The National Energy Productivity Plan (NEPP) seeks to deliver a 40 per cent
improvement in Australia’s energy productivity by 2030 (COAG Energy Council,
2015). Better energy productivity helps consumers manage energy costs and helps
meet Australia’s 2030 greenhouse gas emissions reduction target. One of the ways
the NEPP is looking to drive greater energy efficiency is by empowering consumers
with information to make better energy consumption choices (COAG Energy Council,
2015). Household appliances and equipment account for approximately one-third of
household energy use and about 45 per cent of household greenhouse gas
emissions (Reidy and Milne, 2017).
The Australian Government employs a range of strategies to help consumers reduce
household energy use and emissions. One of these strategies is to provide
information on the energy efficiency of different appliances through the Energy
Rating Label.
The Greenhouse and Energy Minimum Standards Act 2012 implements the
commitments of the Australian Government and the Council of Australian
Governments (COAG) to establish national legislation to regulate energy efficiency
and labelling standards for appliances and other products. This legislation allows the
Australian Government to set nationally consistent labelling requirements to increase
Australians’ awareness of options to improve energy efficiency and reduce energy
consumption, energy costs and greenhouse gas emissions.
In Australia it is mandatory for retail stores in every state and territory to display the
Energy Rating Label on a range of appliances.1 The label summarises an
appliance’s energy efficiency in two ways.2 It displays a star rating (out of a possible
10) indicating how energy efficient the appliance is compared with similar models of
the same size or capacity. The label also provides an estimate of how much energy
(in kilowatt-hours or kWh) the appliance will use over a year.
Energy Rating Labels are displayed as stickers prominently placed on the front of
these appliances. It is not mandatory for online retailers to display the label next to
such appliances.

1. Mandatory labelled appliances include: air conditioners (single phase, non-ducted); clothes washers; clothes dryers; dishwashers;
   televisions; refrigerators; freezers; and computer monitors.

2. The Energy Rating Label used in this trial is for online use. Online use of this label is not regulated under the Greenhouse and
   Energy Minimum Standards (GEMS) Act 2012 but is based on the in-store regulated label under the Act.

Behavioural Economics Team of the Australian Government                                                                                6
Energy labels that make cents: testing energy rating labels on appliances sold online

The problem
The impact of energy labels on consumer purchasing behaviour is largely unknown.
Existing evidence on the effects of energy labels is limited and largely comes from
studies conducted in laboratory and hypothetical choice settings (see Appendix A).
These studies may not accurately reflect how consumers behave when making real
buying decisions, especially in an online environment. Field trials with labels are
rare, have to date been conducted only outside Australia, and have yielded mixed
results.
A consumer survey conducted by the COAG Energy Council’s Equipment Energy
Efficiency (E3) Committee assessed respondent awareness and understanding of
the Energy Rating Label on air conditioners. It found label recognition to be high,
with approximately 97 per cent of those surveyed saying they recognised the label.
In contrast, label understanding and interpretation were considerably lower, at 72 per
cent (ACIL Allen Consulting, 2014).
While these results are encouraging, it is important to note survey measures of self-
reported awareness and knowledge are notoriously biased upwards and tend to
overstate true levels of awareness and knowledge (Bishop et al., 1986). Awareness
and knowledge of a label also do not necessarily imply the label is helpful in
informing consumer choices.

Behavioural Economics Team of the Australian Government                                  7
Energy labels that make cents: testing energy rating labels on appliances sold online

What we did
What we did for this study
BETA and DoEE developed this trial to test whether energy labels are effective at
encouraging consumers to purchase more energy efficient appliances and whether
an alternative label, presenting key information in a new way to take into account
some common behavioural biases, might be more effective than the Energy Rating
Label.

Behavioural analysis
Consumers may under-invest in energy efficient appliances that would save them
money over time due to lower operating costs. This is sometimes referred to as the
‘energy-efficiency gap’ (Jaffe and Stavins, 1994). Insights from behavioural
economics help explain this gap and how it might be bridged.
In general, the research indicates people have difficulty making rare and infrequent
decisions – like decisions about purchasing a large appliance – when it requires
analysing a great deal of information, some of it technical and unfamiliar. Difficulties
making decisions also arise when comparing multiple options with multiple attributes,
and weighing immediate costs – including a higher sticker price – against future
benefits accruing slowly over time, such as lower running costs. People often use
quick ‘short cuts’ or heuristics to simplify problems and make a quick choice, ignoring
critical information; for example, efficiency and what it means for the overall cost of
an appliance.
One way to help people overcome this problem is to provide simple information in a
salient way. An obvious approach is to modify the Energy Rating Label and provide
people with the dollar cost of operating the appliance rather than information on kWh
used, as people may struggle to understand and make use of the latter. Another
approach we could use here is to frame energy consumption information in terms of
the money people would lose in extra running costs if they choose not to buy the
more efficient appliance.3 People tend to worry more about losses than they value
gains of the same magnitude (Kahneman and Tversky, 1979; 1984). A label framing
the lifetime running costs of alternative appliances in terms of avoided losses, rather
than amounts saved, may therefore have a larger impact.

3. For a similar approach see Bull (2012).

Behavioural Economics Team of the Australian Government                                    8
Energy labels that make cents: testing energy rating labels on appliances sold online

Based on these behavioural insights we designed an alternative label with a modified
energy consumption figure. The energy consumption figure in the alternative label
shows the avoided financial loss, in terms of lifetime running costs, of purchasing the
appliance compared to the lowest rated, one-star appliance of the same size and
capacity. This provides a relative measure the consumer can use to identify which
appliance will help them reduce spending over the appliance’s life. For example, a
person buying a four star top mount fridge could avoid losing $1,700 in lifetime
running costs compared to if they bought a one star top mount fridge.
The alternative label was otherwise identical in size, shape, and colour, and, as with
the Energy Rating Label, it included the graphical star rating.4 This was to ensure the
only difference between the two labels was the way information about the
appliance’s energy consumption was presented. The different label designs are
presented in Figure 1.

Figure 1: Energy label designs

Energy Rating Label                             Alternative label

 Box 2: Common biases affecting human behaviour

 Cognitive overload may lead people to forget things, delay decisions, stick to the default
 option or otherwise make an inferior choice when presented with too much information.
 Inattention to key considerations, as people simplify a complex decision by processing only
 a limited subset of information.
 Loss aversion is encapsulated in the expression ‘losses loom larger than gains’ as the
 pain of losing is psychologically about twice as powerful as the pleasure of gaining. Loss
 aversion explains why people tend to prefer avoiding losses to acquiring equivalent gains.
 Present bias is when people overweight the immediate implications of their decisions
 compared with the impacts they have in the future.

4. Where an appliance model has six stars or less, the star rating will be displayed on the label out of a possible six stars. Highly-
   efficient models of seven of 10 stars have additional stars displayed in a band above the regular six star label. All appliances in
   this trial were six stars or less.

Behavioural Economics Team of the Australian Government                                                                                  9
Energy labels that make cents: testing energy rating labels on appliances sold online
The trial
We ran a RCT where just under 40,000 visitors to the Appliances Online website
during the trial period (1 to 29 March 2017) were randomly assigned to one of three
groups. The control group (13,142 people) always viewed the website in the
standard form – with no energy rating labels. Another group (13,199 people) saw the
website with the Energy Rating Label positioned next to each experimental
appliance. The third group (13,273 people) saw the website with the alternative label
positioned next to each experimental appliance.
Box 3: What is a randomised controlled trial?
Well-designed randomised controlled trials (RCTs) provide the best empirical method for
determining a policy’s quantifiable impacts. In this respect, RCTs are considered the ‘gold
standard’ for impact evaluation. RCTs work by randomly separating people into two or
more groups, in a manner similar to flipping a coin. People in a ‘treatment’ group receive
an intervention (new policy) while people in the ‘control’ group receive the
business-as-usual experience. On average, the difference in outcomes between people in
a treatment group and in the control group reflects the causal impact of the new policy.
We displayed label designs on the Appliances Online website next to some, but not
all, appliances. The labelled appliances included 34 of their most popular appliances,
hereafter referred to as ‘experimental appliances’, in four appliance categories: smart
TVs, vented dryers, fridges, and washing machines. Experimental appliances
appeared on two types of web pages: the ‘filter page’ for each appliance category;
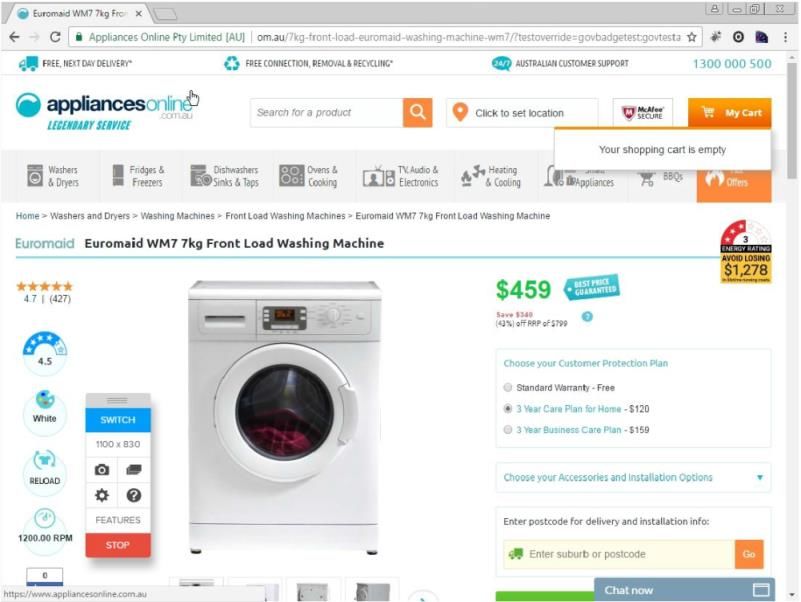
and the ‘appliance page’ associated with each experimental appliance. See Figure 2
and Figure 3 for examples of each web page.
To gauge the impact of the labels on shopping behaviour, we examined three key
outcomes:
Customer engagement: clicks on experimental appliances to view more
detailed appliance information.
Customer intent-to-purchase: clicks to add experimental appliances to the
online shopping cart.
Customer purchases: clicks to complete payment for experimental
appliances in the shopping cart.
We classified the experimental appliances as ‘higher efficiency’ or ‘lower efficiency’
(see Appendix B for details). For higher efficiency appliances, we anticipated more
people who saw the versions of the web pages with the Energy Rating Label or the
alternative label would click on, add to cart and purchase experimental appliances
than people who saw no energy label. The information contained on the labels was
designed to help consumers understand the value associated with higher energy
efficiency appliances compared with lower efficiency appliances, and make them
more appealing.
Behavioural Economics Team of the Australian Government 10Energy labels that make cents: testing energy rating labels on appliances sold online We also anticipated more people shown the alternative label would click to view, add to cart and purchase experimental appliances than those who saw the Energy Rating Label. This is because we expected information on avoided financial losses, in terms of lifetime running costs, would be more powerful than information on energy consumption presented in kWh. More detail on the trial design is in Appendix B. Figure 2: Screen shot of experimental filter page Figure 3: Screen shot of experimental appliance page Behavioural Economics Team of the Australian Government 11
Energy labels that make cents: testing energy rating labels on appliances sold online
Results
Our best estimate of results is labels have positive effects on consumer behaviour
large enough to matter for the twin policy goals of reducing carbon emissions and
household energy costs. However, most of our results are not ‘statistically significant’
according to conventional tests so, for this and related reasons, we have only
moderate statistical confidence in this conclusion.
The outcomes for higher efficiency experimental appliances were consistently
greater for consumers who viewed either of the energy labels than among
consumers in the control group who did not see a label (see Figure 4, Table 1 and
Table 2). For example, when we compared the no-label control group with the
pooled results for the two treatment groups:
customer engagement (click) increased by 3.7 per cent, from 10.8 per cent
for the control group to 11.2 per cent for the combined treatments (p=0.32)
customer intent-to-purchase (add to cart) increased by 11 per cent, from
3.6 per cent to 4.0 per cent (p=0.04)
customer purchases (purchase) increased by 20 per cent, from 1.0 per cent
to 1.2 per cent (p=0.09).
These results are consistent in their direction, in that they all suggest increased
interest in higher efficiency experimental appliances, and the effect of energy labels
in increasing experimental appliance add to carts and purchases was large.
However, most of the estimates are not ‘statistically significant’ for the conventional
threshold of pEnergy labels that make cents: testing energy rating labels on appliances sold online
Table 1: Outcomes for higher efficiency experimental appliances
Control Group Energy Rating Alternative Either label
(no label) Label Label (pooled)
Number of
N=13,142 N=13,199 N=13,273 N=26,472
consumers
10.8% 11.2% 11.2% 11.2%
Click
(n=1,424) (n=1,473) (n=1,485) (n=2,958)
3.57% 3.99% 3.97% 3.98%
Add to cart
(n=469) (n=527) (n=527) (n=1,054)
1.01% 1.23% 1.18% 1.21%
Purchase
(n=133) (n=163) (n=156) (n=319)
Table 2: Differences in outcomes for higher efficiency experimental appliances
Control Group vs Control Group vs Energy Rating Control Group vs
Energy Rating Alternative Label Label vs Either Label
Label Alternative Label (pooled)
0.32% 0.35% -0.028% 0.34%
Click p=0.41 p=0.36 p=0.94 p=0.32
(-0.44, 1.08) (-0.41, 1.11) (-0.73, 0.79) (-0.32, 0.98)
0.42% 0.40% -0.022% 0.41%
Add to cart p=0.07 p=0.09 p=0.92 p=0.04
(-0.04, 0.89) (-0.06, 0.86) (-0.49, 0.45) (0.02, 0.81)
0.22% 0.17% -0.060% 0.20%
Purchase p=0.09 p=0.20 p=0.66 p=0.09
(-0.03, 0.48) (-0.09, 0.41) (-0.32, 0.20) (-0.02, 0.41)
Note: results are reported as “difference in proportions, p-value (95% confidence interval)”. In some
instances, the differences in proportions appear inconsistent with those that can be inferred from
Table 1. This is due to rounding.
Behavioural Economics Team of the Australian Government 13Energy labels that make cents: testing energy rating labels on appliances sold online Figure 4: Increase in outcomes for higher efficiency appliances, labels (Pooled) versus no label (Control), percentage points Note: The error bars are 95% confidence intervals. Did the alternative label have more impact than the Energy Rating Label? We found no clear difference between the Energy Rating Label and the alternative label we designed for the trial, in terms of experimental appliance clicks, add to carts and purchases. The differences in the proportions of consumers clicking to view, adding to cart, and purchasing experimental appliances among those who saw the Energy Rating Label and those who saw the alternative label (see the third column in Table 2) are close to zero in each case. This means we found no evidence for the alternative label having more or less impact on consumer behaviour than the Energy Rating Label. Behavioural Economics Team of the Australian Government 14
Energy labels that make cents: testing energy rating labels on appliances sold online

Limitations
The principal limitations of this trial relate to variations from our pre-analysis plan. We
discuss these variations, and our justification for them, in Appendix D. In brief, these
relate to our choice of primary outcome variable (from the three available), our
decision to pool the results for the two treatment groups (who viewed either the
Energy Rating Label or the alternative label), and our preferred method of analysis,
which assessed consumer preferences for higher efficiency experimental appliances.
The sample size for the study was smaller than anticipated. This means our
estimates of label effects are less precise than expected. We excluded a sub-sample
of trial participants (n=18,734 or 32 per cent of the entire sample) who came to the
Appliances Online website via a link (for example, from a search engine) leading
them directly to a detailed appliance page, without ever navigating to a filter page
where they could have made appliance comparisons. More detail on this and other
data exclusions are set out in Appendix B.
About 10 per cent of the trial sample saw an incorrectly rendered label (either the
Energy Rating Label or the alternative label) when they visited the website and so
we excluded them from the analysis. The trial duration was extended to compensate
for this loss of sample.
We also faced trial design restrictions in relation to the number of labelled appliances
and the size of the labels and we made a series of choices about the design of the
alternative label. Other designs may have had a greater impact.
Finally, we faced some minor technical limitations (see Appendix D).

Behavioural Economics Team of the Australian Government                                       15
Energy labels that make cents: testing energy rating labels on appliances sold online

Discussion and
conclusion
Energy labels are widely used and mandated across the world. They provide
important information on energy consumption and running costs, of which
consumers may otherwise not be aware when making decisions about which
appliances to buy. Absence of this information could lead them to undervalue more
efficient appliances. As far as we are aware, this is the first time the Energy Rating
Label has been tested.
The results of this trial suggest the presence of energy labels in an online
environment have a positive impact on customer behaviour when it comes to
purchasing higher efficiency appliances.
However, we found no evidence for our alternative behaviourally-informed label –
presenting lifetime running costs as avoided losses – being any more effective than
the Energy Rating Label at encouraging consumer interest in higher efficiency
appliances. This finding does not mean behavioural designs do not work: other label
designs may perform better in terms of attracting attention of consumers and
encouraging consideration of energy efficiency.
Further research replicating this trial and correcting for limitations would provide
increased confidence in the results. In seeking to optimise energy label
effectiveness, further research may investigate what labels work best to help people
quickly compare appliances and make well-informed choices aligned with their goals,
in store settings as well as in online environments.
Running trials to inform policy in government is still fairly new. BETA has been
established to demonstrate the value of incorporating rigorous, experimental
evidence in policy design and is learning from running trials in its own right. This trial
has generated lessons for policy makers, in particular the importance of testing to
build an evidence base for what works.
The trial also generated several lessons for BETA and others conducting research in
this area. In particular, the importance of reviewing pre-analysis plans before trial
implementation, conducting small-scale pilots before launching the trial,
understanding the format of the raw output data, and using qualitative data such as
interviews and focus groups to inform the trial design.

Behavioural Economics Team of the Australian Government                                      16
Energy labels that make cents: testing energy rating labels on appliances sold online

Appendices
Appendix A – Prior research on energy label effectiveness on consumer
purchasing behaviour
Mandatory energy labels are now required by governments in many countries to help
inform consumer choices when purchasing household appliances. Labels can
present information about the appliance’s energy consumption in physical units for a
single use or in typical use over a period of time (for example, kWh per year): the
latter is the approach used in the US EnergyGuide and Canadian EnerGuide labels.
Labels can also show ratings allowing simple comparisons between similar
appliances in terms of energy efficiency. For example, the EU Energy label assigns
appliances letter grades from A to G. The Energy Rating Label combines these
approaches, providing information on energy consumption for each appliance along
with a rating in the form of a number of stars on a 10-star scale.
To date, few studies have attempted to rigorously assess the extent to which energy
labels affect real consumer choices. Most studies were laboratory experiments or
survey experiments examining how individuals respond to different information on
labels when considering hypothetical choices between appliances. These studies
tended to investigate whether providing information about consumption in terms of
dollar costs rather than in physical units, or providing these measures over shorter or
longer periods, makes a difference to (hypothetical) choices. The evidence, while
mixed, seems to suggest providing monetary information has a larger impact on
stated choices as long as the operating costs are calculated over the appliance’s
expected lifetime.6
To our knowledge only four field experiments have examined the impacts of energy
labels on real purchasing decisions. Results from these studies are mixed, but on
balance provide limited evidence for energy labels influencing consumer choices. An
early experiment run in Canadian stores tested versions of the Canadian EnerGuide
label showing energy consumption in either kWh a month or dollars a year
(combined with sales staff pointing out this information to consumers as they
shopped) applied to refrigerators (Anderson and Claxton, 1982). A similar type of
experiment was conducted more recently in Norway in stores selling fridge-freezers
and tumble driers, with labels (displayed in addition to the mandatory EU Energy
label) providing information about lifetime running costs (Kallbekken et al., 2013).

6. For summaries see Rohling and Schubert, 2013 ; Schubert and Stadelmann, 2015.

Behavioural Economics Team of the Australian Government                                   17
Energy labels that make cents: testing energy rating labels on appliances sold online

Both studies report only weak or no impacts from energy labels on the energy
efficiency of appliance purchases.
In another study conducted in UK stores, researchers displayed labels showing
lifetime running costs information on washing machines, washer-dryers and tumble
dryers. Some stores contained labelled appliances where others did not. The
researchers also trained staff in these stores in how to communicate lifetime running
cost information to consumers. During the trial period, washing machines and tumble
dryers sold in the labelled stores were no more energy efficient on average than
those sold in the other stores. In contrast, washer dryers sold in the labelled stores
were 0.7 per cent more energy efficient on average than those sold in the
non-labelled stores. Yet it was not possible to isolate the influence of the label on
customer purchasing decisions from staff training influences
(Department of Energy and Climate Change, 2014).
In the most recent field trial, Stadelmann and Schubert (2018) examined online
purchasing of freezers, tumble driers, and vacuum cleaners in Switzerland and
assessed the impact of the EU Energy Label compared with an alternative label
showing the lifetime operating costs of each appliance in monetary terms. The
results were again mixed: while showing either of the labels on the site increase the
sales proportion of the more energy efficient appliances, the labels also induce
consumers to purchase large volume freezers, and the monetary-cost label
appeared to lead consumers toward purchasing less efficient vacuum cleaners.

Behavioural Economics Team of the Australian Government                                  18
Energy labels that make cents: testing energy rating labels on appliances sold online
Appendix B – Trial design and technical details
Experimental design
Our study tested two different energy labels for 34 experimental appliances sold on
the Appliances Online retail website. We chose the experimental appliances from
four appliance categories across seven appliance types:
smart TVs
vented dryers
fridges (bottom-mount, top-mount, and multi-door)
washing machines (front-load and top-load)
All experimental appliances had a star rating of greater than one. This allowed us to
compare each appliance to a one-star rated appliance in the same category, helping
us calculate the ‘avoided cost’ in lifetime running expenses for each experimental
appliance.
We classified the 34 experimental appliances as ‘higher efficiency’, ‘lower efficiency’
or neither by ranking appliances within each of the four appliance categories
according to their energy efficiency ratings. We classified all appliances above the
median (within an appliance category) as ‘higher efficiency’ while appliances below
the median were classified as ‘lower efficiency’. A list of all experimental appliances
and their classification within each category is provided in Appendix C.
Experimental appliances appeared on two types of experimental web pages:
‘filter pages’ for each of the seven appliance types
‘appliance pages’ associated with each experimental appliance
Filter pages featured labels to the right of each experimental appliance. This allowed
consumers to make a ready comparison of the energy efficiency of similar
appliances. When a consumer clicked on a particular appliance, they were taken to
an appliance page where they could see a close-up image of the appliance and
additional appliance information. Appliance pages for each experimental appliance
displayed a label in the top right-hand corner of the page.
Behavioural Economics Team of the Australian Government 19Energy labels that make cents: testing energy rating labels on appliances sold online
Power calculations
The trial pre-registration reports the power analysis used to determine how many
people we would need in the trial to detect an effect of the labels (if indeed they have
an effect). Specifically, the pre-registration states that a sample of approximately
48,000 non-unique visitors to the experimental filter pages will provide at least
80 per cent power at a five per cent significance level (with two sided tests) to detect
a five per cent increase in ‘customer engagement’ (that is, clicks to view detailed
information about labelled appliances). While we expected around 48,000 visitors
over the trial period, the eventual number – after data cleaning (described below) –
was 39,614.
The sample frame and data
The trial took place between 1 March and 29 March 2017. The eligible participants
were all visitors to the Appliances Online website during this period.
We received the raw data from Appliances Online in four data sets (described
below). Each of these data sets had separate records for each ‘domain session ID’.
A new session commenced: whenever a visitor left the site and returned to it later, or
after 15 minutes on the site. Whenever visitors allowed cookies on their web
browser, we collated multiple sessions into a single record (‘device ID’). If the visitor
did not allow cookies then it was not possible to collate multiple sessions on the site.
Each session was treated as a separate record in our cleaned data. Thus, with this
exception, we applied our randomisation procedure to each device, not to each
session.
The four raw data sets were as follows:
Filter page views: this captured all visitors to the experimental filter pages
and provided the denominator for the outcome variables.
Filter page events: this captured only those visitors who clicked for more
information (or added an appliance to cart directly from the filter page).
Appliance page events: this captured all visitors who viewed an appliance
page and it also captured whether those visitors added the appliance to cart.
Purchase events: this captured all purchases by visitors who had added an
appliance to cart.
We merged these four data sets together based on the ‘device IDs’ derived from the
‘domain session IDs’ in the Filter Page Views dataset. However, some domain
session IDs in the other three data sets did not correspond to a device ID (or domain
session ID) in the first data set – we dropped these records from the analysis. We
were unable to determine why this mismatch occurred however the total number of
records dropped was small (less than three per cent of the total) and were evenly
distributed between the experimental groups. We believe that it is unlikely that this
caused any selection bias.
Behavioural Economics Team of the Australian Government 20Energy labels that make cents: testing energy rating labels on appliances sold online
Finally, we took the combined data set and merged two additional data sets with
appliance information for each appliance (for example, kWh, star rating and
appliance price). We used these variables in exploratory analysis discussed in
Appendix D.
Randomisation
The trial was an individually randomised controlled trial. Appliances Online randomly
assigned participants (that is, devices) to the control group and two treatment groups
with an even (1:1:1) allocation ratio. Specifically, the randomisation code allocated
13,142 devices to the control group, 13,199 devices to the group who saw the
Energy Rating Label and 13,273 devices to the group who saw the alternative label.
Participants were not stratified and we did not conduct balance checks due to the
lack of any suitable variables.
Outcome measures
To gauge label effects on shopping behaviour, we examined three key outcomes:
Customer engagement: clicks on experimental appliances to view more
detailed appliance information.
Customer intent-to-purchase: clicks to add experimental appliances to the
online shopping cart.
Customer purchases: clicks to complete payment for experimental
appliances in the shopping cart.
We defined the three outcome measures for each website visitor as binary variables.
The definitions are set out in the table below.
Table B1: Outcome variable definitions
Outcome variable Definition
Customer 1 = the visitor clicked for more information for at least one higher
engagement efficiency appliance
0 = otherwise
Add to cart 1 = the visitor added at least one higher efficiency appliance to cart
0 = otherwise
Purchase 1 = the visitor purchased at least one higher efficiency appliance
0 = otherwise
Behavioural Economics Team of the Australian Government 21Energy labels that make cents: testing energy rating labels on appliances sold online Analysis For each experimental group, we derived percentages for each outcome variable. For example, we derived the percentage of website visitors who purchased at least one higher efficiency experimental appliance, as a proportion of all visitors. To account for these percentages, we analysed the results using a z-test to compare proportions across experimental groups (specifically, using the prtesti command in Stata). This method tests whether there is a difference in the proportions for two experimental groups. The method described above was our preferred method of analysis. We also produced results based on two variations to this preferred method. Both variations altered the definition of the outcome variable but used the same test-of-proportions method. See Appendix D for further discussion and results. Behavioural Economics Team of the Australian Government 22
Energy labels that make cents: testing energy rating labels on appliances sold online

Appendix C – List of experimental appliances

Table C1: List of appliances that formed part of the trial
(‘higher efficiency appliances’ are shaded dark grey)

   Product                         Type                        Model                    Star rating

   Televisions                     Smart TV                    32P1S                    6

                                   Smart TV                    55UH652T                 6

                                   Smart TV                    UA75JU6400               5

                                   Smart TV                    50E5900US                5

                                   Smart TV                    UA40KU6000               4

                                   Smart TV                    UA50KU6000               4

                                   Smart TV                    UA55KU6000               4

                                   Smart TV                    UA60KU6000               4

   Refrigerators                   Bottom mount                SRL458ELS                4

                                   Bottom mount                SRL457MW                 4

                                   Bottom mount                WBE5300SARH              3.5

                                   Multi-door                  RF522ADUSX5              3.5

                                   Top mount                   SR318LSTC                3.5

                                   Top mount                   SR254MW                  3.5

                                   Multi-door                  WHE5200SA-D              3

                                   Multi-door                  EQE6207SD                3

                                   Multi-door                  SRF583DLS                2.5

                                   Top mount                   HRF224FW                 2.5

   Washing Machines                Front load                  WAW28460AU               4

                                   Front load                  WAE22466AU               4

                                   Front load                  WW75J4233GW              4

                                   Front load                  WD1200D                  3.5

                                   Front load                  WD12021D6                3.5

                                   Front load                  WM7                      3

                                   Top load                    WA80F5G4DJW              2.5

                                   Top load                    WA65F5S2URW              2

   Clothes Dryers                  Vented                      DE5060M1                 2

Behavioural Economics Team of the Australian Government                                               23
Energy labels that make cents: testing energy rating labels on appliances sold online
Product Type Model Star rating
Vented DE4060M1 2
Vented EDV6051 2
Vented DM4KG 2
Vented DE6060G1 2
Vented MDV07 2
Vented 39P400M 1.5
Vented 39S500M 1.5
Behavioural Economics Team of the Australian Government 24Energy labels that make cents: testing energy rating labels on appliances sold online
Appendix D – Interpretation of results, trial limitations, and additional
results
This Appendix provides further discussion of our interpretation of the results reported
in the Results section along with the results of additional analysis. It is structured as
follows:
Section D.1 provides context by discussing the current academic debate
about the use of ‘statistical significance’ and ‘p-values’ to interpret results.
Section D.2 expands on our interpretation of the results and presents our
justification for our ‘preferred method of analysis’, along with some notes of
caution.
Section D.3 discusses other trial limitations.
Section D.4 describes additional analysis of the impact of energy labels on
lower efficiency appliances.
Section D.5 presents the results of alternative methods of analysis for all
appliances.
D.1 The debate about statistical significance and p-values
Our findings are based, in part, on the ‘p-values’ associated with our estimates and
on the conventional test for a ‘statistically significant’ finding of pEnergy labels that make cents: testing energy rating labels on appliances sold online An alternative position in the debate on p-values, put forward by 72 co-authors, argued that statistical significance (for ‘new findings’) should require a more stringent threshold of p
Energy labels that make cents: testing energy rating labels on appliances sold online

We shifted our focus away from Customer Engagement as the primary outcome for
two reasons. First, it is the least important outcome from a substantive perspective
since our ultimate interest is in how energy labels influence purchases, not clicks for
more information. Second, we measured Customer Engagement through a binary
variable – ‘yes’ if they clicked on at least one higher efficiency experimental
appliance; ‘no’ otherwise – that, on reflection, may only give a weak indication of a
customer’s engagement with higher efficiency experimental appliances. Given this,
and the greater substantive importance of purchases for our research question, we
regard add to cart and purchases as preferable primary outcomes.9
A related concern about multiple tests is that we report three sets of results:
treatment one (Energy Rating Label) against control; treatment two (alternative label)
against control; and the pooled treatments against control. Our hypothesis was the
alternative, behaviourally-informed label would have greater impact than the Energy
Rating Label. Once we found there was no evidence one label had more impact than
the other, we pooled the treatments, which gave us a single test for our hypothesis
that the information in the labels would influence consumer behaviour (compared to
no labels).
Our preferred approach to interpreting our results is, therefore, to focus on the
pooled results for the two treatments and, within those pooled results, to focus on the
add to cart and purchase outcome variables. Both of these choices represent
variations from our pre-analysis plan because we did not anticipate the need to pool
treatments, and because we specified a different primary outcome.
A further ground for caution is that we conducted four separate data analyses, which
increases the probability a ‘statistically significant finding’ is just a chance result
(Simmons et al., 2011). The different methods we considered are described
immediately below.
Method 1 (preferred approach): Our preferred method focused on higher efficiency
experimental appliances (appliances that had above-median efficiency within that
appliance category: see Appendix B for details). This allowed us to test, for
example, whether there were more purchases of higher efficiency experimental
appliances by consumers who saw an energy label than those who did not. This is
the policy question we sought to answer. It is also consistent with statements in our
pre-analysis plan that we expected higher ratings would lead to greater interest (and
purchases) among consumers, although our plan could have stated this more
clearly.

9. There may also be grounds to treat the results for purchases with further caution since the estimates are close to zero (for
   example, 1.0 per cent for the control; 1.2 per cent for the pooled treatments), which may lead to unreliable standard errors.

Behavioural Economics Team of the Australian Government                                                                            27
Energy labels that make cents: testing energy rating labels on appliances sold online

Method 2 (preferred approach but different ‘base population’): Our initial attempt at
our preferred method used a different ‘base population’ for each of the outcome
variables. In our preferred method, the base population is constant for all three
outcome measures: it is simply the total number of visitors to the experimental pages
on the Appliances Online website. In Method 2, the base population changed so the
base for the add to cart outcome variable was the number of visitors who clicked on
an experimental appliance on the filter page and the base for the purchase outcome
variable was the number of visitors who added an experimental appliance to the
shopping cart.10 This method is inferior because, by changing the base population
after each navigation stage of the website, we were potentially introducing selection
bias into our outcome measures in a similar manner to how systematic bias in
attrition can introduce selection bias. That is, in Method 2 we effectively changed our
control and treatment groups by excluding visitors who did not click or add to cart
and, as a result, the altered control and treatment groups may no longer be
‘statistically identical’.
Method 3 (all appliances, not just higher efficiency appliances): We also assessed
the impact of energy labels on the relative demand between treatments and control
for all experimental appliances, whereas our preferred method focused on the impact
of labels on higher efficiency appliances. Since the experimental appliances all had a
rating greater than one star, Method 3 effectively tests whether consumers
interpreted the energy labels as conveying positive information, leading to greater
interest in purchasing those appliances than if they were unlabelled. This question
has less policy relevance since it says nothing about whether energy labels
influenced decisions within the set of greater-than-one-star appliances. However, our
pre-analysis plan implied this would constitute part of our analysis so we report it for
completeness in Section D.5 below.11

10. For example, for the control group, there were 13,142 visitors. Of these, 1,424 clicked for more information, 469 added an
    appliance to cart and 133 who finally made a purchase. In our preferred method, we calculated our outcomes as: 10.8 per cent
    clicked, 3.6 per cent added to cart and 1.0 per cent purchased. In the earlier variation, our calculations were: 10.8 per cent
    clicked, 32.9 per cent added to cart (of those who clicked) and 28.4 per cent purchased (of those who added to cart).

11. Specifically, our pre-analysis plan (p3) stated that: “Overall, we hypothesise that consumers shown the alternative label are more
    likely to engage with, indicate an intent to purchase, and actually purchase higher energy-efficient appliances when compared to
    consumers shown the Energy Rating Label or no label at all. [Footnote 8: ‘Higher energy-efficient appliances’ refers to those
    appliances that have a higher than one star energy rating.]” In other places in the plan, we make clear that our intended analysis
    was broader than this and consistent with our preferred approach.

Behavioural Economics Team of the Australian Government                                                                                  28
Energy labels that make cents: testing energy rating labels on appliances sold online
Method 4 (mixed-effects model): Finally, we undertook a more complex method of
analysis that went beyond what we anticipated in our pre-analysis plan and so was
only intended to be exploratory in nature. Our preferred method of analysis is
consistent with our original research proposal and produces results that are relatively
straightforward to interpret. However, more advanced methods have the potential to
exploit more of the richness in the data. Our preferred method of analysis did not
include experimental appliances’ energy rating as an explanatory variable, which
could give us an idea of how much the probability of purchase, add to cart, or click
outcomes increases with each additional star rating. Similarly, our preferred method
does not include other variables that could influence purchase decisions
(‘covariates’) such as the appliance brand, size, or price, which could help improve
the precision of our estimates. We therefore used a ‘mixed-effects model’ to include
experimental appliances’ energy rating and price in our analysis.12 We did not,
however, find evidence in support of any of our hypotheses. We will publish the
results of this analysis in supplementary materials accompanying this report.
In conclusion, while we pursued four lines of analysis, we believe we have
justification for opting for our preferred approach. In comparison, Method 2 has the
potential to introduce selection bias, Method 3 only provides a partial answer to our
underlying research question, and Method 4 is exploratory in nature since it was not
anticipated in our pre-analysis plan.
D.3 Other trial limitations
As noted in the Limitations section, about 10 per cent of the trial sample saw an
incorrectly rendered energy label when they visited the website. As a result, we
excluded them from the analysis and we extended the trial duration to compensate
for this loss of sample. This rendering issue only affected visitors with certain
browsers and, in particular, those who had older browser versions and had not
updated to more recent versions. The error affected similar proportions of visitors in
each experimental group. To address this issue, all of the affected observations
(visitors to the erroneously labelled sites) were excluded from the analysis.
12. Specifically, we used a mixed-effects logistic regression with the following ‘fixed factor’ explanatory variables: experimental group,
appliance price, star rating, and an interaction term (experimental-group-by-star-rating). We added a random intercept term for
each customer. The reason for using this more complex methodology is that a purchase probability, for example, depends on
each individual appliance that each customer either did or did not purchase. When the data is aggregated into a single outcome
per customer (as we did in our preferred method) we cannot attribute specific energy ratings or prices to the outcome. In
particular, we cannot attribute appliance energy ratings or prices for consumers who did not make a purchase.
Behavioural Economics Team of the Australian Government 29Energy labels that make cents: testing energy rating labels on appliances sold online
The Limitations section also referred to some minor technical issues, as follows. We
may have counted some consumers several times if they used multiple devices to
access experimental website pages, although we expect this would apply to a
relatively small number of observations. Similarly, we may have counted consumers
several times if they blocked cookies on their browser, in which case we had no
choice but to treat each website ‘session’ as a separate user. Conversely, we may
have counted several people as one if they all used a single device. Again, we think
the numbers involved were relatively small.
Lastly, since only some appliances in each category were labelled in the treatment
groups, individuals would not have been able to use the labels to make comparisons
(in relation to energy efficiency) between all appliances. It is possible individuals may
have behaved differently if all appliances were labelled.
D.4 Additional results: lower efficiency appliances
The energy labels had no apparent effect on shopping choices for lower efficiency
experimental appliances. For these appliances, the results are similar across the
experimental groups (see Table 3 and Table 4). In other words, for all three
outcomes (clicking to view appliance information, adding appliances to the cart, and
making purchases) the differences between the control group and the treatment
groups are close to zero and not consistently positive or negative in sign.
In the context of an increase in purchases of higher efficiency appliances, we might
expect there to be a corresponding decrease in purchases elsewhere, reflecting a
substitution of one appliance bought instead of another. For example, purchases of
higher efficiency appliances instead of lower efficiency appliances. However, there
are other such places from which these purchases could be substituted and it is not
clear we should expect a corresponding decrease specifically in the set of lower-
efficient labelled appliances to demonstrate this effect. Thus, we do not regard these
results as necessarily being inconsistent with a positive effect of the labels.
Table D1: Outcomes for lower efficiency experimental appliances
Control Group Energy Rating Alternative Either label
(no label) Label Label (pooled)
Number of
N=13,142 N=13,199 N=13,273 N=26,472
consumers
5.26% 4.97% 5.40% 5.19%
Click
(n=691) (n=656) (n=717) (n=1,373)
1.79% 1.73% 1.78% 1.75%
Add to cart
(n=235) (n=228) (n=236) (n=464)
0.556% 0.455% 0.535% 0.495%
Purchase
(n=73) (n=60) (n=71) (n=131)
Behavioural Economics Team of the Australian Government 30Energy labels that make cents: testing energy rating labels on appliances sold online
Table D2: Difference in outcomes for lower efficiency experimental appliances
Control Group Control Group vs Energy Rating Control Group vs
vs Energy Alternative Label Label vs Either label
Rating Label Alternative Label (pooled)
-0.29% 0.14% 0.43% -0.071%
Click p=0.29 p=0.60 p=0.11 p=0.77
(-0.82, 0.24) (-0.40, 0.69) (-0.10, 0.97) (-0.54, 0.40)
-0.061% -0.010% 0.051% -0.035%
Add to cart p=0.71 p=0.95 p=0.75 p=0.80
(-0.38, 0.26) (-0.33, 0.31) (-0.27, 0.37) (-0.31, 0.24)
-0.10% -0.021% 0.080% -0.061%
Purchase p=0.25 p=0.82 p=0.35 p=0.43
(-0.27, 0.07) (-0.20, 0.16) (-0.09, 0.25) (-0.21, 0.09)
Note: results are reported as “difference in proportions, p-value (95% confidence interval)”
D.5 Additional results: supplementary analysis
As noted in Section D.2 above regarding Method 3, our pre-analysis plan implied we
would analyse the difference between experimental groups for all appliances
altogether, not just the higher efficiency appliances, although it was not as relevant
to policy as our preferred approach. We report this analysis here for completeness
only.
Did labels have an impact compared to no label?
Of the consumers who did not see a label (the control group), only 1.9 per cent
purchased an experimental appliance. This increased to 2.0 per cent for consumers
who saw the Energy Rating Label and the same for those who saw the alternative
label (Table D3). There was a similar pattern of results for appliance add to carts but
not for appliance clicks. For consumers who viewed the Energy Rating Label, a
lower proportion clicked on an experimental appliance than those who viewed no
label or the alternative label.
The differences between the experimental groups are shown in Table D4 along with
95 per cent confidence intervals around these mean differences (the p-values for the
statistical tests). All of the confidence intervals span from a negative number to a
positive number, including the possibility of no effect at all. If this experiment was
repeated multiple times, we could expect the true effect to be included in such
intervals 95 per cent of the time.
Behavioural Economics Team of the Australian Government 31You can also read