Effects of salicylic acid, zinc and glycine betaine on morpho physiological growth and yield of maize under drought stress - Nature

Page created by Lynn Lawrence
 
CONTINUE READING
Effects of salicylic acid, zinc and glycine betaine on morpho physiological growth and yield of maize under drought stress - Nature
www.nature.com/scientificreports

                OPEN             Effects of salicylic acid,
                                 zinc and glycine betaine
                                 on morpho‑physiological growth
                                 and yield of maize under drought
                                 stress
                                 Ramadan Shemi1,2, Rui Wang1, El‑Sayed M. S. Gheith2, Hafiz Athar Hussain1,3*,
                                 Saddam Hussain4, Muhammad Irfan5, Linna Cholidah1, Kangping Zhang1, Sai Zhang1 &
                                 Longchang Wang1*

                                 Drought is one of the major environmental stresses that negatively affect the maize (Zea mays
                                 L.) growth and production throughout the world. Foliar applications of plant growth regulators,
                                 micronutrients or osmoprotectants for stimulating drought-tolerance in plants have been intensively
                                 reported. A controlled pot experiment was conducted to study the relative efficacy of salicylic acid
                                 (SA), zinc (Zn), and glycine betaine (GB) foliar applications on morphology, chlorophyll contents,
                                 relative water content (RWC), gas-exchange attributes, activities of antioxidant enzymes,
                                 accumulations of reactive oxygen species (ROS) and osmolytes, and yield attributes of maize
                                 plants exposed to two soil water conditions (85% field capacity: well-watered, 50% field capacity:
                                 drought stress) during critical growth stages. Drought stress significantly reduced the morphological
                                 parameters, yield and its components, RWC, chlorophyll contents, and gas-exchange parameters
                                 except for intercellular ­CO2 concentration, compared with well water conditions. However, the
                                 foliar applications considerably enhanced all the above parameters under drought. Drought stress
                                 significantly (p < 0.05) increased the hydrogen peroxide and superoxide anion contents, and enhanced
                                 the lipid peroxidation rate measured in terms of malonaldehyde (MDA) content. However, ROS and
                                 MDA contents were substantially decreased by foliar applications under drought stress. Antioxidant
                                 enzymes activity, proline content, and the soluble sugar were increased by foliar treatments under
                                 both well-watered and drought-stressed conditions. Overall, the application of GB was the most
                                 effective among all compounds to enhance the drought tolerance in maize through reduced levels of
                                 ROS, increased activities of antioxidant enzymes and higher accumulation of osmolytes contents.

                                 Maize (Zea mays L.) is one of the most important cereal crops globally. Maize is as the major source of food, feed,
                                 and bio-fuel and therefore, consumption and demand of maize is increasing w      ­ orldwide1. In China, maize is the
                                 third-most important food crop after rice and wheat. The cultivated area for maize in China is estimated at 42.42
                                 million ha with yield of about 259.23 million tonnes y­ ear1,2. However, it is an extremely sensitive cereal crop to
                                 drought stress, especially during critical growth stages. It has been well reported that maize is comparatively
                                 more vulnerable to drought stress compared with other cereals such as w   ­ heat3.
                                     Globally, the demands for food crops are projected to be doubled by 2050 because of the ever increasing and
                                 burgeoning ­population4. The irrigation water is considered a major resource to crop production, but it is scarce
                                 and expensive in many regions of the world, as a result, maize production is often restricted. Universally, the
                                 agriculture sector utilizes around 70% of freshwater for irrigation to the farming l­ ands5. Approximately 40% of
                                 the total food is produced from about 17% of the cropped land area by irrigated a­ griculture6. With the continued

                                 1
                                  College of Agronomy and Biotechnology, Southwest University, Chongqing 400715, China. 2Department of
                                 Agronomy, Faculty of Agriculture, Cairo University, Giza 12613, Egypt. 3Institute of Environment and Sustainable
                                 Development in Agriculture, Chinese Academy of Agricultural Sciences, Beijing 100081, China. 4Department of
                                 Agronomy, University of Agriculture, Faisalabad 38040, Pakistan. 5Department of Agronomy, Zakaria University,
                                 Multan 60800, Pakistan. *email: atharhussainswu@yahoo.comf; wanglc@swu.edu.cn

Scientific Reports |   (2021) 11:3195                | https://doi.org/10.1038/s41598-021-82264-7                                                  1

                                                                                                                                              Vol.:(0123456789)
www.nature.com/scientificreports/

                                             Soil water                                           Fresh weight         Dry weight        No. of leaves     Leaf area
                                             conditions       Foliar treatments Plant height (cm) p
                                                                                                  ­ lant−1 (g)         ­plant−1 (g)      ­plant−1          ­plant−1 ­(cm2)
                                                              CK                181.00ab ± 5.69    337.87b ± 19.49     63.71bc ± 2.83    12.89bc ± 0.49    5237.47bc ± 125.44
                                                                                         a                  a                ab               ab
                                                              SA                186.67 ± 5.24      362.89 ± 16.10      68.16 ± 2.16      14.44 ± 0.29      5775.23a ± 145.49
                                                                                         a                  ab               ab               ab
                                             WW               Zn                184.33 ± 6.37      350.74 ± 11.55      66.91 ± 2.09      14.33 ± 0.33      5605.47ab ± 147.14
                                                                                         a                  a                a                a
                                                              GB                187.67 ± 3.72      368.65 ± 22.74      70.63 ± 2.53      14.85 ± 0.46      5969.70a ± 234.39
                                                              Means             184.91             355.03              67.35             14.13             5646.96
                                                              CK                109.32d ± 4.49     191.64e ± 8.89      37.86 fg ± 1.21   9.82e ± 0.61      3703.93f. ± 180.88
                                                              SA                117.33c ± 3.29     235.88c ± 11.73     43.28de ± 2.14    11.23 cd ± 0.62   4341.98de ± 229.12
                                             WD               Zn                115.34 cd ± 3.93   223.88 cd ± 10.90   42.51ef ± 2.41    10.67de ± 0.33    4131.53e ± 271.97
                                                              GB                120.33c ± 3.18     240.21c ± 9.90      46.40d ± 2.53     12.33c ± 0.67     4548.87d ± 165.13
                                                              Means             115.58             222.90              42.51             11.01             4181.57

                                            Table 1.  Effect of soil water conditions and foliar treatments on plant height, fresh weight, dry weight, number
                                            of leaves, and leaf area. Values are means (± SE) of three replicates. For L.S.D.’s results, means with different
                                            letters indicate that means are different at 95% confidence level. WW, well-watered; WD, water-deficient; CK,
                                            control (double distilled water); SA, salicylic acid; Zn, Zinc; GB, Glycine betaine.

                                            increase of world population, industrialization, and urbanization, the competition for fresh water will be highly
                                            increased among agriculture and other ­sectors4,7.
                                                Drought stress severely hampers the growth and productivity of ­maize8–10. It triggers different changes in
                                            crop plants through various morphological, physiological, and biochemical r­ esponses11–13. Drought stress causes
                                            oxidative damage in plants through higher production of ROS, nevertheless, plants possess the antioxidant
                                            defense system and enhanced synthesis of antioxidants such as the ascorbate peroxidase (APX), glutathione
                                            reductase (GR), peroxidase (POD), superoxide dismutase (SOD), and catalase (CAT) helps in quenching of ROS
                                            produced during drought stress 10,13–17.The exogenous applications of plant growth regulators, micronutrients, or
                                            osmoprotectants can play a significant role in improving drought-resistance at various plant growth ­stages18,19.
                                            Salicylic acid (SA) is a natural phenolic compound that can effectively alleviate the harmful effects caused by
                                            abiotic environmental s­ tresses20,21. Moreover, it can play important role in modulating growth, and physiological
                                            and biochemical characteristics in p    ­ lants17,22–24. The SA has been reported to be beneficial in relieving the negative
                                            effects of drought stress by improving the seedling growth, leaf gas-exchange traits, and activities of APX, CAT
                                            and SOD enzymes, while decreasing the MDA and ­H2O2 ­contents25,26. Sharma et al.27 suggested that SA mark-
                                            edly increased drought-tolerance and could be used for increasing and stabilizing crop production under stress
                                            conditions. Zinc (Zn) is an essential micronutrient that is involved in physiological functions and structure of the
                                            regulatory cofactor of many enzymes, carbohydrate and chlorophyll production, pollen development, fertiliza-
                                            tion, RNA and DNA metabolism, and protein s­ ynthesis28,29. Zn plays a critical role in improving resistance against
                                            drought stress by detoxifying ROS generation and increasing antioxidant e­ nzymes30,31. Glycine betaine (GB) is
                                            naturally occurring osmoprotectant compound that accumulates in numerous plants under drought stress. Iqbal
                                            et al.32 reported that foliar application of GB improved turgor potential and sunflower yield under drought stress.
                                            Raza et al.33 indicated that the growth parameters and yield components were reduced under drought stress in
                                            wheat plants, while exogenous application of GB was effective in mitigating the detrimental effects of drought.
                                            Hasanuzzaman et al.34 recorded that the GB played an important role in improving the detoxification of ROS,
                                            hence recovering photosynthesis and decreasing oxidative damage.
                                                Nevertheless, no study has been conducted to appraise the relative effect of these compounds (SA, Zn, or GB)
                                            in improving maize tolerance against drought stress. The present study was conducted to assess the possible role
                                            of SA, Zn, anGB betaine treatments in improving drought-tolerance in maize under critical growth stages, based
                                            on changes in growth, yield, and physiological and biochemical features. It was hypothesized that the exogenous
                                            applications of these compounds could mitigate the negative effects of drought stress in maize from the fourteenth
                                            leaf ­(V14) until blister (­ R2) growth stages by regulating antioxidant enzymes. To verify this hypothesis, the maize
                                            plants were sprayed with SA, Zn, and GB under well-watered and drought-stressed conditions. The specific
                                            objectives were to (1) examine the response of maize growth characters, yield, and its components to the foliar
                                            application of SA, Zn, and GB under different soil water conditions during critical growth stages; (2) investigate
                                            the effect of respective spraying applications on chlorophyll contents, RWC, leaf gas-exchange attributes, ROS
                                            accumulation, MDA content, activity of antioxidant enzymes, and osmolytes accumulation under different soil
                                            water conditions; and (3) compare the relative efficacy of different spraying applications for ameliorating the
                                            harmful effects of drought stress by enhancing the preceding parameters in maize.

                                            Results
                                            Growth parameters, yield, and its components. Drought stress significantly (p < 0.05) disrupted the
                                            maize growth parameters, yield, and its components in terms of plant height, fresh weight p       ­ lant−1, dry weight
                                            ­plant−1, the number of leaves ­plant−1, leaf area ­plant−1, the number of grains ­plant−1, 100-grain weight, bio-
                                                          ­ lant−1, grain yield p
                                            logical yield p                     ­ lant−1, and harvest index. However, the results showed that the growth param-
                                            eters, yield, and its components were improved by SA, Zn, and GB spraying treatments under well-watered
                                            and drought-stressed conditions (Tables 1, 2, 3). As predicted, one or more of spraying treatments statistically

          Scientific Reports |   (2021) 11:3195 |                  https://doi.org/10.1038/s41598-021-82264-7                                                                  2

Vol:.(1234567890)
www.nature.com/scientificreports/

                                   Soil water                               No. of grains                100-grain weight     Biological yield   Grain yield      Harvest index
                                   conditions             Foliar treatments p
                                                                            ­ lant−1                     (g)                  ­plant−1 (g)       ­plant−1 (g)     (%)
                                                          CK                   294.65bc ± 15.25          31.18b ± 0.98        256.35c ± 4.04     91.72bc ± 3.93   35.76a ± 1.20
                                                                                        ab                       b                     ab                    ab
                                                          SA                   312.10 ± 15.14            32.55 ± 0.64         273.13 ± 5.20      101.40 ± 2.99    37.12a ± 0.84
                                                                                        b                        b                     bc                b
                                   WW                     Zn                   302.80 ± 16.30            32.22 ± 1.25         265.07 ± 5.82      97.15 ± 1.65     36.71a ± 1.37
                                                                                        a                        a                     a                     a
                                                          GB                   324.19 ± 25.93            33.20 ± 2.13         284.32 ± 6.01      106.53 ± 1.28    37.48a ± 0.34
                                                          Means                308.43                    32.28                269.71             99.19            36.76
                                                          CK                   215.78ef ± 14.79          24.72 cd ± 1.04      163.33 g ± 3.78    53.05f. ± 1.70   32.51b ± 1.16
                                                          SA                   250.36d ± 12.43           29.87bc ± 1.01       208.32e ± 5.12     74.55d ± 1.80    35.80a ± 0.51
                                   WD                     Zn                   221.13e ± 5.99            28.75c ± 0.76        183.71f. ± 5.87    63.65e ± 3.11    34.61ab ± 0.63
                                                          GB                   279.46c ± 10.02           30.52b ± 0.93        230.46d ± 4.71     85.14c ± 2.01    36.95a ± 0.50
                                                          Means                241.68                    28.46                196.45             69.09            34.96

                                  Table 2.  Effect of soil water conditions and foliar treatments on the number of grains, 100-grain weight,
                                  biological yield, grain yield, and harvest index. Values are means (± SE) of three replicates. For L.S.D.’s results,
                                  means with different letters indicate that means are different. at 95% confidence level. WW, well-watered; WD,
                                  water-deficient; CK, control (double distilled water); SA, salicylic acid; Zn, Zinc; GB, Glycine betaine.

                                                                        Main factors effects            Interaction effects
                                   Parameters                           S               F               S×F
                                   Plant height                             < 0.0001         < 0.0293    < 0.0491
                                   Fresh weight                             < 0.0001         < 0.0069    < 0.0426
                                   Dry weight                               < 0.0001         < 0.0281    < 0.0487
                                   Number of leaves                         < 0.0001         < 0.0060    < 0.0268
                                   Leaf area                                < 0.0001         < 0.0030    < 0.0376
                                   Number of grains                         < 0.0001         < 0.0340    < 0.0473
                                   100-grain weight                         < 0.0003         < 0.0204    < 0.0342
                                   Biological yield                         < 0.0001         < 0.0001    < 0.0073
                                   Grain yield                              < 0.0001         < 0.0001    < 0.0152
                                   Harvest index                            < 0.0113         < 0.0197    < 0.0466
                                   Chlorophyll a content                    < 0.0022         < 0.0014    < 0.0327
                                   Chlorophyll b content                    < 0.0001         < 0.0078    < 0.0254
                                   Total chlorophyll content                < 0.0001         < 0.0001    < 0.0426
                                   RWC​                                     < 0.0001         < 0.0273    < 0.0305
                                   Net photosynthesis rate                  < 0.0001         < 0.0001    < 0.0254
                                   Transpiration rate                       < 0.0001         < 0.0001    < 0.0159
                                   Stomatal conductance                     < 0.0001         < 0.0001    < 0.0289
                                   Intercellular ­CO2 concentration         < 0.0001         < 0.0001    < 0.0186
                                   APX activity                             < 0.0001         < 0.0001    < 0.0008
                                   GR activity                              < 0.0001         < 0.0001    < 0.0001
                                   POD activity                             < 0.0003         < 0.0001    < 0.0376
                                   CAT activity                             < 0.0001         < 0.0001    < 0.0226
                                   SOD activity                             < 0.0001         < 0.0039    < 0.0288
                                   MDA content                              < 0.0001         < 0.0001    < 0.0342
                                   H2O2 content                             < 0.0001         < 0.0001    < 0.0245
                                   O2− content                              < 0.0001         < 0.0001    < 0.0076
                                   Free proline content                     < 0.0001         < 0.0001    < 0.0008
                                   Total soluble sugar                      < 0.0001         < 0.0001    < 0.0287

                                  Table 3.  p-values of the two-way factorial analysis of growth, yield, and physiological and biochemical
                                  parameters of maize as influenced by various foliar treatments under both soil water conditions. ‘S’: effect
                                  of soil water conditions; ‘F’: effect of foliar treatments; S × F, effect of the interaction between two variables.
                                  p-values are regarded as significant (p < 0.05, n = 3) and highly significant (p < 0.01, n = 3).

Scientific Reports |   (2021) 11:3195 |                        https://doi.org/10.1038/s41598-021-82264-7                                                                          3

                                                                                                                                                                             Vol.:(0123456789)
www.nature.com/scientificreports/

                                                                             3.0
                                                                                           CK                                                                                    CK             a
                                                                                           SA                                                                              1.6   SA     b   b

                                    C hlorophyll a (m g g F W)

                                                                                                                                              C hlorophyll b (mg g F W)
                                                                                                   a a     a                                                                        b
                                                                             2.5           Zn a                     ab b a                                                       Zn                     c cd bc
                                                                                           GB                                                                              1.4   GB                 d

                                   -1

                                                                                                                                           -1
                                                                             2.0                                c                                                          1.2
                                                                                                                                                                           1.0
                                                                             1.5
                                                                                                                                                                           0.8
                                                                             1.0                                                                                           0.6
                                                                                                                                                                           0.4
                                                                             0.5
                                                                                                                                                                           0.2
                                                                             0.0                                                                                           0.0

                                                                                   5                                                                                       100
                                                                                           CK                                                                                    CK     a   a   a
                                                    Total chlorophyll (mg g F W)

                                                                                                                                                                                 SA a

                                                                                                                                           R elative w ater content (% )
                                                                                           SA
                                                                                                   a       a                                                                                                    ab
                                                                                   4       Zn
                                                                                              b        b                                                                   80    Zn                     b
                                                                                                                    bc c   b
                                               -1

                                                                                           GB                                                                                    GB                         c
                                                                                                                d                                                                                   c
                                                                                   3                                                                                       60

                                                                                   2                                                                                       40

                                                                                   1                                                                                       20

                                                                                   0                                                                                        0
                                                                                                   WW             WD                                                                     WW             WD
                                                                                                  Soil water conditions                                                                 Soil water conditions

                                                                                   Figure 1.  Effect of soil water conditions and foliar treatments on chlorophyll a, chlorophyll b, total chlorophyll,
                                                                                   and relative water contents. Every column in each graph represents the mean (± SE) of three replicates. Different
                                                                                   letters above columns indicate that means are different at 95% confidence level. WW, well-watered; WD, water-
                                                                                   deficient; CK, control (double distilled water); SA, salicylic acid; Zn, Zinc; GB, Glycine betaine.

                                                                                   improved all the above parameters in both soil water conditions except for plant height and harvest index under
                                                                                   the well-watered condition as compared with the control treatment. Under the drought-stressed condition, the
                                                                                   SA, Zn, or GB spray increased the plant height by 7.32%, 5.50%, and 10.07%, fresh weight by 23.08%, 16.82%,
                                                                                   and 25.34%, dry weight by 14.31%, 12.28%, and 22.55%, number of leaves by 14.35%, 8.65%, and 25.56%, leaf
                                                                                   area by 17.22%, 11.54%, and 22.81%, number of grains by 16.03%, 2.48%, and 29.51%, 100-grain weight by
                                                                                   20.83%, 16.30%, and 23.46%, biological yield by 27.54%, 12.48%, and 41.10%, grain yield by 40.52%, 19.98%,
                                                                                   and 60.49%, and harvest index by 10.12%, 6.46%, and 13.65%, respectively, as compared to the values of control.
                                                                                   Generally, the maximum growth parameters, yield, and its components were recorded from the plants treated
                                                                                   with GB followed by SA and Zn spraying treatments under two soil water conditions.

                                                                                   Chlorophyll contents and RWC​. Drought stress statistically (p < 0.05) reduced the chlorophyll (Chl.)
                                                                                   contents of maize leaves and relative water content (RWC). However, the results revealed that the Chl. a, Chl. b,
                                                                                   and total Chl. contents and RWC were improved by SA, Zn, and GB spraying treatments in both soil water con-
                                                                                   ditions (Fig. 1 and Table 3). Compared with control, Chl. a content was significantly increased by spraying treat-
                                                                                   ments under the drought-stressed condition. Chl. b content was substantially enhanced by GB treatment under
                                                                                   both soil water conditions and by SA treatment under the drought-stressed condition. Total Chl. content was
                                                                                   statistically influenced by spraying treatments under both soil water conditions except for Zn treatment under
                                                                                   the well-watered condition. RWC was statistically affected by GB and SA treatments under the drought-stressed
                                                                                   condition. Under the drought-stressed condition, the concerned spraying treatments improved Chl. a content by
                                                                                   22.45%, 19.78%, and 24.59%, Chl. b content by 8.00%, 6.40%, and 10.40%, total Chl. content by 16.98%, 14.74%,
                                                                                   and 18.91%, and RWC by 19.44%, 6.75%, and 23.42%, respectively, as compared to the values of the control treat-
                                                                                   ment. Overall, maximum chlorophyll contents and RWC were registered from the plants treated with GB and
                                                                                   followed by SA and Zn spraying treatments under both soil water conditions.

                                                                                   Leaf gas‑exchange attributes. Drought stress significantly (p < 0.05) influenced the net photosynthesis
                                                                                   rate (Pn), transpiration rate (Tr), stomatal conductance (Gs), and intercellular C
                                                                                                                                                                    ­ O2 concentration (Ci). However,
                                                                                   results noticed that the spraying treatments of SA, Zn, and GB increased the above leaf gas-exchange parameters
                                                                                   except for Ci (Fig. 2 and Table 3). Pn and Gs were significantly increased by spraying treatments under both
                                                                                   soil water conditions except for Zn treatment under the well-watered condition. Tr was statistically enhanced

          Scientific Reports |   (2021) 11:3195 |                                                        https://doi.org/10.1038/s41598-021-82264-7                                                                  4

Vol:.(1234567890)
www.nature.com/scientificreports/

                                                           25                                                                               2.5
                                                                    CK                                                                            CK
                                                                    SA         a                                                                  SA
                                                                                                                                                                     a
                                                                                                                                                           ab ab
                                                                    Zn   ab                                                                       Zn
                                                           20

                                                                                                                      Tr (mmol H2 O m s )
                                                                                                                                            2.0

                                     Pn (µmol CO 2 m s )
                                                                            bc

                                                                                                                    -1
                                  -1
                                                                    GB c                                                                          GB
                                                                                                                                                       b

                                                                                                                    -2
                                  -2
                                                                                                        d
                                                           15                                  de                                           1.5
                                                                                                    e
                                                                                           f
                                                           10                                                                               1.0                              cd        c
                                                                                                                                                                                  de
                                                                                                                                                                         e
                                                           5                                                                                0.5

                                                           0

                                                   0.18                                                                                     180                          a
                                                                    CK                                                                            CK
                                                                                       a                                                                                          b
                                                   0.16             SA       ab                                                             160   SA
                                                                                                                                                                             c
                                                                    Zn                                                                            Zn
                                                   0.14                                                                                     140
                          Gs (mol H2 O m s )

                                                                                                                    Ci (µmol Co2 mol )
                                                                    GB                                                                            GB
                         -2 -1

                                                                                                                                                                                       d

                                                                                                                   -1
                                                                                  bc
                                                   0.12                  c                                                                  120        e
                                                                                                                                                            f   ef
                                                   0.10                                                                                     100
                                                   0.08                                                                                     80                       g

                                                   0.06                                        d        d                                   60
                                                                                                    e
                                                                                           f
                                                   0.04                                                                                     40
                                                   0.02                                                                                     20
                                                   0.00                                                                                      0
                                                                              WW             WD                                                             WW             WD
                                                                             Soil water conditions                                                         Soil water conditions

                                                           Figure 2.  Effect of soil water conditions and foliar treatments on net photosynthesis rate (Pn), transpiration
                                                           rate (Tr), stomatal conductance (Gs), and intercellular C­ O2 concentration (Ci). Every column in each graph
                                                           represents the mean (± SE) of three replicates. Different letters above columns indicate that means are different
                                                           at 95% confidence level. WW, well-watered; WD, water-deficient; CK, control (double distilled water); SA,
                                                           salicylic acid; Zn, Zinc; GB, Glycine betaine.

                                                           by GB treatment under both soil water conditions and by SA treatment under the drought-stressed condition.
                                                           Ci was statistically decreased by spraying treatments under both soil water conditions except for Zn treatment
                                                           under the well-watered condition. Under the drought-stressed condition, the respective spraying treatments
                                                           promoted the Pn by 30.48%, 17.09%, and 45.77%, Tr by 32.25%, 19.35%, and 40.32%, and Gs by 66.66%, 33.33%,
                                                           and 66.66%; while they decreased the Ci by 15.91%, 7.59%, and 26.62%, respectively, as compared to the values
                                                           of the control. Overall, the spraying treatments improved the leaf gas-exchange attributes under the drought-
                                                           stressed condition more than the well-watered condition. The GB treatment was more effective than SA and Zn
                                                           treatments as compared with control under both soil water conditions.

                                                           Antioxidant enzymes activity and MDA content. Drought stress significantly (p < 0.05) increased the
                                                           MDA content and triggered the activities of APX, GR, POD, CAT, and SOD. However, application of SA, Zn,
                                                           and GB increased the activities of APX, GR, POD, CAT, and SOD, but reduced the content of MDA under both
                                                           soil water conditions (Fig. 3 and Table 3). Compared with control, the activities of APX and POD were statisti-
                                                           cally increased by spraying treatments under both soil water conditions except for Zn treatment under the well-
                                                           watered condition, the GR activity was significantly enhanced by spraying treatments under the drought-stressed
                                                           condition and by SA treatment under the well-watered condition, the CAT activity was statistically improved by
                                                           spraying treatments under the drought-stressed condition and by GB treatment under the well-watered condi-
                                                           tion, the SOD activity was statistically increased by spraying treatments under the drought-stressed condition,
                                                           but the MDA content was significantly decreased by spraying treatments under both soil water conditions except
                                                           for Zn treatment under the well-watered condition. Under the drought-stressed condition, the concerned spray-
                                                           ing treatments improved the activities of APX by 91.89%, 42.56%, and 74.32%, GR by 125.64%, 79.48%, and
                                                           115.38%, POD by 25.16%, 14.63%, and 33.91%, CAT by 30.23%, 21.80%, and 44.54%, SOD by 23.54%, 10.06%,
                                                           and 14.17%, but reduced the MDA content by 27.70%, 15.13%, and 23.01%, respectively, as compared to the val-
                                                           ues of the control. Overall, the respective spraying treatments enhanced all the antioxidant enzymes activity and
                                                           reduced the MDA content under the drought-stressed condition more than the well-watered condition. Results
                                                           noticed that the SA treatment was the most effective and followed by GB and Zn spraying treatments in decreas-
                                                           ing the content of MDA and increasing the activities of APX, SOD, and GR enzymes; while the GB treatment had
                                                           higher values more than other spraying treatments in raising the activity of POD and CAT enzymes as compared
                                                           with control treatment under both soil water conditions.

Scientific Reports |   (2021) 11:3195 |                                           https://doi.org/10.1038/s41598-021-82264-7                                                                    5

                                                                                                                                                                                           Vol.:(0123456789)
www.nature.com/scientificreports/

                                                                                     3.5                                                                                  1.0
                                                                                               CK                                                                               CK                           a
                                                                                               SA
                                                                                                                                                                                                                      a
                                                                                                                           a                                                    SA
                                                                                     3.0

                                                            APX activity (U g FW)
                                                                                               Zn                                  a                                            Zn

                                                                                                                                                  GR activity (U g FW)
                                                                                               GB
                                                                                                                                                                          0.8   GB                               b
                                                                                     2.5                                       b

                                                       -1

                                                                                                                                               -1
                                                                                     2.0                                                                                  0.6
                                                                                                         c             c
                                                                                     1.5                          cd                                                                                     c
                                                                                                                                                                          0.4             c         d
                                                                                                             de                                                                      d         d
                                                                                     1.0            e
                                                                                                                                                                          0.2
                                                                                     0.5

                                                                                     0.0                                                                                  0.0

                                                               20000                                                                                                     250
                                                                                               CK                                  a                                            CK
                                                                                               SA                          a                                                    SA                                    a
                                    POD activity (U g FW)

                                                                                                                                               CAT activity (U g FW)
                                                                                               Zn                 ab           b                                                Zn                           a
                                                                                               GB
                                                                                                                                                                         200    GB                               ab
                                                               15000                                    bc                                                                                          b
                                                                                                             cd        c                                                                  bc
                                   -1

                                                                                                                                               -1
                                                                                                                                                                                               c         c
                                                                                                    d                                                                    150
                                                                                                                                                                                     c
                                                               10000
                                                                                                                                                                         100

                                                                       5000
                                                                                                                                                                          50

                                                                                      0                                                                                    0

                                                                                     60                                    a
                                                                                                                                                                          70
                                                                                              CK                                                                                CK
                                                                                              SA                                   ab                                           SA                       a
                                                                                                                               b                                          60
                                                             SOD activity (U g FW)

                                                                                     50       Zn                                                                                Zn
                                                                                                                       c
                                                                                                                                                       M DA (nmol g FW)
                                                                                              GB                                                                                GB
                                                                                                                                                                          50                                     b
                                                                                                                                                                                                                      bc
                                                            -1

                                                                                     40                                                                                                                      c
                                                                                                                                                   -1

                                                                                                        d                                                                 40         cd
                                                                                                             d    d
                                                                                     30             d                                                                                          de
                                                                                                                                                                                           f        ef
                                                                                                                                                                          30
                                                                                     20
                                                                                                                                                                          20
                                                                                     10                                                                                   10

                                                                                      0                                                                                    0
                                                                                                         WW             WD                                                                 WW             WD
                                                                                                        Soil water conditions                                                             Soil water conditions

                                                                                     Figure 3.  Effect of soil water conditions and foliar treatments on the activities of ascorbate peroxidase
                                                                                     (APX), glutathione reductase (GR), peroxidase (POD), catalase (CAT) and superoxide dismutase (SOD), and
                                                                                     malonaldehyde (MDA) content. Every column in each graph represents the mean (± SE) of three replicates.
                                                                                     Different letters above columns indicate that means are different at 95% confidence level. WW, well-watered;
                                                                                     WD, water-deficient; CK, control (double distilled water); SA, salicylic acid; Zn, Zinc; GB, Glycine betaine.

                                                                                     Accumulation of reactive oxygen species. Drought stress significantly (p < 0.05) increased the level
                                                                                      of ROS accumulation. However, the spraying treatments of SA, Zn, and GB reduced the contents of hydrogen
                                                                                      peroxide ­(H2O2) and superoxide anion ­(O2−) in both soil water conditions (Fig. 4 and Table 3). The ­H2O2 content
                                                                                      was significantly decreased by spraying treatments under the drought-stressed condition and by GB treatment
                                                                                      under the well-watered condition. The O ­ 2− content was statistically declined by spraying treatments under the
                                                                                      drought-stressed condition and by SA treatment under the well-watered condition. Under the drought-stressed
                                                                                      condition, application of SA, Zn, and GB decreased the contents of ­H2O2 by 28.92%, 21.18%, and 33.81%, and
                                                                                     ­O2− by 30.43%, 21.73%, and 26.08%, respectively relative to the values of control. Overall, the positive effect of
                                                                                      spraying treatments was better under drought-stressed than well-watered conditions.

                                                                                     Accumulation of osmolytes. Drought stress significantly (p < 0.05) affected the free proline content and
                                                                                     total soluble sugar. However, the spraying treatments of SA, Zn, and GB enhanced the proline content and solu-
                                                                                     ble sugar under both soil water conditions (Fig. 5 and Table 3). Compared with control, the free proline content
                                                                                     and total soluble sugar were significantly increased by spraying treatments under two soil water conditions
                                                                                     except for Zn treatment under the well-watered condition. Under the drought-stressed condition, the concerned
                                                                                     spraying treatments enhanced the free proline content by 27.32%, 11.25%, and 57.08%, and total soluble sugar by

          Scientific Reports |   (2021) 11:3195 |                                                            https://doi.org/10.1038/s41598-021-82264-7                                                                    6

Vol:.(1234567890)
www.nature.com/scientificreports/

                                                             14                                                                                                 1.8                             a
                                                                          CK                                                                                              CK
                                                             12           SA                        a                                                           1.6       SA
                                                                          Zn                                                                                              Zn
                                                                                                                                                                1.4                                     b

                          H 2O2 (µmol g FW)
                                                                          GB                                                                                              GB                                bc
                                                             10

                                                                                                                             O2-(µmol g-1 FW)
                                                                                                              b                                                 1.2                                 c
                                                                                                         bc                                                                    cd

                         -1
                                                                                                                  c                                                                     d de
                                                              8                cd                                                                               1.0                 e
                                                                                         d
                                                                                    de         e
                                                              6                                                                                                 0.8
                                                                                                                                                                0.6
                                                              4
                                                                                                                                                                0.4
                                                              2                                                                                                 0.2
                                                              0                                                                                                 0.0
                                                                                    WW                   WD                                                                          WW             WD
                                                                                   Soil water conditions                                                                           Soil water conditions

                                                                  Figure 4.  Effect of soil water conditions and foliar treatments on hydrogen peroxide (­ H2O2) and superoxide
                                                                  anion ­(O2−) contents. Every column in each graph represents the mean (± SE) of three replicates. Different
                                                                  letters above columns indicate that means are different at 95% confidence level. WW, well-watered; WD, water-
                                                                  deficient; CK, control (double distilled water); SA, salicylic acid; Zn, Zinc; GB, Glycine betaine.

                                                             120                                                                                                     12
                          F ree proline content (µg g F W)

                                                                                                                                                                                                            a

                                                                                                                                    Total soluble sugar (mg g F W)
                                                                          CK                                                                                              CK
                                                                          SA                                      a                                                       SA                        b
                                                             100          Zn                                                                                         10   Zn
                         -1

                                                                                                                                  -1
                                                                          GB                             bc                                                               GB                            c
                                                             80                                               c                                                      8
                                                                                                     d                                                                                          d
                                                                                               de                                                                                           d
                                                                                    e                                                                                               d
                                                             60                          ef                                                                          6                  e
                                                                               f
                                                                                                                                                                               e
                                                             40                                                                                                      4

                                                             20                                                                                                      2

                                                              0                                                                                                      0
                                                                                     WW             WD                                                                               WW             WD
                                                                                    Soil water conditions                                                                           Soil water conditions

                                                                  Figure 5.  Effect of soil water conditions and foliar treatments on the accumulations of free proline content
                                                                  and total soluble sugar. Every column in each graph represents the mean (± SE) of three replicates. Different
                                                                  letters above columns indicate that means are different at 95% confidence level. WW, well-watered; WD, water-
                                                                  deficient; CK, control (double distilled water); SA, salicylic acid; Zn, Zinc; GB, Glycine betaine.

                                                                  45.23%, 27.53%, and 61.23%, respectively, as compared to the values of the control. Overall, the positive effects of
                                                                  spraying treatments were better under the drought-stressed condition than the well-watered condition; the GB
                                                                  treatment was more effective in increasing the proline content and soluble sugar than other spraying treatments
                                                                  as compared with control treatment under both soil water conditions.

                                                                  Discussion
                                                                  Drought stress is a key agricultural threat that negatively impacts the crop production. It may lead to an imbal-
                                                                  ance between the ROS accumulation and defense systems of antioxidant, resulting in oxidative d          ­ amage17,35–38.
                                                                  Drought stress may inhibit the growth and development of numerous crops, yet the reproductive growth phases
                                                                  are highly sensitive by drought stress c­ onditions38–40. In the present study, results (Tables 1, 2, 3) indicated that
                                                                  drought stress significantly (p < 0.05) disrupted the maize growth parameters, yield, and yield components. How-
                                                                  ever, one or more spraying treatments statistically enhanced the growth parameters, yield, and its components
                                                                  except for the plant height and harvest index. Previously, Anjum et al.41 reported that the progressive drought
                                                                  condition significantly diminished the plant height, number of ears, fresh and dry weight of shoot, and grain yield
                                                                  when compared with well-watered plants in two cultivars of maize. Ullaha et al.42 concluded that the application
                                                                  of adequate Zn treatment significantly increased the area of leaves and dry weight of seedlings of chickpea under
                                                                  drought stress. Furthermore, O  ­ sman43 reported that the growth parameters, yield, and yield-related components
                                                                  were considerably reduced under drought stress; while the exogenous application of GB statistically stimulated
                                                                  the leaves number p ­ lant−1, fresh leaf weight p
                                                                                                                  ­ lant−1, pods number ­plant−1, and green pods yield of pea under
                                                                  drought stress when compared with control. ­Ghazi44 recorded that the drought stress statistically decreased the
                                                                  growth and yield parameters; while the exogenous of SA treatment increased the plant height, fresh and dry

Scientific Reports |   (2021) 11:3195 |                                                      https://doi.org/10.1038/s41598-021-82264-7                                                                               7

                                                                                                                                                                                                                 Vol.:(0123456789)
www.nature.com/scientificreports/

                                            weight of flag leaf, cob length, grains number, 100-grain weight, and grain, straw and cob yields under drought
                                            stress as compared with the untreated plants with SA. In our study, the decreases in maize growth parameters,
                                            yield, and yield components under drought stress might be attributed to the overproduction of ROS (­ H2O2 and
                                            ­O2−) which caused oxidative damage to the membranes, lipids and elevated the content of MDA (Figs. 3, 4).
                                             Several previous studies have documented that drought stress leads to an increase in the ROS production that
                                             destroys the cell membrane, causes damage to lipids, proteins, and chlorophylls, and finally decreases plant bio-
                                             mass ­accumulation15,45. However, the present study showed that the exogenous applications of SA, Zn, and GB
                                            could improve drought-tolerance in maize and the improvement might be attributed to increase in Chl. a, Chl. b,
                                            and total Chl., and RWC (Fig. 1), enhanced leaf gas-exchange attributes (Fig. 2), improved antioxidant enzymes
                                             activities (Fig. 3), reduced MDA, H       ­ 2O2, and O­ 2− contents (Figs. 3, 4), and increased accumulation of osmolytes
                                             (Fig. 5), particularly under the drought-stressed condition. Growth improvement and yield enhancement by
                                             these spraying applications under drought stress condition are considered an external indicator of metabolism
                                             modifications in the cells of plants. Previously, several studies have reported the damaging effects of drought on
                                             the growth parameters and yields of many crop p           ­ lants25,39,46–48. Nevertheless, the range of losses under drought-
                                             stressed condition varied with the severity of stress and plant growth phases. Moreover, it has also been reported
                                             that SA, Zn and GB applications may play important role in improving the growth characters, yield, and yield-
                                             related components under diverse stresses in various plant species 17,23,27,35,49.
                                                 In the present study, the chlorophyll contents and RWC were significantly affected in maize plants under
                                             drought stress. Nevertheless, the foliar application of SA, Zn, and GB treatments improved these parameters
                                             under both soil water condition (Fig. 1). Several previous researches have demonstrated that the reduction in
                                             chlorophyll contents is one of the important essential factors which could restrict the photosynthesis process
                                             under drought ­stress38,50–52. Rahmani et al.53 mentioned that the RWC and chlorophyll content were decreased
                                            under drought, but the foliar application of Zn statistically improved the drought-tolerance by promotion in
                                            the RWC and chlorophyll content under water deficit condition during the seed-filling stage in safflower plants.
                                            The decreases in chlorophyll contents under the drought-stressed condition in the current investigation are
                                            consistent with Yavas and ­Unay54 who indicated that the drought stress at the grain-filling stage considerably
                                            decreased chlorophyll contents and RWC, while the foliar applications of Zn and SA had a positive impact
                                            on RWC and chlorophyll content and mitigated the damaging effects of drought stress on plants. The RWC is
                                            considered a useful variable to appraise the physiological water status in the leaves of p            ­ lants55. Moharramnejad
                                            et al.52 indicated that drought stress remarkably decreased the contents of Chl. a and total Chl., and RWC when
                                            compared to the normal condition. Previously, many studies reported that the exogenous applications of SA, Zn,
                                            and GB treatments enhanced the Chl. a, Chl. b and total Chl. contents, and leaf RWC in different c­ rops35,42,46,56.
                                                 In the current study, the leaf gas-exchange attributes were substantially affected under the drought-stressed
                                            condition. All photosynthetic gas-exchange parameters were increased by SA, Zn, and GB foliar applications
                                            except for the intercellular C       ­ O2 concentration (Fig. 2). The net photosynthesis rate, transpiration rate, and
                                             stomatal conductance were declined under drought stress, while the spraying applications of GB, Zn, and SA
                                             increased ­CO2 assimilation, enhanced physiological water status, and improved the synthesis of metabolites in
                                            many crop p   ­ lants51,57,58. ­Habibi46 demonstrated that the net photosynthetic rate, transpiration rate, and stomatal
                                            conductance were significantly reduced under drought stress, but the spraying application of SA treatment sta-
                                            tistically increased them as compared to control in drought-stressed barley plants. The application of adequate
                                            Zn substantially enhanced the leaf ­CO2 net assimilation rate and the efficiency of photosystem II under drought
                                            stress in chickpea p  ­ lants42.
                                                 In this study, drought stress statistically increased the activity of antioxidant enzymes including APX, GR,
                                            POD, CAT, and SOD (Fig. 3). Nevertheless, the increases in the activity of antioxidant enzymes were not suf-
                                            ficient to protect against the accumulation of ROS and were not adequate to reform the injuries of the oxidative
                                            stress caused by the drought stress. These antioxidant enzymes were increased by the foliar application of SA, Zn,
                                            and GB treatments under the drought-stressed condition in maize plants (Fig. 3). Dianata et al.59 revealed that
                                             the exogenous treatments of SA significantly enhanced the activities of antioxidant enzymes (SOD, POD, and
                                             CAT) under drought stress as compared with no SA treatment. However, Ma et al.37 found that the relative gene
                                            expression levels of APX, GR, CAT, and APX enzymes were significantly increased, but the content of MDA was
                                            substantially decreased by the application of Zn under moderate and severe droughts for 10 and 20 days after
                                            initiation of stress conditions in wheat flag leaves. The exogenous applications could amend enzymatic antioxi-
                                            dants in maize plants under different soil water conditions and could efficiently scavenge harmful ROS which was
                                            showed by a noticeable decrease in the contents of MDA, ­H2O2, and O                ­ 2− in these plants (Figs. 3, 4). Previously,
                                             many studies also recorded that enzymatic and non-enzymatic antioxidants were elevated, but the H                     ­ 2O2, ­O2−,
                                            and MDA contents were reduced by spraying applications under abiotic stresses in various ­crops31,52,60–62. The
                                            SOD enzyme is regarded as the first line in protecting against ROS accumulation, which converts the superoxide
                                            radical to oxygen and hydrogen p         ­ eroxide63. ­Asada64 illustrated that the enzyme of CAT induced the conversion
                                            of hydrogen peroxide to water and molecular oxygen, where hydrogen peroxide was regarded as a powerful and
                                            harmful oxidizing agent. M       ­ ittler45 indicated that the MDA content was considered an adequate indicator of lipid
                                            peroxidation in membranes of cells. In this study, the content of MDA in maize leaves was statistically elevated
                                            by drought stress and it was concomitant with increased contents of ­H2O2 and ­O2−, while exogenous applications
                                             of SA, Zn or GB reduced the contents of MDA, ­H2O2, and ­O2− (Figs. 3, 4). The present results indicated that
                                             the foliar applications gave plants a high ability to deal with oxidative stress and could enhance the drought-
                                             tolerance in plants. Consistently, several previous studies have documented that the foliar application of different
                                             compounds increased the antioxidant enzymes and decreased the content of MDA in various crops 17,42,56,65.
                                                 The results indicated that the accumulations of ROS were significantly increased under drought stress but
                                            they were reduced by the foliar SA, Zn, and GB treatments (Fig. 4). Our results are consistent with many

          Scientific Reports |   (2021) 11:3195 |                   https://doi.org/10.1038/s41598-021-82264-7                                                               8

Vol:.(1234567890)
www.nature.com/scientificreports/

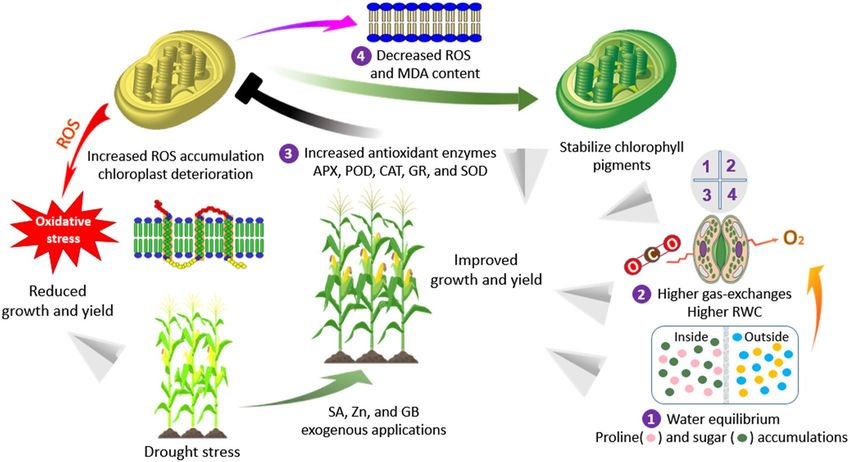
                                  Figure 6.  The different mechanisms of exogenous salicylic acid (SA), zinc (Zn), and glycine betaine (GB)
                                  applications mediated drought-tolerance in maize crop. ROS, reactive oxygen species; APX, ascorbate
                                  peroxidase; GR, glutathione reductase; POD, peroxidase; CAT, catalase; SOD, superoxide dismutase; MDA,
                                  malonaldehyde; RWC, relative water content.

                                   previous studies. who revealed that the accumulations of ROS were substantially elevated under drought stress,
                                   but the foliar applications of SA, Zn, and GB treatments reduced the accumulations of ROS in different crop
                                   ­plants31,41,62,66–68.
                                        In addition to the defense system of antioxidant enzymes, osmoregulation is strongly involved in drought
                                    amelioration through adjusting the osmotic stress. The compounds of proline and soluble sugar are very impor-
                                    tant for the osmoregulation process in plants under drought stress. In the current study, proline and soluble
                                    sugar in maize leaves were substantially increased under the drought stress and they were statistically increased
                                    by foliar application of SA, Zn, and GB (Fig. 5). This phenomenon could be considered as a mechanism that
                                    water loss in plants was inhibited by modification of the osmotic condition. These results are in harmony with
                                    previous ­researchers51,59,68–70, who found that free proline content and total soluble sugar were increased under
                                    drought stress in different crop plants. Upadhyaya et al.48 documented that Zn treatment significantly increased
                                  the leaf proline content under drought stress when compared with the control plants. Supporting our findings,
                                  ­Osman43 pronounced that the foliar application of GB considerably promoted the accumulations of total soluble
                                   sugars and free amino acids under drought stress at different growth phases in pea plants. Also, Aldesuquy et al.71
                                   mentioned that the exogenous treatment of SA statistically increased soluble sugars and proline content in flag
                                   leaf during the reproductive stage under drought stress conditions when compared to untreated wheat plants.
                                        Based on all the above results, the beneficial effects of SA, Zn, and GB treatments could be ascribed to decrease
                                   the accumulation of H  ­ 2O2, ­O2−, and MDA contents, perhaps by increasing the activity of antioxidant enzymes and
                                  enhancing the osmolytes accumulation (Fig. 6). Moreover, the exogenous applications of SA, Zn, and GB were
                                    effective in improving the leaf gas-exchange attributes and RWC, and stabilizing chlorophyll pigments (Fig. 6).
                                    These mechanisms are very important to sustain maize production in water deficit conditions.

                                  Materials and methods
                                  Experimental design and plant growth conditions. The controlled pot trial was carried out during
                                  the summer growing season of 2019 at the glasshouse of the College of Agronomy and Biotechnology (CAB),
                                  Southwest University (SWU), Chongqing, China. The experimental area lies at longitude 1­ 06◦ 26′ 02′’ E, latitude
                                  ­29◦ 49′ 32′’ N, and altitude 220 m. During the growing season, the average minimum and maximum tempera-
                                  tures were 24 °C and 35 °C, and the relative humidity was between 76 and 84%. The experiment was performed
                                  in a completely randomized design (CRD) with two factors: two soil water conditions and four spraying treat-
                                  ments. The experiment comprised eight treatments, and each treatment contained ten pots and three replica-
                                  tions. Summer maize cultivar Xinzhongyu 801, a commonly cultivated hybrid in China, was selected for this
                                  study. It has high-yield, stability, and adaptability and is widely grown in south-west China. Each plastic pot
                                  (30 cm diameter, 35 cm depth) was filled with 15 kg air-dried and sieved (0.5 mm) soils, which was collected
                                  from the experimental station at the CAB, SWU. Experimental soil was clay loam, and had the following physical
                                  and chemical properties: pH of 6.25, organic matter of 12.58 g kg−1, electrical conductivity (EC) of 0.45 ds ­m−1,

Scientific Reports |   (2021) 11:3195 |                https://doi.org/10.1038/s41598-021-82264-7                                                      9

                                                                                                                                                  Vol.:(0123456789)
www.nature.com/scientificreports/

                                            bulk density of 1.44 g cm−3, soil water content at field capacity (FC) of 24.35%, total N of 0.98 g kg−1, available
                                            phosphorous of 15.53 mg kg−1, and available potassium of 86.11 mg kg−1. During the time of soil filling, the ferti-
                                            lizers including 5.4 g controlled-release urea (44.6% N), 10 g calcium superphosphate (12% ­P2O5), and 2 g potas-
                                            sium chloride (60% ­K2O) were applied to each pot. Five uniform grains were manually cultivated on the ­10th of
                                            April in all pots at a depth of 4–5 cm. Thinning processes were performed after one week from germination, and
                                            two uniform seedlings ­pot−1 were selected for the subsequent studies. Thus, each treatment had 20 plants. All
                                            pots were irrigated to 85% FC from the tap water till the start of drought stress treatments.

                                            Soil water conditions. The plants were subjected to two soil water conditions for 28 days, from the four-
                                            teenth leaf ­(V14) until blister (­ R2) growth stages of maize: well-watered condition (85% of field capacity; WW)
                                            and drought-stressed condition (50% of field capacity; WD). During the drought period, the pots were weighed
                                            every day to keep the required water levels in the soils by adding proper water volumes. Soil water contents for
                                            85% and 50% field capacity were 22.5% and 11.25%, respectively. The weights similar to each of the following soil
                                            water contents (22.5% and 11.25%) are 17.45 and 16.30 kg/pot, respectively. These two field capacities are very
                                            important and we applied 85% as a normal condition treatment which maintains soil moisture near-maximum
                                            water-holding capacity and 50% as a drought condition which is near-minimum water-holding capacity.
                                               Soil water content (SWC) was computed by using the following equation: SWC % = [(FW-DW)/DW] × 100,
                                            where FW was the fresh weight of soil sample from the inner area of each pot and DW was the dry weight of soil
                                            sample after oven drying at 85 °C for 3 ­days72.

                                            Spraying treatments. After 7 and 14 days of drought imposition, the maize plants under each soil water
                                            condition were sprayed with double distilled water (CK), 140 mg l−1 SA (2-hydroxybenzoic acid, ­C7H6O3,
                                            MW = 138.12 g mol−1, pH: 5.8), 4 g l−1 Zn (zinc sulfate heptahydrate, ­ZnSO4 ‧7H2O, MW = 287.54 g mol−1), and
                                            11.5 g l−1 GB (betaine, ­C5H11NO2, MW = 117.14 g mol−1). SA was added in ethanol to increase the solubility in
                                            water (1 g 10 ml−1)73. Treatments were applied on all plants at the sixteenth leaf ­(V16) and eighteenth leaf ­(V18)
                                            growth stages. We finished the spraying of treatments before tasseling stage. Tween-20 (0.05%) was added with
                                            spraying treatments as a surfactant at the time of applications. we sprayed two times to ensure absorption spray-
                                            ing treatments into plants leaves after imposition of drought. The effective concentrations of these spraying treat-
                                            ments were selected based on results of previous studies carried out under drought s­ tress17,33,54,56,74–76.

                                            Plant sampling and analyses. Maize plants were sampled after 14 days of spraying applications (28 days
                                            of drought imposition) to measure growth parameters, chlorophyll contents, RWC, leaf gas-exchange attributes,
                                            and biochemical features. Completely expanded, undamaged, and healthy maize plant leaves (­ 3rd leaf from the
                                            top) were sampled from all repetitions. After cleaning, the leaves of maize plants were frozen with liquid ­N2
                                            immediately and stored at -80 °C for biochemical analyses, and the kits were purchased from Sino Best Biologi-
                                            cal Co., Ltd., China. The yield and its components were recorded at harvest.

                                            Growth parameters, yield, and its components. Six maize plants were randomly selected to measure
                                            plant height, fresh weight p ­ lant−1, dry weight p
                                                                                              ­ lant−1, number of leaves p
                                                                                                                         ­ lant−1, and leaf area p
                                                                                                                                                 ­ lant−1. Plant height
                                            was measured by a meter scale, biomass accumulation was determined by an electronic weighing balance, and
                                            total leaf area ­plant−1 was measured by using a LI-3100 laser area meter (Li-COR, CID, Inc., USA). The dry
                                            weight ­plant−1 was estimated following oven drying at 85 °C for 48 h. At full maturity (plants at 120-days old), six
                                            maize plants were randomly harvested to measure 100-grain weight (g), the number of grains p            ­ lant−1, biological
                                            yield (g ­plant−1), grain yield (g p­ lant−1), and harvest index (HI). The HI was computed as the percent ratio of
                                            grain yield and biological yield according to ­Donald77.

                                            Chlorophyll contents and RWC​.               Contents of chlorophyll (Chl. a, Chl. b and total Chl.) in the 3­ rd leaf
                                            from the top were determined according to Peng and L       ­ iu78. Extraction of a 250 mg leaf blade sample was done
                                            with 10 ml ethanol-acetone (vol. 1:2 ratio), and the extract was moved to a 15 ml centrifuge tube. The tubes were
                                            put in the dark to avoid from light for 24 h until the sample changed into a white color. The chlorophyll con-
                                            tents were calculated by the following equations: Chlorophyll a content (mg/g tissue) = (12.7D663—2.69D645) × V/
                                            (1000 × W), Chlorophyll b content (mg/g tissue) = (22.7 ­D645—4.68D663) × V/ (1000 × W), and total chlorophyll
                                            content (mg/g tissue) = (20.2 ­D645 + 8.02 ­D663) × V/ (1000 × W), where, ­D663 and D­ 645 are the corresponding wave-
                                            lengths of the optical density value (nm), V is the volume of extracting liquid (­ cm3) and W is the weight of fresh
                                            leaf (mg). The relative water content (RWC) of maize leaves was measured according to Barrs and W         ­ eatherley79.
                                            Fresh maize leaves were cut into small segments (1.5 cm length), and weighed fresh weight (FW, mg); Later these
                                            leaves were floated in distilled water for 4 h under low light to register saturated weight (SW, mg), and then dried
                                            in an oven until constant weight at 80 °C for 24 h to record dry weight (DW, mg). RWC was computed as: RWC
                                            (%) = (FW—DW)/ (SW—DW) × 100%.

                                            Leaf gas‑exchange attributes. Photosynthesis characteristics including the net photosynthesis rate (Pn),
                                            stomatal conductance (Gs), transpiration rate (Tr), and intercellular ­CO2 concentration (Ci) were recorded using
                                            a portable infrared gas analyser based photosynthesis system (LI-6400; LiCor, Inc., Lincoln, NE, USA) at 09:30–
                                            11:30 am from the fully expanded leaf ­(3rd leaf from top). Air relative humidity and ambient ­CO2 concentration
                                            were about 78% and 370 µmol ­CO2 ­mol−1, respectively during collecting the data.

          Scientific Reports |   (2021) 11:3195 |                 https://doi.org/10.1038/s41598-021-82264-7                                                         10

Vol:.(1234567890)
www.nature.com/scientificreports/

                                   Assay of antioxidant enzymes activity and lipid peroxidation. The activities of different enzymatic
                                   antioxidants in maize leaves were recorded using commercial kits as per the manufacturer’s instructions. The kits
                                   for superoxide dismutase (SOD-A500), catalase (CAT-A501), ascorbate peroxidase (APX-A304), glutathione
                                   reductase (GR-A111), and peroxidase (POD-A502) were purchased from the same company as indicated above.
                                   The absorbance readings of SOD, CAT, APX, GR, and POD were detected at 560 nm, 240 nm, 290 nm, 340 nm,
                                   and 470 nm, respectively using an ultraviolet (UV)-visible spectrophotometer, and the activities of these enzymes
                                   were expressed as units per fresh weight (U g­ −1 FW). The units of the antioxidant enzymes activity were defined
                                  as follows: “one unit of GR activity was expressed as the amount of enzyme depleting 1 µmol NADPH in 1 min,
                                  one unit of SOD activity was defined as the amount of enzyme needed to reduce the reference rate to 50% of
                                  maximum inhibition, one unit of CAT activity was measured as the amount of enzyme that decomposes 1 nmol
                                  ­H2O2 at 240 nm min−1 in 1 g fresh weight, one unit of APX was estimated as the amount of enzyme required for
                                   catalyzing 1 μmol ASA at 290 nm 2 min−1 of 1 g fresh weight in 1 ml of a reaction mixture, and one unit of POD
                                  activity was demonstrated as the absorbance change of 0.01 at 470 nm min−1 for 1 g fresh weight in 1 ml of a
                                  reaction mixture”80–82. Lipid peroxidation was assayed as MDA content in maize leaves, through thiobarbituric
                                  (TBA) method using MDA Detection Kit (A401), obtained from the same company as indicated above. The
                                  absorbance for MDA was recorded at 532 and 600 nm and expressed as nmol ­g−1 fresh weight.

                                  Estimation of reactive oxygen species accumulation. The contents of hydrogen peroxide (­H2O2)
                                  and superoxide anion radical ­(O2−) in the leaves of maize were recorded using the commercial ‘H2O2 Detection
                                  Kit (A400)’, and ‘O2− Detection kit (A407)’, respectively, being purchased from the same company as indicated
                                  above. ­H2O2 content was estimated at 415 nm and represented as μmol g­ −1 fresh weight. Super oxygen anion
                                  serotonin reacted with hydrochloride to produce ­NO2−. The ­NO2− entered with the interaction of amino benzene
                                  and alpha-pyridoxine to the production of red compounds at 530 nm which had a characteristic absorption
                                  peak. The content of ­O2− was measured at 530 nm, and expressed as μmol ­g−1 fresh weight.

                                  Determination of osmolytes accumulation. The contents of proline and soluble sugar in maize leaves
                                  were determined using commercial kits according to the manufacturer’s instructions. The kits for proline (PRO,
                                  A605), and soluble sugar contents (SSC, B602) were purchased from the same company as indicated above. The
                                  absorbance readings of the toluene layer were read on a spectrophotometer at 520 nm. Proline (Sigma, St Louis,
                                  MO, USA) was used as a standard curve. Proline content was expressed as µg g­ −1 fresh weight. The absorbance
                                  readings of SSC was detected at 620 nm using an ultraviolet (UV) visible spectrophotometer. Soluble sugar con-
                                  tent was articulated as mg ­g−1 fresh weight.

                                  Statistical analysis. Data were statistically analyzed following the analysis of variance (ANOVA) technique
                                  according to the Two-way factorial Design using Statistical Software Package MSTAT-C83. Least significant dif-
                                  ferences test (L.S.D) at 5% probability was used to test the significance among mean values of each t­ reatment84.
                                  Ten pots and three replications were used for each treatment and 20 plants were grown for each treatment. Sigma
                                  Plot 10.0 (Systat Software Inc., San Jose, CA, USA) was used for graphical presentation of the data.

                                  Conclusion
                                  This experiment revealed that the spraying application of 140 mg l−1 SA, 4 g l−1 Zn, and 11.5 g l−1 GB improved
                                  drought-tolerance in maize crop through increased photosynthesis pigments and RWC, improved leaf gas-
                                  exchange attributes, enhanced activities of antioxidant enzymes, reduced of MDA, ­H2O2, and O       ­ 2− contents,
                                  and higher accumulation of osmolytes in drought-stressed plants. Thus, it might be considered as an important
                                  strategy to improve the plant growth parameters, yield, and its components under drought-stressed condition.
                                  Overall, GB application was the most effective followed by SA and Zn applications to alleviate the injurious
                                  effects in maize triggered by drought.

                                  Received: 1 June 2020; Accepted: 18 January 2021

                                  References
                                   1. Cassman, K. G., Dobermann, A., Walters, D. T. & Yang, H. Meeting cereal demand while protecting natural resources and improv-
                                      ing environmental quality. Annu. Rev. Environ. Resour. 28, 315–358 (2003).
                                   2. FAOSTAT. Population data. Food and Agricultural Organization of United Nation, Roma. http://Faosta​ t.fao.org/downlo  ​ ad/O/OA/E.
                                      (2017).
                                   3. Daryanto, S., Wang, L. & Jacinthe, P. A. Global synthesis of drought effects on maize and wheat production. PLoS ONE 11, e0156362
                                      (2016).
                                   4. Tilman, D., Balzer, C., Hill, J. & Befort, B. L. Global food demand and the sustainable intensification of agriculture. Proc. Natl.
                                      Acad. Sci. USA 108, 20260–20264 (2011).
                                   5. Shen, Y. J., Ok, T., Utsumi, N., Kanae, S. & Hanasaki, N. Projection of future world water resources under SRES scenarios: water
                                      withdrawal. Hydrol. Sci. J. 53, 11–33 (2008).
                                   6. Fereres, E. & Connor, D. J. Sustainable water management in agriculture (2004).
                                   7. Godfray, H. C. J. et al. Food security: the challenge of feeding 9 billion people. Science 327, 812–818 (2010).
                                   8. Liu, Y., Li, S., Chen, F., Yang, S. & Chen, X. Soil water dynamics and water use efficiency in spring maize (Zea mays L.) fields
                                      subjected to different water management practices on the Loess Plateau. China Agric. Water. Manag. 97, 769–775 (2010).
                                   9. Ge, T. D., Sui, F. G., Bai, L. P., Tong, C. L. & Sun, N. B. Effects of water stress on growth, biomass partitioning, and water-use
                                      efficiency in summer maize (Zea mays L.) throughout the growth cycle. Acta Physiol. Plant. 34, 1043–1053 (2012).
                                  10. Talaat, N. B., Shawky, B. T. & Ibrahim, A. S. Alleviation of drought-induced oxidative stress in maize (Zea mays L.) plants by dual
                                      application of 24-epibrassinolide and spermine. Environ. Exp. Bot. 113, 47–58 (2015).

Scientific Reports |   (2021) 11:3195 |                   https://doi.org/10.1038/s41598-021-82264-7                                                                  11

                                                                                                                                                                 Vol.:(0123456789)
www.nature.com/scientificreports/

                                            11. Ahammed, G. J. et al. The SlWRKY81 transcription factor inhibits stomatal closure by attenuating nitric oxide accumulation in the
                                                guard cells of tomato under drought (Physiol, Plantarum, 2020).
                                            12. Jan, S., Abbas, N., Ashraf, M. & Ahmad, P. Roles of potential plant hormones and transcription factors in controlling leaf senescence
                                                and drought tolerance. Protoplasma 256, 313–329 (2019).
                                            13. Hussain, H. A. et al. Maize tolerance against drought and chilling stresses varied with root morphology and antioxidative defense
                                                system. Plants 9, 720 (2020).
                                            14. Hussain, H. A. et al. Chilling and drought stresses in crop plants: implications, cross talk, and potential management opportunities.
                                                Front. Plant Sci. 9, 393 (2018).
                                            15. Miller, G., Suzuki, N., Ciftci-Yilmaz, S. & Mittler, R. Reactive oxygen species homeostasis and signalling during drought and salinity
                                                stresses. Plant Cell Environ. 33, 453–467 (2010).
                                            16. Scheibe, R. & Beck, E. Drought, Desiccation, and Oxidative Stress (Ecological Studies, 2011).
                                            17. Sohag, A. A. M. et al. Exogenous salicylic acid and hydrogen peroxide attenuates drought stress in rice. Plant Soil Environ. 66,
                                                7–13 (2020).
                                            18. Li, X. et al. RBOH1-dependent apoplastic H2O2 mediates epigallocatechin-3-gallate-induced abiotic stress tolerance in Solanum
                                                lycopersicum L. Environ. Exp. Bot. 161, 357–366 (2019).
                                            19. Ahammed, G. J. et al. Tomato WRKY81 acts as a negative regulator for drought tolerance by modulating guard cell H2O2–medi-
                                                ated stomatal closure. Environ. Exp. Bot. 171, 103960 (2020).
                                            20. Li, X. et al. Salicylic acid acts upstream of nitric oxide in elevated carbon dioxide-induced flavonoid biosynthesis in tea plant
                                                (Camellia sinensis L.). Environ. Exp. Bot. 161, 367–374 (2019).
                                            21. Kaya, C., Ashraf, M., Alyemeni, M. N., Corpas, F. J. & Ahmad, P. Salicylic acid-induced nitric oxide enhances arsenic toxicity
                                                tolerance in maize plants by upregulating the ascorbate-glutathione cycle and glyoxalase system. J. Hazard. Mater. 399, 123020
                                                (2020).
                                            22. Hayat, Q., Hayat, S., Irfan, M. & Ahmad, A. Effect of exogenous salicylic acid under changing environment: a review. Environ. Exp.
                                                Bot. 68, 14–25 (2010).
                                            23. Noreen, S., Fatima, K., Athar, H. U. R., Ahmad, S. & Hussain, K. Enhancement of physio-biochemical parameters of wheat through
                                                exogenous application of salicylic acid under drought stress. J. Anim. Plant Sci. 27, 153–163 (2017).
                                            24. Fardus, J., Matin, M. A., Hasanuzzaman, M., Hossain, M. A. & Hasanuzzaman, M. Salicylic acid-induced improvement in germina-
                                                tion and growth parameters of wheat under salinity stress. J. Anim. Plant Sci. 28, 197–207 (2018).
                                            25. Farooq, M., Wahid, A., Lee, D. J., Cheema, S. A. & Aziz, T. Comparative time course action of the foliar applied glycinebetaine,
                                                salicylic acid, nitrous oxide, brassinosteroids and spermine in improving drought resistance of rice. J. Agron. Crop Sci. 196, 336–345
                                                (2010).
                                            26. Maruri-López, I., Aviles-Baltazar, N. Y., Buchala, A. & Serrano, M. Intra and extracellular journey of the phytohormone salicylic
                                                acid. Front. Plant Sci. https​://doi.org/10.3389/fpls.2019.00423​ (2019).
                                            27. Sharma, M. et al. Salicylic acid mediated growth, physiological and proteomic responses in two wheat varieties under drought
                                                stress. J. Proteom. 163, 28–51 (2017).
                                            28. Khan, H. R., McDonald, G. K. & Rengel, Z. Zinc fertilization and water stress affects plant water relations, stomatal conductance
                                                and osmotic adjustment in chickpea (Cicer arietinum L.). Plant and Soil. 267, 271–284 (2004).
                                            29. Nasiri, Y. & Najafi, N. Effect of soil and foliar application of zinc and iron on flowering and essential oil of chamomile at green
                                                house conditions. Acta Agric. Slov. 105, 1–4 (2015).
                                            30. Wang, H. & Jin, J. Effects of zinc deficiency and drought on plant growth and metabolism of reactive oxygen species in maize (Zea
                                                mays L.). Agric. Sci. China. 6, 988–995 (2007).
                                            31. Sofy, M. R. Application of salicylic acid and zinc improves wheat yield through physiological processes under different levels of
                                                irrigation intervals. Int. J. Plant Res. 5, 136–156 (2015).
                                            32. water relations and yield. Iqbal, N., Ashraf, M. & Ashraf, M. Y. Glycinebetaine, an osmolyte of interest to improve water stress
                                                tolerance in sunflower (Helianthus annuus L.). S. Afr. J. Bot. 74, 274–281 (2008).
                                            33. Raza, M. A. S., Saleem, M. F., Shah, G. M., Khan, I. H. & Raza, A. Exogenous application of glycinebetaine and potassium for
                                                improving water relations and grain yield of wheat under drought. J. Soil Sci. Plant Nut. 14, 348–364 (2014).
                                            34. Hasanuzzaman, M. et al. Targeting glycinebetaine for abiotic stress tolerance in crop plants: physiological mechanism, molecular
                                                interaction and signaling. Phyton Int. J. Exp. Bot. 88, 185–221 (2019).
                                            35. Raza, M. A. S., Saleem, M. F., Ashraf, M. Y., Ali, A. & Asghar, H. N. Glycinebetaine applied under drought improved the physi-
                                                ological efficiency of wheat (Triticum aestivum L.) plant. Soil Environ. 31, 67–71 (2012).
                                            36. Anjum, S. A. et al. Drought induced changes in growth, osmolyte accumulation and antioxidant metabolism of three maize hybrids.
                                                Front. Plant Sci. 8, 69 (2017).
                                            37. Ma, D. et al. Physiological responses and yield of wheat plants in zinc-mediated alleviation of drought stress. Front. Plant Sci. 8,
                                                860 (2017).
                                            38. Abdel-Motagally, F. M. F. & El-Zohri, M. Improvement of wheat yield grown under drought stress by boron foliar application at
                                                different growth stages. J. Saudi Soc. Agric. Sci. 17, 178–185 (2018).
                                            39. Zhang, B., Li, W., Chang, X., Li, R. & Jing, R. Effects of favorable alleles for water-soluble carbohydrates at grain filling on grain
                                                weight under drought and heat stresses in wheat. PLoS ONE 9, e102917 (2014).
                                            40. Hussain, H. A. et al. Interactive effects of drought and heat stresses on morpho-physiological attributes, yield, nutrient uptake and
                                                oxidative status in maize hybrids. Sci. Rep. 9, 1–12 (2019).
                                            41. Anjum, S. A. et al. Effect of progressive drought stress on growth, leaf gas exchange, and antioxidant production in two maize
                                                cultivars. Environ. Sci. Pollut. Res. 23, 17132–17141 (2016).
                                            42. Ullaha, A., Romdhaneb, L., Rehmanc, A. & Farooq, M. Adequate zinc nutrition improves the tolerance against drought and heat
                                                stresses in chickpea. Plant Physiol. Biochem. 143, 11–18 (2019).
                                            43. Osman, H. S. Enhancing antioxidant-yield relationship of pea plant under drought at different growth stages by exogenously
                                                applied glycine betaine and proline. Ann. Agric. Sci. 60, 389–402 (2015).
                                            44. Ghazi, D. A. Impact of drought stress on maize (Zea mays) plant in presence or absence of salicylic acid spraying. J. Soil Sci. Agric.
                                                Eng. Mansoura Univ. 8, 223–229 (2017).
                                            45. Mittler, R. Oxidative stress, antioxidants and stress tolerance. Trends Plant Sci. 7, 405–410 (2002).
                                            46. Habibi, G. Exogenous salicylic acid alleviates oxidative damage of barley plants under drought stress. Acta Biol. Szeged. 56, 57–63
                                                (2012).
                                            47. Rollins, J. A. et al. Leaf proteome alterations in the context of physiological and morphological responses to drought and heat stress
                                                in barley (Hordeum vulgare L.). J. Exp. Bot. 64, 3201–3212 (2013).
                                            48. Upadhyaya, H., Dutta, B. K. & Panda, S. K. Zinc modulates drought-induced biochemical damages in tea [Camellia sinensis (L)
                                                O Kuntze]. J. Agric. Food Chem. 61, 6660–6670 (2013).
                                            49. Shahbaz, M., Masood, Y., Perveen, S. & Ashraf, M. Is foliar-applied glycinebetaine effective in mitigating the adverse effects of
                                                drought stress on wheat (Triticum aestivum L.). J. Appl. Bot. Food Qual. 84, 192–199 (2011).
                                            50. Miri, H. R. & Armin, M. The interaction effect of drought and exogenous application of glycine betaine on corn (Zea mays L.).
                                                Euro. J. Exp. Biol. 3, 197–206 (2013).

          Scientific Reports |   (2021) 11:3195 |                    https://doi.org/10.1038/s41598-021-82264-7                                                                    12

Vol:.(1234567890)
You can also read