NOAA DROUGHT TASK FORCE REPORT ON THE 2020-2021 SOUTHWESTERN U.S. DROUGHT
←
→
Page content transcription
If your browser does not render page correctly, please read the page content below
NOAA DROUGHT TASK FORCE
  REPORT ON THE 2020–2021
SOUTHWESTERN U.S. DROUGHT
ACKNOWLEDGMENTS
    NOAA DROUGHT                    NOAA NIDIS                       Martin Hoerling                 Christopher B. Skinner
    TASK FORCE IV                                                    Meteorologist, NOAA/            Assistant Professor,
                                    Joel Lisonbee
                                                                     Physical Sciences               Department of
    LEADS                           Regional Drought
                                                                     Laboratory                      Environmental, Earth, and
    Justin S. Mankin*               Information Coordinator,
                                                                                                     Atmospheric Sciences,
    Assistant Professor,            NOAA/NIDIS, CIRES                Mingyue Chen
                                                                                                     UMASS-Lowell
    Department of Geography,                                         Meteorologist, Climate
                                    Amanda Sheffield
    Dartmouth College                                                Prediction Center, NCEP         Harmanveer Singh
                                    Regional Drought
                                                                                                     Research Assistant,
    Isla Simpson*                   Information Coordinator,         Cenlin He
                                                                                                     Department of Geography,
    Scientist 2, Climate            NOAA/NIDIS, CIRES                Project Scientist, Research
                                                                                                     Dartmouth College
    and Global Dynamics                                              Application Lab (RAL),
                                    Molly Woloszyn
    Laboratory, National Center                                      National Center for             Ben Livneh
                                    Regional Drought
    for Atmospheric Research                                         Atmospheric Research            Assistant Professor,
                                    Information Coordinator,
                                                                     (NCAR)                          Department of Civil,
    Andrew Hoell*                   NOAA/NIDIS, CIRES
                                                                                                     Environmental, and
    Meteorologist, NOAA/                                             Paul Dirmeyer
                                    Adam Lang                                                        Architectural Engineering,
    Physical Sciences                                                Professor, Department of
                                    Communications                                                   University of Colorado,
    Laboratory                                                       Atmospheric, Oceanic and
                                    Coordinator, NOAA/NIDIS,                                         Boulder, CIRES
                                                                     Earth Sciences , George
    Rong Fu                         CIRES
                                                                     Mason University
    Professor, Department of                                                                         DESIGN AND LAYOUT
    Atmospheric & Oceanic                                            Jason E. Smerdon
                                    KEY CONTRIBUTORS                 Lamont Research Professor,      Fiona Martin
    Sciences, UCLA
                                    H. Annamalai                     Lamont Doherty Earth            Visual Science
                                    Research Professor of            Observatory of Columbia         Communicator,
    NOAA MAPP                       Oceanography, School of          University                      Visualizing Science
    Daniel Barrie                   Ocean and Earth Science          Flavio Lehner
    Program Manager,                and Technology, University       Assistant Professor,
    NOAA Climate Program            of Hawaii                        Department of Earth and
    Office                          Arun Kumar                       Atmospheric Science,
                                    Chief, Development Branch,       Cornell University
    Courtney Byrd
    Program Specialist,             Climate Prediction Center,       Mathew Barlow
    NOAA Climate Program            NCEP                             Professor, Department of
    Office                          Richard Seager                   Environmental, Earth, and
                                    Palisades Geophysical            Atmospheric Sciences,
    Wenfei Ni
                                    Institute/Lamont Research        UMASS-Lowell
    Program Specialist,
    NOAA Climate Program            Professor, Lamont Doherty
    Office                          Earth Observatory
                                    of Columbia University

    *These authors contributed equally.

    The authors thank the helpful scientific reviews from: Joe Barsugli (ESRL/PSL), Mike Crimmins (CLIMAS/University of Arizona),
    Keely Brooks (Southern Nevada Water Authority), and three additional anonymous reviewers. We acknowledge the support
    of the NOAA MAPP Program as well as the World Climate Research Programme, which, through its Working Group on Coupled
    Modelling, coordinated and promoted CMIP6. We thank the climate modeling groups for producing and making available their
    model output, the Earth System Grid Federation (ESGF) for archiving the data and providing access, and the multiple funding
    agencies who support CMIP6 and ESGF.

    Suggested citation
    Mankin JS, Simpson I, Hoell A, Fu R, Lisonbee J, Sheffield A, Barrie D. (2021) NOAA Drought Task Force Report on the 2020–2021
    Southwestern U.S. Drought. NOAA Drought Task Force, MAPP, and NIDIS.

2
TABLE OF
                                CONTENTS
                                Acknowledgments���������������������������������������������������������������� 2

                                Abstract�������������������������������������������������������� 4

                                How Bad Is It?������������������������������������������������ 5

                                What Caused It?��������������������������������������������� 9
                                On Precipitation�������������������������������������������������������������������� 9
                                On Temperature������������������������������������������������������������������ 12

                                When Is It Going To End?������������������������������� 13
                                On Precipitation������������������������������������������������������������������ 13
                                On Temperature������������������������������������������������������������������ 14

                                Outstanding Questions
                                To Be Answered�������������������������������������������� 17

                                References���������������������������������������������������������������������������� 18

                                                                                     On the Cover: Aerial view of
                                                                                    Lake Mead and Hoover Dam.
                                                                                         Credit: weltreisendertj

NOAA Drought Task Force Report on the 2020–2021 Southwestern U.S. Drought                                                    3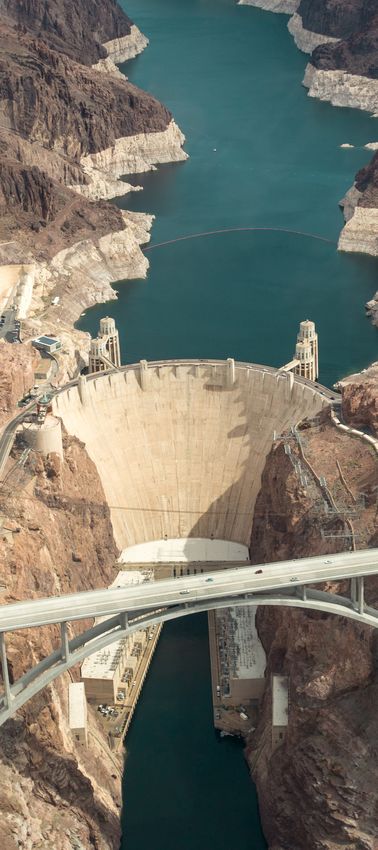
ABSTRACT
                                                                         Nevada
                                                                                         Utah
                                                                                                        Colorado
                                                            California
    Using the state-of-science and
    the collective expertise of the
    NOAA Drought Task Force, this
    report addresses three questions                                                Arizona
    about the period of below normal                                                               New Mexico
    rain, snow, runoff, and soil mois-
    ture, known as the 2020–21 U.S.
    Southwest drought: (1) How bad is
    it? (2) What caused it? And (3) When
    will it end?

    For the six states of the U.S. Southwest (Arizona, Califor- warming have melted snowpack and ▲ These six
    nia, Colorado, Nevada, New Mexico, and Utah)i, January           drawn water from the land surface southwest U.S.
                                                                                                             states experienced
    2020 through August 2021 have been exceptional in the            more rapidly than in previous years. exceptional
    instrumental climate record since 1895, with the lowest The warm temperatures that helped drought since
    total precipitation and the third-highest daily average          to make this drought so intense January          2020.
                                                                                                             Credit: NOAA,
    temperatures recorded, which together imposed an                 and widespread will continue (and Fiona Martin
    unyielding, unprecedented, and costly drought. This              increase) until stringent climate
    exceptional drought punctuates a two-decade period               mitigation is pursued and regional warming trends are
    of persistently warm and dry conditions throughout               reversed. As such, continued warming of the U.S. South-
    the region. The low precipitation across U.S. states and         west due to greenhouse gas emissions will make even
    seasons appears to have been largely due to natural,             randomly occurring seasons of average- to below-av-
    but unfavorable, variations in the atmo-                                                  erage precipitation a potential
    sphere and ocean. As such, predicting                                                     drought trigger, and intensify
    when total precipitation will return             For   much    of the   U.S.              droughts beyond what would
    to pre-drought levels is a challenge. Southwest, the present                              be expected from rainfall
    While summer 2021 brought welcome                drought will last at least               or snowpack deficits alone.
    monsoon rains to parts of the South-                                                      Human-caused increases in
    west, several seasons, or years, of
                                                     into 2022, potentially                   drought risk will continue to
    above-average rain and high elevation            longer.                                  impose enormous costs upon
    snow are needed to replenish rivers,                                                      the livelihoods and well-being
    soils, and reservoirs across the region. This suggests that      of the ~60+ million people living in the six states of the
    for much of the U.S. Southwest, the present drought will         U.S. Southwest, as well as the broader communities
    last at least into 2022, potentially longer. At the same time,   dependent on the goods and services they produce. ◆
    exceptionally warm temperatures from human-caused

    i The 2020–21 drought covers much of Western North America, including parts of Canada and Mexico. This report centers on the
    U.S. Southwest as the 2020–21 drought has been most persistent and severe there.

4   NOAA Drought Task Force Report on the 2020–2021 Southwestern U.S. Drought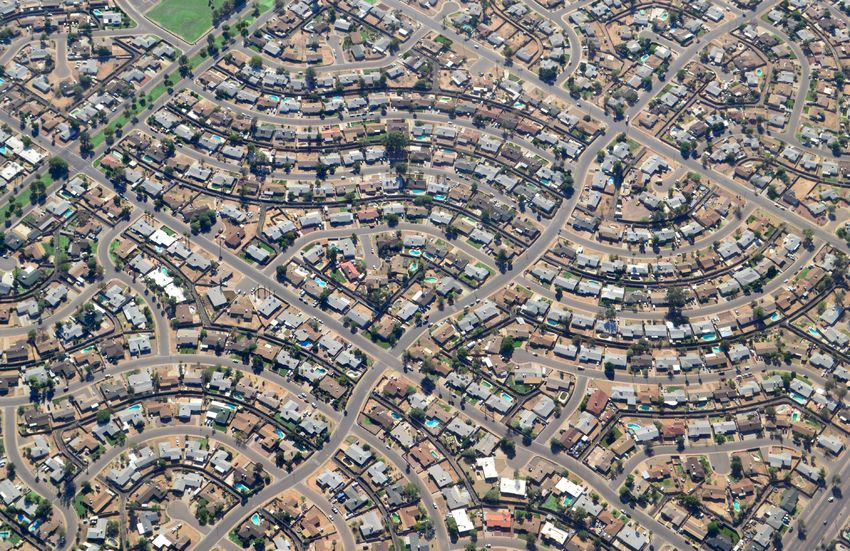
HOW BAD IS IT?

                                                     HOW BAD IS IT?
                                                     The 2020–21 drought plaguing the U.S. Southwest
                                                     (see Box 1), which emerged first in the Four
                                                     Corners region in winter 2020, is exceptional in the
                                                     instrumental and paleoclimate records, imposing
                                                     massive water shortages and socioeconomic costs,
                                                     triggering emergency declarations, and has even
                                                     led to the first ever water delivery shortfall among
                                                     the states sharing the Colorado River1, the most
                                                     important river basin in the region (Table 1)ii.

                                                     ii A Colorado River water delivery shortfall presents a unprec-
                                                     edented political, social, economic, and legal challenge for
                                                     the tens of millions of people directly reliant on water from
                                                     the Colorado River, as they negotiate whose water rights are
                                                     yielded, which crops are fallowed, which hydropower plants
                                                     curtail electricity production for which communities, and
                                                     which basins face mandatory water use restrictions.

                                                        BOX 1

                                                        What is Drought?
                                                        Drought occurs when a water deficit at the land
                                                        surface ensures that water demands cannot be
                                                        met. Drought is typically defined based on where
                                                        water supply and its demand are being consid-
                                                        ered. For example, most droughts begin due to
                                                        a period of low precipitation, creating what is
                                                        known as a meteorological drought. At some point,
                                                        the low precipitation can dry soils, leading to an
                                                        agricultural drought. Finally, if river and stream flow
                                                        is impacted, the drought can become a hydrologic
                                                        drought. It is important to note three things: first, not
                                                        all meteorological droughts become agricultural or
                                                        hydrologic droughts. Second, agricultural or hydro-
                                                        logic droughts can occur without a meteorological
                                                        drought, such as through poor human manage-
                                                        ment. Finally, the major socioeconomic impacts of
                                                        droughts tend to be associated with hydrologic and
                                                        agricultural droughts, as they more directly affect
                                                        human-managed systems, like hydropower and
                                                        agriculture. The 2020–21 Southwestern U.S. drought
    Aerial view of Hoover Dam
    and the Colorado River
                                                        examined here began in the winter of 2019–2020 in
    bridge in Nevada and                                the Four Corners region as a meteorological drought
    Arizona. Credit: veeterzy                           and by summer of 2020, became both an agricultural
                                                        and hydrologic drought.

                     NOAA Drought Task Force Report on the 2020–2021 Southwestern U.S. Drought                         5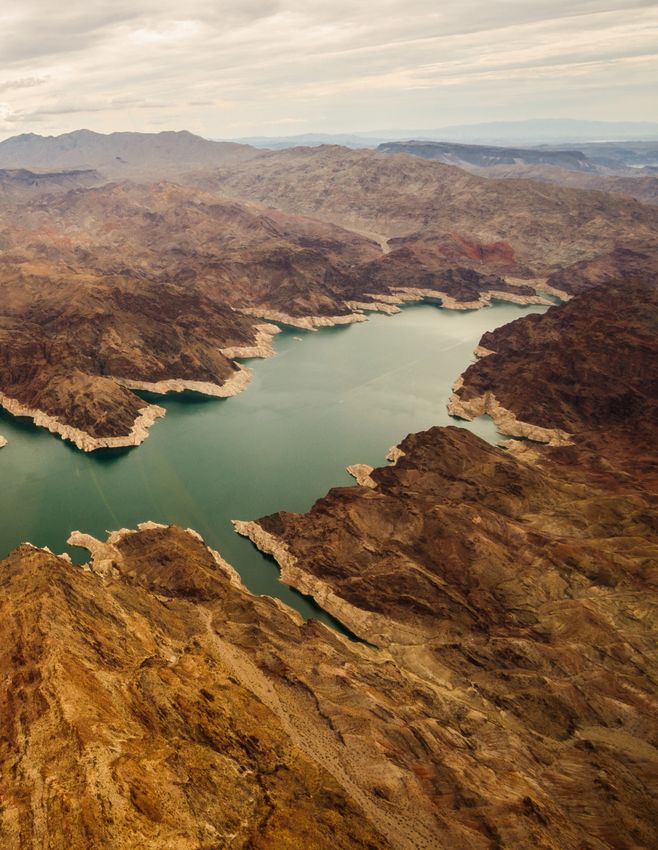
▲ Figure 1: The January 2020–August 2021 (a) precipitation rank and (b) temperature rank relative to equivalent January to August 20-month
    periods since 1895 from NOAA’s Monthly U.S. Climate Gridded Dataset (NClimGrid)3. The January 2020–August 2021 drought residence time (c),
    calculated as the percent of the January 2020–August 2021 period spent in a drought class of “moderate drought” (i.e., “D1”) or more based
    on the U.S. Drought Monitor (USDM)4. For the 20-month period of January to August of the following year, time series of (d) total precipitation
    and (e) daily average temperature over California, Nevada, Utah, Colorado, Arizona, and New Mexico. Also shown in (d) and (e) are the 20-year
    averages of those time series. Colors in (d) and (e) represent the percentile ranks from (a) and (b). (f) time series of the total area in drought
    classes (“moderate”, “severe”, “extreme”, or “exceptional”, D1–D4) expressed as a percent of the total six-state area based on the USDM.

    Successive dry and warm winter seasons in 2020 and         Monitor, (USDM, Fig. 1c, f). The spatial extent of the
    2021, along with a dry 2020 summer monsoon, have led       2020–21 Southwestern U.S. drought spans many major
    precipitation totals over the 20 months between Janu-      Intermountain and West Coast watersheds, including
    ary 2020 and August 2021 to be the lowest on record        the Upper and Lower Colorado, the Great Basin, the
    since at least 1895 over the U.S. Southwest (Fig. 1a, d).  Rio Grande, and California Coastal basins, including the
    Daily average temperatures across the six states were      Sacramento and San Joaquin.
    the third-highest on record over
    that same period (Fig. 1b, e). Both                                               The environmental, social, politi-
    of these 20-month anomalies have
                                          Precipitation totals over                   cal, and economic consequences
    occurred in the context of a longer the 20 months between                         of this drought have been swift and
    term (presumed natural) period January 2020 and August                            severe. With massive economic
    of declining precipitation (Fig. 1d, 2021 [are] the lowest on                     losses from the drought having
    “20-Year Average”) and a (human-                                                  already occurred due to its asso-
    caused) warming trend (Fig. 1e, record since at least 1895                        ciated heat and wildfires in 2020,
    “20-Year Average”). Together, the      over   the   U.S.  Southwest.              drought impacts continue to mani-
    exceptionally low precipitation                                                   fest in 2021. The 2020 wildfire
    and warm temperatures2 reduced mountain snow-              season burned over 10 million acres, with exceptionally
    pack and increased evaporation of soil moisture, lead-     large areas burned in California, Colorado, and Arizona.
    ing to persistent and widespread drought over the last     In contrast, 2021’s wildfire risk has been centered on the
    20 months, as classified by the United States Drought      West Coast, particularly in California. This is because

6   NOAA Drought Task Force Report on the 2020–2021 Southwestern U.S. Drought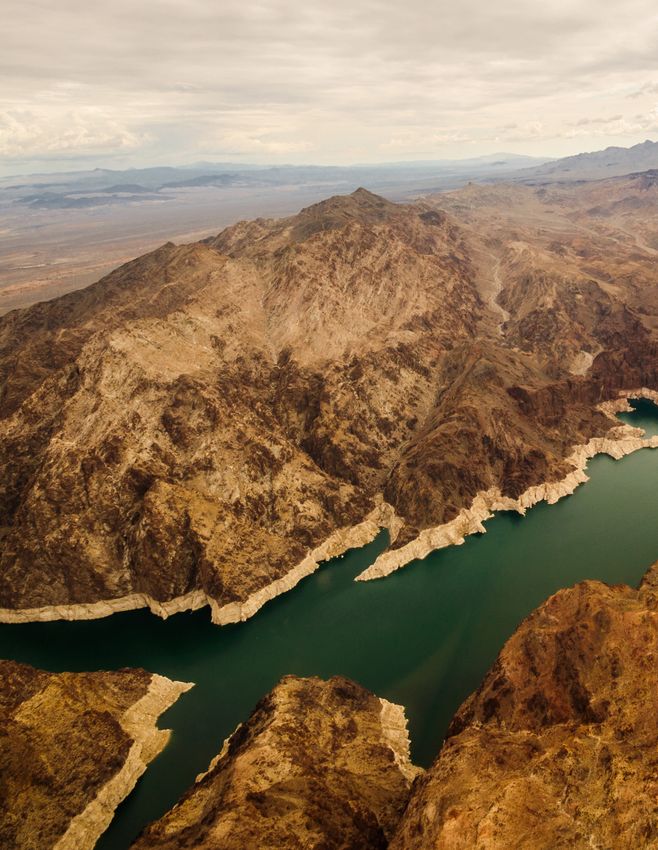
Colorado enjoyed late-season snow accumulation and          water for 40 million people including 22 federally recog-
Arizona, which suffered a rapid onset of wildfires this     nized tribes7, electricity supply for nearly 800,000 house-
Spring, has welcomed wet monsoon rains.                     holds8, irrigation for over 5.5 million acres of land, and
                                                                                   river flow for seven National Wild-
While neither Colorado’s snow                                                      life Refuges, four National Recre-
nor Arizona’s rains have ended Many surface water                                  ation Areas, and eleven National
the drought in those states, they       reservoirs      in the  U.S.               Parks7. The reservoirs in the Lower
have diminished wildfire risks Southwest, which store                              Colorado River below Lees Ferry
greatly. It remains, however, that
                                        water and are designed to at the Utah–Arizona border, which
the nation’s wildfire resources were                                               provide water and hydropower to
fully committed by mid-July, quite buffer periods of drought,                      Las Vegas, Los Angeles, Phoenix,
early in the wildfire season, and have been at historic lows. San Diego, and Tucson, have also
continue to be. As of early Septem-                                                been at record lows. Such histor-
ber, more than 43,000 fires have burned over 5 million      ically low reservoir levels throughout the Southwest
acres5, portending a costly and lengthy wildfire season     have major implications for electricity blackouts amidst
and continued risk to life and property.                    record-setting heatwaves, as hydropower production
                                                            shortfalls from the drought, coupled with high electric-
Many surface water reservoirs in the U.S. Southwest,        ity demand from air conditioning create conditions for
which store water and are designed to buffer periods        both planned and unplanned blackouts.9 Moreover, as
of drought, have been at historic lows. Total reservoir     the economy recovers from the COVID-19 pandemic,
storage across all six states were at 57% of average        the low reservoir levels imply disruptions to fishing and
Spring capacity heading into summer 2021 (Table 1)6.        recreation (as boat launches close in national parks,
The spatial extent of the drought spans the entirety of     for example10), potentially slowing recovery for many
the crucial Colorado River basin, which supplies drinking   tourism-based economies. In fact, the immediate

                                                                    TABLE 1

                                                                      2020 economic cost
                                Percent of average May                of drought (drought                       Drought state of
                                2021 reservoir storage6               and wildfire)11                           emergency declared

  Arizona                       51%                                   $5M–100M ($100M–250M)                     Yes, since 1999

  California                    58%                                   $250M–500M ($10B–20B)                     Yes (April 2021)

  Colorado                      84%                                   $250M–500M ($1B–2B)                       Yes (June 2021)

  Nevada                        58%                                   $5M–100M ($100M–250M)                     No

  New Mexico                    42%                                   $5M–100M ($100M–250M)                     Yes (October 2020)

  Utah                          92%                                   $5M–100M ($100M–250M)                     Yes (March 2021)

  TOTAL                         57%                                   $515M–1.3B ($11.4B–23B)                   5 of 6 states

▲ Table 1: For each of the six states considered (and for the six-state total), the percent of average Spring reservoir capacity in 2021
(based on average May reservoir levels from the National Water and Climate Center), the cost of the drought and the drought plus
wildfire for 2020 (based on the National Centers for Environmental Information) and whether (and when) a state of emergency has
been declared by the Governor of each state. In June 2021, the Navajo Nation also reissued a drought emergency declaration12. As of
the writing of this report, Nevada’s Governor has not issued a state of emergency for the drought, but has for the Caldor Fire13.

                  NOAA Drought Task Force Report on the 2020–2021 Southwestern U.S. Drought                                                7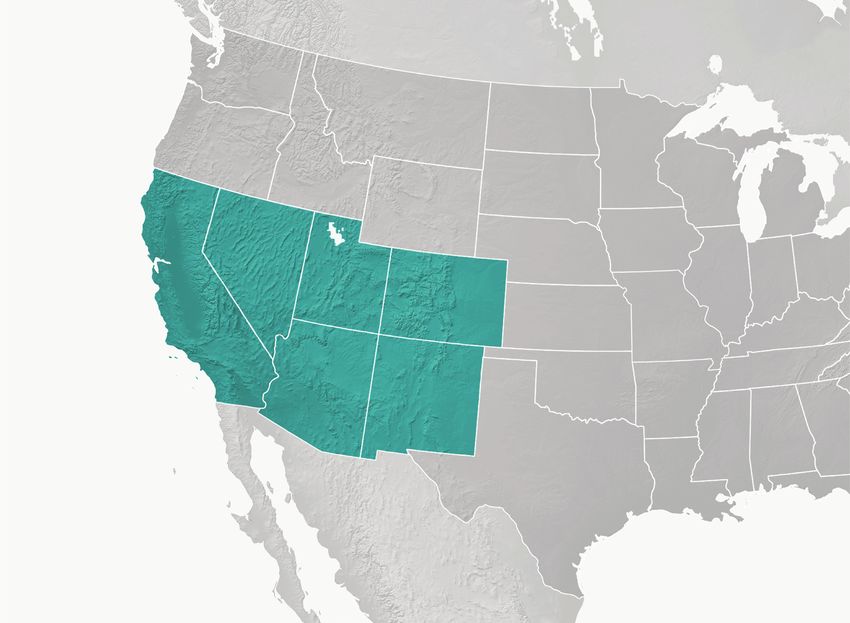
▲ Aerial view of
    economic losses associated with the drought for 2020         activation level (Phase 3)20. Nevada a neighborhood
    alone are approximately between $515M and $1.3B11,           has imposed use restrictions21, while in Phoenix,
                                                                                                             Arizona. Credit:
    not including losses from associated wildfires, which        New Mexico22 and Utah23 have both Jessica Kirsh
    raises the costs to be between $11.4B and $23B (Table 1).    issued drought emergency declara-
    The costs from 2021 have yet to be estimated, but are        tions (Table 1). With the Colorado River water-sharing
    likely considerable.                                         agreement set to expire in 2026, Colorado River–depen-
                                                                 dent states and tribal governments are already negoti-
    With 2021 having emerged as a second consecutive year        ating terms of future use24. The threat of water shortage
    of hot and dry conditions, many governors took steps         deliveries in 2021 is certain; crucially, the states sharing
    to prepare water districts and citizens for the coming       the Colorado have a Drought Contingency Plan, which is
    water limitations. Arizona reissued its drought state of     the framework whereby Lower Basin states like Arizona,
    emergency, which has been in place since 199914. The         California, and Nevada make cutbacks, while the Upper
    California Governor has declared three separate states of    Basin retains some flexibility for reservoir operations25. ◆
    emergency, the first in April for the Russian River basin,
    which supplies drinking water to more than 600,000
    people in Sonoma and Marin counties15, the second
    in June for the Sacramento-San Joaquin, Klamath and
    Tulare Lake basin16 in the Central Valley, whose irrigated
    agriculture supplies a quarter of the nation’s food17, as
    well as water for more than 7 million people18. The third
    declaration19 came in July, asking for voluntary water
    use reductions of 15%. In June, Colorado has declared
    a state of emergency for 21 western counties due to the
    drought and the state is in its highest drought mitigation

8   NOAA Drought Task Force Report on the 2020–2021 Southwestern U.S. Drought
WHAT CAUSED IT?
WHAT CAUSED IT?
Drought is caused by low precipitation, high
temperatures and its associated vapor pressure
deficits or VPD (Box 2), or a combination of the
two2. The 2020–21 Southwestern U.S. drought
was caused by an unfortunate combination of
variations in climate that led to a sequence of
low precipitation seasons (most likely natural)
beginning in the winter of 2019–20 (Fig. 2a–d), and
by both natural and human-caused warming (Fig.
2e–h). Evidence for both is discussed below.
ON PRECIPITATION
The U.S. Southwest is a large region with diverse precip-
itation drivers and seasons, from crucial snow accumu-
lation in high elevation regions to summer monsoon
rain in the southwest. For simplicity, the region can
be characterized as having two principal precipitation
seasons: one in winter associated with eastward-moving
BOX 2
What is VPD?
Vapor pressure deficit, or VPD, is a quantity that
combines temperature and humidity to indicate the
atmospheric demand of moisture from the land surface
(e.g., soils, streams, rivers, lakes, etc.). VPD is in units
of hectopascals, or hPa, which is a measure of pres-
sure (force per unit area). Here the value represents
the difference in pressure exerted by water vapor in the
ambient air versus the pressure water vapor would exert
if the ambient air were saturated (i.e., if relative humid-
ity brought to 100%). In other words, VPD is an indicator
of the difference between how much water vapor the
atmosphere is capable of holding and how much it actu-
ally holds at any given time. As temperature increases,
atmospheric demand of water increases exponentially.
As such, higher VPD means the atmosphere can extract
more water from the surface, drying it out.
Enhanced VPD can be both a driver and a consequence
of drought. For example, when precipitation is high and
moisture is plentiful, VPD is low (Fig. 4a). In contrast,
when precipitation is low and the air and soil are dry,
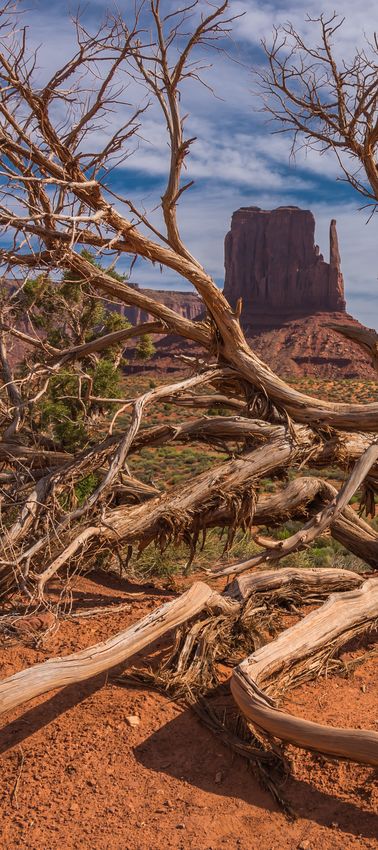
Dying juniper tree in VPD can be high. This can increase temperatures, as
Monument Valley, Arizona. sunlight goes to heating the air rather than evaporating
Credit: John D. Smith water. Other factors, such as the rise in temperatures
caused by increased greenhouse gas concentrations,
can increase VPD regardless of changes in precipitation.
NOAA Drought Task Force Report on the 2020–2021 Southwestern U.S. Drought 9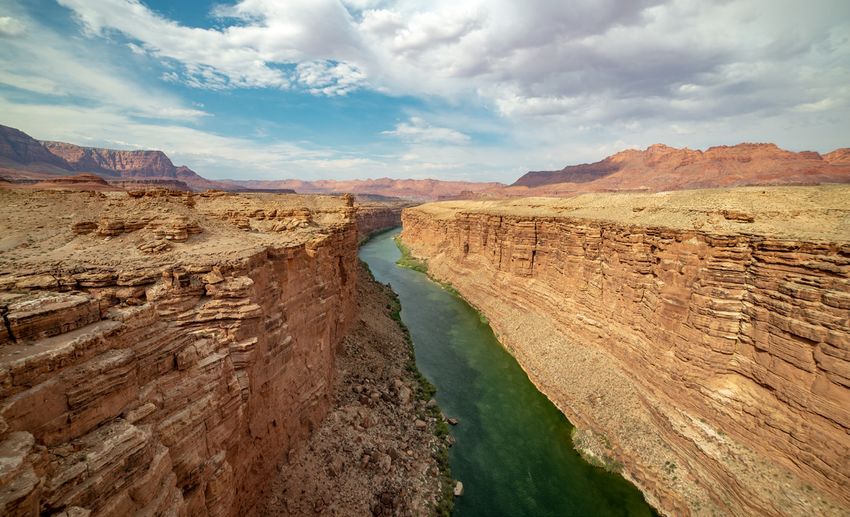
▲ Figure 2: For two subregions, California and Nevada average (top) and Colorado, Utah, Arizona, and New Mexico average (bottom),
     the January 2020–August 2021 observed (black line) and simulated (AMIP, an atmospheric model, CAM6, forced by observed sea surface
     temperatures (teal line); CMIP6, ocean–atmosphere Earth system models (purple line) precipitation (a,b) and vapor pressure defi-
     cit (e,f) anomalies are shown. For each variable and region, the observed monthly anomaly (NCEI NClimGrid for precipitation3, ERA528
     for VPD) is shown in black, the ensemble mean of the forecasts represented by the AMIP (CAM6 simulations) shown in teal, and the
     fully coupled model ensemble mean from CMIP6 shown in purple. Also shown is the total (cumulative) precipitation (c,d) and vapor
     pressure deficit (g,h) for each 20-month period of January through August from 1950 onward, colored by year. For all regions, the
     20-month period of January 2020–August 2021 stands out as the most extreme (see stars). Also shown is the model ensemble distri-
     butions for the total precipitation and vapor pressure deficit from the AMIP and CMIP6 simulations for January 2020–August 2021.

     low pressure systems from the Pacific Ocean that allow                  and August 2021 was only ~68% of the long-term average
     crucial snowpack to accumulate in California, western                   across the entire region, with the 20-month precipitation
     Nevada, Utah, and Colorado, generally between Decem-                    total being the lowest on record (Fig. 2c,d). The causes
     ber and March; and one in summer associated with the                    of these successive low precipitation periods vary by
     North American Monsoon providing rains for Arizona,                     season and are known to varying degrees of scientific
     New Mexico, Colorado, and southern Utah. The initial                    confidence.
     cause of the drought for the majority of the U.S. South-
     west has been successive seasons of very low precip-                    For example, while persistently cool ocean tempera-
     itation, beginning in the winter of 2020 for California                 tures in the tropical Pacific26 likely contributed to some
     and Nevada (Fig. 2a) and lasting up to 2021’s summer                    of the low precipitation in Winter 2021 in California and
     monsoon, which brought much needed rainfall for the                     Nevada (e.g., “AMIP” line in Fig. 2a, see inset Box 3), such
     states of Colorado, Utah, Arizona, and New Mexico                       ocean temperatures do not account for the low precipi-
     (Fig. 2b). The total precipitation between January 2020                 tation in Summer 2020 in any of the six states considered

10   NOAA Drought Task Force Report on the 2020–2021 Southwestern U.S. Drought
(Fig. 2a, b). Moreover, the average across model simula- observed cumulative precipitation for all 20-month peri-
tions in both the AMIP and CMIP6 experiments (Fig. 2a ods since 1895 (colored dots, Fig. 2c,d), which along with
and Box 3) do not reproduce the precipitation deficit the model results suggests that there is not a human-
over the last 20 months. Together, the model results caused precipitation trend (see Box 3). Lastly, while
suggest that random (and likely natural) variations in neither the average across the AMIP or CMIP6 experi-
the atmosphere (i.e., internal atmospheric variability) ments reproduces the precipitation declines over the
led to the sequential seasons of low precipitation. This last 20 months, some individual model simulations for
can be seen in four features of Figure 2. Firstly, the AMIP CMIP6, which contains a larger sample of simulated
simulations (teal lines in Figs. 2a and b) do exhibit lower climate than AMIP, do (as seen in the spread in the box
than average precipitation for some seasons, such as plots presented in Fig. 2c,d). This last piece of evidence
the Winter of 2021, and to a lesser extent, the Winter of suggests that while there is no shared response across
2020, both of which were associated with La Niña events simulations, 20-month precipitation totals as low as
in the tropical Pacific, a known cause of low precipita- observed can be simulated by the models as a result of
tion in the Southwest. However, the AMIP simulations, natural internal variability. As such, the low 20-month
despite being given real-world ocean temperatures, do precipitation totals could have occurred by chance. It
not fully reproduce the low precipitation. This suggests is important to note that there is the potential for vari-
that ocean temperatures were not culpable for all of ous feedbacks between the land and atmosphere to
the precipitation deficit. Secondly, the average across depress precipitation as well. Low snowpack and soil
the CMIP6 simulations also does not reproduce the moisture, for example, can deepen a drought by increas-
observed sequence of low precipitation seasons (purple ing temperatures and providing less moisture to the
lines in Figs. 2a and b). This suggests that there is no one atmosphere for future precipitation27. However, the role
external forcing (e.g., greenhouse gases or aerosol forc- of these kinds of land–atmosphere feedbacks (relative
ing) that can account for the precipitation declines that to natural variations) in sequencing the seasons of low
were observed. Thirdly, there is no temporal trend in the precipitation remains an area of active research and is
BOX 3
The models: “CMIP6” & “AMIP”
Climate models are sophisticated computer programs that simulate the physics, chemistry, and biology of the factors
most relevant to climate in the Earth System, such as the ocean, atmosphere, land, and ice. These models, which are
essentially accounting machines of the budgets of energy, mass, and momentum on our planet are designed and built
by national labs in various countries and/or academic institutions, known as “modeling groups.” To compare the answers
provided by different models, modeling groups perform highly standardized experiments, known as “Model Intercom-
parison Projects” or MIPs.
The CMIP6 (Fig. 2), or 6th Phase of the “Coupled Model Intercomparison Project,” is the overarching project name for all
of the climate model experiments that are endorsed by the World Climate Research Program and have been coordinated
across modeling groups. In this report, CMIP6 refers to standard experiments where each model simulates recent climate
based on known, external factors, and simulates future climate based on projections of such external factors. These external
factors (or forcings) include solar intensity, land use changes, greenhouse gas and aerosol emissions, as well as volcanic
eruptions. As such, the CMIP6 experiments give an indication of how much the models agree that those external factors
are responsible for the observed climate, such as the observed warming over the recent decades or, in the case of the
projections, how changes in these external factors will modify the climate going forward.
The AMIP (Fig. 2), or “Atmospheric Model Intercomparison Project,” is one of the principal experiments under the CMIP6.
It is an experiment in which the atmosphere and land components of the model freely simulate climate in response to
known external forcings and real-world ocean temperatures, rather than ocean temperatures simulated by the model. In
that sense, the AMIP simulations give us an indication of how much the models agree that ocean temperatures specifically
determined what happened in the atmosphere, like sequential seasons of low precipitation over the U.S. Southwest, for
example. In this report, the AMIP results from a model called CESM2-CAM6 are presented.
NOAA Drought Task Force Report on the 2020–2021 Southwestern U.S. Drought 11not something that can be assessed
with the results from Figure 2. While
human-induced global warming
has not been identified as a cause
for the low precipitation itself, the
question remains an active area of
research to identify whether and
how the thermodynamic effects
of both global- and regional-scale
warming to date have shaped the
dynamics of seasonal precipitation
in the region.
ON TEMPERATURE
While precipitation was exception-
ally low in 2020–2021, tempera-
▲ View of the
tures over the same period were Colorado River in While both the direct (low water supply from several
exceptionally warm. These warm Marble Canyon, seasons of low precipitation) and intensifying (high
temperatures caused both a short- Arizona. Credit: water demand from regional warming, high VPD, and
Dominic Gentilcore
ened snow season and the record- melting snowpack) causes of the 2020–21 drought are
high vapor pressure deficit, or VPD, observed over the known (Fig. 2), the drought research community does
20-month period of January 2020 to August 2021 (Fig. not yet know the precise physical mechanisms that led
2e–h and Box 2)3,. While precipitation deficits may have the consecutive precipitation seasons, which initiated
contributed to some of the high temperatures that the drought, to be so exceptionally low. In particular,
occurred in Summer 2020 (Fig. 2e,f), it is clear that addi- it is not clear what mechanisms caused the extremely
tional increases in VPD from human-caused warming dry 2020 summer monsoon. Questions remain about
helped ensure that below-normal precipitation, even the role of potential feedbacks between the land and
if only due to unlucky weather, would make drought overlying atmosphere in suppressing 2020’s summer
more likely. Since VPD is shaped by both temperature rains. Near-record burned areas from wildfire across the
and humidity (see Box 2), the low precipitation totals West were certainly influenced by drought conditions,
in July and August of 2020 lowered humidity further, but there is also the possibility that newly burned land
helping to reinforce the already high VPD from warm surfaces influence conditions to exacerbate drought
temperatures (Fig. 2a, b and Fig. 2e, risk in subsequent seasons29. Fore-
f). At the same time, analysis based The drought was made cast models30 failed to predict the
on weather analogs suggests that low precipitation in Summer 2020,
randomness in the atmosphere
more impactful by though it is unclear whether this
can only account for ~50% of the human-caused warming... prediction failure is due to model
exceptional summer 2020 VPD. deficiencies or instead is attribut-
This result implies that human-caused warming played a able to random (and unpredictable) variations in weather
significant role in the anomalously high VPD over the last and climate. Answering this question likely holds the key
20 months. Reinforcing this finding is the clear tempo- for pinpointing the mechanistic causes of this extraordi-
ral trend in observed cumulative VPD (Fig. 2g,h, colored nary drought and better anticipating its future likelihood
dots with values increasing in time) while a similar trend in a warmer climate. ◆
is not found in precipitation (Fig. 2c,d). This illustrates
that VPD has been increasing with observed warming. As
such, the drought was made more impactful by human-
caused warming, because the warming helped drive the
record high summer 2020 VPD, which deepened and
spread the drought across the region.
12 NOAA Drought Task Force Report on the 2020–2021 Southwestern U.S. DroughtWHEN IS IT GOING TO END?
WHEN IS IT
GOING TO END?
Drought conditions will improve when water
supply from precipitation increases, water demand
from high temperatures decreases, or some combi-
nation thereof occurs. Because the successive
seasons of below-average precipitation appear to
have come from natural, but unfavorable, varia-
tions in the atmosphere and ocean, precipitation
may return to pre-2020 drought levels at some
point after Winter 2021-2022, which is already
forecast to be drier than average for some parts of
the drought-stricken region (Fig. 3a).
Crucially, 2020–21’s record low precipitation has
occurred in the context of increasing (and projected31)
aridification in the U.S. Southwest, which is largely due
to human-caused surface warming (Fig. 1e and Fig. 4),
and is arguably part of a much longer, and exceptional,
multidecadal drought32. These factors, coupled with the
existing deficits in soil moisture, snowpack, and reser-
voir water storage, suggest that this drought will likely
continue well into 2022 for parts of the U.S. Southwest.
Warming reduces snowfall and snow accumulation in
mountain regions, which further reduces streamflow
and soil moisture in spring and summer when plants
and people demand water most. Moreover, if warm-
ing alters the dynamics that give rise to precipitation
(although models on average do not suggest this, Fig. 4),
or if precipitation variability continues to be unfavorable
in the coming seasons (slightly below average precipi-
tation is forecast for Winter 2021–2022 in the southern
portion of the region) (Fig. 3a), the drought could last
considerably longer.
ON PRECIPITATION
Precipitation is highly variable in the U.S. Southwest due
to natural variations in weather and climate, with wet
and dry years and wet and dry decades (Fig. 1d). There
is no evidence based on climate models that green-
Willow Lake near Prescott, house gas forcing has made either 2020’s record low
Arizona, after the much-needed
monsoon rains in late summer precipitation (Fig. 4a), or the precipitation decline over
2021. Credit: Georgeanne Hanna the last several decades, more likely (Fig. 4b)32,33. The
model simulations shown in Figure 4a suggest that a
year like 2020 has about a 2% chance of happening and
NOAA Drought Task Force Report on the 2020–2021 Southwestern U.S. Drought 13▲ Figure 3: Precipitation (a) and temperature (b) forecasts for December 2021 through February 2022 from the North American
Multi-Model Ensemble (NMME) made in September 2021. Colors show the likelihoods of above- or below-average conditions.
that human-caused climate change has not substantially drought will continue. At the same time, above-average
altered this probability. Similarly, the simulations indi- precipitation could mean drought relief for some regions,
cate that a decade with precipitation as low as 2011– such as northern California and parts of Utah and Colo-
2020 has about a 5–6% chance of occurring and, again, rado. For example, a wet spring and early summer in
climate change has not substantially altered this prob- 2021 has brought some drought relief to eastern Colo-
ability. Instead, these extreme and unlucky variations rado. Similarly, Arizona had its rapidly emerging wild-
in precipitation appear to be driven by random varia- fire season dampened by a wet summer monsoon in
tions in the atmosphere and short- 2021. It remains, however, that
and long-term variations in ocean Precipitation is highly regional precipitation changes for
temperatures. While 2020 and the coming decades are uncer-
2011–2020 precipitation deficits
variable in the U.S. tain35 (see the broadening x-axis
have been extreme and rare, both Southwest due to natural extent of the contours in Fig. 4).
values are statistically consistent variations in weather and However, there is modest consen-
with the 120-year observational climate, with wet and dry sus that California winters may be
record. The long-term decline in slightly wetter36, but punctuated by
precipitation between the 1980s years and wet and dry warmer and drier Fall and Springs,
and 2010s has been attributed decades. along with larger swings between
in part to a decades-long shift to very wet and very dry years37.
cooler ocean temperatures in the eastern Pacific along
the North American coast and a warm shift in Atlantic ON TEMPERATURE
Ocean temperatures over the same period. For that Regional warming trends driven by global warming will
reason, the La Niña event (cold tropical eastern Pacific continue to increase the evaporation of water from the
Ocean temperatures) forecast to form this coming land and melt mid- and high-elevation snowpack earlier
Winter34 increases the likelihood of below-average in the year, or prevent it from accumulating in the first
precipitation in Winter 2021–2022. The seasonal forecast place. In a given year, atmospheric demand for mois-
shown in Figure 3a suggests a small chance of precipita- ture, as measured by VPD, tends to be highest when
tion being below average. This forecast, along with the precipitation is lowest (e.g., Fig 4a, teal dots). As such,
forecasted warm temperatures (Fig. 3b) implies that the wet years are both cooler and have higher atmospheric
14 NOAA Drought Task Force Report on the 2020–2021 Southwestern U.S. Drought5
(a) Annual means 5
(b) Decadal means
2020
P(VPD > 2020) = P(VPD > 2011-2020) = 2010
11.7%, 2030-2050 58.1%, 2030-2050
0.4%, 2010-2030 7.2%, 2010-2030
2010 4 0.0%, 1950-2000 4 0.0%, 1950-2000
2000
2020
Dots: Observed annual means
3 3
Vapor pressure deficit (hPa)
Vapor pressure deficit (hPa)
2000
Dots: Observed 10y means
1990
Start year of 10y mean
1990 2 2
2030-2050 2011-2020
Year
2030-2050 1980
1980 1 1
2010-2030
1970
1970 0 0
2010-2030 1950-2000
1960
1960 -1 P(PR < 2020) = -1 P(PR < 2011-2020) =
2.7%, 2030-2050 8.5%, 2030-2050
1.7%, 2010-2030 1950-2000 5.2%, 2010-2030
2.0%, 1950-2000 6.0%, 1950-2000
1950 -2 -2 1950
-1 -0.5 0 0.5 1 -0.5 -0.25 0 0.25 0.5
Precipitation (mm/day) Precipitation (mm/day)
Contours: Modelled joint probability of VPD and precip from three time periods
▲ Figure 4: Observed and modeled precipitation (x-axis) and vapor pressure deficit, VPD (y-axis) anomalies relative to the 1950–2000
mean, averaged over the 6 states in the U.S. Southwest. Panel (a) shows annual means and (b) shows decadal (10-year running)
means. Dots show the values from each year or decade from observation-based data color-coded by year. The contours show the joint
probability of precipitation and VPD for three different time periods (1950–2000, 2010–2030 and 2030–2050) from the CMIP6 climate
model experiments. The contours indicate the relative probability of the models simulating that joint precipitation-VPD value in the time
period considered, with darker contours representing higher likelihoods, and the white regions outside of the contours representing
a small, but non-zero probability. Observed VPD has increased over time while precipitation has not exhibited a systematic long-term
trend; both of these trends align with the model projections. Furthermore the 2030–2050 contours suggest that this trend toward
increasing VPD will continue. The probabilities quoted in each panel reflect the model-based probability of a year or decade with as high
VPD (top right) or low precipitation (bottom left) as 2020 or 2011–2020 occurring in the different time periods. Note that the probability
of 0.0% refers to a probability of less than 1 in 1980 years (the total number of years of simulation considered for the 1950–2000 period).
Observed VPD comes from ERA528; observed precipitation comes from NCEI NClimGrid3; model data comes from 33 different Earth System
Models that contributed to CMIP6 and were forced with the SSP5-8.5 scenario after 2014, which assumes no climate mitigation.
water vapor content, which leads to lower values of VPD. only end if human-caused greenhouse gas emissions
At the same time that precipitation influences VPD, so are reduced and regional warming trends are reversed.
too does temperature. Longer-term trends in VPD due That said, it is notable that even in the presence of the
to regional warming can be seen in observed warming trend, 2020 as
the temporal increase in VPD (from Longer-term increases an individual year was extreme (Fig.
the teal values common in the 4a), as low precipitation and high
1950s, to orange values common
in VPD and greater temperatures created conditions
in the 2010s in Figs. 4a,b). This rise aridification of the U.S. for extremely high annual-scale
in VPD is consistent with expec- Southwest will not end VPD. Moreover, a comparison of
tations based on climate models without curbing green- the observations with the model
(compare colored dots from obser- projections suggests that both the
vations with contours from models house gas emissions. annual- and decadal-scale VPD
in Fig. 4) and from these models values associated with the South-
such VPD increases can be attributed to rising surface western U.S. drought were exceptionally unlikely in a
and atmospheric temperatures, which are driven primar- pre-2000 climate (Fig. 4a,b, blue contours). For exam-
ily by rising atmospheric greenhouse gas concentra- ple, not one year or decade of a pre-2000 climate simu-
tions. Therefore, the increasing atmospheric demand lated by the models had VPD values as high as those
for water from the land (as measured by VPD, Fig. 4) will observed in 2020 or 2011–2020 (almost 2,000 years
NOAA Drought Task Force Report on the 2020–2021 Southwestern U.S. Drought 15of simulated climate contribute to this analysis). The
models also indicate that drought intensifying VPD
trends will continue with human-caused warming. By
2030 and with no climate mitigation, more than 1 in 10
years will have VPD values as high as 2020 (Fig. 4a) and by
2030–2050, a decade with VPD as high as we have seen
in the last decade (2011–2020) will be the norm (Fig. 4b).
The magnitude and intensity of severe droughts in the
region are projected to increase with greenhouse gas
emissions38. As such, longer-term increases in VPD and
greater aridification of the U.S. Southwest will not end
without curbing greenhouse gas emissions.
Taken together, even if higher annual precipitation totals
occur in coming years, it will take several seasons (and
potentially years) of above-average precipitation to
replenish the reservoirs, rivers, streams, and soil mois-
ture that 60+ million people depend on for their water,
livelihoods, food, power, and recreation. This, when
coupled with the La Niña forecast for the coming winter,
suggests the ongoing Southwestern U.S. drought will
very likely last well into 2022, and potentially beyond. In
the longer-term, the atmospheric demands on regional
land surface moisture will continue to increase due
to rapidly increasing VPD from human-caused global
warming. Such growing demands mean a more arid
U.S. Southwest and greater sensitivity to droughts in
the future. While 2020–21 was an exceptional period
of low precipitation, the drought that has emerged is a
harbinger of a future that the U.S. Southwest must take
steps to manage now. ◆
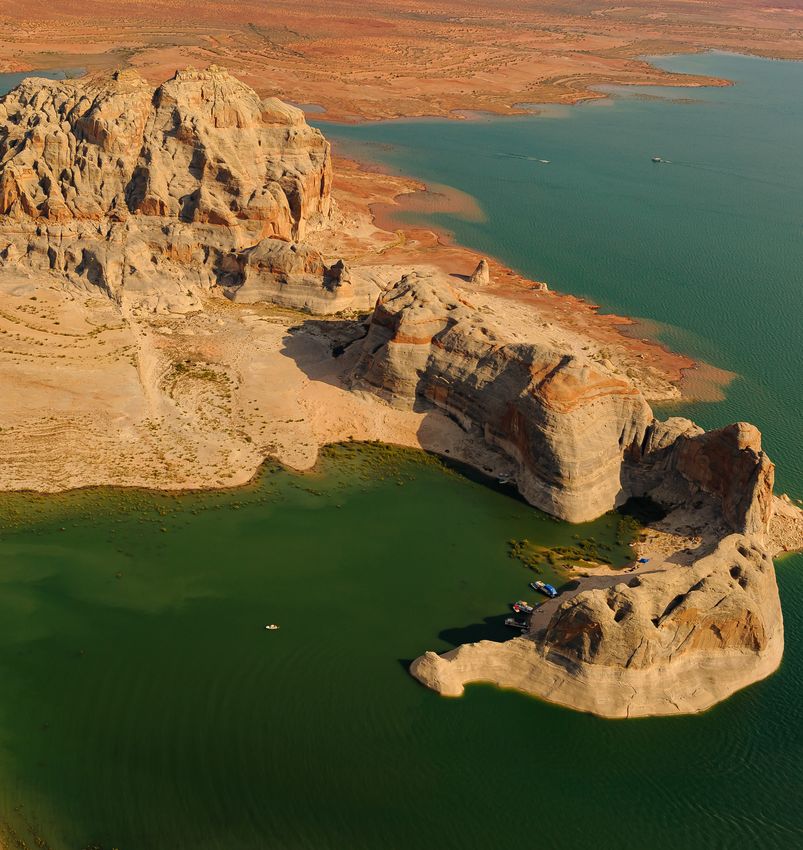
Aerial view of Lake Powell
in Arizona. Credit: Tsuchi
16 NOAA Drought Task Force Report on the 2020–2021 Southwestern U.S. DroughtOUTSTANDING QUESTIONS
TO BE ANSWERED
The National Oceanic and Atmospheric Administration (NOAA) Drought
Task Force, under the aegis of NOAA’s Modeling Analysis Predictions and
Projections (MAPP) program with support from the National Integrated
Drought Information System (NIDIS), is well positioned to address the many
science questions that remain about the origins of this exceptional drought
and what it implies about the future of water availability for the rapidly
growing and economically crucial U.S. Southwest.
Members of the Task Force are actively researching these questions, including:
• What accounts for the forecast errors in seasonal precipitation and
temperature in Summer 2020 and other seasons?
• Has warming affected the dynamics or circulation that controls regional and
seasonal precipitation, such as through land–atmosphere feedbacks?
• What was more important in accounting for the severity of this drought, the
exceptionally low precipitation or the exceptionally warm temperatures?
• What impact will the forecast 2021–22 La Niña have on precipitation and
temperature and, more generally, how are natural modes of seasonal to
decadal climate variability impacting Southwest U.S. climate?
• What effect will precipitation in Winter 2022 have on the water resources in
2022 over the Southwest?
• How will drought monitoring and management change in the presence of
Southwestern U.S. aridification?
• How do warming effects on snowpack influence water availability in the Spring
and Summer?
• What are the major sources of uncertainty in regional and seasonal
precipitation trends in the U.S. Southwest, and how can they be constrained for
more certain projections?
NOAA Drought Task Force Report on the 2020–2021 Southwestern U.S. Drought 17REFERENCES
1 US Bureau of Reclamation. Draft Annual Operating Plan
for Colorado River Reservoirs 2022. https://www.usbr.gov/lc/
region/g4000/AOP2022/2022AOP_2021-05-27_Consultation-1.
pdf (2021).
2 Hoerling, Martin & et al. Temperature and Drought: A
science assessment by a subgroup of the drought task force.
https://cpo.noaa.gov/Portals/0/Docs/MAPP/Reports/2018/
TemperatureDrought/Drought_TF_Temp_Drought_Final_
Revised.pdf?ver=2018-07-31-104948-243 (2018).
3 Vose, R. S. et al. Improved Historical Temperature and
Precipitation Time Series for U.S. Climate Divisions. J. Appl.
Meteorol. Climatol. 53, 1232–1251 (2014).
▲ Xeriscaping. Credit: Chansom Pantip
4 National Drought Mitigation Center. United States Drought
Monitor (USDM). https://droughtmonitor.unl.edu/Data.aspx.
5 National Interagency Fire Center. National Fire News. https://
What is the Drought Task Force? www.nifc.gov/fire-information/nfn.
The NOAA Drought Task Force aims to advance drought 6 United States Department of Agriculture. Natural Resources
monitoring and prediction for North America. The Task Conservation Service National Water and Climate Center.
Force is an initiative of NOAA’s MAPP program. The Task Reservoir Storage https://www.nrcs.usda.gov/wps/portal/wcc/
Force’s research results are expected to help advance home/waterSupply/reservoirStorage/.
basic understanding of drought mechanisms, official
national drought products, the development of early 7 United States Bureau of Reclamation. Colorado River
warning systems by the National Integrated Drought Basin Water Supply and Demand Study, Executive Summary.
Information System (NIDIS), and experimental drought 34 https://www.usbr.gov/watersmart/bsp/docs/finalreport/
monitoring and prediction activities and tools for oper- ColoradoRiver/CRBS_Executive_Summary_FINAL.pdf.
ational and service purposes as part of the National
Centers for Environmental Prediction’s (NCEP) Climate 8 Thiel, Aaron. Climate Change Impacts on Hydropower in the
Test Bed. The Task Force coordinates with other relevant Colorado River Basin. https://uwm.edu/centerforwaterpolicy/
national and international efforts including the emerg- wp-content/uploads/sites/170/2013/10/Colorado_Energy_Final.
ing National Multi-Model Ensemble (NMME) capabilities pdf.
and the international effort to develop a Global Drought 9 Blunt, Katherine & Carlton, Jim. West Risks Blackouts as
Information System (GDIS). Drought Reduces Hydroelectric Power. The Wall Street Journal
(2021).
10 National Park Service. National Park Service Glen Canyon
What is MAPP? Changing Lake Levels. https://www.nps.gov/glca/learn/chang-
ing-lake-levels.htm.
The Modeling Analysis Predictions and Projections
(MAPP) Program’s mission is to enhance the Nation’s 11 NOAA National Centers for Environmental Information
and NOAA’s capability to understand, predict, and proj- (NCEI). U.S. Billion-Dollar Weather and Climate Disasters.
ect variability and changes in Earth’s climate system. https://www.ncdc.noaa.gov/billions/time-series/UT (2021).
MAPP’s work directly impacts or provides foundational
capability for improving understanding and assessing 12 The Navajo Nation. Navajo Nation Commission on
impacts for decision making. It also aims to improve Emergency Management reaffirms drought declaration
NOAA products used in mitigation and adaptation. By state of emergency to activate additional resources. https://
supporting these goals, the MAPP program plays a www.opvp.navajo-nsn.gov/Portals/0/Files/PRESS%20
crucial role in enabling the Nation to meet the societal RELEASES/2021/Jun/FOR%20IMMEDIATE%20RELEASE%20-%20
challenges created by the impacts of climate variabil- Navajo%20Nation%20Commission%20on%20Emergency%20
ity such as year-to-year changes in the occurrence of Management%20reaffirms%20drought%20declaration%20
extremes or droughts and longer term climate changes. state%20of%20emergency%20to%20activate%20addi-
cpo.noaa.gov/MAPP tional%20resources_CEM%20210625.pdf (2021).
18 NOAA Drought Task Force Report on the 2020–2021 Southwestern U.S. Drought13 The State of Nevada. Declaration of Emergency for the Caldor Colorado River Flow. JAWRA J. Am. Water Resour. Assoc. 43,
Fire. https://gov.nv.gov/News/Emergency_Orders/2021/2021-08- 183–192 (2007).
30_-_Declaration_of_Emergency_for_the_Caldor_Fire/ (2021).
27 Tawfik, A. B. & Steiner, A. L. The role of soil ice in land-at-
14 The State of Arizona. Drought Emergency Declaration PCA mosphere coupling over the United States: A soil moisture–
99006. https://new.azwater.gov/drought/resource/drought-dec- precipitation winter feedback mechanism. J. Geophys. Res.
larations-arizona (1999). 116, D02113 (2011).
15 The State of California. State of Emergency Proclamation 28 Muñoz Sabater, J. ERA5-Land data. Copernic. Clim. Change
for the Russian River and Klamath Basins. https://www.gov. Serv. C3S Clim. Data Store CDS (2019) doi:10.24381/cds.
ca.gov/wp-content/uploads/2021/04/4.21.21-Drought-Procla- e2161bac.
mation.pdf (2021).
29 Fu, R., A. Hoell, J. Mankin, A. Sheffield, and I. Simpson.
16 The State of California. State of Emergency Proclamation Tackling challenges of a drier, hotter, more fire-prone future.
for the Klamath River, Sacramento-San Joaquin Delta, and Eos, Transactions American Geophysical Union (2021).
Tulare Lake Watersheds. https://www.gov.ca.gov/wp-content/
uploads/2021/05/5.10.2021-Drought-Proclamation.pdf (2021). 30 National Weather Service Climate Prediction Center.
NMME Forecasts of Monthly Climate Anomalies for May 2020
17 United States Geological Survey. California Water Science - November 2020. https://www.cpc.ncep.noaa.gov/products/
Center, California’s Central Valley. https://ca.water.usgs.gov/ NMME/archive/2020040800/seasanom.shtml (2020).
projects/central-valley/about-central-valley.html.
31 Seager, R. et al. Model Projections of an Imminent Transition
18 United States Bureau of Reclamation. Sacramento- to a More Arid Climate in Southwestern North America. Science
San Joaquin Rivers Basin Study. https://www.usbr.gov/ 316, 1181–1184 (2007).
watersmart/bsp/docs/fy2012/FactSheet-Sacramento-
SanJoaquinRiversBasinStudy.pdf (2012). 32 Williams, A. P. et al. Large contribution from anthropo-
genic warming to an emerging North American megadrought.
19 The State of California. State of Emergency Proclamation for Science 368, 314–318 (2020).
Nine Additional Counties. https://www.gov.ca.gov/wp-content/
uploads/2021/07/7.8.21-Conservation-EO-N-10-21.pdf (2021). 33 Lehner, F., Deser, C., Simpson, I. R. & Terray, L. Attributing
the U.S. Southwest’s Recent Shift Into Drier Conditions.
20 The State of Colorado. State of Emergency Proclamation Geophys. Res. Lett. 45, 6251–6261 (2018).
for 21 Counties. https://dnrweblink.state.co.us/cwcbsearch/0/
edoc/214784/Drought%20Emergency%20(4).pdf?sear- 34 International Research Institute for Climate & Society. CPC/
chid=e77952dd-ecaf-4c70-8962-f1ee8ff2fd5a (2021). IRI Official Probabilistic ENSO Forecast. https://iri.columbia.
edu/our-expertise/climate/forecasts/enso/current/?enso_
21 Southern Nevada Water Authority. Restricting outdoor tab=enso-cpc_plume (2021).
water use. https://www.snwa.com/importance-of-conservation/
restricting-outdoor-water-use/index.html#useless. 35 Seager, R. et al. Dynamical and Thermodynamical Causes
of Large-Scale Changes in the Hydrological Cycle over North
22 The State of New Mexico. Drought Declaration Executive America in Response to Global Warming. J. Clim. 27, 7921–7948
Order 2020-084. https://www.governor.state.nm.us/wp-con- (2014).
tent/uploads/2020/12/Executive-Order-2020-084.pdf (2020).
36 Neelin, J. D., Langenbrunner, B., Meyerson, J. E., Hall, A. &
23 The State of Utah. State of Emergency Declaration Berg, N. California Winter Precipitation Change under Global
Executive Order 2021-7. https://governor.utah.gov/2021/03/17/ Warming in the Coupled Model Intercomparison Project Phase
gov-cox-issues-drought-executive-order/ (2021). 5 Ensemble. J. Clim. 26, 6238–6256 (2013).
24 Rice, Matt. We Are Rivers: Colorado River Compact Call 37 Swain, D. L., Langenbrunner, B., Neelin, J. D. & Hall, A.
Part 1—What Could A Call Mean. (2019). Increasing precipitation volatility in twenty-first-century
California. Nat. Clim. Change 8, 427–433 (2018).
25 United States Bureau of Reclamation. Agreement
Concerning Colorado River Drought Contingency Management 38 Cook, B. I. et al. Uncertainties, Limits, and Benefits of
and Operations. https://www.usbr.gov/dcp/docs/final/ Climate Change Mitigation for Soil Moisture Drought in
Companion-Agreement-Final.pdf (2019). Southwestern North America. Earth's Future 9, e2021EF002014
(2021).
26 McCabe, G. J., Betancourt, J. L. & Hidalgo, H. G. Associations
of Decadal to Multidecadal Sea-Surface Temperature Variability
with Upper Colorado River Flow1: Associations of Decadal to
Multidecadal Sea-Surface Temperature Variability With Upper
NOAA Drought Task Force Report on the 2020–2021 Southwestern U.S. Drought 19www.drought.gov cpo.noaa.gov/mapp Have questions about the report? Please contact: Justin Mankin | justin.s.mankin@dartmouth.edu Andrew Hoell | andrew.hoell@noaa.gov Isla Simpson | islas@ucar.edu
You can also read