Global climatology and trends in convective environments from ERA5 and rawinsonde data
←
→
Page content transcription
If your browser does not render page correctly, please read the page content below
www.nature.com/npjclimatsci

                  ARTICLE                 OPEN

                  Global climatology and trends in convective environments
                  from ERA5 and rawinsonde data
                                           1,2,3 ✉
                  Mateusz Taszarek                   , John T. Allen4, Mattia Marchio5,6 and Harold E. Brooks2,7

                     Globally, thunderstorms are responsible for a significant fraction of rainfall, and in the mid-latitudes often produce extreme
                     weather, including large hail, tornadoes and damaging winds. Despite this importance, how the global frequency of thunderstorms
                     and their accompanying hazards has changed over the past 4 decades remains unclear. Large-scale diagnostics applied to global
                     climate models have suggested that the frequency of thunderstorms and their intensity is likely to increase in the future. Here, we
                     show that according to ERA5 convective available potential energy (CAPE) and convective precipitation (CP) have decreased over
                     the tropics and subtropics with simultaneous increases in 0–6 km wind shear (BS06). Conversely, rawinsonde observations paint a
                     different picture across the mid-latitudes with increasing CAPE and significant decreases to BS06. Differing trends and
                     disagreement between ERA5 and rawinsondes observed over some regions suggest that results should be interpreted with caution,
                     especially for CAPE and CP across tropics where uncertainty is the highest and reliable long-term rawinsonde observations are
                     missing.
                     npj Climate and Atmospheric Science (2021)4:35 ; https://doi.org/10.1038/s41612-021-00190-x
1234567890():,;

                  INTRODUCTION                                                                            (~15%) to lightning flash rate under global warming or mixed
                  Globally, thunderstorms present a significant hazard to commu-                           trends32,33, particularly in the tropics29,34.
                  nities, agriculture, and infrastructure. Recent analysis of the direct                     This uncertainty raises the question of what changes have
                  economic losses as a result of convective events suggests that                          occurred historically for favorable convective environments
                  over Europe and North America altogether, around 300 billion                            globally, and how do these compare to future expectations. The
                  USD in damage has been reported over the last decade1.                                  availability of recently released global ERA5 reanalysis with hourly
                                                                                                          resolution and horizontal spacing sufficient to sample local scale
                  Thunderstorms produce a variety of hazards that lead to fatalities,
                                                                                                          convective environments, allows construction of a global clima-
                  including heavy precipitation with flash flooding2, lightning3, large
                                                                                                          tology and analysis of corresponding trends in the way that was
                  hail4, damaging winds5 and tornadoes6. As direct observations of
                                                                                                          not possible with prior reanalyses35,36. However, as each reanalysis
                  many of these phenomena are sparse, a typical approach has                              features certain limitations related to model formulation, applied
                  been to identify key ingredients necessary to their formation7, and                     parameterizations and assimilation techniques, a validation using
                  use them as a proxy for assessing climatological frequency and                          observed sounding profiles is necessary37–39. Thus, results based
                  intensity of severe convective storms, a technique well validated                       on reanalyses should be always interpreted with caution,
                  by observations8–10. A proxy of convective available potential                          especially concerning thermodynamic instability and modeled
                  energy (CAPE) is often considered, as it provides an approximation
                                                                         pffiffiffiffiffiffiffiffiffiffiffiffiffiffiffiffiffi               precipitation where systematic errors are present39,40.
                  to the theoretical maximum updraft speed (w ¼ 2 ´ CAPE ) in
                  convective clouds11,12. The severity and longevity of thunder-
                  storms can be then characterized by the environmental wind                              RESULTS
                  shear that governs storm organization13–15. Finally, to better                          Convective available potential energy
                  anticipate the likelihood of storms initiating in a favorable
                                                                                                          The climatological distribution of CAPE strongly reflects the
                  environment, proxies such as modeled convective precipitation                           availability of low-level moisture. Enhanced CAPE is observed
                  are also considered10,16,17.                                                            over tropical and subtropical zones, excluding the high-pressure
                     Thunderstorm frequency and intensity has been shown to be                            areas over the oceans and subtropical deserts (Fig. 1a). The 95th
                  changing regionally over recent decades18–22. However, how this                         percentile (P95) of the CAPE distribution exceeds 5000 J kg−1 over
                  translates globally is unclear as many of these changes are linked                      the warm waters surrounding the Arabian Peninsula (Red Sea,
                  to complex regional circulation features. Our current under-                            Persian Gulf) and eastern coast of India. Over land, the highest
                  standing of future changes in convective environments induced                           CAPE is typically observed over Congo Basin (P95 of around
                  by a globally warming climate is that large increases to low-level                      3000 J kg−1).
                  moisture (and thus CAPE) will result in the atmosphere being                               Trend analysis of P95 CAPE over the last 4 decades indicates
                  more conducive for severe thunderstorms23–27 and heavy                                  significant decreases across tropical and subtropical zones, with
                  precipitation28–31. However, these projections have large uncer-                        changes of as much as −200 J kg−1 (~5–10%) per decade (Fig. 1a),
                  tainty with more recent studies indicating significant decreases                         that also contribute to significant reductions in the frequency of

                  1
                   Cooperative Institute for Mesoscale Meteorological Studies, University of Oklahoma, Norman, OK, USA. 2National Severe Storms Laboratory, Norman, OK, USA. 3Department of
                  Meteorology and Climatology, Adam Mickiewicz University, Poznań, Poland. 4Department of Earth and Atmospheric Sciences, Central Michigan University, Mount Pleasant, MI,
                  USA. 5Atmospheric Physics Group, Department of Civil, Environmental and Mechanical Engineering - DICAM, University of Trento, Trento, Italy. 6C3A – Center Agriculture Food
                  Environment, University of Trento, San Michele all’Adige, Trento, Italy. 7School of Meteorology, University of Oklahoma, Norman, OK, USA. ✉email: mateusz.taszarek@noaa.gov

                  Published in partnership with CECCR at King Abdulaziz University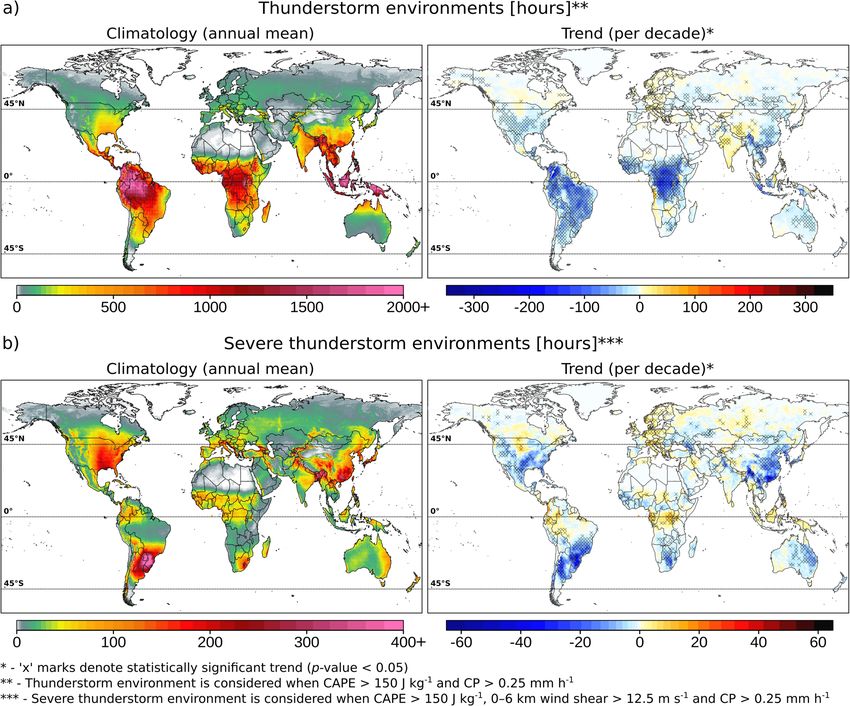
M. Taszarek et al.
                  2
1234567890():,;

                      Fig. 1 ERA5 climatology and trends for CAPE, convective precipitation and vertical wind shear. A 41-year (1979–2019) climatology and
                      trends for the (a) 95th percentile of convective available potential energy (CAPE), (b) accumulated convective precipitation, and (c) 50th
                      percentile of 0–6 km vertical wind shear. Climatology is constructed by taking a mean from annual values, and trends are computed using
                      Sen’s slope (values denote change per decade). Statistically significant trends (p-value < 0.05) are marked with ‘x’ symbols.

                      favorable thunderstorm environments (Fig. 2a). In contrast, robust     are more modest and observed only over northwestern India, the
                      increases of up to +400 J kg−1 (~5–15%) per decade are seen over       northern Great Plains of the United States, and the majority of
                      temperate zones near inland seas and warm ocean surfaces,              Europe.
                      including the Mediterranean, Black Sea, Caspian Sea, Red Sea, in          Seasonally (Supplementary Fig. 1), negative trends in P95 CAPE
                      addition to the South China Sea, Persian Gulf and Gulf of Mexico.      follow the axis of Intertropical Convergence Zone (ITCZ),
                      However, despite these increases over water, land-based changes        corresponding to decreases during peak heating in the respective

                      npj Climate and Atmospheric Science (2021) 35                                 Published in partnership with CECCR at King Abdulaziz University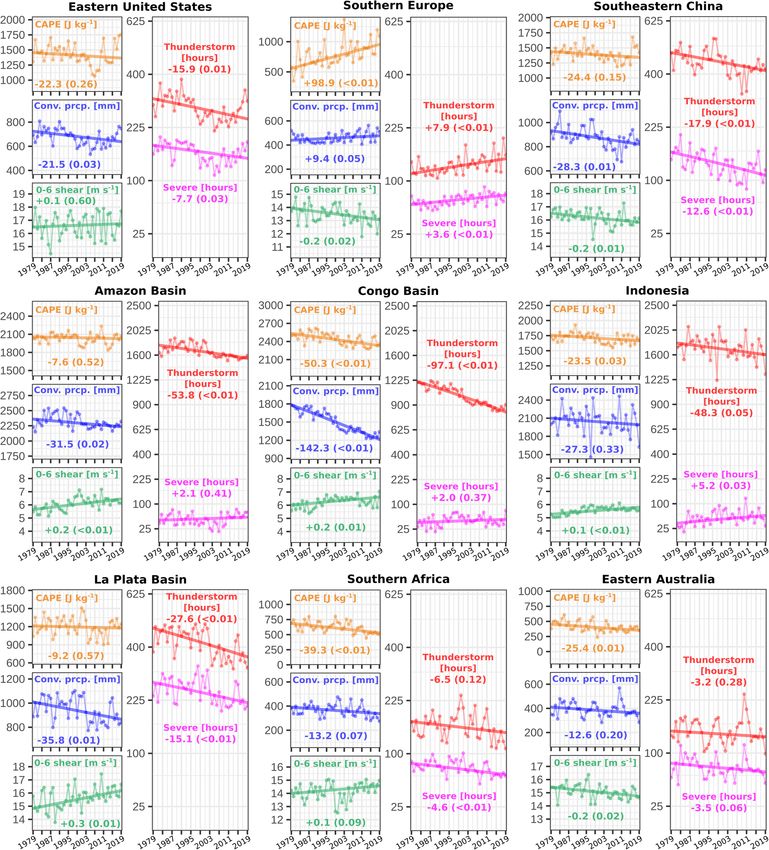
M. Taszarek et al.
3
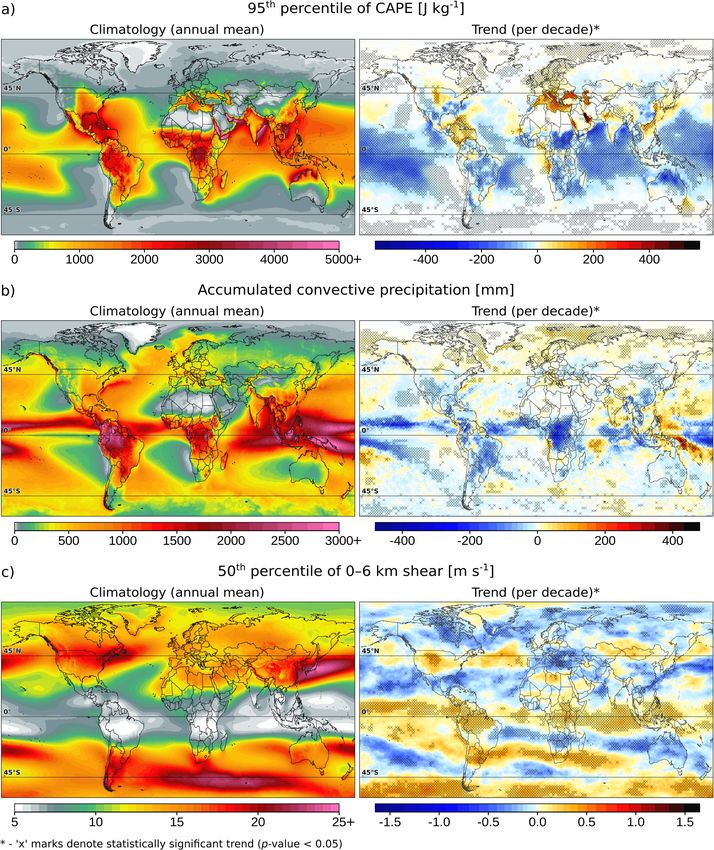
Fig. 2 ERA5 climatology and trends for thunderstorm and severe thunderstorm environments. As in Fig. 1 but with the application of a
land-surface mask and showing the combined frequency proxy of (a) thunderstorm environments, and (b) severe thunderstorm
environments.
hemispheric summers: JJA (June, July, August) over the north, and frequency of initiation does not increase as well44,45. For this
DJF (December, January, February) over the south. The largest reason, we also consider changes in ERA5 modeled convective
decreases in P95 CAPE of −200 J kg−1 (~10%) per decade are precipitation (CP) that serve as a proxy for convective initiation.
observed over the eastern Sahel region during MAM (March, April, The climatological distribution of CP (Fig. 1b) is generally similar
May), and northern Australia during DJF (Supplementary Fig. 1). to CAPE (Fig. 1a), with the highest CP accumulations (> 1500 mm
These trends may represent the ongoing desertification in the per year) observed along the ITCZ and following its seasonal
former, and the weakness of the monsoon circulation in the meridional shifts during JJA and DJF (Supplementary Fig. 2).
latter41. Drying in the Northern Hemisphere subtropics and tropics Despite low CAPE, CP accumulations exceeding 400 mm per year
have been also observed with decreasing trends in precipitation in occur over the far northern Atlantic and Europe, driven primarily
20th century by Zhang et al.42. Increases in P95 CAPE over the by the warm waters of the Gulf Stream. Similar enhancement in CP
inland seas, Gulf of Mexico, the northern Great Plains of the United is also observed within Kuroshiro, Agulhas, Brazilian and eastern
States, Europe, Persian Gulf, and eastern Asian coast are the Australian warm currents, and all cyclonically active regions in the
highest during JJA and over oceans persist into SON (September, mid-latitudes. Lower CP accumulations are observed within cold
October, November). currents and regions of subtropical subsidence that inhibit
convective development (e.g. South Atlantic High).
Analysis of trends in CP suggest consistent weakening of
Convective precipitation convective activity within the ITCZ, with decreases in CP accumula-
Although CAPE provides insight into whether the atmosphere has tions on the order of −150 mm (~5–10%) per decade (Fig. 1b). An
the potential to produce deep moist convection, convective exception is the western Pacific Ocean, where local increases are
initiation is necessary for the thunderstorm to occur. This problem observed, contrasting consistent decreases in CAPE (Fig. 1a), which
is highlighted over locations such as southern Texas or the may be linked to strong inter-annual climate variability in response to
western Mediterranean Sea where high CAPE rarely results in trans-Pacific El Niño and La Niña circulation effects46. Robust
convective development due to considerable inhibition35,43. decreases are also observed over the majority of Amazonian South
Increases in CAPE, therefore, mean little for thunderstorms if the America, the southwestern United States, Congo Basin, southeastern
Published in partnership with CECCR at King Abdulaziz University npj Climate and Atmospheric Science (2021) 35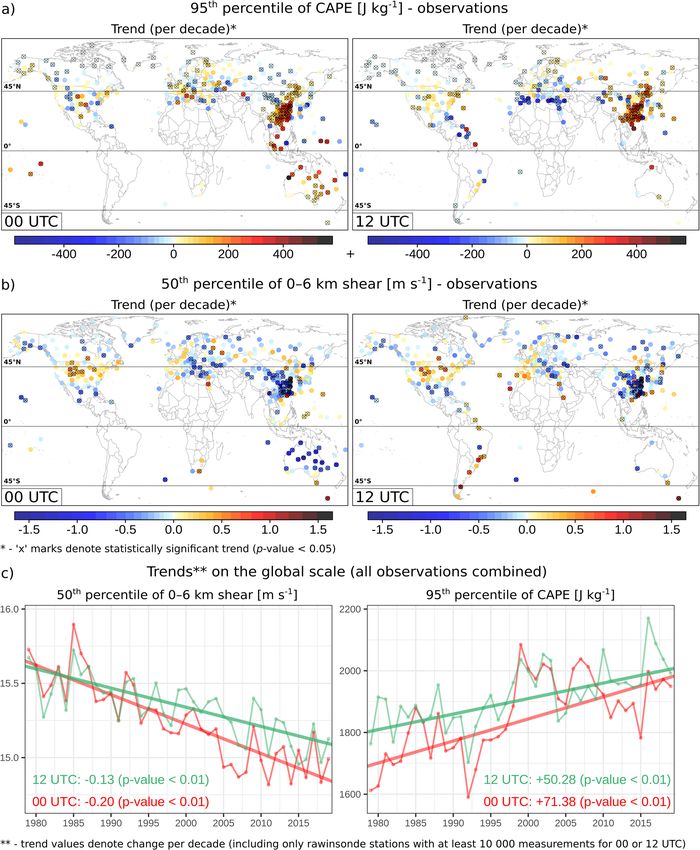
M. Taszarek et al.
4

    Fig. 3 ERA5 regional trends for CAPE, convective precipitation, vertical wind shear, thunderstorm, and severe thunderstorm
    environments. A 41-year (1979–2019) annual distribution of the (orange) 95th percentile of convective available potential energy (CAPE),
    (blue) accumulated convective precipitation, (green) 50th percentile of 0–6 km vertical wind shear, (red) frequency of thunderstorm
    environments, and (magenta) frequency of severe thunderstorm environments for specific regions (areal mean) as indicated on
    Supplementary Fig. 6. Trends are computed using Sen’s slope and indicated as a solid line. Numbers within linear plots indicate trend per
    decade and p-value.

    Asia, and eastern Australia (Figs. 1b and 3). Few areas exhibit          exception of southeastern Asia that experience increases during DJF,
    significant increases and these are mostly modest, predominantly          but decreases in SON (Supplementary Fig. 2). Trends in CP should be
    over the Indian subcontinent, western China, parts of southern and       interpreted with caution (especially over the tropics) as reanalysis
    northern Europe, Siberia and Arctic Ocean. Over the latter two, these    datasets are prone to systematic errors in this metric40. Our results
    small increases are likely driven by increasing surface temperatures     only partially overlap with prior studies that suggested decreases in
    and moisture over the Northern Hemisphere high-latitude regions,         parts of tropical and subtropical areas over Northern Hemisphere42,48,
    promoting increasingly frequent shallow convective activity47.           with others indicating increases in the most extreme events or mixed
    Seasonal trends follow the annual accumulation patterns, with the        trends49,50.

    npj Climate and Atmospheric Science (2021) 35                                   Published in partnership with CECCR at King Abdulaziz University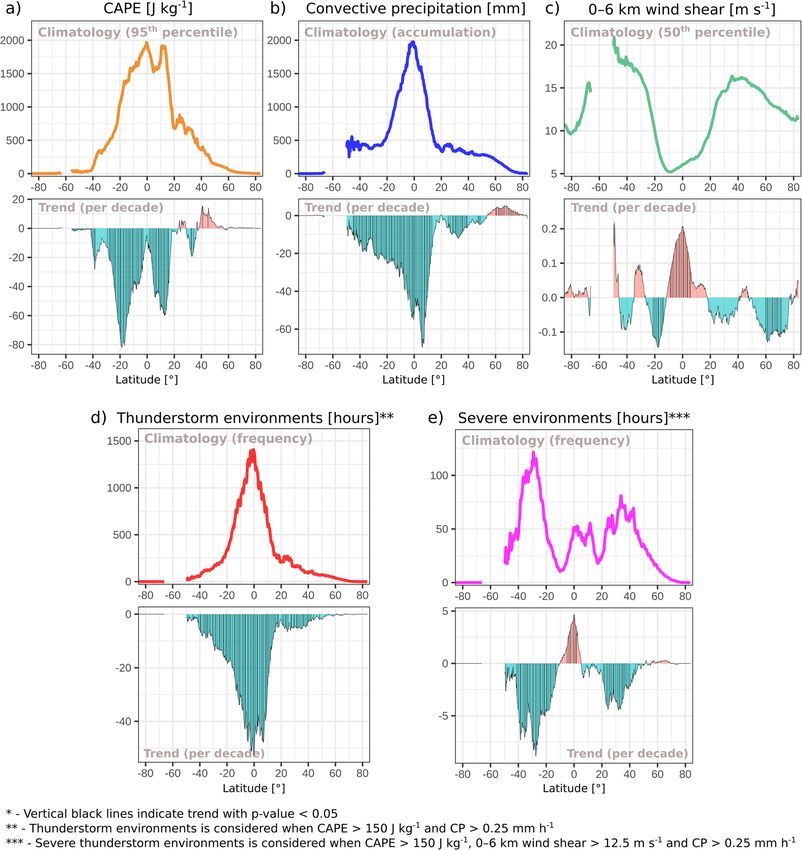
M. Taszarek et al.
                                                                                                                                             5
Vertical wind shear                                                    a few hours per decade in summer over Europe, India, and
Thunderstorm severity is governed by storm organization, a process     western China (Supplementary Fig. 4).
primarily driven by environmental vertical wind shear13–15. A number      Severe thunderstorm environments are more closely tied to the
of studies have confirmed that wind shear between the surface and       location of jet streams where strong vertical wind shear is
6 km above ground level (BS06) combined with CAPE has value in         available (Fig. 2b). This shifts the peak frequency of severe
discriminating between severe and non-severe thunderstorms8–10.        thunderstorms away from the tropics towards mid-latitudes,
Sufficient BS06 of at least 15 m s−1 promotes long-lived convective     predominantly downstream or eastward of significant topography.
modes such as supercells and quasi-linear convective systems that      Regions such as the eastern half of the United States, La Plata
produce the vast majority of tornadoes, damaging winds, and large      Basin, southern Africa, southeastern China, Bangladesh, and
hail51,52.                                                             southern Europe feature the most conducive environments for
   The climatological distribution of the 50th percentile (P50) of     severe thunderstorms (Fig. 2b, Fig. 3). The overlap of CAPE and
BS06 is well correlated with the baroclinically driven thermal wind,   BS06 is especially favorable over La Plata Basin where severe
and, thus, the position of the jet streams. The highest values in      thunderstorm environments occur almost year round with a peak
BS06 are observed across mid-latitudes where horizontal tem-
                                                                       in SON (Supplementary Fig. 5).
perature gradients are the highest (Figs. 1c and 3). Conversely, the
                                                                          Long-term trends of severe environments feature significant
lowest BS06 occurs along the Equator where the horizontal
                                                                       changes primarily across mid-latitudes (Fig. 2b). The largest
temperature gradient is very small, and upper level air circulation
is comparatively weak. Seasonally, BS06 peaks in the respective        decreases of approximately −15 h (~5–10%) per decade are
hemispheric winters in DJF and JJA (Supplementary Fig. 3). These       observed over La Plata Basin, southeastern China, and the
patterns are generally seasonally reversed relative to CAPE,           southern Great Plains of the United States (Fig. 3). Minor
meaning that weak shear is typically accompanied by high CAPE          significant increases of a few hours (~5%) per decade are also
and vice-versa. However, there are some regional exceptions like       found over portions of Europe, central Russia, and the northern
the Great Plains of the United States where high CAPE is also          Great Plains of the United States, seasonally tied to MAM and JJA
accompanied by strong BS06 and creates favorable conditions for        (Supplementary Fig. 5).
severe thunderstorms producing strong tornadoes and very
large hail.                                                            Changes by latitude
   Long-term trends in the P50 of BS06 are small both seasonally
and annually in comparison to those for instability (Fig. 1c,          Given the strong relationship between climatological distributions
Supplementary Fig. 3), with modest increases along the ITCZ of         of CAPE, CP, BS06, and latitude (Fig. 1), we also consider this
+0.2 m s−1 (~2–5%) per decade (Figs. 1c and 3), and coincide with      aspect in Fig. 4. Although from the climatological standpoint the
areas of decreasing CAPE (Fig. 1a). Wind shear has increased over      largest CAPE is observed between 20°S and 20°N, the most
the Southern Ocean, and the mid-latitudes (southern South              significant decreases over land take place around 20°S and 10°N
America, far southern Africa, the northern United States), where       with almost no change near the Equator (Fig. 4a). Small increases
it has shifted slightly poleward. Modest significant decreases have     to CAPE between 40°N and 60°N are mostly insignificant.
taken place in regions where jet streams are commonplace,                 Similar to CAPE, CP has the highest accumulations between 20°
including a corridor from eastern Brazil to Australia, southeastern    S and 20°N coinciding with the seasonal shifts of the ITCZ.
Europe, northern Canada, and the Arctic (Fig. 1c). However,            However, in contrast to CAPE, well-defined significant decreases in
considering seasons with peak convective activity across mid-          CP are observed from 50°S to 10°N, with peak decreases near the
latitudes, changes in BS06 over Southern Hemisphere in DJF are         Equator (Fig. 4b). Increasing convective activity is observed
small, while over the Northern Hemisphere in JJA only decreases        between 60°N and 80°N, most likely as a result of rapid warming
across Europe and China are significant (Supplementary Fig. 3).         and the corresponding increase to moisture at these latitudes47.
                                                                          Vertical wind shear reverses the pattern of CAPE with P50 BS06
Modeled severe thunderstorm environments                               below 10 m s−1 along latitudes between 20°S and 20°N (Fig. 4c).
Combining previously analyzed parameters (CAPE, BS06, CP) into         Peak values exceeding 15 m s−1 are observed in mid-latitudes
environmental proxies for the occurrence of (severe) thunder-          around 45°S and 40°N. Most trends for BS06 are not robust, but
storms over the land surface (similar to the approach of Brooks        well-defined significant increases are observed within the ITCZ
et al.8 and Taszarek et al.35), we consider changes to the number      between 10°S and 10°N. In contrast, significant decreases are
of hours favorable for convective development each year. More          identified around 20°S, reflecting decreases to the subtropical jet
than 1000 h per year are favorable for the development of              stream over southern Africa and Australia. Warming across the
thunderstorms along the ITCZ, most frequently over the Amazon          high latitudes appears to be driving smaller horizontal tempera-
Basin, Congo Basin, and far southeastern Asia where peak values        ture gradients53, thereby inducing changes in the Northern
exceed even 2000 h (Figs. 2a and 3). Enhanced frequencies of           Hemisphere polar jet stream between 60°N and 70°N54,55.
favorable thunderstorm environments (>400 h per year) occur               Trends in favorable thunderstorm environments provide a clear
over the southeastern United States, La Plata Basin, southern          picture of robust decreases between 50°S and 40°N, with peak
China, India, and northern Australia. Over the remainder of the        reductions observed within the ITCZ (Fig. 4d). However, when the
globe, there are typically fewer than 150 h with favorable             additional ingredient of BS06 is considered for the severe
thunderstorm environments. Spatial variability has a strong link
                                                                       thunderstorm proxy, there is a noticeable increase around the
to the annual cycle with a peak frequency in JJA over the Northern
Hemisphere and DJF over the Southern Hemisphere (Supplemen-            Equator. In contrast, over the mid-latitudes where severe thunder-
tary Fig. 4).                                                          storms are more frequent, there are significant decreases between
   Long-term trends in thunderstorm environments predomi-              20° and 40° over both hemispheres (Fig. 4e). These changes are
nantly feature robust decreases with the most pronounced               larger in the Southern Hemisphere than in the Northern
reductions over Congo Basin of −97 h (10%) per decade, and             Hemisphere, reflecting the consistent decreases over South
Amazon Basin with −54 h (3%) per decade (Figs. 2a and 3).              America, southern Africa, and eastern Australia. This suggests that
Significant modest decreases of approximately 5% per decade are         although the overall number of favorable thunderstorm situations
also observed across the United States, southeastern Asia, La Plata    has been steadily decreasing across ITCZ, the fraction of
Basin, and Australia. Increases are minor and confined only to just     environments supportive of severe weather relatively increased.

Published in partnership with CECCR at King Abdulaziz University                            npj Climate and Atmospheric Science (2021) 35
M. Taszarek et al.
6
Fig. 4 ERA5 zonal mean climatology and trends for CAPE, convective precipitation, vertical wind shear, thunderstorm and severe
thunderstorm environments (land surface grids only). A 41-year (1979–2019) zonal mean climatology and trends for (a) 95th percentile of
convective available potential energy (CAPE), (b) accumulated convective precipitation, (c) 50th percentile of 0–6 km vertical wind shear, (d)
frequency of thunderstorm environments, and (e) frequency of severe thunderstorm environments. Only grids over the land surface are taken into
account (at least 30 in any latitudinal band). Trend is computed using Sen’s slope and value denote change per decade. Vertical solid lines indicate
p-value below 0.05.
Comparison with rawinsonde data occur over North America. Problematically, the availability of
Validation of ERA5 with trends obtained from observed global rawinsonde data from South America and Africa is too limited to
sounding measurements provides greater context to the certainty derive reliable conclusions for trends across broader areas.
of ERA5 results, and identifies which aspects should be interpreted Larger discrepancies are observed for trends in P95 CAPE. In
with caution. However, it should be noted that rawinsonde sounding data, there are robust increases over Southeastern Asia and
observations are also not free of errors. This includes temporal Australia, which is contrasted by the opposite pattern in ERA5 (Fig.
inhomogeneities, limited spatial availability (most of the stations 5a). Over Europe and North America trends in P95 of CAPE are mixed
are from mid-latitudes) and limited sub-daily sampling (0000 and in both datasets, especially when time steps of 0000 and 1200 UTC
1200 UTC), contrasting the hourly resolution of ERA539,56. for rawinsondes are compared. These results are broadly consistent
Trends in P50 BS06 derived from quality-controlled sounding with prior studies indicating that vertical wind shear is represented
measurements for stations with sufficient temporal record are well in reanalyses, while thermodynamic indices like CAPE (especially
generally in a good agreement with ERA5 (Fig. 5b). Robust extremes such as P95) are less reliable37–39. Thus, it is difficult to
decreases are observed over parts of Europe, Southeastern Asia, validate whether trends in instability in ERA5 are realistic, especially
and Australia while modest and mostly insignificant changes over tropics and subtropics.
npj Climate and Atmospheric Science (2021) 35 Published in partnership with CECCR at King Abdulaziz UniversityM. Taszarek et al.
7
Fig. 5 Rawinsonde trends for CAPE and vertical wind shear. A 41-year (1979–2019) 0000 and 1200 UTC trends for (a) 95th percentile of
convective available potential energy (CAPE), and (b) 50th percentile of 0–6 km vertical wind shear. Trends for all rawinsonde observations
combined together are presented on (c). Trend is computed using Sen’s slope and value denote change per decade. Only stations that passed
a rigorous quality-control procedure with at least 10000 observations available for 0000 or 1200 UTC (at least 100 per year over 30 years) are
included in this analysis.
Combining all quality-controlled rawinsonde measurements previous expectations based on climate simulations57–59.
suggest that over the last 4 decades P95 CAPE has been However, it is worth noting that the majority of stations
consistently increasing, while an opposite pattern was evaluated in our study with good temporal coverage are from
observed for P50 BS06 - both are statistically significant for mid-latitudes, and thus evaluation of changes across the tropics
both 0000 and 1200 UTC (Fig. 5c). This result broadly confirms is limited.
Published in partnership with CECCR at King Abdulaziz University npj Climate and Atmospheric Science (2021) 35M. Taszarek et al.
8
DISCUSSION strength and position of the mid-latitude jet streams53–55, that
In this study, we evaluated global thunderstorm environments are a main driver of severe thunderstorms.
and their corresponding trends over the 41 year period The disagreement between our results and CMIP5 projections of
(1979–2019) by using ERA5 reanalysis and rawinsonde observa- changes to convective environments by the end of the century
tions. Although ERA5 is only a modeled approximation of real may be a result of temporal inhomogeneities in the ERA5, an
atmospheric conditions, it provides a continuous dataset in time aspect of climate variability on the multi-decadal scale, or strong
and space with resolution allowing construction of climatologies uncertainties in simulated future CP accumulations in GCMs29.
in a way that was not possible with prior global reanalyses. Recent changes in atmospheric aerosols may be also a reason why
Based on results from ERA5, CP over the world’s second-largest historical trends in ERA5 differ from the projected climate change
rainforest in the Congo Basin, has decreased by 25% in the annual response. As reanalysis records continue to lengthen, they will
mean from 1700 mm in the 1980s to 1300 mm in the last decade. allow improved assessment of historical changes in convective
environments, and provide greater context for projected scenarios
Changes over other tropical regions such as the Amazon Basin or
in climate projections. Nevertheless, the ERA5 results presented
southeastern Asia also feature decreases but with a smaller overall
here suggest that despite substantial increases in temperature
magnitude of change (10%). These changes are also accompanied
since the 1980s, fewer favorable thunderstorm environments are
by decreases in available energy represented by CAPE, and thus occurring over some regions, in contrast to the increases expected
imply a lower frequency of environments favorable to thunder- in a warmer future climate. Other factors such as future expected
storms with potential implications for water availability60, agri- decreases in vertical wind shear, relative humidity, and tempera-
cultural productivity, societal aspects, and desertification (e.g. ture lapse rates can also have a negative effect on the likelihood of
Sahel region41). convective storms and their severity, but large uncertainties in the
However, these results are in contrast to the current expecta- models limit our confidence.
tions of changes in response to a globally warming climate in
CMIP5 projections, where an increase in heavy precipitation (but
also increased length of dry periods) across tropics is antici- METHODS
pated28–31. Previous research has argued that robust weakening of Reanalysis dataset
the tropical circulation is seen across models, and that changes in In this work, we use the 5th generation of ECMWF (The European Centre for
the spatial pattern of precipitation are dominated by the shifts Medium Range Weather Forecasts) global reanalysis (ERA565,66) over a
across convergence zones. However, as concluded by Kent et al.29 period of 41 years (1979–2019). In comparison to its predecessor (ERA-
and Huang et al.34, projected changes in CP over tropical and Interim), ERA5 has improved spatial (0.75° to 0.25°), vertical (60 to 137
subtropical regions in a future climate are highly uncertain, with levels), and temporal (6-h to 1-h) spacing, which allows a better
models disagreeing even on the sign of trends. The same applies representation of the small scale features associated with convective
environments that are sensitive to the resolution of numerical data.
to ERA5 where systematic errors in CP are also present. Large
uncertainties in simulating convection and cloud ice fundamental
to lightning formation in global climate models were also noted Rawinsonde dataset
by Finney et al.61. Similar to our study, they found reductions in All available sounding observations over a period of 41 years (1979–2019)
lightning days in Congo, but an increase in extreme were firstly derived from 1363 stations on a global scale (~17 mln
measurements) from the University of Wyoming database. After strict
lightning days. quality-control procedures (explained in details in Taszarek et al.39), we
Mid-latitude changes to CAPE vary considerably in space, with chose only those stations that had at least 10000 observations (no less
modest decreases over the Southern Hemisphere and robust than 100 per year for at least 30 years) for 0000 or 1200 UTC time steps (i.e.
positive trends close to inland seas, over Europe, and the northern where a credible trend computation was possible). A final database
Great Plains of the United States. Despite these increases, there consisted of 4,552,307 profiles from 362 stations for 0000 UTC, and
are overall reductions in CP, and regional modulations in BS06. 4,110,860 profiles from 329 stations for 1200 UTC (Supplementary Fig. 7).
However, even with positive trends in BS06 over the La Plata Basin An increasing quality of rawinsonde measurements was observed with
time as a higher fraction of profiles passed quality-control procedures over
and Southern Africa, the frequency of severe thunderstorm
the recent years compared to 1980s and 1990s.
environments decreased due to less frequent convective devel-
opment according to ERA5. Conversely, at higher latitudes,
positive trends in CAPE and CP (e.g. southern Europe), contribute Definition of environmental proxies
to increases in severe environments despite steadily decreasing Following an ingredient-based approach commonly applied in researching
BS06. This suggests that a prime consideration for assessing long- and forecasting severe thunderstorms7, here we evaluate 3 variables: (1)
convective available potential energy (CAPE), which determines whether
term changes to thunderstorm frequency needs to focus on an atmosphere has a potential to produce robust convective updrafts, (2)
convective initiation and its efficiency35,45,62 rather than just the 0–6 km vertical wind shear (BS06) that governs storm organization, and (3)
other ingredients, which is challenging to assess with observa- ERA5 simulated convective precipitation (CP) used as a proxy for
tional data. Trends derived from rawinsonde observations for 0000 convective initiation16,17,35. The underlying ERA5 convective parameteriza-
and 1200 UTC indicate significant increases in CAPE and tion that produces CP67 applies a mass flux closure scheme with
reductions in BS06 across mid-latitudes, consistent with expecta- entrainment that triggers convection based on either surface fluxes or
tions of a changing climate57–59. However, by the same token, this synoptic-scale motion, thereby providing greater confidence of initiation in
a manner similar to the observed atmosphere.
also highlights that trends in the ERA5 reanalysis should be In addition to individual variables, we also combine them into specific
considered carefully, as they are not always consistent with proxies to define conditions favorable to (severe) thunderstorms. Based on
observed records. prior research8,35,58,68, we consider a thunderstorm environment favorable
A likely driver of some of these changes is a globally increasing if CAPE > 150 J kg−1 and CP > 0.25 mm h−1, and a severe thunderstorm
near-surface temperature and moisture that has accelerated since environment favorable if in addition BS06 > 12.5 m s−1. Combining CAPE
the 1980s, especially considering high latitudes of the Northern with vertical wind shear has been previously shown to distinguish well
Hemisphere41. A significant increase in CP accumulations between between non-severe, severe and significant severe thunderstorms across
the United States10,57, Australia9, Europe10, South Africa69, and South
60°N and 80°N may be indicative of more frequent thunderstorms America70. As these proxies have been originally developed for severe
in very high latitudes as documented observationally by Houze thunderstorms occurring over the land surface, in this study oceanic
et al.63 and Brown et al.64. Changes in the horizontal temperature environments are not considered. Another important aspect is that the
gradients are also another important factor that influences majority of these proxies were designed based on mid-latitudes, thus their
npj Climate and Atmospheric Science (2021) 35 Published in partnership with CECCR at King Abdulaziz UniversityM. Taszarek et al.
9
application in tropical and sub-tropical areas should be interpreted with REFERENCES
caution. 1. Munich Re. 2020. Thunderstorms, hail and tornadoes. Localised but extremely
All variables were considered for the global domain at hourly resolution. destructive. Available online: https://www.munichre.com/en/risks/natural-disasters-
CAPE and CP were retrieved from the Copernicus Climate Data Store65, losses-are-trending-upwards/thunderstorms-hail-and-tornados.html (accessed on 31
while BS06 was calculated by interpolating U and V winds to the height Aug 2020).
profile from the native model level data, and taking the magnitude of the 2. Terti, G. et al. Toward probabilistic prediction of flash flood human impacts. Risk
vector difference between 10 m and 6000 m above ground level. Anal. 39, 140–161 (2019).
3. Holle, R. L. A summary of recent national-scale lightning fatality studies. Wea.
Computation of climatology and trends Clim. Soc. 8, 35–42 (2016).
4. Prein, A. F. & Holland, G. J. Global estimates of damaging hail hazard. Weather
To assess climatology and trends, we use 4 different metrics describing
Clim. Extremes 22, 10–23 (2018).
important elements of the environmental distribution: accumulation (for 5. Schoen, J. M. & Ashley, W. S. A climatology of fatal convective wind events by
CP), 50th percentile (for BS06), 95th percentile (for CAPE) and frequency of storm type. Wea. Forecast. 26, 109–121 (2011).
favorable (severe) thunderstorm environments. These metrics are con- 6. Antonescu, B., Schultz, D. M., Holzer, A. & Groenemeijer, P. Tornadoes in Europe:
sistent with similar prior studies that evaluated convective trends on the an underestimated threat. Bull. Am. Meteorol. Soc. 98, 713–728 (2017).
regional scale35,36,68. Climatology is defined by taking into account
7. Johns, R. H. & Doswell, C. A. III Severe local storms forecasting. Wea. Forecast. 7,
the mean from all annual or seasonal values of those metrics, while
588–612 (1992).
trends are assessed by applying the non-parametric Sen’s slope analysis71. 8. Brooks, H. E., Lee, J. W. & Craven, J. P. The spatial distribution of severe thun-
We chose this metric due to its frequent application for evaluating robust derstorm and tornado environments from global reanalysis data. Atmos. Res. 67,
trends in the atmospheric sciences where the underlying parameters 73–94 (2003).
exhibit interannual variability. Significance of the trend is assessed using a 9. Allen, J. T., Karoly, D. J. & Mills, G. A. A severe thunderstorm climatology for
non-parametric Mann-Kendall two-tailed p-value at the 0.05 threshold that Australia and associated thunderstorm environments. Aust. Meteorological
is denoted by stippled ‘x’ on each figure. Slope units are calculated for the
Oceanographic J. 61, 143–158 (2011).
annual change, but normalized to change per decade for simplicity of
10. Taszarek, M., Allen, J. T., Púčik, T., Hoogewind, K. A. & Brooks, H. E. Severe con-
interpretation. vective storms across Europe and the United States. Part II: ERA5 environments
associated with lightning, large hail, severe wind, and tornadoes. J. Clim. 33,
10263–10286 (2020).
LIMITATIONS 11. Emanuel, K. A. Atmospheric convection. Oxford University Press, 558 pp (1994).
Environmental proxies are an imperfect conditional approximation 12. Riemann-Campe, K., Fraedrich, K. & Lunkeit, F. Global climatology of Convective
of convective activity, and should be interpreted with caution. As Available Potential Energy (CAPE) and Convective Inhibition (CIN) in ERA-40
demonstrated by Tippett et al.17 performance of such proxies reanalysis. Atmos. Res. 93, 534–545 (2009).
varies by region and time of the year considered. This poses 13. Weisman, M. L. & Klemp, J. B. The dependence of numerically simulated con-
vective storms on vertical wind shear and buoyancy. Mon. Weather Rev. 110,
challenges, particularly when comparing different parts of the
504–520 (1982).
world with different underlying climatology. Proxies used in this 14. Warren, R. A., Richter, H., Ramsay, H. A., Siems, S. T. & Manton, M. J. Impact of
study were primarily developed for the mid-latitudes, and their variations in upper-level shear on simulated supercells. Mon. Weather Rev. 145,
performance over tropical and subtropical areas is uncertain. Thus, 2659–2681 (2017).
analyzing changes using these proxies will be burdened with 15. Peters, J. M., Nowotarski, C. J. & Morrison, H. The role of vertical wind shear in
some degree of inaccuracy, no matter the parameter chosen. modulating maximum supercell updraft velocities. J. Atmos. Sci. 76, 3169–3189
Application of convective proxies obviously does not provide an (2019).
explicit number of storm events, but it helps to define the 16. Romps, D. M. et al. CAPE times P explains lightning over land but not the land‐
approximate frequency to those that may most likely result in ocean contrast. Geophys. Res. Lett. 45, 12–623 (2018).
17. Tippett, M. K., Lepore, C., Koshak, W. J., Chronis, T. & Vant-Hull, B. Performance of a
(severe) thunderstorms.
simple reanalysis proxy for US cloud-to-ground lightning. Int. J. Climatol. 39,
Additional limitations may be related to the model formulation 3932–3946 (2019).
of ERA5. For example, convective parameterizations may lead to 18. Price, C. & Asfur, M. Inferred long term trends in lightning activity over Africa.
errors in the vertical profile of temperature and moisture and Earth, Planet Sp. 58, 1197–1201 (2006).
subsequently influence metrics such as CAPE and modeled 19. Kunz, M., Sander, J. & Kottmeier, C. Recent trends of thunderstorm and hailstorm
precipitation25,37–39. Although the defining concept of the frequency and their relation to atmospheric characteristics in southwest Ger-
reanalysis is to provide a consistent record of meteorological many. Int. J. Climatol. 29, 2283–2297 (2009).
conditions over time, varying quality of assimilated data may be a 20. Pinto, O. Jr, Pinto, I. R. C. A. & Ferro, M. A. S. A study of the long‐term variability of
source of specific biases that are smaller over the recent years66,72. thunderstorm days in southeast Brazil. J. Geophys. Res.: Atmos. 118, 5231–5246
(2013).
Although it is beyond the scope of this paper to diagnose the
21. Lavigne, T., Liu, C. & Liu, N. How Does the Trend in Thunder Days Relate to the
source of such errors, it provides a caveat on the results and Variation of Lightning Flash Density? J. Geophys. Res.: Atmos. 124, 4955–4974
should be taken into consideration when interpreting results, (2019).
especially over areas where differing trends are obtained for 22. Harel, M. & Price, C. Thunderstorm Trends over Africa. J. Clim. 33, 2741–2755
observations. Nevertheless, ERA5 at least regionally compared to (2020).
other global reanalyses is considered to be currently one of the 23. Diffenbaugh, N. S., Scherer, M. & Trapp, R. J. Robust increases in severe thun-
best available tools for studying convective climatologies35,36,39. derstorm environments in response to greenhouse forcing. Proc. Natl Acad. Sci.
USA 110, 16361–16366 (2013).
24. Seeley, J. T. & Romps, D. M. Why does tropical convective available potential
DATA AVAILABILITY energy (CAPE) increase with warming? Geophys. Res. Lett. 42, 10,429–10,437
(2015).
ERA5 hourly data (convective available potential energy, accumulated convective
25. Allen, J. T. Climate change and severe thunderstorms. Oxford Research Encyclo-
precipitation, U and V on native model levels) was downloaded from the European
pedia of Climate Science, 67 pp (2018).
Centre for Medium-Range Weather Forecasts (ECMWF), Copernicus Climate Change
26. Chen, J., Dai, A., Zhang, Y. & Rasmussen, K. L. Changes in convective available
Service (C3S) at Climate Data Store (CDS; https://cds.climate.copernicus.eu/). Radio-
potential energy and convective inhibition under global warming. J. Clim. 33,
sonde data was downloaded from the University of Wyoming upper air database
2025–2050 (2020).
available at http://weather.uwyo.edu/upperair/.
27. Glazer, R. H. et al. Projected changes to severe thunderstorm environments as a
result of twenty-first century warming from RegCM CORDEX-CORE simulations.
Received: 16 April 2021; Accepted: 21 May 2021; Clim. Dyn. https://doi.org/10.1007/s00382-020-05439-4. (2020).
28. Chadwick, R., Boutle, I. & Martin, G. Spatial patterns of precipitation change in
CMIP5: why the rich do not get richer in the tropics. J. Clim. 26, 3803–3822 (2013).
Published in partnership with CECCR at King Abdulaziz University npj Climate and Atmospheric Science (2021) 35M. Taszarek et al.
10
29. Kent, C., Chadwick, R. & Rowell, D. P. Understanding uncertainties in future 57. Brooks, H. E. Severe thunderstorms and climate change. Atmos. Res. 123, 129–138
projections of seasonal tropical precipitation. J. Clim. 28, 4390–4413 (2015). (2013).
30. Liu, H. W., Yu, J. Y. & Chen, C. A. Changes of tropical precipitation and convective 58. Trapp, R. J. et al. Changes in severe thunderstorm environment frequency during
structure under global warming projected by CMIP5 model simulations. Terr. the 21st century caused by anthropogenically enhanced global radiative forcing.
Atmos. Ocean. Sci. 29, 429–440 (2018). Proc. Natl Acad. Sci. USA 104, 19719–19723 (2007).
31. Creese, A., Washington, R. & Jones, R. Climate change in the Congo Basin: pro- 59. Del Genio, A. D., Yao, M.-S. & Jonas, J. Will moist convection be stronger in a
cesses related to wetting in the December–February dry season. Clim. Dyn. 53, warmer climate? Geophys. Res. Lett. 34, L16703 (2007).
3583–3602 (2019). 60. Rasmussen, K. L., Chaplin, M. M., Zuluaga, M. D. & Houze, R. A. Contribution of
32. Finney, D. L. et al. A projected decrease in lightning under climate change. Nat. extreme convective storms to rainfall in South America. J. Hydrometeor. 17,
Clim. Change 8, 210–213 (2018). 353–367 (2016).
33. Romps, D. M. Evaluating the future of lightning in cloud‐resolving models. Geo- 61. Finney, D. L. et al. African lightning and its relation to rainfall and climate change
phys. Res. Lett. 46, 14863–14871 (2019). in a convection-permitting model. Geophys. Res. Lett. 47, e2020GL088163 (2020).
34. Huang, D. et al. Uncertainty of global summer precipitation in the CMIP5 models: 62. Rasmussen, K. L., Prein, A. F., Rasmussen, R. M., Ikeda, K. & Liu., C. Changes in the
a comparison between high-resolution and low-resolution models. Theor. Appl. convective population and thermodynamic environments in convection-
Climatol. 132, 55–69 (2018). permitting regional climate simulations over the United States. Clim. Dyn. 55,
35. Taszarek, M., Allen, J. T., Brooks, H. E., Pilguj, N. & Czernecki, B. Differing trends in 383–408 (2020).
United States and European severe thunderstorm environments in a warming 63. Houze, R. A. Jr, Wang, J., Fan, J., Brodzik, S. & Feng, Z. Extreme convective storms
climate. Bull. Am. Meteorol. Soc. 102, 296–322 (2021). over high‐latitude continental areas where maximum warming is occurring.
36. Li, F., Chavas, D. R., Reed, K. A. & Dawson, D. T. Climatology of severe local storm Geophys. Res. Lett. 46, 4059–4065 (2019).
environments and synoptic-scale features over North America in ERA5 reanalysis 64. Brown, D. M., Kochtubajda, B. & Said, R. K. A severe thunderstorm outbreak north
and CAM6 simulation. J. Clim. 33, 8339–8365 (2020). of 70° N Over the Canadian Arctic Islands with unusual lightning characteristics.
37. Gensini, V. A., Mote, T. L. & Brooks, H. E. Severe-thunderstorm reanalysis envir- Atmos. Ocean 58, 231–242 (2020).
onments and collocated radiosonde observations. J. Appl. Meteorol. Climatol. 53, 65. Copernicus Climate Change Service (C3S). ERA5: Fifth generation of ECMWF
742–751 (2014). atmospheric reanalyses of the global climate. Copernicus Climate Change Service
38. King, A. T. & Kennedy, A. D. North American supercell environments in atmo- Climate Data Store (CDS), https://cds.climate.copernicus.eu/cdsapp#!/home
spheric reanalyses and RUC-2. J. Appl. Meteor. Climatol. 58, 71–92 (2019). (access on 15 July 2020).
39. Taszarek, M. et al. Comparison of convective parameters derived from ERA5 and 66. Hersbach, H. et al. The ERA5 global reanalysis. Q. J. R. Meteorol. Soc. 146,
MERRA2 with sounding data over Europe and North America. J. Clim 34, 1999–2049 (2020).
3211–3237 (2021). 67. Bechtold, P. et al. Representing equilibrium and nonequilibrium convection in
40. Cui, W., Dong, X., Xi, B. & Kennedy, A. Evaluation of reanalyzed precipitation large-scale models. J. Atmos. Sci. 71, 734–753 (2014).
variability and trends using the gridded gauge-based analysis over the CONUS. J. 68. Rädler, A. T., Groenemeijer, P. H., Faust, E., Sausen, R. & Púčik, T. Frequency of
Hydrometeor. 18, 2227–2248 (2017). severe thunderstorms across Europe expected to increase in the 21st century due
41. D’Odorico, P., Bhattachan, A., Davis, K. F., Ravi, S. & Runyan, C. W. Global deser- to rising instability. npj Clim. Atmos. Sci. 2, 1–5 (2019).
tification: drivers and feedbacks. Adv. Water Resour. 51, 326–344 (2013). 69. Blamey, R. C., Ramos, A. M., Trigo, R. M., Tomé, R. & Reason, C. J. C. The influence of
42. Zhang, X. et al. Detection of human influence on twentieth-century precipitation atmospheric rivers over the South Atlantic on winter rainfall in South Africa. J.
trends. Nature 448, 461–465 (2007). Hydrometeor. 19, 127–142 (2018).
43. Groenemeijer, P. et al. Severe convective storms in Europe: ten years of research 70. Bruick, Z. S., Rasmussen, K. L. & Cecil, D. J. Subtropical South American hailstorm
and education at the European Severe Storms Laboratory. Bull. Am. Meteorol. Soc. characteristics and environments. Mon. Weather Rev. 147, 4289–4304 (2019).
98, 2641–2651 (2017). 71. Wilcox, R. R. Fundamentals of Modern Statistical Methods: Substantially
44. Trapp, R. J. & Hoogewind, K. A. The realization of extreme tornadic storm events Improving Power and Accuracy. Springer, 249 pp (2010).
under future anthropogenic climate change. J. Clim. 29, 5251–5265 (2016). 72. Thorne, P. & Vose, R. Reanalyses suitable for characterizing long-term trends: are
45. Hoogewind, K. A., Baldwin, M. E. & Trapp, R. J. The impact of climate change on they really achievable? Bull. Am. Meteorol. Soc. 91, 353–361 (2010).
hazardous convective weather in the United States: insight from high-resolution
dynamical downscaling. J. Clim. 30, 10081–10100 (2017).
46. Li, R. C. & Zhou, W. Changes in western Pacific tropical cyclones associated with ACKNOWLEDGEMENTS
the El Niño–Southern Oscillation cycle. J. Clim. 25, 5864–5878 (2012). M.T. acknowledges support from the Polish National Science Centre under Grant No.
47. IPCC: Global Warming of 1.5 °C An IPCC Special Report on the Impacts of Global 2017/27/B/ST10/00297. J.T. Allen acknowledges support from the National Science
Warming of 1.5 °C Above Pre-Industrial Levels and Related Global Greenhouse Foundation under Grant No. AGS-1945286. M.M. acknowledges support from the
Gas Emission Pathways, in the Context of Strengthening the Global Response to Italian Ministry of University and Research (MIUR) under grant “Dipartimenti di
the Threat of Climate Change. Sustainable Development, and Efforts to Eradicate Eccellenza (2018-2022)”, awarded to the Department of Civil, Environmental and
Poverty. IPCC (2018). Mechanical Engineering of the University of Trento. The reanalysis and sounding
48. Gu, G. & Adler, R. F. Spatial patterns of global precipitation change and variability computations were performed in the Poznań Supercomputing and Networking
during 1901–2010. J. Clim. 28, 4431–4453 (2015). Center (project number: 331). Additional funding was provided by the NOAA/Office
49. Maidment, R. I., Allan, R. P. & Black, E. Recent observed and simulated changes in of Oceanic and Atmospheric Research under NOAA University of Oklahoma
precipitation over Africa. Geophys. Res. Lett. 42, 8155–8164 (2015). Cooperative Agreement NA11OAR4320072, under the U.S. Department of Commerce.
50. Sheikh, M. M. et al. Trends in extreme daily rainfall and temperature indices over
South Asia. Int. J. Climatol. 35, 1625–1637 (2015).
51. Thompson, R. L., Smith, B. T., Grams, J. S., Dean, A. R. & Broyles, C. Convective
AUTHOR CONTRIBUTIONS
modes for significant severe thunderstorms in the contiguous United States. Part
II: Supercell and QLCS tornado environments. Wea. Forecast. 27, 1136–1154 M.T. designed the study, performed the calculation and visualization of results and
(2012). led writing of the manuscript. M.M contributed to data collection and processing. J.T.
52. Kumjian, M. R. & Lombardo, K. A hail growth trajectory model for exploring the A., M.M., and H.E.B. contributed to the research design, participated in the
environmental controls on hail size: model physics and idealized tests. J. Atmos. interpretation of results and writing of the manuscript.
Sci. 77, 2765–2791 (2020).
53. Coumou, D., Lehmann, J. & Beckmann, J. The weakening summer circulation in
the northern hemisphere mid-latitudes. Science 348, 324–327 (2015). COMPETING INTERESTS
54. Pena-Ortiz, C., Gallego, D., Ribera, P., Ordonez, P. & Alvarez-Castro, M. D. C. The authors declare no competing interests.
Observed trends in the global jet stream characteristics during the second half of
the 20th century. J. Geophys. Res.: Atmos. 118, 2702–2713 (2013).
55. Barnes, E. A. & Screen, J. A. The impact of Arctic warming on the midlatitude jet- ADDITIONAL INFORMATION
stream: can it? Has it? Will it? WIREs Clim. Change 6, 277–286 (2015). Supplementary information The online version contains supplementary material
56. Zhou, C., Wang, J., Dai, A. & Thorne, P. W. A new approach to homogenize global available at https://doi.org/10.1038/s41612-021-00190-x.
subdaily radiosonde temperature data from 1958 to 2018. J. Clim. 34, 1163–1183
(2021). Correspondence and requests for materials should be addressed to M.T.
npj Climate and Atmospheric Science (2021) 35 Published in partnership with CECCR at King Abdulaziz UniversityM. Taszarek et al.
11
Reprints and permission information is available at http://www.nature.com/ appropriate credit to the original author(s) and the source, provide a link to the Creative
reprints Commons license, and indicate if changes were made. The images or other third party
material in this article are included in the article’s Creative Commons license, unless
Publisher’s note Springer Nature remains neutral with regard to jurisdictional claims indicated otherwise in a credit line to the material. If material is not included in the
in published maps and institutional affiliations. article’s Creative Commons license and your intended use is not permitted by statutory
regulation or exceeds the permitted use, you will need to obtain permission directly
from the copyright holder. To view a copy of this license, visit http://creativecommons.
org/licenses/by/4.0/.
Open Access This article is licensed under a Creative Commons
Attribution 4.0 International License, which permits use, sharing,
adaptation, distribution and reproduction in any medium or format, as long as you give © The Author(s) 2021
Published in partnership with CECCR at King Abdulaziz University npj Climate and Atmospheric Science (2021) 35You can also read