ESG TRENDS TO WATCH IN 2020 - RIAA MEMBER ONLY WEBINAR 5 February 2020 Presenters: Responsible Investment ...
←
→
Page content transcription
If your browser does not render page correctly, please read the page content below

ESG TRENDS TO WATCH IN 2020
RIAA MEMBER ONLY WEBINAR
5 February 2020

Presenters:
Enrico Colombo - Sustainalytics
Morgan Ellis – MSCI ESG Research Australia
Erin Levey – ISS ESG
Helena Fung – FTSE Russell

Responsible Investment
Association Australasia

RIAA - ESG TRENDS TO WATCH 2020

10 for 2020: Creating impact through
thematic investing

Enrico Colombo – Manager, ESG Research Lead APAC
5 February 2019

About Sustainalytics

» A global leader in ESG research, ratings
  and engagement

» Coverage universe of over 12,000 global
  equities

» 600+ staff in 16 offices

» Over 600 institutional clients across 22
  countries

                                             © 2020 SUSTAINALYTICS   CONFIDENTIAL & PROPRIETARY   2
Our flagship thought leadership report for the year ahead
10 for 2020 is the sixth edition in the series

» 10 ESG-inspired investment themes to consider in 2020 and beyond
» 10 chapters organized under four themes
» 10 Sustainable Development Goals (SDGs) that can be addressed
» 10 profiles of relatively well-positioned companies

    Download the full report from our website:
    https://www.sustainalytics.com/ESG-research/#ourpublications

                                                                     © 2020 SUSTAINALYTICS   CONFIDENTIAL & PROPRIETARY   3
Ten storylines for investors in 2020 and beyond
Theme                      Summary                                                                                                   SDG                                 Company

                           The f if th generation wireless technology - 5G - promises theoretical peak speeds of 10 Gbps,            9 - Industry, Innovation and        Cisco Systems
5G
                           which is 10 times f aster than 4G's peak                                                                  Inf rastructure                     Inc

                           Digitalization, automation and electrif ication are reshaping the mining industry, and of f ering the     8 - Decent Work and Economic        Anglo American
Digitalization of mining
                           twin promise of cost reductions and ESG improvements                                                      Growth                              Plc

                           Global competition, ef f icient resource utilisation and the need f or improved productivity are driving 8 - Decent Work and Economic         CNH Industrial
Industrial automation
                           increased automation in the machinery sector                                                             Growth                               NV

Connected medical
                           Connected medical devices of f er the potential to improve patient care while lowering costs              3 - Good Health and Well-Being      Royal Philips NV
devices

                           Some brands are pivoting towards slow f ashion to gain a competitive advantage and mitigate               12 - Responsible
Slow f ashion                                                                                                                                                            Kering SA
                           environmental and social risks                                                                            Consumption and Production

                           Shipping f irms f ace pressure to mitigate environmental impacts as the IMO has adopted a                                                     AP Møller -
Cleaner shipping                                                                                                                     14 - Lif e Below Water
                           resolution to cut sulphur and other emissions                                                                                                 Mærsk AS

                           Leading banks are incorporating biodiversity assessments into their decision-making process f or                                              De Volksbank
Banking on biodiversity                                                                                                     15 - Lif e on Land
                           debt f inancing                                                                                                                               NV

                           Batteries can help electricity grids regulate f requency and help renewables compete with gas by
Energy storage                                                                                                                       7 - Af f ordable and Clean Energy   Acciona SA
                           f acilitating capacity reserve

                           Some oil and gas majors are investing in an array of low-carbon products, including alternative
Big oil transition                                                                                                                   13 - Climate Action                 Total SA
                           energy assets, to diversif y revenue streams

Reinsuring climate         Some reinsurers are already warning that climate change could render property insurance                   11 - Sustainable Cities and
                                                                                                                                                                         Swiss Re Ltd
change                     unaf f ordable f or large segments of the population                                                      Communities

                                                                                                                                   © 2020 SUSTAINALYTICS      CONFIDENTIAL & PROPRIETARY    4
Digitalisation of mining
 Out of sight, not out of mined                                                                                              Forecast capex in the global mining
                                                                                                        160,000                           industry
                                                                                                        140,000

» Automation, electrification and digitalisation offer the possibility                                  120,000

                                                                         Capex (USD mn)
                                                                                                        100,000
  of cost reductions and improved sustainability performance                                             80,000

  (e.g. safety, energy use, water efficiency).                                                           60,000

                                                                                                         40,000
» Use of AI to develop optimisation models that boost value
                                                                                                         20,000
  extraction and productivity across the mineral production chain.                                              0
                                                                                                                      2010 2011 2012 2013 2014 2015 2016 2017 2018 2019 2020 2021 2022

» Applications of blockchain for responsible sourcing of minerals.                                                  Copper    Gold    Iron ore   Metallurgical coal   Nickel   Zinc    Other

                                                                                                                    Source: Sustainalytics, based on data from S&P Global Market Intelligence
» Forecast USD 5.4bn, or 6.4%, drop in capex budget across the
  industry, placing larger companies at relative advantage to                                            60.0

                                                                         Overall Unmanaged RIsk Score
                                                                                                         50.0
  invest in mining technology projects.
                                                                                                         40.0

» Australian miners are early adopters of leading practices in                                           30.0

  automation and digitalization of their assets.                                                         20.0

                                                                                                         10.0
» Potential contribution to SDG 8 Decent Work and Economic
                                                                                                          0.0
  Gro th .

                                                                                                                                 © 2020 SUSTAINALYTICS            CONFIDENTIAL & PROPRIETARY    5
Banking on biodiversity                                                                                                                  Living Planet Index, 1970-2014
                                                                                                                        100%
The next frontier in green financing                                                                                    90%
                                                                                                                                                                      60% of vertebrate animal species
                                                                                                                                                                      extinct since 1970, and 1 million
                                                                                                                        80%
                                                                                                                                                                      species are at risk of extinction

                                                                                            Index value (1970 = 100%)
                                                                                                                        70%

» Strategic consideration of biodiversity can help reduce risk and                                                      60%

                                                                                                                        50%
  create new opportunities for banks to provide financial services                                                      40%

  to sustainable agricultural firms.                                                                                    30%

                                                                                                                        20%

» Biodiversity is the backbone of natural systems that underpin                                                         10%

                                                                                                                         0%
  economic activity, and its loss is a critical but often overlooked
  macroeconomic risk.                                                                                                          Source: Reproduced by Sustainalytics based on data from the Living Planet Index

» Intensive agricultural practices are central drivers of biodiversity                                                   5.0

  loss, while demand for sustainable agriculture is increasing.                                                          4.5

                                                                         ESG Integration - Financials
                                                                          Unmanaged RIsk Score,
                                                                                                                         4.0
                                                                                                                         3.5
» Sustainable agriculture may be the main solution for improving                                                         3.0
                                                                                                                         2.5
  crop yields and increasing pollinator numbers.                                                                         2.0
                                                                                                                         1.5
                                                                                                                         1.0
» State-owned, cooperative and development banks are pioneers                                                            0.5
                                                                                                                         0.0
  in integrating biodiversity protocols in blended finance facilities.
» Potential contribution to SDG 15 Life on Land .

                                                                                                                                  © 2020 SUSTAINALYTICS           CONFIDENTIAL & PROPRIETARY                     6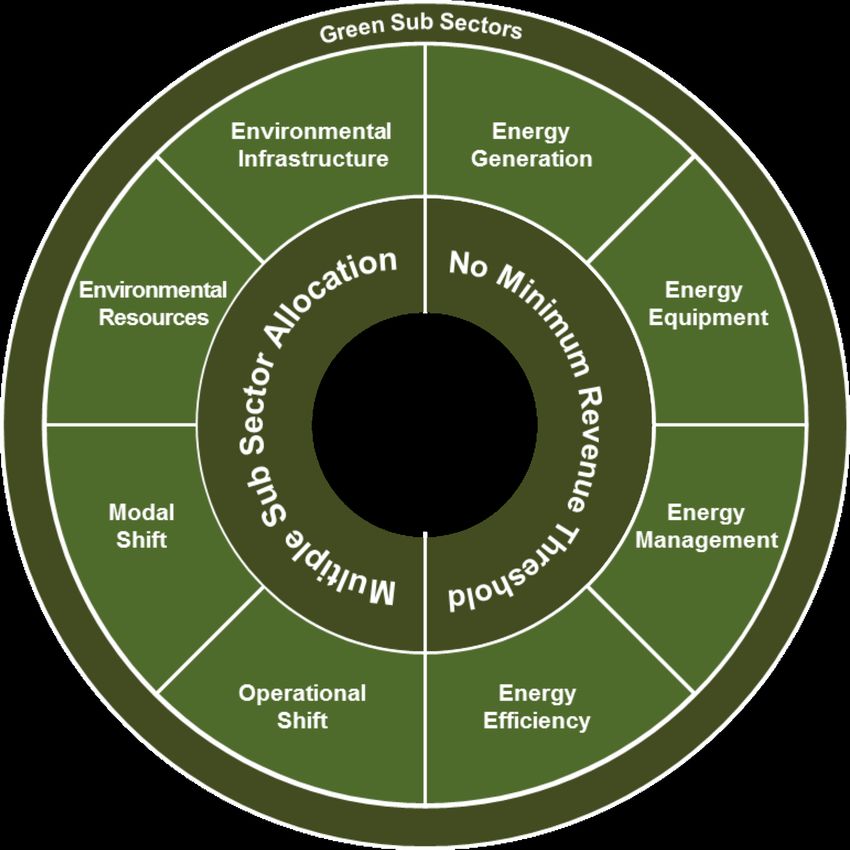
Insuring a volatile planet
Climate impacts threaten reinsurers                                                                           Number of relevant natural loss events, 1980-2018
                                                                                                              900

» Natural loss events grew 2.5 times in 1980-2018, and global

                                                                     Number of relevant natural loss events
                                                                                                              800

                                                                                                              700
  insured losses topped USD 300 bn in the last five years.                                                    600

» The insurance industry is threatened by climate change and                                                  500

                                                                                                              400
  may be hitting its capacity to take on more climate risk.                                                   300

                                                                                                              200
» Insurers and reinsurers are responding by improving the
                                                                                                              100

  accuracy of models to reduce losses, and adjusting                                                            0

  underwriting standards and premiums to better price risk,
  while also warning about affordability issues.                                                                                          Source: NatCatSERVICE, Sustainalytics

» Companies are increasing use of catastrophe bonds and
  exploring resilience bonds as risk transfer and sharing tools.
» More innovation ahead in climate-related insurance products
  to mitigate the volatility of payouts for natural events losses.
» Potential contribution to SDG 11 Sustainable Cities and
  Communities .

                                                                                                                      © 2020 SUSTAINALYTICS   CONFIDENTIAL & PROPRIETARY          7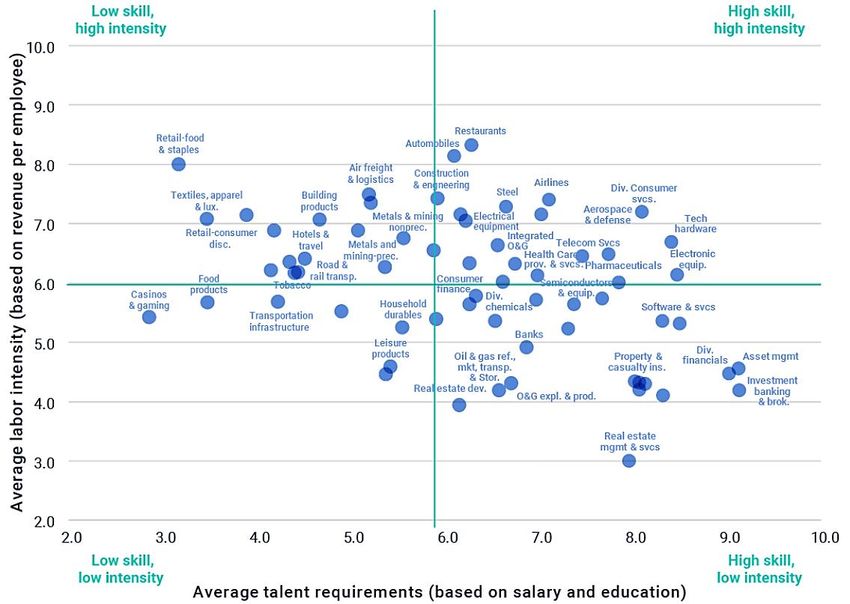
Legal Disclaimers
Copyright © 2020 Sustainalytics. All rights reserved.

Part of this presentation may contain Sustainalytics proprietary information that may not be reproduced, used,
disseminated, modified nor published in any manner without the express written consent of Sustainalytics. Nothing
contained in this presentation shall be construed so as to make a representation or warranty, express or implied,
regarding the advisability to invest in or include companies in investable universes and/or portfolios. The information
provided in this presentation is not intended to be relied upon as, nor to be a substitute for specific professional advice
and in particular financial ad ice. The information is pro ided as is and, therefore Sustainal tics assumes no
responsibility for errors or omissions. Sustainalytics accepts no liability for damage arising from the use of this
presentation or information contained herein in any manner whatsoever. This presentation is not contractual.

                                                                                    © 2020 SUSTAINALYTICS   CONFIDENTIAL & PROPRIETARY   8
For more information, please contact:

Enrico Colombo
Manager, ESG Research Lead APAC

enrico.colombo@sustainalytics.com

www.sustainalytics.com
2020
ESG TRENDS TO WATCH
Morgan Ellis
Vice President, ESG Research

                                                     © 2020 MSCI Inc. All rights reserved.
                               Please refer to the disclaimer at the end of this document.
2020
ESG trends
to watch
• Re-valuing real estate
• Climate change innovators
• The new human capital
paradox
• New terms for capital
• Keeping score on
stakeholder capitalism
2Re-valuing
real estate
Investing in the eye of the
hurricane
3Re-valuing real estate:
Investing in the eye of the hurricane
Exposure to regulations and climate hazards, by real estate market
The chart shows the top 21 U.S. cities represented in the MSCI Global Property Index (those with at least 60 geocoded assets
covered in the index), classified by the type of regulatory requirements adopted by each and the level of physical risk to which the
cities are exposed. The following physical risks were assessed: hurricanes, water stress, and wildfire. Sources: MSCI Real Estate,
MSCI ESG Research LLC, American Council for Energy-Efficient Economy, World Resources Institute (WRI), U.S. Department of 4
Agriculture, U.S. Forest Service, MunichRe. Data as of Dec. 31, 2018.Climate
change
innovators
Spotting the
sleeping giants
5Climate change innovators:
Spotting the sleeping giants
Green revenue vs. low-carbon patents of companies
The chart shows cumulative figures for all patents and low-carbon technology patents from the European Patents Database for the calendar
years 2013-2017 and green revenue figures from MSCI ESG Research Sustainable Impact Metrics. Data is for companies that were 6
constituents of the MSCI ACWI Investable Market Index (IMI) as of Nov. 30, 2019, and for patents that were filed during the time period
specified and were still effective as of Nov. 30, 2019.Source: MSCI ESG ResearchThe new
human capital
paradox
Juggling layoffs
against shortages
7The new human capital paradox:
Juggling layoffs against shortages
MSCI ESG industries by average talent requirements and labor intensity
The chart shows MSCI ESG industries plotted by their average talent requirements (from U.S. Bureau of Labor Statistics data on business
segments' average employee salary and education level) and average labor intensity (revenue per employee). Data is for constituents of the 8
MSCI ACWI Index as of June 30, 2019. Source: MSCI ESG ResearchThank you!
Here’s a summary of recent ESG Research papers, blogs and podcasts
Research ESG now
papers Blogs podcast
• 2020 ESG trends to watch paper • 2020 ESG trends to watch • Episode 63: Indigenous inclusion
and carbon offsets can go hand-in-
• Women on boards: 2019 progress • CEO Pay: Trick or Treat? hand
report
• Episode 62: Investors and world
• Is climate-change risk all about leaders are finally freaking out
• Human capital risks in a changing fossil fuels? Think again about the climate crisis…
world
• Is the US tech sector ignoring • Episode 61: Wildfire in Australia
• China through an ESG lens minority talent? poses problems for all, and a quick
take on how we learned to stop
• Climate risk in private real estate • Underwater assets? Real estate worrying and love social media for
portfolios: What’s the exposure? exposure to flood risk the 2020 election
• Episode 60: Diversity data matters
• Banking on ESG: Examining the • Looking inside ESG indexes more for investors than financial
financial relevance of ESG to banks metrics can show, and the decision
by Boeing to halt production of the
737 Max
9About MSCI
MSCI is a leading provider of critical decision support tools and
services for the global investment community. With over 45 years of
expertise in research, data and technology, we power better investment
decisions by enabling clients to understand and analyze key drivers of
risk and return and confidently build more effective portfolios. We
create industry-leading research-enhanced solutions that clients use to
gain insight into and improve transparency across the investment
process. To learn more, please visit www.msci.com.
10Contact us
AMERICAS EUROPE, MIDDLE EAST ASIA PACIFIC
& AFRICA
Americas +1 888 588 4567 * Cape Town + 27 21 673 0100 China North 10800 852 1032 *
Atlanta + 1 404 551 3212 Frankfurt + 49 69 133 859 00 China South 10800 152 1032 *
Boston + 1 617 532 0920 Geneva + 41 22 817 9777 Hong Kong + 852 2844 9333
Chicago + 1 312 675 0545 London + 44 20 7618 2222 Mumbai + 91 22 6784 9160
Monterrey + 52 81 1253 4020 Milan + 39 02 5849 0415 Seoul 00798 8521 3392 *
New York + 1 212 804 3901 Paris 0800 91 59 17 * Singapore 800 852 3749 *
San Francisco + 1 415 836 8800 Sydney + 61 2 9033 9333
São Paulo + 55 11 3706 1360 Taipei 008 0112 7513 *
Toronto + 1 416 628 1007 Thailand 0018 0015 6207 7181 *
Tokyo +81 3 5290 1555
• = toll free
msci.com
clientservice@msci.com
11Notice & disclaimer
This document and all of the information contained in it, including without limitation all text, data, graphs, charts (collectively, the “Information”) is the property of MSCI Inc. or its subsidiaries (collectively, “MSCI”), or MSCI’s licensors,
direct or indirect suppliers or any third party involved in making or compiling any Information (collectively, with MSCI, the “Information Providers”) and is provided for informational purposes only. The Information may not be modified,
reverse-engineered, reproduced or redisseminated in whole or in part without prior written permission from MSCI.
The Information may not be used to create derivative works or to verify or correct other data or information. For example (but without limitation), the Information may not be used to create indexes, databases, risk models, analytics,
software, or in connection with the issuing, offering, sponsoring, managing or marketing of any securities, portfolios, financial products or other investment vehicles utilizing or based on, linked to, tracking or otherwise derived from the
Information or any other MSCI data, information, products or services.
The user of the Information assumes the entire risk of any use it may make or permit to be made of the Information. NONE OF THE INFORMATION PROVIDERS MAKES ANY EXPRESS OR IMPLIED WARRANTIES OR REPRESENTATIONS
WITH RESPECT TO THE INFORMATION (OR THE RESULTS TO BE OBTAINED BY THE USE THEREOF), AND TO THE MAXIMUM EXTENT PERMITTED BY APPLICABLE LAW, EACH INFORMATION PROVIDER EXPRESSLY DISCLAIMS ALL
IMPLIED WARRANTIES (INCLUDING, WITHOUT LIMITATION, ANY IMPLIED WARRANTIES OF ORIGINALITY, ACCURACY, TIMELINESS, NON-INFRINGEMENT, COMPLETENESS, MERCHANTABILITY AND FITNESS FOR A PARTICULAR
PURPOSE) WITH RESPECT TO ANY OF THE INFORMATION.
Without limiting any of the foregoing and to the maximum extent permitted by applicable law, in no event shall any Information Provider have any liability regarding any of the Information for any direct, indirect, special, punitive,
consequential (including lost profits) or any other damages even if notified of the possibility of such damages. The foregoing shall not exclude or limit any liability that may not by applicable law be excluded or limited, including without
limitation (as applicable), any liability for death or personal injury to the extent that such injury results from the negligence or willful default of itself, its servants, agents or sub-contractors.
Information containing any historical information, data or analysis should not be taken as an indication or guarantee of any future performance, analysis, forecast or prediction. Past performance does not guarantee future results.
The Information should not be relied on and is not a substitute for the skill, judgment and experience of the user, its management, employees, advisors and/or clients when making investment and other business decisions. All
Information is impersonal and not tailored to the needs of any person, entity or group of persons.
None of the Information constitutes an offer to sell (or a solicitation of an offer to buy), any security, financial product or other investment vehicle or any trading strategy.
It is not possible to invest directly in an index. Exposure to an asset class or trading strategy or other category represented by an index is only available through third party investable instruments (if any) based on that index. MSCI does
not issue, sponsor, endorse, market, offer, review or otherwise express any opinion regarding any fund, ETF, derivative or other security, investment, financial product or trading strategy that is based on, linked to or seeks to provide an
investment return related to the performance of any MSCI index (collectively, “Index Linked Investments”). MSCI makes no assurance that any Index Linked Investments will accurately track index performance or provide positive
investment returns. MSCI Inc. is not an investment adviser or fiduciary and MSCI makes no representation regarding the advisability of investing in any Index Linked Investments.
Index returns do not represent the results of actual trading of investible assets/securities. MSCI maintains and calculates indexes, but does not manage actual assets. Index returns do not reflect payment of any sales charges or fees
an investor may pay to purchase the securities underlying the index or Index Linked Investments. The imposition of these fees and charges would cause the performance of an Index Linked Investment to be different than the MSCI
index performance.
The Information may contain back tested data. Back-tested performance is not actual performance, but is hypothetical. There are frequently material differences between back tested performance results and actual results
subsequently achieved by any investment strategy.
Constituents of MSCI equity indexes are listed companies, which are included in or excluded from the indexes according to the application of the relevant index methodologies. Accordingly, constituents in MSCI equity indexes may
include MSCI Inc., clients of MSCI or suppliers to MSCI. Inclusion of a security within an MSCI index is not a recommendation by MSCI to buy, sell, or hold such security, nor is it considered to be investment advice.
Data and information produced by various affiliates of MSCI Inc., including MSCI ESG Research LLC and Barra LLC, may be used in calculating certain MSCI indexes. More information can be found in the relevant index methodologies
on www.msci.com.
MSCI receives compensation in connection with licensing its indexes to third parties. MSCI Inc.’s revenue includes fees based on assets in Index Linked Investments. Information can be found in MSCI Inc.’s company filings on the
Investor Relations section of www.msci.com.
MSCI ESG Research LLC is a Registered Investment Adviser under the Investment Advisers Act of 1940 and a subsidiary of MSCI Inc. Except with respect to any applicable products or services from MSCI ESG Research, neither MSCI
nor any of its products or services recommends, endorses, approves or otherwise expresses any opinion regarding any issuer, securities, financial products or instruments or trading strategies and MSCI’s products or services are not
intended to constitute investment advice or a recommendation to make (or refrain from making) any kind of investment decision and may not be relied on as such. Issuers mentioned or included in any MSCI ESG Research materials
may include MSCI Inc., clients of MSCI or suppliers to MSCI, and may also purchase research or other products or services from MSCI ESG Research. MSCI ESG Research materials, including materials utilized in any MSCI ESG Indexes
or other products, have not been submitted to, nor received approval from, the United States Securities and Exchange Commission or any other regulatory body.
Any use of or access to products, services or information of MSCI requires a license from MSCI. MSCI, Barra, RiskMetrics, IPD and other MSCI brands and product names are the trademarks, service marks, or registered trademarks of
MSCI or its subsidiaries in the United States and other jurisdictions. The Global Industry Classification Standard (GICS) was developed by and is the exclusive property of MSCI and Standard & Poor’s. “Global Industry Classification
Standard (GICS)” is a service mark of MSCI and Standard & Poor’s.
12Responsible Investment Agenda 2020
5 February 2020
By Erin Levey – Vice President, Client Services, Asia Pacific
ISS-ESG.COMRI IN 2019
SOCIAL LICENSE AND BROKEN CONSUMER PROMISES
B E T T E R T R A N S PA R E N C Y Vale Facebook Uber
Consumers and stakeholders demand
a higher level of transparency as the
Poor human
far-reaching impacts of corporate Infringement of
privacy
rights due Health
diligence impacts
behaviour become abundantly clear Health impacts Poor human rights due Anti-competitive
diligence behaviour
Poor labour standards
Alphabet
Amazon
M O S T C O N T R O V E R S I A L C O M PA N I E S Infringement of privacy
Poor labour
standards
• Vale • Uber • Amazon Poor Poor human Poor human Poor human
environmental due rights due rights due Anti-competitive rights due
• Facebook • Alphabet diligence diligence diligence behaviour diligence Health impacts
2RI IN 2019
SOCIAL LICENSE AND BROKEN CONSUMER PROMISES
ESG TRENDS
ENVIRONMENT SOCIAL GOVERNANCE
Bribery
Pollution 50%
60% Health impacts
40% 40%
50%
40% 30%
30% 20% 20%
Infringement of Poor human rights due
20%
Poor privacy diligence 10% Anti-
Depl etion of 10% Accounting
0% environmental 0% 0% competitive
biodiversity Fraud
due diligence behaviour
Discriminati on Poor labour standards
Climate
change Money
Source: ISS ESG Source: ISS ESG laundering
Source: ISS ESG
3CLIMATE CRISIS
T H E S TA N D O U T LO N G - T E R M R I S K T H AT T H E WO R L D I S FA C I N G
A R E C O M PA N I E S P R E PA R E D ?
of global companies are considered well
6% positioned to mitigate climate risk and
seize opportunities related to the
transition to a low-carbon economy
97%
of Australian listed companies don’t
demonstrate strong action to reduce
climate impacts
4CLIMATE CRISIS
T H E S TA N D O U T LO N G - T E R M R I S K T H AT T H E WO R L D I S FA C I N G
WHERE TO FOR INVESTORS?
• Collaborative action via Australian Sustainable
Finance Initiative (ASFI)
• TCFD – a tool to assess the climate risks of
portfolios
• Shareholder democracy and climate voting policies
5PLASTIC
TURNING THE TIDE ON POLLUTION
W H AT
• Global plastic supply chains of growing
environmental concern, with very little plastic
recycled and most plastic waste ultimately
stranded
• Multiple issues being tackled include lack of
accountability throughout supply chains and lack of
sustainable or recyclable alternatives
• The plastic waste problem thus presents an
opportunity to invest in the development of
sustainable plastic alternatives in a market that has
no choice but to transition
6PLASTIC
TURNING THE TIDE ON POLLUTION
C O N S I D E R AT I O N S F O R I N V E S T O R S
• Companies with high plastic consumption now face increasing risks, both
operational and reputational
• Seek disclosure and commitments related to plastic waste consumption,
particularly from companies in high-risk industries
• New and promising investment opportunities are emerging in the plastic-
alternative space
7LIVE ANIMAL EXPORT
AN ARISING CONTROVERSY
W H AT
• Existing animal rights concerns over the export of live
animals amplified by media footage in recent years
exposing cruelty in the industry
• The live export industry faces mounting pressure to
modify its practices, either by stopping altogether or
improving conditions
• Companies involved, either directly or indirectly,
should expect increased scrutiny and face manifold
risks
8LIVE ANIMAL EXPORT
AN ARISING CONTROVERSY
E N G A G E W I T H C O M PA N I E S
• Transparency regarding involvement in the industry, whether direct or indirect
• If involved, transparency regarding treatment of animals
• Measures to address welfare concerns, such as policies and commitments
9WANT TO KNOW MORE?
D O W N L O A D T H E F U L L R I A G E N D A 2 0 2 0 R E P O R T:
https://www.issgovernance.com/governance-exchange/white-papers/
FOLLOW US ON SOCIAL MEDA:
T: @ CAERESGResearch
L: @ ISS Caer ESG Research
10ISS – CANBERRA
Level 5, 131 City Walk
Canberra City ACT 2601
Australia
ISS – SYDNEY
Suite 102, Level 1, 56 Pitt Street
Sydney NSW 2000
Australia
I S S - E S G . C O MESG Trends to watch: 2020
Key trends in sustainable investing
Helena Fung, Head of Sustainable Investment APAC, FTSE Russell
ftserussell.com 5 February, 2020
FTSE Russell 1FTSE Russell is not an investment firm and this presentation is not advice about any investment activity. None of the information in this presentation or reference to a FTSE Russell index constitutes an offer to buy or sell, or a promotion of a security. This presentation is solely for informational purposes. Accordingly, nothing contained in this presentation is intended to constitute legal, tax, securities, or investment advice, nor an opinion regarding the appropriateness of making any investment through our indexes. Views expressed are subject to change. These views do not necessarily reflect the opinion of FTSE Russell or London Stock Exchange Group plc. FTSE Russell 2
Growing institutional investor desire to address
climate risk
Range of approaches to analyze and integrate climate risk into the
investment process – fundamentally driven by carbon emission data

                                   CARBON                                                            LOW                  GREEN                     FORWARD
                                    FOOT            ENGAGEMENT               DIVESTMENT            CARBON            THEMATIC/IMPACT                LOOKING /
                                   PRINTING                                                        TILTING              INVESTING                “2OC” INVESTING

                                                            CLIMATE CHANGE ACTIVITIES UNDERTAKEN BY PRI SIGNATORIES 1

                             60%
 Percentage of respondents

                                                                                                                                                     Investment Managers
                             50%
                                                                                                                                                     Asset Owners
                             40%
                             30%
                             20%
                             10%
                             0%
                                   Used emissions data or    Sought climate      Sought climate change   Reduced portfolio      Targeted low carbon or Established a climate
                                      analysis to inform  supportive policy from     integration by    exposure to emission        climate resilient    change sensitive or
                                    investment decision       governments              companies       intensive or fossil fuel      investments           climate change
                                           ma king                                                            holdings                                    integrated asset
                                                                                                                                                         allocation strategy

Source: 1) Investor action on climate change, UN Principles for Responsible Investment & Novethic, 2017.

FTSE Russell                                                                                                                                                                   3
EU Green Taxonomy
Defining green
Taxonomy of green activities to achieve six environmental objectives
• Provide market clarity on ‘green’ and mobilise capital
• Intended for use across asset classes and with upcoming regulation on green
investment products
• To date only 1 of the 6 objectives covered, climate change mitigation, with
adaptation soon to come
EU Environmental Objectives “If Europe is to mobilise capital at scale
for sustainable development, it needs a
1. Climate change mitigation
technically robust classification system
2. Climate change adaptation to establish market clarity on what is
3. Sustainable use and protection of ‘sustainable’. This system would cover
water and marine resources a wide range of activities, investments
and assets that can be clearly linked to
4. Transition to a circular economy, the Paris Agreement and the
waste prevention and recycling Sustainable Development Goals
5. Pollution prevention & control (SDGs).”
First recommendation of EU High-Level Expert
6. Protection of healthy ecosystems Group on Sustainable Finance
FTSE Russell 4How is the market responding?
The transition to a low-carbon economy is well underway
Growing
Global green economy
$4tn
Grown as a
proportion of the
market cap weighted by
total market, whilst green revenue share
the fossil fuels sector
has shrunk
Substantial Diversified
Represents 6% of Represents all
3,000
the market company sizes;
Global companies with
capitalization of small, mid and large exposure to the green economy
global listed cap
companies*
Growth of company exposure
+20% to the green economy on
2009
Multifaceted Outperforming
Diverse industries FTSE Russell’s
and sectors green indexes have
addressing outperformed their
environmental parent benchmark
challenges over the last 5
years**
Global
Broad geographical
coverage with US
having the largest
exposure
* Based on FTSE Russell’s calculations. See FTSE Russell’s annual trends report, “Investing in the global green economy: busting common myths”, May 2018
** FTSE Russell’s broadest green focused indexes outperforming over 5 years to March 2018
FTSE Russell 5Green Revenues (GR) – What do companies
manufacture?
FTSE GR classification: 8 sectors / 60
subsectors
>98% of total global market cap. (FTSE GEIS)
Universe of 13,500 public companies
Companies can map to >1 sector / subsector
c. 3,000 cos. generating GRs
FTSE Russell 6Integrating climate considerations
An evolving landscape
• Investor approaches to climate integration are increasing in
sophistication
Managing Managing risks &
risks… opportunities… Transition alignment
7FTSE TPI Climate Transition Index
Overview of index construction
FTSE Russell climate
tilts
FTSE Developed ex-
Apply CW exclusion • Carbon Emissions
Korea Index
• Fossil Fuel Reserves
• Green Revenues
Management Carbon
Quality tilt Performance tilt
• Strong tilt applied to • Meaningful over / FTSE TPI Climate
emphasise MQ under weights applied Transition Index
performance to carbon intensive
companies
8Climate WGBI integrates climate risks in a
comprehensive, robust and transparent manner
Climate Risk = Transition Risk + Physical Risk ~ Resilience
• 50 countries Transition Risk Physical Risk Resilience
quantitatively assessed Index (TRI) Index (PRI)* Index** (RI)
on the three climate risk
pillars (Z scores) • Future carbon • Sea level exposure • Institutional
reduction needed resilience
• The scores for the 22 to meet 20C
• Agricultural
exposure • Social resilience
countries in the WGBI warming
are then used to • Climate related • Economic
• Historic trend in
natural disaster resilience
separately tilt the index carbon emission
exposure
away from the market • Ecological
resilience
value weights
WGBI
TRI PRI RI Climate
Market
Value * Score
Tilt factor 0.25 * Score
Tilt factor 1 * Score
Tilt factor 1
= WGBI
Weight
Weight
* 3 factors assessing the fundamental risk of climate related risk to the country
** 23 environmental, economic, social & development indicators
9Conclusions
NOT AN EXCUSE There is now a lot of data available
FOR INACTION There are a lot of ways to incorporate climate
risk depending on your investment approach
Differences in outcomes shouldn’t stifle debate
NEED FOR Understanding what it means and tailoring to
TRANSPARENCY investment approach
ON THE DATA One size doesn’t fit all
ENGAGEMENT IS Engage with companies, regulators,
KEY governments on risk
Greater disclosure will improve the whole
approach
EVOLUTION OF Whole sector becoming more sophisticated as
“LOW CARBON” risks become both greater and more
INVESTMENT acknowledged
FTSE Russell 10helena.fung@ftserussell.com
Important information

© 2020 London Stock Exchange Group plc and its applicable group undertakings (the “LSE Group”). The LSE Group includes (1) FTSE International Limited (“FTSE”), (2) Frank Russell Company
(“Russell”), (3) FTSE Global Debt Capital Markets Inc. and FTSE Global Debt Capital Markets Limited (together, “FTSE Canada”), (4) MTSNext Limited (“MTSNext”), (5) Mergent, Inc. (“Mergent”),
(6) FTSE Fixed Income LLC (“FTSE FI”), (7) The Yield Book Inc (“YB”) and (8) Beyond Ratings S.A.S. (“BR”). All rights reserved.

FTSE Russell® is a trading name of FTSE, Russell, FTSE Canada, MTSNext, Mergent, FTSE FI, YB and BR. “FTSE®”, “Russell®”, “FTSE Russell®”, “MTS®”, “FTSE4Good®”, “ICB®”,
“Mergent®”, “The Yield Book®”, “Beyond Ratings®“ and all other trademarks and service marks used herein (whether registered or unregistered) are trademarks and/or service marks owned or
licensed by the applicable member of the LSE Group or their respective licensors and are owned, or used under licence, by FTSE, Russell, MTSNext, FTSE Canada, Mergent, FTSE FI, YB or BR.
FTSE International Limited is authorised and regulated by the Financial Conduct Authority as a benchmark administrator.

All information is provided for information purposes only. All information and data contained in this publication is obtained by the LSE Group, from sources believed by it to be accurate and reliable.
Because of the possibility of human and mechanical error as well as other factors, however, such information and data is provided “as is” without warranty of any kind. No member of the LSE
Group nor their respective directors, officers, employees, partners or licensors make any claim, prediction, warranty or representation whatsoever, expressly or impliedly, either as to the accuracy,
timeliness, completeness, merchantability of any information or of results to be obtained from the use of the FTSE Russell products, including but not limited to indexes, data and analytics or the
fitness or suitability of the FTSE Russell products for any particular purpose to which they might be put. Any representation of historical data accessible through FTSE Russell products is provided
for information purposes only and is not a reliable indicator of future performance.

No responsibility or liability can be accepted by any member of the LSE Group nor their respective directors, officers, employees, partners or licensors for (a) any loss or damage in whole or in part
caused by, resulting from, or relating to any error (negligent or otherwise) or other circumstance involved in procuring, collecting, compiling, interpreting, analysing, editing, transcribing, transmitting,
communicating or delivering any such information or data or from use of this document or links to this document or (b) any direct, indirect, special, consequential or incidental damages whatsoever,
even if any member of the LSE Group is advised in advance of the possibility of such damages, resulting from the use of, or inability to use, such information.

No member of the LSE Group nor their respective directors, officers, employees, partners or licensors provide investment advice and nothing contained herein or accessible through FTSE Russell
products, including statistical data and industry reports, should be taken as constituting financial or investment advice or a financial promotion.

Past performance is no guarantee of future results. Charts and graphs are provided for illustrative purposes only. Index returns shown may not represent the results of the actual trading of
investable assets. Certain returns shown may reflect back-tested performance. All performance presented prior to the index inception date is back-tested performance. Back-tested performance is
not actual performance, but is hypothetical. The back-test calculations are based on the same methodology that was in effect when the index was officially launched. However, back- tested data
may reflect the application of the index methodology with the benefit of hindsight, and the historic calculations of an index may change from month to month based on revisions to the underlying
economic data used in the calculation of the index.

This document may contain forward-looking assessments. These are based upon a number of assumptions concerning future conditions that ultimately may prove to be inaccurate. Such forward-
looking assessments are subject to risks and uncertainties and may be affected by various factors that may cause actual results to differ materially. No member of the LSE Group nor their licensors
assume any duty to and do not undertake to update forward-looking assessments.

No part of this information may be reproduced, stored in a retrieval system or transmitted in any form or by any means, electronic, mechanical, photocopying, recording or otherwise, without prior
written permission of the applicable member of the LSE Group. Use and distribution of the LSE Group data requires a licence from FTSE, Russell, FTSE Canada, MTSNext, Mergent, FTSE FI, YB,
BR and/or their respective licensors.

FTSE Russell                                                                                                                                                                                               12
About FTSE Russell

FTSE Russell is a leading global index provider creating and managing a
                                                                                To learn more, visit ftserussell.com;
wide range of indexes, data and analytic solutions to meet client needs         email info@ftserussell.com; or call
across asset classes, style and strategies. Covering 98% of the investable      your regional Client Service Team
market, FTSE Russell indexes offer a true picture of global markets,            office:
combined with the specialist knowledge gained from developing local
                                                                                EMEA
benchmarks around the world.
                                                                                +44 (0) 20 7866 1810
FTSE Russell index expertise and products are used extensively by
                                                                                North America
institutional and retail investors globally. For over 30 years, leading asset
                                                                                +1 877 503 6437
owners, asset managers, ETF providers and investment banks have
chosen FTSE Russell indexes to benchmark their investment performance           Asia-Pacific
and create investment funds, ETFs, structured products and index-based          Hong Kong +852 2164 3333
                                                                                Tokyo +81 3 4563 6346
derivatives. FTSE Russell indexes also provide clients with tools for asset
                                                                                Sydney +61 (0) 2 8823 3521
allocation, investment strategy analysis and risk management.
A core set of universal principles guides FTSE Russell index design and
management: a transparent rules-based methodology is informed by
independent committees of leading market participants. FTSE Russell is
focused on index innovation and customer partnership applying the highest
industry standards and embracing the IOSCO Principles. FTSE Russell is
wholly owned by London Stock Exchange Group.
For more information, visit ftserussell.com.

FTSE Russell                                                                                                            13
ftserussell.com
Thank you for attending the webinar

A link to view the recording and download
slides will be emailed to all RIAA
Members.

Responsible Investment
Association Australasia
You can also read