Caring for the Air 2020 - In this issue - Metro Vancouver
←
→
Page content transcription
If your browser does not render page correctly, please read the page content below
Caring for the Air
                                        2020

        In this issue

        Climate leadership

        Be part of the Clean Air Plan

         hat the new wood smoke bylaw
        W
        could mean for you
Message from the Chair
                       Caring for the Air is Metro            Challenging times bring out our resiliency, and this year’s
                       Vancouver’s annual report on           report was prepared in early 2020 during the COVID-19
                       air quality and climate action         pandemic response. While there are indications of
                       initiatives in our region.             significant global changes in air quality levels and much
                       It describes the good air quality      discussion on the benefits of good air quality on public
we enjoy in this region, the actions we have taken to         health and resiliency, next year’s edition of Caring for
improve air quality over time and how our programs            the Air will examine in more detail how this response
have evolved in response to new challenges, like climate      affected air quality in Metro Vancouver.
change and wildfires.
                                                              Together we make our region strong.
For the past twenty years, Metro Vancouver has been
leading the fight against climate change. Climate 2050,
Metro Vancouver’s climate change strategy for the
region, is taking bold steps to accelerate actions to adapt
to climate change and reduce GHG emissions with a             Sav Dhaliwal
commitment to be a carbon neutral region by 2050.             Chair, Metro Vancouver Board

Contents
New Wood Smoke Bylaw Sparks Changes_______1                   Actions to Cut Short-lived Climate Forcers______11
Help Us Create a Clean Air                                    Air Quality Complaints in Numbers_____________12
and Carbon Neutral Region ___________________2
                                                              How Does Metro Vancouver Assess Odours?____13
Healthy Air at Daycares________________________4
                                                              Improved Targets for Cleaner Air_______________14
The Trouble With Truck Traffic__________________5
                                                              Air Quality in 2019___________________________15
The Promise and Peril of Ride-hailing
in Metro Vancouver___________________________6                Network News______________________________18

Charging Up at Metro Vancouver’s Head Office___7              Understanding VOC__________________________19

Climate Leadership at Metro Vancouver_________8               How Are VOC Emissions Changing?____________20

Adapting Our Buildings to a Future Climate_____10             Turning Food Waste into Fuel_________________21

                                                                      The Lower Fraser Valley airshed
                                                                      Air pollutants can travel between Metro Vancouver
                                                                      and surrounding areas. Managing air quality
                                                                      successfully requires effective collaboration with our
                                                                      neighbours and other levels of government, and
                                                                      participation from businesses, public institutions,
                                                                      non-government organizations and residents.
                                                                      Articles in this publication reflect this cooperation.
New Wood Smoke Bylaw Sparks Changes
This spring, Metro Vancouver took another step to improve our air quality by adopting a bylaw
to reduce emissions from residential wood burning. But what does this mean if you use a wood
burning appliance to heat your home?

Why focus on wood smoke?                                       What should I do with my wood burning stove
Residential indoor wood burning is responsible for             or fireplace?
more than a quarter of our region’s fine particle              Metro Vancouver runs an exchange program which
emissions. Fine particles in wood smoke can have               allows residents to apply for a rebate when they
negative impacts on our health, particularly for               replace their uncertified wood burning stove or
infants, the elderly and people with existing lung and         fireplace with a new, lower emission unit.
heart conditions. In addition, as part of the COVID-19
response, public health authorities recommended                Metro Vancouver hosts wood heat workshops which
reducing air pollution, such as excess wood smoke,             provide residents with tips to maximize the efficiency
in populated areas because of strong evidence that             of wood burning appliances and minimize emissions.
exposure to air pollution increases susceptibility to          These free workshops also provide information on
respiratory viral infections. This underscores how this        wood heating system maintenance and firewood
bylaw can help protect the health of the population.           preparation.
Wood smoke is also a source of black carbon, which             To learn more about the bylaw and the wood stove
is associated with climate change, and can contain             exchange program, visit metrovancouver.org and
toxic air pollutants.                                          search for ‘residential wood burning’.

New bylaw
                               PHASE 1                           PHASE 2                        PHASE 3
The new bylaw aims to
                               May 2021                        September 2022                 Sept. 2025*
reduce the health and
                               Restrictions on indoor wood     Declaration of use of best     Restrictions on use of
environmental impacts of
                               burning during the warm         burning practices in all       non-registered devices
emissions from residential
                               season, unless it is the sole   areas, registration of clean   within Urban Containment
indoor wood burning
                               source of heat                  wood burning appliances        Boundary (except for low
using a phased approach.
                                                               within Urban Containment       income households)
                                                               Boundary

                                                                                                           *2032 in Lions Bay

                                                                                                         Caring for the Air 2020   1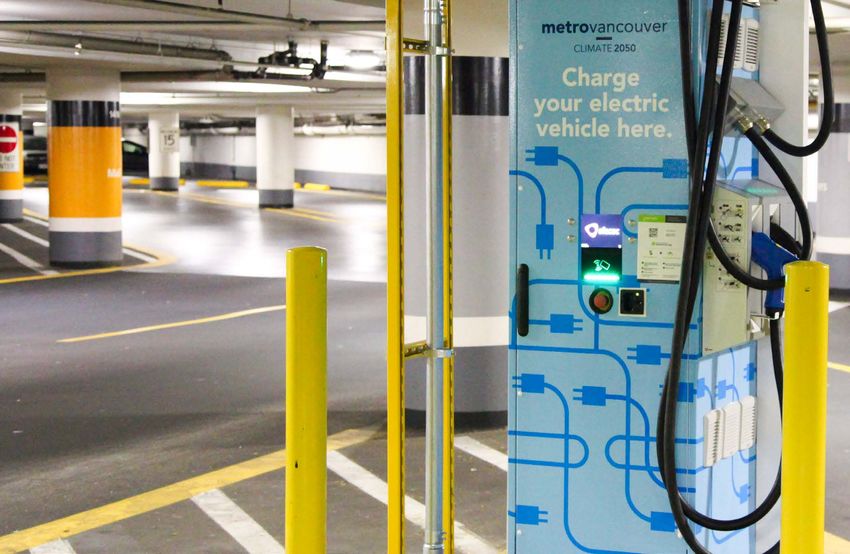
Help Us Create a Clean Air
                                                                                                                   The Clean Air Plan will build on existing Metro
                                                                                                                   Vancouver air quality and greenhouse gas programs             How can I participate?
                                                                                                                   and policies. It will also be shaped by similar initiatives   Engagement approaches will focus on online
                                                                                                                   by others, such as the provincial CleanBC plan and            and digital tools, including webinars and online

and Carbon Neutral Region                                                                                          local municipalities’ sustainability, environment,
                                                                                                                   climate and energy plans. Governments, residents and
                                                                                                                   businesses will need to work and plan collaboratively
                                                                                                                                                                                 feedback.

                                                                                                                                                                                 For more information and to join our
                                                                                                                                                                                 mailing list, visit www.metrovancouver.org
                                                                                                                   to ensure we achieve our goals.
Metro Vancouver residents and businesses are            The Clean Air Plan will be Metro Vancouver’s next air                                                                    and search for ‘Clean Air Plan’, email
worried about the impacts of climate change and         quality and greenhouse gas management plan, and will       Metro Vancouver has engaged the public,                       CleanAirPlan@metrovancouver.org,
poor air quality in our region and around the world.    support this acceleration. The plan will include goals,    stakeholders and other governments over the past six          or call 604-432-6200.
Fortunately, solutions and progress are possible, by    targets and actions to help achieve regional ambient       months on the goals, targets, strategies and actions to
improving technologies and changing how we live,        air quality objectives (see page 14) and reduce regional   include in the Clean Air Plan and Climate 2050.
                                                                                                                                                                                 Why tackle air quality and climate
work, study and play. Change can be challenging, yet    greenhouse gas emissions by 45% from 2010 levels by        A draft Clean Air Plan should be available for
                                                                                                                                                                                 change together?
we must accelerate our actions in the region to avoid   2030. Actions could include incentives, educational        comment and feedback later in 2020, with adoption of
                                                                                                                   the final Clean Air Plan in early 2021.                       Climate change and air quality are strongly linked,
dangerous levels of climate change and to protect       outreach campaigns and regulations.
                                                                                                                                                                                 since many major sources of greenhouse gases
public health. Actions must be grounded in scientific                                                              While the challenges are large, solutions are possible,
                                                        The plan will also support Climate 2050                                                                                  in the region are also major sources of health-
evidence and recognize a public desire to see a                                                                    so we can make our region more livable than ever.
                                                        (see www.metrovancouver.org/climate2050),                                                                                harming air contaminants. The Clean Air Plan will
bolder vision and faster timelines.
                                                        Metro Vancouver’s overarching 30-year strategy                                                                           aim to maximize co-benefits by targeting emission
                                                        for becoming a carbon neutral and climate                                                                                sources that emit both types of air contaminants.
                                                        resilient region.

2   Caring for the Air 2020                                                                                                                                                                                           Caring for the Air 2020   3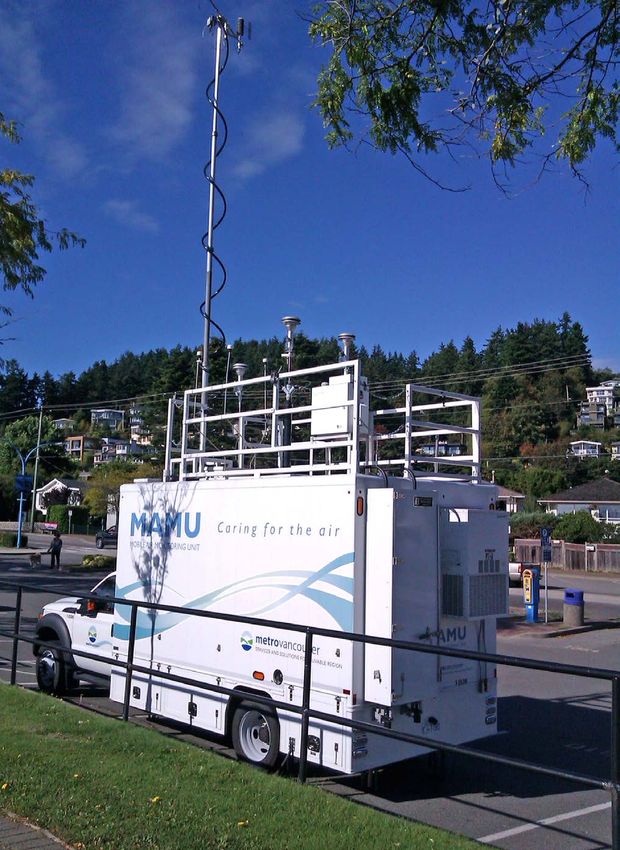
Healthy Air
at Daycares
Healthy air and outdoor physical activity at
daycares promote healthy child development.
Children breathe faster than adults so
are more sensitive to poor air quality. Air
pollution, such as from traffic and wildfire
smoke, can damage health and development,
especially in children with chronic respiratory
illnesses like asthma.

Features that can reduce children’s exposure to air
pollutants include:

•   Daycares and outdoor play areas located far away
    from traffic – especially heavy duty truck routes,
    major intersections and uphill acceleration zones.

•   Ventilation system air intakes and windows that
    open for air flow located away from roads and other
    air pollution sources.                                  during wildfire smoke or air quality health alerts.
•   Well-sealed buildings and windows to prevent            Walking or biking to daycare offers benefits while
    outside air pollution from getting into the building.   also reducing vehicle emissions near drop off and
                                                            pick up zones.
•   Well-maintained indoor climate control and air
    quality management systems that can clean and           To learn more about choosing the right daycare,
    cool or heat the space without opening windows on       visit the Vancouver Coastal Health website. The BC
    bad-air days.                                           Centre for Disease Control has excellent resources
                                                            on portable air filters for wildfires and information
•   Keep indoor air as clean as possible, such as with a    about the Air Quality Health Index (AQHI). Air
    well-functioning building air management system         quality information for Metro Vancouver communities
    that cleans and cools the space without opening         is available 24/7 on AirMap.ca. You can also stay
    the windows on bad-air days, or use correctly-sized     informed by signing up for air quality alerts in Metro
    portable air cleaners with HEPA air filters.            Vancouver and the Lower Fraser Valley or elsewhere
                                                            in BC for periods of heightened wildfire smoke risk, or
Despite urban air quality concerns, there are well-         download the BC Wildfire Service app.
known health benefits to children being outside and
active as much as possible during the day, except           Courtesy of Vancouver Coastal Health

4   Caring for the Air 2020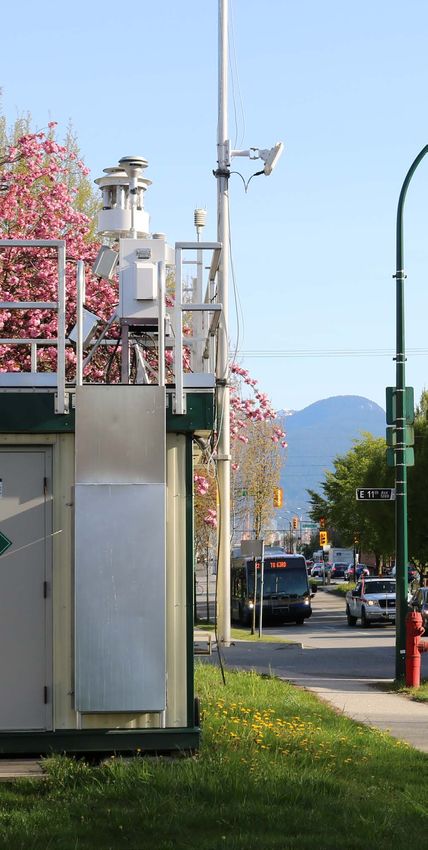
The Trouble With Truck Traffic
Exposure to traffic-related air pollution is a significant
public health issue in Canada. Despite improvements
in vehicle emissions, Canada’s urban areas, population
and vehicle use continue to grow. In Metro Vancouver,
over one million people – nearly half the population
– live within 250 metres of a major road. Living or
spending time near a major roadway poses health
risks, including breathing and heart problems.

The Metro Vancouver Near-Road Air Quality
Monitoring Study was carried out as part of a national
study with Environment and Climate Change Canada,
the Ontario Ministry of the Environment, Conservation
and Parks and the University of Toronto. Air quality
was measured over two years near Clark Drive, a busy
car and truck route in Vancouver.

Vehicles emit air pollutants from the combustion of
fuel, as well as brake and tire wear. Results showed
that air quality tends to be poorer near major
roadways than in locations away from traffic. On
occasion, pollutant levels measured at the near-
road site were worse than Metro Vancouver’s annual
air quality objectives for nitrogen dioxide and fine
particulate matter. Other pollutants associated with
traffic, including black carbon and ultrafine particles,
were also elevated. The study showed that vehicle
type, particularly large diesel-fueled trucks, rather than
traffic volume, is a major contributor to the amount         Metro Vancouver will continue to monitor air quality
and type of pollution associated with busy roadways.         at Clark Drive to further understand the impacts of
                                                             traffic-related air pollutants and track changes. Current
A program to reduce emissions and exposure to                measurements are available on Airmap.ca.
traffic-related air pollutants will be an action of the
new Clean Air Plan. This will require land use policy,       For more information on nitrogen dioxide, visit
infrastructure design and transportation management          metrovancouver.org and search for ‘NOxFactsheet.’
strategies as well as support from other governments,        For information on fine particulate matter, visit
from individual municipalities to the federal level.         metrovancouver.org and search for ‘PMFactsheet.’

                                                                                                    Caring for the Air 2020   5
The Promise and Peril of Ride-hailing
in Metro Vancouver
In January 2020, after years of deliberation, ride-                 Reducing greenhouse gases from cars and trucks
hailing companies were given the green light to                     is a high priority for local, regional and provincial
operate in Metro Vancouver. New provincial legislation              governments. Without clear reduction targets,
allows companies such as Uber, Lyft and TappCar to                  ride-hailing may work against our climate targets.
operate passenger cars on roads that had previously                 The good news is that a transition to low carbon
been dominated by taxis. The service is convenient,                 ride-hailing is possible. Over the next three years
relatively affordable and can reach areas less served               in California, ride-hailing companies will be required
by public transit, but recent studies in the United                 to track, report and manage their greenhouse gas
States point to an increase in kilometres travelled in              emissions. Electric vehicle pilot projects in Austin,
vehicles because of ride-hailing.                                   Seattle and Atlanta have met service needs while
                                                                    providing a better financial return. Investments in
To compete with the convenience of taxis, ride-hailing              charging infrastructure and access to electric vehicles
vehicles will pick up on request. This means that unlike            would be needed to scale up these projects.
carpools or ride-shares, they drop off a customer and
then drive to the next pickup location empty, creating              In BC, while local governments are exploring tools to
congestion and emissions. This “deadheading”                        lower greenhouse gases from ride-hailing, the province
can account for 20% to 50% of the vehicle’s travel,                 is best-positioned to ensure ride-hailing companies
according to studies in New York and San Francisco.                 actively take steps to address their emissions.

                                                                                 56,000 tonnes
    Ride-hailing results in Seattle
                                                                                 of greenhouse

    2018
                                                                                 gases emitted

                              260 million kilometres travelled                   23.4 million litres of gasoline used

THESE NUMBERS DO NOT INCLUDE WHEN THE VEHICLE IS NOT CARRYING A PAYING CUSTOMER, WHICH CAN ACCOUNT FOR 20-50% OF THE VEHICLE'S TRAVEL.

                                                                                                                Courtesy of TransLink
6   Caring for the Air 2020
Charging Up at
Metro Vancouver’s
Head Office
Electric vehicle (EV) charging takes many                 Like many local employers, Metro Vancouver has also
forms. People can charge at home, at work, or             installed a cluster of pay-per-use level 2 charging
                                                          stations for staff and head office tenants. These
on the go, using a variety of charging station
                                                          stations offer a reliable option for a top-up charge or
options. Two different types of EV charging
                                                          for people whose home charging options are limited.
stations were installed at Metro Vancouver’s
head office in 2019: direct current fast                  The most common practice in BC has been to provide
                                                          charging for free; however, charging station hosts are
charging and level 2 charging.
                                                          increasingly looking to set fees for charging to recover
                                                          costs and encourage turnover at chargers. At Metro
Direct current fast charging stations, known as DCFCs     Vancouver’s head office, while level 2 station users pay
or level 3 stations, are the equivalent of gas stations   by the hour, the DCFC station employs a distinctive
for EVs. They offer users the convenience of charging     two-tiered pricing system. Users are charged by the
up for long distances in a relatively short time. The     minute, and after the first 30 minutes of charging, a
new publicly accessible DCFC station, located in the      higher tier price is initiated to encourage turnover and
underground parkade at Metropolis at Metrotown,           make the station available to more users.
is open 24/7, on a first-come, first-served basis. The
station is multi-standard, enabling it to charge the      The recent installation of EV charging stations at
majority of EV models currently available. It can         Metro Vancouver’s Head Office makes it easier than
provide enough charge in 30 minutes for an EV to          ever to charge an EV. Metro Vancouver’s DCFC and
travel over 100 km.                                       level 2 charging offer options to encourage EV use
                                                          and reduce transportation emissions.

                                                                                                 Caring for the Air 2020   7
Climate Leadership at
                                                                                                                                                                                             North Shore Wastewater Treatment Plant Rendering

Metro Vancouver
Responding to the impacts of climate change is a big challenge.
This challenge requires urgent action, but with climate science
                                                                        The Intergovernmental Panel on
constantly evolving, our approach needs to be adaptive. Until
                                                                        Climate Change (IPCC) is the United
recently, Metro Vancouver was targeting an 80% reduction in
                                                                        Nations body that provides regular
greenhouse gases (GHG) by the year 2050. Based on the most up
                                                                        assessments of the scientific basis
to date science from the IPCC, we are now going further, targeting
                                                                        of climate change, its impacts and
a carbon neutral region by 2050, with a shorter-term target of
                                                                        future risks, as well as options for
reducing GHG emissions by 45% from 2010 levels by 2030.
                                                                        adaptation and mitigation.
By setting ourselves on this path towards carbon neutrality, Metro
                                                                        A carbon neutral region is a region
Vancouver is poised to help limit global temperature rise to 1.5°C
                                                                        that has achieved the deepest           Projects that reduce emissions from Metro                     Metro Vancouver’s CARIP refund is re-invested in
above pre-industrial levels and to avoid more severe climate impacts.
                                                                        greenhouse gas emissions reductions     Vancouver’s operations:                                       local climate action. It supports corporate climate
As we strive to be a leader in reducing GHG emissions, we know          possible across all economic sectors,
                                                                                                                •   Electric vehicle charging stations are available at our   projects, but it also funds projects that help
that we will not be able to do it alone. No single organization can     and removes or captures sufficient
                                                                                                                    head office, see page 7 for more information              communities reduce their carbon footprint:
achieve the necessary reductions without significant cooperation,       carbon dioxide to balance any
                                                                        remaining regional greenhouse                                                                         •   The Emotive campaign raises awareness of electric
collaboration and commitment from other governments, partner                                                    •   A demonstration project has been initiated on
                                                                        gas emissions.                                                                                            vehicles, which can significantly reduce greenhouse
organizations, stakeholders and the public.                                                                         hydrothermal processing, to convert a waste
                                                                                                                                                                                  gas emissions by taking advantage of BC’s clean,
                                                                                                                    product (wastewater treatment plant residuals) to a
Fortunately, the B.C. government’s Climate Action Revenue                                                                                                                         renewable electricity. The campaign has introduced
                                                                                                                    biocrude oil that will displace fossil fuel use
Incentive Program (CARIP) is one of several programs that                                                                                                                         thousands of people to electric vehicles, helping
supports our efforts. CARIP provides a carbon tax refund to local                                               •   A Sustainable Infrastructure and Buildings Design             the region and BC lead the way in the transition to
governments, such as Metro Vancouver, that have signed the B.C.                                                     Guide is being developed to help infrastructure and           clean transportation. Check out www.emotivebc.ca
Climate Action Charter, in return for committing to reducing and                                                    building projects meet the highest sustainability             to learn more.
reporting their GHG emissions.                                                                                      standards
                                                                                                                                                                              •   RateOurHome.ca creates awareness of home
                                                                                                                                                                                  energy labels, like the EnerGuide Rating System, to
                                                                                                                Projects that promote complete, compact and
                                                                                                                                                                                  make carbon emissions and energy use in homes
                                                                                                                energy efficient communities:                                     more visible and help in decision making when
                                                                                                                •   The Strata Energy Advisor Pilot Program                       purchasing a home. Home energy labels show
                                                                                                                    provided professional energy advisor services to              how energy efficient a home currently is and how
                                                                                                                    stratas undertaking major building renewal and                it compares to other similar homes. To learn more
                                                                                                                    maintenance projects                                          about adapting buildings to climate change, see
                                                                                                                                                                                  page 10.
                                                                                                                •   Effluent heat recovery at the North Shore
                                                                                                                    Wastewater Treatment Plant will provide unused            To see Metro Vancouver’s latest CARIP report
                                                                                                                    heat to Lonsdale Energy Corporation’s district            and learn about other projects that reduce our
                                                                                                                    energy system, displacing natural gas use                 GHG emissions, visit metrovancouver.org and search
                                                                                                                                                                              for ‘CARIP report’.

8   Caring for the Air 2020                                                                                                                                                                                                 Caring for the Air 2020   9
Adapting Our Buildings to
a Future Climate
Buildings give us shelter, comfort and a place to work and play. They are where we spend most of our lives.
In a changing climate, the design and location of buildings will influence our exposure to climate-related
hazards. In 2050, zero carbon and resilient buildings will be standard practice, but today, many of our buildings
will require significant changes to become resilient to a changing climate.

                                               Hazard: severe wildfire impacts, causing degraded air quality that
                                               contributes to negative health effects.

                                               This means: People will need to spend more time inside to find
                                               clean air.

                                               What we can do about it: Retrofitting some public buildings will
                                               provide clean air refuges. These offer healthier places to go when
                                               outdoor air quality is degraded and are important for residents who
                                               currently cannot retrofit their own homes. Eventually, most buildings
                                               will need to have effective indoor air filtration.

                                               Hazard: heat waves are expected to increase in frequency, duration
                                               and intensity, impacting the region’s most vulnerable residents more
                                               than others.

                                               This means: Demand for cooling will increase on extremely hot days.
                                               Many residents will seek refuge in cooler buildings.

                                               What we can do about it: As temperatures rise, we need to adopt
                                               passive design standards that help to maintain comfortable indoor
                                               temperatures. Air source heat pumps and shading from trees are
                                               affordable low-carbon cooling retrofits for many buildings.

                                               Hazard: seasonal water shortages are expected to increase in
                                               frequency due to rising temperatures and changes in rain and
                                               snowfall.

                                               This means: Residents will face more frequent and stringent water
                                               restrictions.

                                               What we can do about it: Properties need to be designed to
                                               capture and use water efficiently. Ultra-efficient appliances, rainwater
                                               harvesting, and using drought-tolerant, non-invasive plants and trees
                                               will reduce our water consumption.

By proactively adapting our buildings to climate change and incorporating climate risk into land use planning,
we can significantly reduce health and safety risks, and severe financial losses.

10   Caring for the Air 2020
Actions to Cut Short-lived Climate Forcers
Although carbon dioxide (CO2) is the primary cause of climate change, it isn’t the only substance that can
influence our climate. Some air pollutants such as methane, black carbon (soot) and ground-level ozone
(smog) are ‘short-lived climate forcers’. They remain in the atmosphere for a relatively short amount of
time – from a few days to a few years – but have a higher ‘global warming potential’, or ability to warm the
atmosphere, than CO2.
Local government action on short-lived climate forcers
Surrey Biofuel Facility: Vancouver Landfill Gas Biofilter/Biocover
This facility helps divert organic Optimization Project: Opportunities:
waste from landfills, reducing Improving gas capture Adding biosolids from
methane emissions. It generates at landfills helps reduce wastewater treatment plants to
renewable natural gas that methane emissions. This project landfill covers could provide an
displaces fossil fuel use in significantly reduced methane economical and effective way
municipal vehicles. See page 21 release to the atmosphere to decrease methane emissions
for more information. by about 431,000 tonnes from landfills via chemical
CO2-equivalent greenhouse reactions between the biosolids
gas emissions between 2012 and methane. Metro Vancouver
and 2015. is currently testing the use of
biosolids as a biocover/biofilter
at several landfills.
Non-Road Diesel Wood Stove Exchange Program: Regional Ground-Level
Engine Emissions: Residential wood burning is Ozone Strategy:
Metro Vancouver’s non-road another significant source of This strategy builds on
diesel engine regulation helps black carbon emissions in Metro previous work to address peak
reduce harmful emissions of Vancouver. The Wood Stove summertime concentrations
diesel soot from construction Exchange program helps residents and also guides policies to
equipment. replace older wood burning reduce ozone concentrations
appliances with cleaner, low throughout the year.
emissions choices. See page 1
to learn more.
If we act now to reduce methane, soot and ground-level ozone levels, the impacts on our climate, crops, water,
health and ecosystems will be less severe while we work to reduce longer-lived CO2 emissions.
Caring for the Air 2020 11Air Quality Complaints in Numbers
Metro Vancouver uses air quality complaints complainant area if:
submitted by the public to identify new issues.
• We receive complaints when the issue is occurring;
The number of air quality complaints has more than
• We see a trend from an area (such as an increase
doubled since 2015, and staff now handle close to
in the frequency of complaints, or many people
4000 complaints each year (see chart below). More
making similar complaints, over time); or
than 95% of these complaints are about odour.
• We receive multiple similar complaints about a one-
When filing odour complaints, we ask complainants to
time event.
describe the odour as best they can and, if they can,
name a suspected source. This information gives us a Because of the large number of complaints, we do
starting point for follow-up, but we will only designate not call complainants back unless we need more
a source as the probable source if our own assessment information. Our limited staff resources are focused
supports that conclusion. on identifying sources and promoting compliance with
Metro Vancouver’s Air Quality Management Bylaw.
While we can look at location, wind data, odour
description and previously identified sources to For more information on how to provide us with the
determine if a suspect is a probable source, the best information possible, visit metrovancouver.org
best way to verify a source is to visit the complainant and search for ‘complaint tips’.
area. We are more likely to gather information at a
Complaints to Metro Vancouver by suspect
4500
4000 All other suspects
Owner/Occupant
3500
Cannabis
3000 Organics Processing
2500 Unknown
2000
1500
1000
500
0
2013 2014 2015 2016 2017 2018 2019
12 Caring for the Air 2020How Does
Metro Vancouver
Assess Odours?
Metro Vancouver receives more complaints Officers do odour surveys using the currently best
about odour than anything else. Not every available instrument for detecting and identifying
odour: the human nose. Officers become familiar with
complaint can be verified, especially if
many different odours over the course of their field
received after the fact, but when an issue is
work, and most can easily tell the difference between
ongoing, officers may visit the complainant manure, cannabis, composting, garbage, sewage,
area (see page 12). While visible emissions low tide and many of the other odours present in our
such as smoke or dust are easy to observe and environment.
even photograph, identifying an odour source
Officers may occasionally breathe through a carbon
requires additional steps like checking upwind filter to refresh their sense of smell to avoid “odour
and downwind of several possible suspects. fatigue”, which happens because our noses tend to
desensitize to odours over time – think of the aroma
of home that welcomes you as you walk in the door
Odour survey steps
but never notice when you are home all day.
1S
tart at complainant location or if winds have shifted,
find a location downwind of a potential source where To account for shifting winds, which can make
the odour is recognizable. Note whether the odour pinpointing a source more difficult, officers track wind
becomes stronger (easier to smell) or weaker (harder direction and make adjustments as they do their surveys.
to smell) as you move closer to the potential source.
Officers will forward complaints to suspected sources,
2R
epeat with locations downwind to rule out or but generally will not contact the complainants.
confirm other sources.
3 Go upwind of the most likely suspect to rule out or
confirm other sources.
Caring for the Air 2020 13Improved Targets for Cleaner Air
Metro Vancouver uses a variety of tools to manage
air quality in the region, including ambient air quality
objectives. Objectives are targets that define the
outdoor concentrations of key air contaminants that
are generally considered acceptable, based on human
health and environmental impacts. Metro Vancouver
uses ambient air quality objectives to:
• Assess regional and local air quality;
• Support the development of air quality
management plans, such as the Clean Air Plan, and
emission regulations; and
WHY ARE OBJECTIVES IMPORTANT?
• Guide air management decisions, such as issuing Fuel combustion produces nitrogen dioxide
permits and air quality advisories. emissions. On hot and sunny days, nitrogen dioxide
reacts with volatile organic compounds to form
Metro Vancouver’s objectives have historically been
ground-level ozone. There is strong evidence that
amongst the most stringent objectives in Canada.
nitrogen dioxide and ground-level ozone have
We follow a principle of continuous improvement,
negative heart and lung impacts and can shorten
and regularly review our air quality objectives to
life expectancy.
ensure they are in line with the latest science.
Changes on the horizon What do the changes mean for you?
In 2020, new federal objectives, known as Improved air quality objectives help to reduce
Canadian Ambient Air Quality Standards, came negative impacts on your health and the environment
into effect for nitrogen dioxide and ground-level by guiding policies and programs to reduce emissions.
ozone. In addition, the provincial government now Federal objectives will become even more stringent in
has a more stringent objective for carbon monoxide. 2025. The development of actions in the Clean Air Plan
Metro Vancouver has updated regional objectives to (see pages 2 and 3) will help ensure our region’s air
better align with these standards. quality meets or is better than our objectives.
Air Contaminant Averaging Time Previous Objective (ppb) Updated Objective (ppb)
Nitrogen Dioxide Annual 21 17
1-hour 106 60
Ozone 8-hour 65 62
Carbon Monoxide 8-hour 8,700 5,000
1-hour 26,200 13,000
For more information, visit metrovancouver.org and search for ‘ambient air quality objectives’.
14 Caring for the Air 2020Air Quality
in 2019
Metro Vancouver did not issue any air quality Most gas phase air pollutants generally continued to
advisories during the summer of 2019. This contrasts decrease. Sulphur dioxide levels continued to improve,
with the unprecedented number of days under an air mainly due to strict lower sulphur requirements for
quality advisory in the summers of 2017 and 2018. In marine fuels. Average levels of ground-level ozone have
May 2019, smoke in the upper atmosphere from large increased slightly despite reductions in the pollutants
wildfires in northern Alberta produced visual impacts that create it. This is partly due to an increase in ozone
in our region, including orange sunsets, but did formed outside Canada coming into our region. Peak
not affect air quality near the ground. Although the ground-level ozone levels (not shown), which occur
summer started warm and dry, rain in July and August during hot and sunny summer afternoons, are better
helped suppress wildfire activity in British Columbia. now than in the 1980s and early 1990s.
A small wildfire near Lions Bay caused localized
TREND IN FINE PARTICULATE MATTER
impacts in the northern and western parts of the
7
region briefly in June. Wildfires further afield did not
significantly impact air quality in the Lower Mainland. Same air, same air quality,
just new measurements
Furthermore, summer weather conditions did not lead 6
to elevated ground-level ozone concentrations. NEW
An air quality bulletin, which informs residents about 5
air quality issues that are not widespread enough to
OLD
trigger an advisory, was issued in early November. 4
Stagnant weather conditions caused intermittent high
concentrations of fine particulate matter from local
AVERAGE LEVEL COMPARED TO 2008
3
sources. See page 1 to find out how Metro Vancouver
is trying to reduce local sources.
PM2.5 CONCENTRATION (μg/m3)
2008 2009 2010 2011 2012 2013 2014 2015 2016 2017 2018 2019
Air Quality Trends
Trends charts (right) illustrate the change in average
air quality across the region over time. Measurements TRENDS IN GAS PHASE AIR POLLUTANTS
1.4
from monitoring stations located from Horseshoe Bay GROUND LEVEL OZONE
1.2
to Hope are averaged to represent the outdoor air
quality typically experienced in the region. 1.0
NITROGEN DIOXIDE
0.8
Trends show that most air contaminant levels have been
CARBON MONOXIDE
improving over the last decade, even while the region’s 0.6
population has grown. Lower concentrations of fine 0.4
SULPHUR DIOXIDE
particulate matter in 2019 reflect the lack of significant 0.2
wildfire smoke impacts in the region during the summer.
0
Caring for the Air 2020 15Air Quality in 2019 - Data Summary Air Quality in 2019 - Data Summary
FINE PARTICULATE MATTER (PM2.5) IN 2019 SULPHUR DIOXIDE IN 2019
45
32 Fraser Valley Fraser Valley
39 0.1
Regional Regional
District District
0.1
34 27
0.2
26
27 0.2
0.4
28
20
29 0.3 Whatcom County
27
Whatcom County
0.5 0.4 Metro Vancouver
30 23 24
Metro Vancouver 0.3 0.5
32 0.3
32 0.2 0.6
31 0.3 0.4
22
21 0.4 0.3 0.2
30 19
>28 µg/m3 >5 ppb
24-Hour Canadian Ambient Air Quality Standard Metro Vancouver Annual Objective
CANADA USA CANADA USA
Fine particulate matter (PM2.5) levels throughout the region were higher than the 24-hour Canadian Ambient Air Quality Average concentrations of sulphur dioxide for 2019 are shown above with all stations below Metro Vancouver’s annual
Standard (calculated using data from 2017, 2018, and 2019) at nearly half of the monitoring stations (see map above). objective of 5 ppb. Peak levels were better than Metro Vancouver’s 1-hour objective of 70 ppb at all stations in 2019.
This was a result of high concentrations in 2017 and 2018 due to out-of-region wildfires. Measurements averaged over
2019 were within Metro Vancouver’s annual objective.
Peak levels, based on the highest 24-hour average, were worse than the short-term 24-hour objective (25 μg/m3) on the NITROGEN DIOXIDE IN 2019
evening of October 31 at Richmond-South, Langley, Richmond-Airport, Abbotsford-Mill Lake, Mission and Vancouver-
Clark Drive likely due to Halloween firework emissions. The short-term objective was also exceeded on three other days
in November at Richmond-South, Mission and Vancouver-Clark Drive, caused by emissions from local sources, such as 5
7
fireworks, residential wood burning, open burning and transportation, along with stagnant weather conditions. 7
Fraser Valley
Regional
District
GROUND-LEVEL OZONE IN 2019 7
9
7
8
6
65
8
10 9
61
61 Fraser Valley 11 Whatcom County
16
Regional 7
10
12 Metro Vancouver
District 14
13
66 60
12
59 18
16
63
59 12
54 14
7
53 54
49 Whatcom County >17 ppb
48
57
41 49 45
45 Metro Vancouver Metro Vancouver Annual Objective
CANADA USA
48
36 43
48 Nitrogen dioxide concentrations were better than Metro Vancouver’s long-term annual objective (17 ppb) at all
44
49 monitoring stations except Metro Vancouver’s near-road monitoring station, Vancouver-Clark Drive, as shown on the
>62 ppb map above. The highest average nitrogen dioxide concentrations were measured in highly urbanized areas near
Metro Vancouver 8-Hour Objective
busy roads. More than half of the regional emissions of nitrogen oxides (which includes nitrogen dioxide) come from
CANADA USA
transportation sources. In 2019, nitrogen dioxide concentrations were better than Metro Vancouver’s short-term
Ground-level ozone forms when nitrogen oxides and volatile organic compounds react in the air in the presence of objective (60 ppb) at all monitoring stations with the exception of North Vancouver-Second Narrows. Short-term
sunlight. Ground-level ozone concentrations were better than Metro Vancouver’s short-term 1-hour air quality objective measurements of nitrogen dioxide at this station were influenced by local construction activity in 2019.
(82 ppb) at all monitoring stations in 2019. Metro Vancouver’s 8-hour objective (62 ppb) was achieved at all stations except In 2019, Metro Vancouver aligned regional nitrogen dioxide objectives with Canadian Ambient Air Quality Standards
Maple Ridge, Mission and Hope in 2019. The map above shows how 2019 measurements compared to Metro Vancouver’s (see page 14).
8-hour objective.
In 2019, Metro Vancouver aligned its 8-hour ozone objective with the Canadian Ambient Air Quality Standard for ozone
(see page 14).
16 Caring for the Air 2020 Caring for the Air 2020 17Network News
Taking our network to the next level
Metro Vancouver is reviewing the Lower Fraser Valley
Ambient Air Quality Monitoring Network to ensure BIG POTENTIAL IN SMALL SENSORS
the network continues to fulfill the needs of the region Small, low-cost, portable air sensors is one
for the next decade or more. Working with the Fraser emerging, and rapidly growing, air quality
Valley Regional District, the review will identify new monitoring technology. These sensors are popular
and emerging air quality monitoring technology and among citizen scientists to measure air quality
how it may fit within existing network operations, where they live, work and play, but the performance
which also includes a mobile air monitoring unit of these sensors can vary widely. In a connected
(MAMU) and portable equipment. The review will also world, data from these sensors can be used to map
provide more information on how ambient air quality air quality changes across cities and regions. Metro
monitoring can improve our understanding of near- Vancouver is studying the strengths and limitations
road environments, impacts of wildfire smoke, climate of some of these sensors and how they might play a
change, rail- and port-related emissions and other role in expanding our air monitoring capabilities.
important sources of emissions in our airshed.
Where’s MAMU?
MAMU, our Mobile Air Monitoring Unit, is
used for specialized studies in locations where
there are no air monitoring stations, or to
measure a specific pollutant.
In March 2020, MAMU began monitoring air quality on
Musqueam’s Indian Reserve No. 2 lands in Vancouver.
The monitoring will provide information on air quality
in the Musqueam community, and support Metro
Vancouver’s Iona Island Wastewater Treatment Plant
Biosolids Dewatering Facility project. Data collected
by MAMU will be used to track air quality during the
project, help the new facility perform as intended,
and compare air quality at Musqueam with nearby
monitoring stations and other parts of the region.
18 Caring for the Air 2020Understanding VOC
Volatile Organic Compounds (VOC) are organic chemicals found in the air.
They include hundreds of different substances, with each one present at
relatively low concentrations compared to other common air contaminants.
However, collectively VOC can pack an air quality punch.
Locally, VOC are a concern for two main reasons:
certain ‘toxic’ VOC can have negative health effects,
and some VOC can interact with other pollutants in
the presence of sunlight to form ground-level ozone,
a harmful common air contaminant.
Toxic VOC found in the Metro Vancouver region
include benzene. Benzene has both short-term
and long-term inhalation exposure effects and can
cause cancer. Sources of benzene include vehicle
exhaust, gasoline service stations, refineries and
tank farms, and residential wood burning. At
current levels in the region’s air, benzene poses a
higher cancer risk according to Health Canada’s
guidelines; however, levels have decreased over
the last two decades, mainly due to improvements
in the transportation and refinery industries
brought about by federal gasoline regulations.
See Caring for the Air 2015 for more information
about toxic air pollutants.
Ethylene has a high potential to form ground-
level ozone. Ground-level ozone can contribute
to smog and health issues. Ethylene occurs
naturally and is also manufactured to create
products such as plastics. Ethylene is emitted
by fruits, flowers, leaves and roots, as well as the
burning of vegetation and agricultural waste,
and the incomplete combustion of fossil fuels.
Average concentrations of ethylene have steadily
decreased over the last two decades, although
peak concentrations have not changed much Metro Vancouver measures VOC throughout the
since the early 2000s. region using specialized monitoring equipment.
Caring for the Air 2020 19How Are VOC Emissions Changing?
Volatile organic compounds (VOC) are found in products we use every day such as household cleaning
products, personal care products, paints and adhesives. Metro Vancouver tracks VOC emissions in the region
every five years through our air emissions inventory.
Largest VOC sources in Metro Vancouver
17%
Trees and vegetation
10%
Non-road Engines
3%
Distribution
42% 15% 5%
Paints and Industrial
Fuel
chemical products Cars and light trucks sources
What is the VOC Forecast for 2035?
Between 2015 and 2035, VOC emissions are expected to decrease and then increase as our population
grows and there will be more people living in the region using paints and chemical products.
40% 63% 4%
Paints and Chemical Products Cars and Light Trucks Non-road Engines
Why? Population Increase Vehicle Emission Standards Non-road Engine Emission Standards
Metro Vancouver manages air emissions, including VOC, through a system of permits and regulations. Also,
the federal government is committed to reducing VOC emissions from solvents in consumer and commercial
products such as household cleaning products, personal care products, paints and adhesives. Metro Vancouver
worked with the federal government and other agencies to develop a Regional Ground Level Ozone Strategy
that provides a foundation for reducing emissions, including VOC, that contribute to the formation of ground-
level ozone in the Lower Fraser Valley.
20 Caring for the Air 2020Turning
officially opened in March 2018 and is North America’s
first closed-loop integrated waste management
facility.
Food Waste
By using renewable natural gas to power their fleet
of waste collection trucks, and using the extra gas
produced to power other service vehicles and the
District Energy System, the City of Surrey can generate
into Fuel
enough clean energy to reduce corporate GHG
emissions by approximately 40,000 tCO2e.
Not only is the Surrey Biofuel Facility a clean energy
powerhouse, it’s also equipped with world-class
For several years, municipal curbside organics technology to deal with odour. Before the air is
collection programs in the region have been released through a 20-storey tall stack, it passes
diverting organic waste from landfills to through an ammonia scrubber, a water spray, and then
composting. Composting is nature’s way of a woody bio-filter to remove and absorb odours.
recycling, turning organic waste into a product Each year, the Surrey Biofuel Facility can process
that can be used to enrich our gardens, while about 115,000 tonnes of organic waste from more
reducing greenhouse gas emissions. Now, new than 150,000 Surrey households, local industrial,
facilities are taking food waste and creating commercial and institutional operations, and other
clean fuel for buildings and vehicles, in neighbouring municipalities in the region. That’s
enough organic waste to produce 120,000 gigajoules
addition to compost.
of renewable natural gas, which is enough energy to
heat over 1,300 homes for a year. Through a state-
The innovative Surrey Biofuel Facility takes organic of-the-art process, the facility converts organic waste
waste recycling to the next level: using a process from across the region into renewable natural gas and
similar to composting, it transforms organic waste compost, all while effectively mitigating odour impacts
into renewable natural gas and compost. The facility on the community.
Organics are picked up by the
city’s waste collection trucks
Trucks haul the organics
to the Biofuel Facility
Collection trucks continue
to collect the organics
Organics are turned into
renewable natural gas
and compost
Caring for the Air 2020 21
Renewable natural gas fuels
the waste collection trucksIf you have questions or comments about Caring for the Air, please contact us at AQinfo@metrovancouver.org or 604.432.6200. Electronic copies of this and previous editions of Caring for the Air can be found on metrovancouver.org
You can also read