Capgemini Environmental Sustainability - Performance Report 2019/20
←
→
Page content transcription
If your browser does not render page correctly, please read the page content below

Capgemini Environmental
Sustainability
Performance Report 2019/20
Introduction                                            Resourceful   Impactful   Performance Scorecard   Assurance

Welcome to the Capgemini Environmental
Sustainability Performance Report 2019/2020,
which provides details of our environmental
performance in 2019.
Scope:
Unless stated otherwise, the data in this report covers the Environmental
Sustainability activities of the Capgemini Group for the calendar year 2019. This
report complements the information published in the CSR section of our Universal
Registration Document 2019, Annual Report 2019 and Integrated Report 2019.
Data published in this report is the audited and complete final set of environmental
data for 2019, with any variances from our previous reports explained in the
Performance Scorecard section.

Feedback:
We welcome feedback on our approach to environmental sustainability and the
content of this report. Please email sustainability.reporting.uk@capgemini.com

Find out more:
For more information about our program please visit:
www.capgemini.com/corporate-responsibility/

The images throughout this report depict various aspects of climate change. They were taken
by Capgemini employees for an internal photographic competition, in support of Capgemini
Invent’s sponsorship of the World Climate Summit 2019, the lead business event of the UN
COP25.

2 - Capgemini Environmental Sustainability Performance Report 2019/20

Introduction             Resourceful              Impactful   Performance Scorecard                              Assurance

In this report
Environmental Sustainability Strategy & 2019 Highlights...   6
Cutting carbon across our largest emissions sources...		     9
Helping clients deliver their sustainability objectives...		 13
Engaging our people...								15
Performance Scorecard overview...					18
Assurance statement...							24
                                                                                           Capgemini Environmental Sustainability Performance Report 2019/20 - 3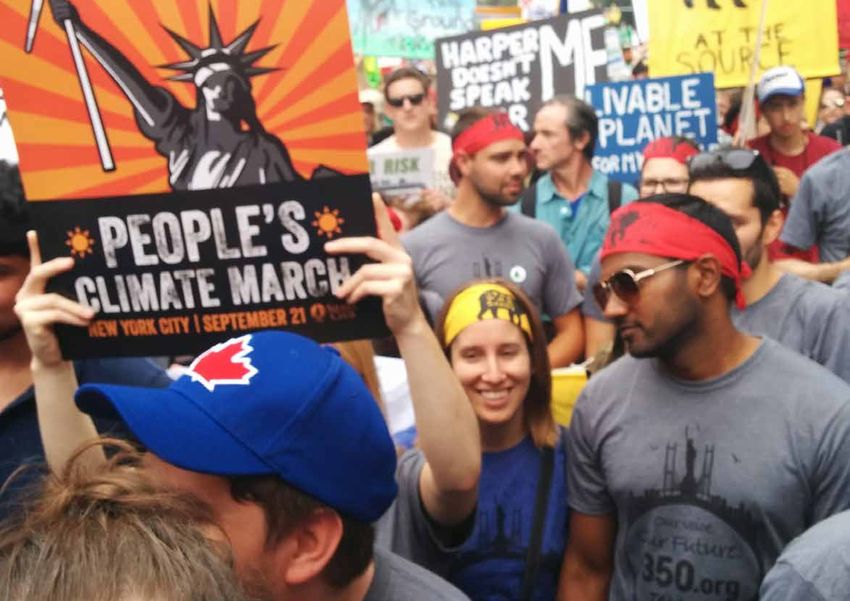
Introduction                                                               Resourceful                                             Impactful                       Performance Scorecard                        Assurance

Welcome to our 2019/20 Environmental Sustainability Performance Report

With many parts of the world still facing lockdown measures                                                              We continued to advance our focus on reducing waste             While our priority remains focused on driving down our
due to the COVID-19 pandemic, we are facing extraordinary                                                                through our commitment to eliminate single-use plastics         carbon emissions, our new strategy will involve offsetting
challenges that will impact our social and economic systems                                                              within our own operations, as well as by encouraging            any residual emissions from our operations through a high
for years to come. Now, more than ever, we need to ensure                                                                behavior change to reduce the amount of waste brought           quality carbon offset scheme. We plan to invest in carbon
the path beyond the pandemic is sustainable and that we                                                                  into our offices.                                               offsets covering emissions from all key operational impacts
focus as a responsible business on addressing the climate                                                                                                                                (energy, business travel, commuting, waste and water),
crisis that is in evidence all around.                                                                                   The work we do with clients continues to be the most            ensuring we achieve carbon neutrality by 2025. The focus
                                                                                                                         material positive impact we can deliver as a business.          will be on projects such as re-forestation that remove
2019 marks the end of the warmest ever decade on record1,                                                                Building on our external commitment to help clients with        carbon emissions from the atmosphere, with the scheme
with the average global temperature increasing at around                                                                 their sustainability challenges, in 2019 we have focused        extended over time to include Capgemini’s full operational
1.1°C above pre-industrial conditions. In parallel, 2019 was a                                                           on embedding sustainability within our existing portfolio       and supply chain impacts by 2030.
year in which the call for climate action grew stronger, with                                                            offers, while also engaging account teams within key
an estimated six million people joining climate protests2 in                                                             sectors. Through Capgemini Invent, we were the key              As we move into a new decade, in the midst of the current
September alone.                                                                                                         sponsor of the 10th World Climate Summit in support of          health pandemic, I hope that we can learn from the
                                                                                                                         the United Nation’s COP 25, bringing leaders and decision       experience. ‘Lockdown’ of course is not a long-term answer
For Capgemini, the year was marked with a number of                                                                      makers together to discuss the ‘climate emergency’ and the      for the environment, but the ‘new normal’ will need wide
key milestones – significant among those was making it                                                                   challenges it poses for the future of every business.           collaboration and radical transformation in how we work
onto the CDP’s prestigious ‘A list’, placing us amongst 2%                                                                                                                               and live. I believe Capgemini, our people and partners will
of high performing businesses working to tackle climate                                                                  Whilst we are very proud of how far we have progressed,         be a key part of that transformation.
change. We also made real progress towards our 2030                                                                      we know there is much more to do. I am delighted to
targets, reaching a 29.8% reduction in carbon emissions per                                                              announce Capgemini is now committed to becoming a               Dr. James Robey
employee 3 just 0.2% away from our headline science-                                                                     net zero business by 2030. This will mean accelerating our      Vice President,
based target, which we went on to reach in January 2020                                                                  carbon reduction strategy, with our next set of targets fully   Global Head of Environmental Sustainability
before the COVID-19 related lockdowns began.                                                                             aligned to a 1.5°C science-based pathway. Delivering against    July 2020
                                                                                                                         this strategy will require that we scale up our investment
These achievements were made possible by our continued                                                                   in energy efficiency and renewable energy, with a new
focus on driving down business travel emissions through                                                                  ambition to transition to 100% renewable electricity for all
virtual collaboration, with training and the roll-out of                                                                 our operations by 2025. We will also continue to transform
Office365TM across the Group, as well as country-specific                                                                the way we collaborate with clients and internally, with an
initiatives to encourage more sustainable travel. In 2019                                                                enhanced focus on unlocking the full potential of virtual
we also nearly doubled the proportion of our electricity                                                                 collaboration.
coming from renewable sources reaching 46.2% compared
to 23.7% the year before, whilst simultaneously significantly
enhancing energy efficiency across our estate.
1   https://medialibrary.climatecentral.org/resources/decades-of-warming
2   https://www.theguardian.com/environment/2019/sep/27/climate-crisis-6-million-people-join-latest-wave-of-worldwide-protests
3   The mark is used throughout this report denotes data points which have been assured by our auditors KPMG to a level of reasonable assurance.

4 - Capgemini Environmental Sustainability Performance Report 2019/20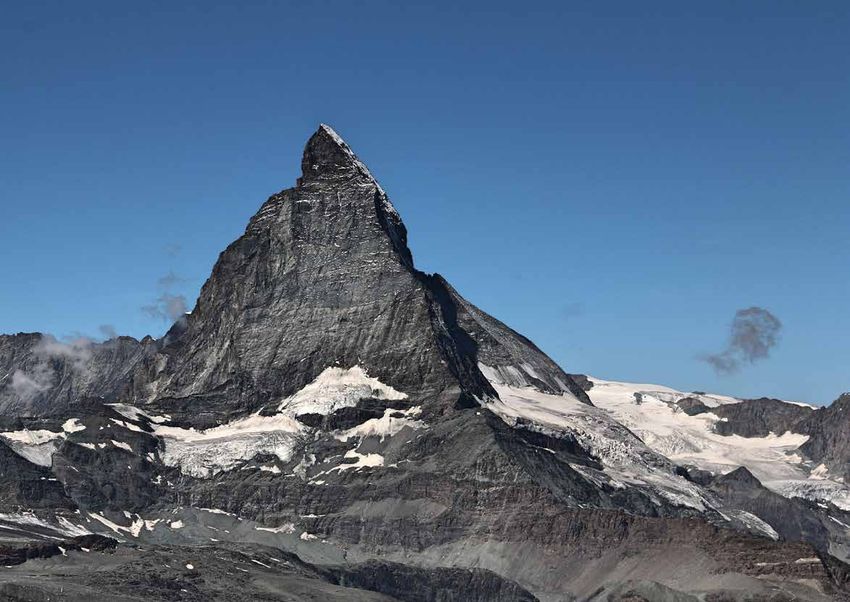
Introduction                                Resourceful                         Impactful          Performance Scorecard                                Assurance

About Capgemini
Company profile and key fixtures
A global leader in consulting, technology services and digital transformation,
Capgemini is at the forefront of innovation to address the entire breadth of clients’
opportunities in the evolving world of cloud, digital and platforms.

Our Values
Since the formation of Capgemini in 1967, we have been guided by the same seven
core values. These values are the threads that run throughout our history; they
guide the ethical approach through which we conduct our business.

Our Ethics
Our commitment to act in an ethical and responsible way is
central to the way we do business. We have been recognised
by the Ethisphere® Institute as one of the World’s Most Ethical
Companies for the past eight years. We were one of only three
organisations in the consulting sector to receive this accolade
in 2019, in recognition of our commitment to ethical business
practices.

Key figures in 2019

219, 300                    in more than
                            40 countries
                                                                  representing over
                                                                                               €14.1 billion      12.3%                             €1.29 billion
employees                                                         120 nationalities            revenue            operating margin                  free cash flow

Find out more>>
Capgemini >>
Architects of Positive Futures >>
Previous Environmental Sustainability Report >>

                                                                                                                                     Capgemini Environmental Sustainability Performance Report 2019/20 - 5
Introduction                                            Resourceful                               Impactful                     Performance Scorecard                    Assurance

Environmental Sustainability Strategy and 2019 Highlights
                                                                                  We are Resourceful                          We are Impactful                              We are Accountable
Capgemini’s Environmental Sustainability program
is about building innovative solutions to address                                     Driving efficiency and innovation       Helping our clients reduce their              Monitoring, reporting and
environmental issues, both within our business and                                    across our business operations,         environmental impacts by leveraging the       managing our environmental
with our clients.                                                                     focusing on our most material           combined innovation and capabilities of       impacts and risks using a
                                                                                      environmental impacts – our             the Group.                                    world-class carbon accounting
We were one of the first in our sector to publish                                     travel emissions, energy                                                              system, and a global
approved science-based targets.                                                       consumption and waste disposal.                                                       environmental management
                                                                                                                              2,750 employees engaged in face-to-face       framework to meet our
To reduce our carbon emissions per employee by                                                                                                                              ambitious science-based
20% by 2020 and by 30% by 2030 (vs. 2015)                                                                                     briefings, business challenges, workshops
                                                                                                                              and trainings, equipping them to support      targets.
                                                                                      29.8% carbon reduction per
We also have a commitment to help clients with                                        employee (vs 2015)                      clients with sustainable transformation
their sustainability challenges.
                                                                                      22.0% reduction in travel               Project FARM (Financial and Agricultural      Named on CDP’s prestigious
To help our clients save 10 million tonnes of CO2e                                    emissions per employee                  Recommendation Models), an intelligent        Climate Change A-list,
emissions by 2030                                                                     (vs 2015)                               data platform to optimize the agricultural    placing us among 2% of high
                                                                                                                              value chain and bolster global food supply,   performing businesses, in
                                                                                      40.9% reduction in energy               launched by our Applied Innovation            recognition of our progress on
                                                                                      emissions per employee (vs 2015)        Exchange (AIE) in the Netherlands             tackling climate change

                                                                                                                              A Geo Satellite Intelligence (GSI)            Global ISO 14001 certificate
                                                                                      46.2% electricity from
                                                                                                                              solution used to help halt the destructive    expanded to a further 9
                                                                                      renewable sources by the end of
                                                                                                                              annual march of the spruce bark beetle,       countries, bringing the total
                                                                                      2019 – an increase from 23.7% in
                                                                                                                              developed by our Sogeti business in           to 22 countries, incorporating
                                                                                      2018
                                                                                                                              Sweden                                        91.5% of our operations by
                                                                                                                                                                            headcount
                                                                                      First corporate campus in India to
                                                                                                                              Guidance on assessing and maximizing
                                                                                      receive the Net Zero Energy             the environmental benefits of cloud           Global Carbon Accounting
                                                                                      Platinum certification from             computing published in collaboration with     system rolled out to Japan,
                                                                                      the Indian Green Building Council       the Department for Environment, Food and      Singapore, Hong Kong and
                                                                                      (IGBC) was our Bangalore EPIP           Rural Affairs (DEFRA)                         Malaysia with 99.5% our
                                                                                      campus                                                                                operations now covered
                                                                                                                              Capgemini Invent accelerated their            (remaining 0.5% is estimated)
                                                                                      New ambition to phase out               sustainability focus, sponsoring the 10th
                                                                                      single-use plastic from our             World Climate Summit and launching the
                                                                                      offices by 2020 was launched            Invent for Society initiative
6 - Capgemini Environmental Sustainability Performance Report 2019/20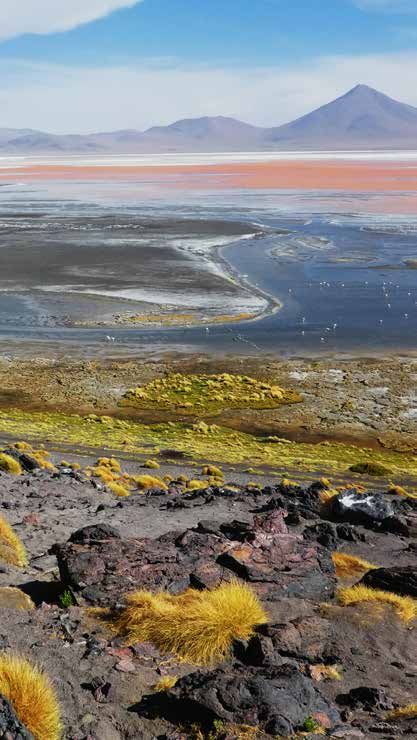
Introduction                                                                Resourceful                                                                   Impactful                                        Performance Scorecard                              Assurance

Awards and recognitions we received in 2019
  Achieved a place on                             Achieved a place of CDP’s                       Achieved a Platinum                            Once again recognized as                    Retained our “Prime”
  CDP’s prestigious                               supplier engagement                             rating in our Ecovadis                         one of the “World’s Most                    status in the ISS ESG
  climate change “A-list” in                      leader board, one of                            CSR assessment, the                            Ethical Companies®”                         Corporate Performance
  recognition of our strong                       only 159 companies to be                        highest possible rating                        by the Ethisphere®                          index, increasing our
  action on climate change                        recognized for our action                       with a score which puts                        Institute – a distinction                   score to achieve a
  - this places us in the                         on corporate supply chain                       us in the top 1% of                            that highlights our                         place amongst the top
  top 2% of all companies                         engagement.                                     organizations assessed.                        commitment to ethical                       2% of highest scoring
  responding to CDP.                                                                                                                             leadership, compliance                      companies in our sector.
                                                                                                                                                 practices, and corporate
                                                                                                                                                 social responsibility.

  Confirmed as a constituent                       Confirmed as a component                        Re-confirmed as a                              Continued our inclusion                    Continued our inclusion
  of the EURONEXT Vigeo                            of the Standard Ethics SE                       constituent of the                             in the FTSE4Good Index,                    in the STOXX ESG
  Eiris Europe 120 and                             French Index and the SE                         Ethibel Sustainability                         which is designed to                       Leaders index, which
  Eurozone 120 indices                             European Best in Class                          Index (ESI) Excellence                         measure and recognize                      offers a representation
  (our performance on                              Index - we are one of the                       Europe and the Ethibel                         the performance of                         of the leading global
  environmental, social                            few global companies with                       Sustainability Index (ESI)                     companies demonstrating                    companies in terms of
  and governance issues                            a score of EEE-, equating to                    Excellence Global.                             strong environmental,                      environmental, social and
  places us in the Top 120                         “Excellent”.                                                                                   social and governance                      governance criteria, based
  companies in Europe and                                                                                                                         practices.                                 on indicators provided by
  the Eurozone).                                                                                                                                                                             Sustainalytics.

*FTSE Russell (the trading name of FTSE International Limited and Frank Russell Company) confirms that Capgemini SE has been independently assessed according to the FTSE4Good criteria,
and has satisfied the requirements to become a constituent of the FTSE4Good Index Series. Created by the global index provider FTSE Russell, the FTSE4Good Index Series is designed to
measure the performance of companies demonstrating strong Environmental, Social and Governance (ESG) practices. The FTSE4Good indices are used by a wide variety of market participants to
create and assess responsible investment funds and other products

                                                                                                                                                                                                                                                  Capgemini Environmental Sustainability Performance Report 2019/20 - 7
Introduction                                            Resourceful   Impactful   Performance Scorecard   Assurance

Resourceful
8 - Capgemini
Capgemini     Environmental
          Environmental     Sustainability
                        Sustainability     Performance
                                       Performance     Report
                                                    Report    2019/20
                                                           2019/20
Introduction                     Resourceful                      Impactful                  Performance Scorecard                                    Assurance

Our carbon emissions at a glance
Our carbon emissions largely come from three main sources: our travel, our office energy
consumption and our data centre energy consumption.
                                                                                                                           INDIA
                                                                                                                           209,052 tCO2e
                                                                          Total                                            44% of total Group emissions
                                                                        Emissions                                          1.9 tCO2e per employee
                                                                                                                           ↓ 33% in tCO2e per employee vs 2015
                                                                          15%
                                                                           vs 2015
                                                                                                                           NORTH AMERICA
                                                                     29.8% reduction in                                    79,335 tCO2e
                                                                      total emissions per                                  17% of total Group emissions
                                                                      employee vs 2015                                     4.4 tCO2e per employee
                                                                                                                           ↓ 25% in tCO2e per employee vs 2015

                                                                                                                           FRANCE
                                                               Business Travel
                                                                                            -5%                            37,903 tCO2e
                                                                294,059 tCO2e
                                                                                                                           8% of total Group emissions
                                                                                                                           1.5 tCO2e per employee
                                                                                                                           ↓ 6% in tCO2e per employee vs 2015
                                                                Office Energy
                                                                                            -21%
                                                                146,413 tCO2e
                                                                                                                       UNITED KINGDOM
                                                                                                                       28,188 tCO2e
                                                             Data Centre Energy             -53%                       6% of total Group emissions
                                                                24,793 tCO2e                                           3.2 tCO2e per employee
                                                                                                                       ↓ 49% in tCO2e per employee vs 2015

                                                            F-Gas, Waste & Water            66%                            NETHERLANDS
                                                                6,140 tCO2e                                                26,438 tCO2e
                                                                                                                           6% of total Group emissions
                                                                                                                           4.2 tCO2e per employee
                                                                                                                           ↓ 24% in tCO2e per employee vs 2015

                                                                                                                                 Capgemini Environmental Sustainability Performance Report 2019/20 - 9
Introduction                                             Resourceful                   Impactful                                 Performance Scorecard               Assurance

Cutting carbon across our largest emissions sources
Through our Environmental Management program, we measure, manage and reduce our own carbon emissions, with a strong focus on our largest
sources of emissions, energy and travel.

Travel                                                                                                Case Study | Virtual Collaboration in the UK
As a people-centered business, meeting with clients continues to be                                   In 2019, Capgemini UK launched a new travel reduction program, to shift our focus from ‘travel’ to
an important part of building relationships and developing teams.                                     how we can better ‘connect’, bringing together virtual collaboration technology with organizational
Business travel is, however, our single largest source of carbon                                      behavior change. Investing in the creation of nine branded physical ‘hub’ spaces across the UK,
emissions and a significant contributor to air pollution. Across the                                  we enabled geographically dispersed teams to co-collaborate without the need to travel. This has
Group, 2019 saw continued focus on sustainable travel initiatives from                                been further supported by new Office365™ solutions deployed in the UK and globally, enabling
virtual collaboration and incentivized public transport, to car sharing                               employee collaboration from any location.
apps and electric pool cars.
                                                                                                      Helping people to understand and use the technology was central to the campaign, and over 1,700
                                                                                                      employees participated in training and behavioral workshops supported by 100 ‘Change Agents’
2019 Achievements (vs 2015)                                                                           and Senior Business Sponsors. 30 pilot groups involving several clients tested out new collaborative
                                                                                                      approaches to reduce travel.

                                                                                                      The campaign has contributed to a 13.3% reduction in business travel emissions in the UK in 2019
                           22.0% reduction                                   13.4% increase in rail
                                                                                                      alone.
                           in travel emissions per                           emissions per employee
                           employee

                          29.3% reduction in                                 19.3% reduction in air
                          hotel emissions per                                emissions per employee
                          employee

                          31.6% reduction in car
                          emissions per employee

10 - Capgemini Environmental Sustainability Performance Report 2019/20
                                                                                                              Our Virtual Collaboration Hub in Telford, UK
Introduction Resourceful Impactful Performance Scorecard Assurance
Case Study | India’s First Net Zero Campus – Bangalore
Energy
In 2019, Capgemini’s Bangalore EPIP campus was the first corporate campus in India to receive the
We are committed to creating sustainable and energy efficient Net Zero Energy Platinum certification from the Indian Green Building Council (IGBC). This is the
workplaces which are good for our people and the environment. highest level of certification available under the IGBC rating system and recognizes Capgemini
Across our estate, we are embracing a range of efficiency measures for having a very efficient site where an equal amount of energy is generated from renewable
to reduce energy and water use, adopting new technology and resources as we use for our own operations.
prompting our employees into action. A continued focus on energy
efficiency across our offices and data center operations has helped The Bangalore campus has installed a range energy efficient features, including smart aisle
reduce total energy use by 19.8% since 2015 . In addition, we containment for efficient cooling of its server rooms, modular uninterrupted power supply systems
have accelerated the deployment of renewable energy across our and a dual feeder electricity supply to reduce diesel generator usage. Once energy efficiency had
entities in Europe and India, with France moving its entire electricity been optimized, the focus shifted to ensure that the energy consumed on campus is generated
consumption onto a hydro power contract and India significantly from renewable sources. An in-house captive solar plant of 1,100KW with bidirectional energy
increasing the amount of renewable energy generated. Overall, we meters was commissioned. The meters export unused green energy to the local grid during
almost doubled the proportion of electricity coming from renewable weekends and holidays.
sources in 2019.
Capgemini also entered into a long-term agreement for purchase of renewable power from offsite
We are committed to building on this progress further and in 2020 we solar and wind farms, ensuring the total power consumed is from renewable sources.
set a new target to ensure that 100% of our electricity will come from
renewable sources by 2025.
2019 Achievements (vs 2015)
7.9% reduction in 40.8% reduction in
office energy usage data center energy usage
18.4% reduction in Percentage of electricity
office energy kWh per from renewable sources
m² since 2015 increased from 23.7% in
2018 to 46.2% in 2019 Our EPIP campus in Bangalore is the First Corporate Campus in India to achieve Net Zero Energy Platinum Certification
Capgemini Environmental Sustainability Performance Report 2019/20 - 11Introduction Resourceful Impactful Performance Scorecard Assurance Impactful 12 - Capgemini Environmental Sustainability Performance Report 2019/20
Introduction                           Resourceful                             Impactful                  Performance Scorecard                                        Assurance

Helping our clients deliver their sustainability objectives
We are committed to working collaboratively with our clients to help them with their sustainability challenges, supporting and accelerating their transition
towards a low carbon future.

In 2019, we focused on embedding sustainability across our business:                         In addition, we focused on advocating for technology and innovation as an
                                                                                             enabler to address sustainability challenges
          Engaged account teams on the topic of sustainability across five regions
          (France, North America, UK, the Netherlands and Germany, and within                          Through Capgemini Invent, we launched our approach for a Sustainable
          three key sectors (Energy & Utilities, Consumer Products and Retail, and                     Business Revolution and shared expertise in areas including electric
          Automotive).                                                                                 vehicles, smart cities and renewable energy.

          Worked with the Portfolio leaders for Cloud, ADM Next, Perform AI
          and Digital Manufacturing to embed sustainability within the existing                        Capgemini Invent’s innovation and strategy arm, Fahrenheit 212, has
          portfolio offers.                                                                            developed an approach to help organizations transition to cleaner business
                                                                                                       models for Clean Growth.
          Developed our range of sustainability tools, including our Carbon Travel
          Dashboard, which helps clients recognize opportunities to reduce                             In the 21st edition of the World Energy Markets Observatory, we
          emissions through virtual collaborative delivery.                                            focused on the growing threat of climate change, particularly as it relates
                                                                                                       to energy consumption and efficiency.
          Engaged 2,750 employees in face-to-face briefings, business challenges,
          workshops and training on sustainability.
                                                                                                       We launched an approach to helping organizations address the circular
          Capgemini Invent was global partner to the 10th World Climate Summit                         economy. The report considers how consumer products and retail brands
          in December 2019, focusing on our expertise areas, including electric                        can build value and resiliency through the circular economy.
          vehicles, smart cities and renewable energy.

                                                                                                                                                 Capgemini Environmental Sustainability Performance Report 2019/20 - 13
Introduction Resourceful Impactful Performance Scorecard Assurance
Working with Clients
Case Study | Project FARM - platform to help Case Study | Hunting spruce bark beetles in Case Study | Partnering with DEFRA for the
small-scale farmers in Kenya Sweden’s forests from 700 km above the Earth Defra e-Sustainability Alliance (DeSA)
Project FARM (Financial and Agricultural Recommendation Large forestry areas are destroyed every year by spruce Working with the UK Department for Environment, Food
Models) was developed by our Applied Innovation bark beetles. According to the national authority, Swedish and Rural Affairs (DEFRA), we developed guidance on
Exchange (AIE) in the Netherlands. It uses Artificial Forest Agency, three to four million cubic meters of assessing and maximizing the environmental benefits
Intelligence to determine farming patterns, generating forests in Sweden were destroyed in 2018. of cloud computing and co-authored an industry best
insights to make recommendations which help small-scale practice guide on sustainable ICT alongside WWF and
farmers in Kenya. Our business, Sogeti, worked with state-owned Sveaskog, United Nations.
Sweden’s largest forestry owner, to track and contain
Using a smartphone, farmers can access tailor-made the progress of the beetle. The solution uses Artificial This was launched as part of the new Defra e-Sustainability
advice to optimize crop production, and make meaningful Intelligence, with advanced cognitive image analysis, Alliance (DeSa), a partnership of 16 companies along with
commercial decisions. The platform also provides Machine Learning and Deep Learning, to produce detailed the UN Environment Programme, UNICEF UK, UNGC,
information to other partners in the value chain, including maps that visualize the movements of the bark beetle. WWF and AXELOS, all collaborating with a shared vision to
providers of seeds and fertilizers as well as producers and Drone technology is used to verify the accuracy of the make the ICT sector more sustainable.
buyers, thereby eliminating inefficiencies. data relating to affected forest areas, enabling Sveaskog
to move fast to contain the progress of the bark beetles.
This solution was built in collaboration with Agrics, a social
enterprise operating in East Africa that provides local
farmers with agricultural products and services on credit.
Click on the image above to watch the Project Click on the image above to find out more Click on the image above to view the report
Farm video
14 - Capgemini Environmental Sustainability Performance Report 2019/20Introduction Resourceful Impactful Performance Scorecard Assurance
Mobilizing our people
Our Environmental program is underpinned by Engaging our people to #Rethink Plastic in Empowering our people to take action through
a strong focus on engaging our team members. support of our commitment to phase out single an employee-led week of awareness, discussion
As a business, we are focused on creating a use plastic. and action.
culture where individual sustainable actions are
normalized, and people are empowered to make The UK’s Pollination Project, a week-long program,
In support of the UN’s World Environment Day 2019, brought together over 300 team members across the
a difference to problems that matter to them. we launched a new employee campaign to eliminate business to explore and learn about sustainability themes
single-use plastic from across our offices and operations and create solutions for clients.
Our approach to mobilizing our people includes a focus on by 2020.
three areas: education, engagement and empowerment.
Timed to coincide with COP 25, activities included
We have developed practical guides, briefing packs We invited our people to take action, cutting down webinars and documentary screenings, as well as panel
and a computer-based training approach to enhance unnecessary waste from personal consumption, discussions, bringing together our UK Chairman, partners
the collective sustainability knowledge of our people. encouraging use of reusable goods such as water bottles and clients to discuss a range of sustainability issues. Eight
With engagement campaigns, we apply a ‘360-degree’ and coffee cups – and saying no to excess packaging. green start-ups also joined the week to talk about how
approach to our programs considering policies,
they use innovation to deliver a green economy.
infrastructure and information to enable and encourage In India, the BYOB (Bring Your Own Bottle) campaign
people to make sustainable choices that later become and ‘Cap Bottle Challenge’ have raised awareness and The week culminated in the launch of an innovation
normalized actions. In 2019, employee-led networks of engaged employees. Germany has distributed 3,000 challenge seeking ideas for how we can save carbon
Sustainability Ambassadors have continued to grow and cloth bags to replace single-use plastic ones. – engaging 440 employees in voting for the 70 ideas
have been instrumental for accelerating momentum for
generated.
sustainability in the business. In Brazil, sustainability ‘kits’ containing reusable bottles,
coffee cups and eco-bags have been distributed to all
employees.
Educating our people through training and
workshops. Personal actions have supported a wider corporate
campaign that has seen changes across the business
2,750 employees have participated in face-to-face with biodegradable
briefings, webinars, workshops and training, as well as or reusable
‘real business’ challenges, equipping them to help our crockery being
clients transform sustainably. introduced, water
dispensers replacing
In North America, a series of quarterly webinars have bottle water, and
engaged over 1000 employees on topics ranging from changes in cleaning
biodiversity and water issues to the environmental equipment to reduce
impacts of ICT technologies. use of plastic.
Capgemini employee, Harriet Weeks, presenting at the
Pollination Project, UK
Capgemini Environmental Sustainability Performance Report 2019/20 - 15Introduction Resourceful Impactful Performance Scorecard Assurance
2019 World Climate Summit - Capgemini Photo Competition
Capgemini Invent became a global partner of the World Climate Summit in Madrid in part to communicate our conviction that radical business
transformation is essential to deliver the necessary level of reduction in carbon emissions.
The Lone Tree Ladakh Glaciers of Serenity Fuelled by People Power Flamingo Paradise Chicago Succumbing to
and Uncertainty Lake
A lonely tree stands in the overflowing Climate change is no longer a doomsday Taken at the 2014 People’s Climate March The Laguna Colorado in Bolivia is a positive Record rainfall in the Midwest United
Bhavli dam in Nashik, Maharastra, India. prophecy, it’s a reality and this is stripping (PCM) in New York City, the picture depicts example of how the conservation of States wiped out crops and inundated cities
Dams are an invaluable source of water Ladakh (India) of its very identity. Global the strength, diversity and unity of people natural areas can work well. The wetland last year. Lake Michigan, the fifth largest
for the nearby farm lands, however, they warming has accelerated the rate at which mobilised in the fight against climate is also called The Flamingo Paradise, lake in the world with a water surface of
trigger massive damage on sea life and glaciers are melting, leading to scarcity of change. At a +20C world (at least), young because it’s home to a great number of 57,753 square km, reached an all time
biodiversity. Severe droughts are likely to rain and snowfall in this region. This has people have inherited a world in which they flamingos and has a stunning biodiversity high water level. This picture is of the lake
become more common while hydropower had a detrimental impact on the health have no choice but to take a stand. During with algae that makes the water very overtaking the wall and approaching the
is described as one of the major levers of of water streams therefore triggering this decade, we have observed young colourful. Wetlands are especially exposed streets. The tops of the ladders sticking
energy transition. Consequently water shrinking of vegetation. Here is a gut generations at the forefront of the battle to the effects of climate change and this out of the water are typically used to get in
will be a key issue of future geopolitical wrenching picture of Nubra Valley, a place against climate change, one of the biggest one is therefore protected by The Ramsar an out of the lake 1-2 metres below. There
conflicts. This tree represents a symbol known for its serene scenic landscape threats to humanity in the 21st century. Convention. Wetlands are a critical part were a number of deaths and injuries on
of hope in a sea of fears. beauty, which is now, slowly reducing to a The 2014 PCM was one of the largest of our natural environment, they protect the lake last year because objects that used
maroon lifeless piece of land, thanks to us! climate marches in history and represents a our shores from wave action, reduce the to be above the water could not be seen
movement fuelled by ‘people power’. impacts of floods, absorb pollution and by boaters. In some neighbourhoods, the
improve water quality. lake is about to lap against buildings that
used to have sidewalks and beach between
them.
Photo and story by Ashish Tamhane, Photo and story by Aayush Kaul, Capgemini India Photo and story by Jessica Li, Capgemini France Photo and story by Rebecca Knoblich, Photo and story by David Hirsh, Capgemini US
Capgemini India Capgemini Austria
16 - Capgemini Environmental Sustainability Performance Report 2019/20Introduction Resourceful Impactful Performance Scorecard Assurance
As part of that engagement, we invited colleagues to take part in a competition to share photos from around the world illustrating some of the impacts of
climate change. Some of the winning photographs have been used to illustrate this report - visit the Sway to view all the photos in this library Sway
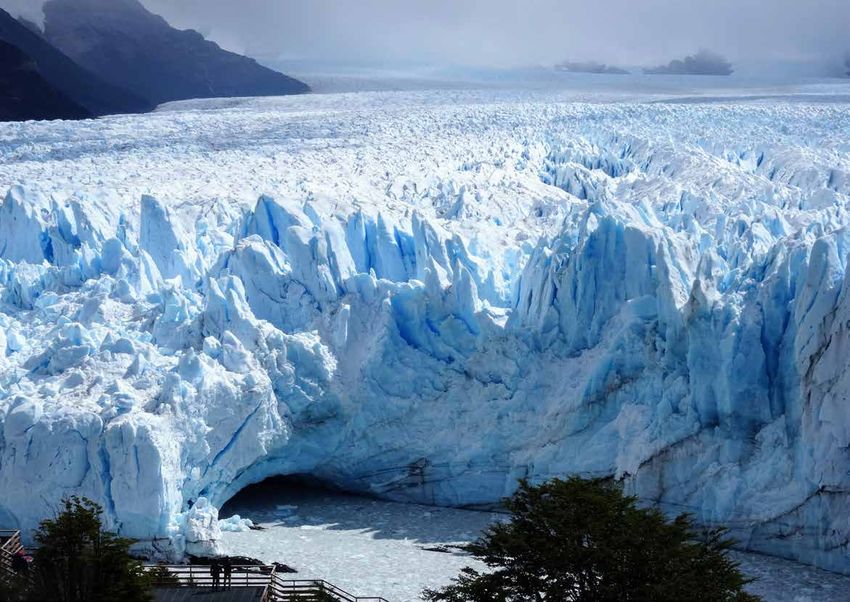
Protect My Frozen Heart Cloud Burst More is Less Endangered Nature Dry Tears
Mesmerizing, mystical, majestic, the This is a picture of Thane, Navi Mumbai, Root causes of most of the environmental This picture is the Argentinian Perito The Aral Sea is a symbol of ecological
jewel of the Swiss Alps is the Matterhorn. taken during the Monsoon season and ecological problems are related Moreno, one of only three Patagonian disaster and human tragedy. From a
Stands alone. Quiet. Strong. Yet very (mid September 2019), when Mumbai to consumerism. Over-consumption glaciers that are not yet melting. Human flourishing economy based on fishery,
vulnerable. generally gets stuck due to the heavy of natural resources worsens climatic beings admiring the ice at the bottom this region spreading over Kazakhstan
rains and the lower parts of the city behaviour and increases global warming of the image seem very small in front and Uzbekistan has turned into a no man’s
The iconic Swiss mountain, with its near are flooded. Every year the same story drastically. As our demand increases, the of the gigantic 5,000 meter long glacier land in a few decades, when then rivers
perfect pyramid shape, may one day repeats itself and the phenomenon gets need to produce goods also increases, front. It’s hard to imagine that in some that fed the sea were diverted for various
be unrecognisable. It is cracking as the stronger, with an increasing impact on which leads to more pollutant emissions, places, the glacier is as high as two Eiffel irrigation projects. The impacts on
frozen core of the peak begins to thaw the people, generating more and more increased land-use and deforestation and towers. Similarly to the ‘Overview Effect’, climate and ultimately on the population,
due to rising temperatures making the suffering. The Municipal department tries accelerated climate change. a cognitive shift in awareness reported have been disastrous; regional climate
surface unstable and prone to landslides. to adapt to these changing rain patterns, by some astronauts during space flight, change leading to even stronger water
As a consequence, hiking in this place as but with little room for manoeuvre. This This picture, which shows how much often while viewing the Earth from outer stress, destruction of local economies,
well as in many others has become more shows how much we are helpless in consumerism is now a part of our society, space; when I discovered one of the few population exodus, etc.
dangerous year after year. the face of climate change. Thus every has been taken in a West-Bengal landfill in Patagonian glacier maintaining a state of
“Mumbaiker” (a native or inhabitant of India. The degradation process of organic equilibrium, I realized how urgently we
the city of Mumbai) just prays that next waste, landfills are a significant emitter of need to fight global warming and climate
year the rain doesn’t come with the same methane, which has been assessed to have change.
destructing power. 28 times the global warming potential of
carbon dioxide (over a 100-year timeline).
Photo and story by Parul Gupta, Capgemini UK Photo and story by Sajal Bain, Capgemini US Photo and story by Debiprasad Mukherjee, Photo and story by Victor Falières, Photo and story by Véronique Rossignon,
Capgemini India Capgemini France Capgemini France
Capgemini Environmental Sustainability Performance Report 2019/20 - 17Introduction Resourceful Impactful Performance Scorecard Assurance Accountable Performance Scorecard 18 - Capgemini Environmental Sustainability Performance Report 2019/20 Capgemini Environmental Sustainability Performance Report 2019/20
Introduction                      Resourceful                          Impactful   Performance Scorecard                                     Assurance

2019 Regional view of key metrics
                                                                                                               INDIA (44% of Group emissions)

                                                                                                        1.9 tCO2e per employee                         90,524 tCO2e

We gather environmental data from Capgemini entities in 34 countries covering 99.5%                     126 kWh/m2                                     16.4 %
of our global operations in 2019. The data below shows a regional breakdown of our key                       NORTH AMERICA (17% of Group emissions)
metrics.
                                                                                                        4.4 tCO2e per employee                         64,017 tCO2e
                                                                                                        201 kWh/m2                                     0.0%

                                                                                                              FRANCE (8% of Group emissions)

                                                                                                       1.5 tCO2e per employee                           31,916 tCO2e
                                                                                                       166 kWh/m    2
                                                                                                                                                        100%

                                                                                                          UNITED KINGDOM (6% of Group emissions)

                                                                                                        3.2 tCO2e per employee                          19,529 tCO2e

                                                                                                        229 kWh/m2                                      89.6%

                                                                                                           NETHERLANDS (6% of Group emissions)

                                                                                                        4.2 tCO2e per employee                         19,375 tCO2e
                                                                                                        75 kWh/m2                                      98.2%

                                                                                                          OTHER EUROPE (14% of Group emissions)

                                                                                                        2.0 tCO2e per employee                         48,743 tCO2e
                                                                                                        154 kWh/m   2
                                                                                                                                                       22.9%

                                                                                                           LATIN AMERICA (1% of Group emissions)

Key Metrics                                                                                             0.9 tCO2e per employee                         5,285 tCO2e

                                                                                                        125 kWh/m2                                     36.1%
    change compared to 2018          business travel emissions
                                                                                                              OTHER REGIONS (4% of Group emissions)
    carbon emissions per employee    % of total electricity from renewables
                                                                                                        2.2 tCO2e per employee                         13,331 tCO2e
    office energy efficiency
                                                                                                        122 kWh/m   2
                                                                                                                                                       0.0 %

                                                                                                                        Capgemini Environmental Sustainability Performance Report 2019/20 - 19
Introduction Resourceful Impactful Performance Scorecard Assurance
2019 Carbon emissions by scope
Office Energy 4,908 -7.2%
The increase in
fluorinated gas is largely
1 Data Center Energy 102 +10.4% due to improved
reporting from four
facilities in India.
F-Gas 4,026 +92.6%
The reduction in office
Office Energy 122,625 -4.5% energy emissions reflects
2 Data Center Energy 23,182 -8.5%
improved energy efficiency,
increased solar capacity in India
and decarbonisation of grid
electricity in
many regions.
Air Travel 188,571 -7.9%
Car Travel 54,821 -5.1%
Our business travel
emissions reduced overall.
Hotel Nights 32,649 -12.8% The increase in rail emissions
is a positive indication of
modal shift from air and
Taxi, Rail & other 18,019 5.5% car to rail.
3 Office T&D losses 18,879 -8.5%
Data Center T&D losses 1,509 -6.9% The reductions in data
center electricity & T&D
emissions reflects
Water 1,687 +4.0% rationalisation of our
data center portfolio
Waste 428 +6.3%
*All data is given in Tonnes of CO2e Scope 1 Scope 2 Scope 3 % change compared to 2018
20 - Capgemini Environmental Sustainability Performance Report 2019/20Introduction Resourceful Impactful Performance Scorecard Assurance
TABLE 1: CARBON EMISSIONS BY SCOPE
Metric Unit 2015 Total 2018 Total 2019 Total Change vs 2015 Comments
To reduce our carbon footprint per T CO2e per
Target 3.10 2.45 2.18 -29.8%
employee by 20% by 2020 and 30% by 2030 employee
Office Energy (natural gas, T CO2e
diesel/gas oil, LPG) 5,727 5,287 4,908 -14.3% The reduction in Scope 1 energy emissions has largely been driven by
reductions in natural gas use in Spain, France, the Netherlands, and the UK.
Scope 1 Data Center Energy (natural T CO2e 239 92 102 -57.3% Fluorinated gas (F-gas) from our air conditioning systems tends to fluctuate
gas, diesel) year-on-year in part due to the irregularity of maintenance cycles and the
F gas T CO2e 1,507 2,090 4,026 167.1% challenge of getting high quality data from leased sites. The increase in 2019
is largely due to F-gas increase in India caused by improved reporting from
TOTAL Scope 1 T CO2e 7,473 7,470 9,036 20.9% four facilities.
Office Energy (electricity, The reduction in office electricity emissions can largely be attributed to
heating, cooling) T CO2e 151,110 128,439 122,625 -18.9%
reduced energy consumption across our larger regions. The reductions in data
Carbon Scope 2 center emissions reflect the rationalisation of our data center portfolio, with
Emissions Data Center Energy (electricity) T CO2e 48,597 25,399 23,182 -52.3%
reductions in the UK, the Netherlands, North America, Finland and Germany.
by Scope An increase in our solar capacity in India and decarbonisation of the electricity
(Location TOTAL Scope 2 T CO2e 199,707 153,837 145,807 -27.0% grid have also been important drivers.
Based)
Business Travel T CO2e 309,903 317,111 294,059 -5.1%
Office Energy (T&D losses) T CO2e 28,864 20,625 18,879 -34.6% Our business travel emissions are responsible for the majority of the reduction
Data Center Energy in Scope 3 emissions, particularly due to reduction in air emissions (-2%), car
(T&D losses) T CO2e 3,635 1,622 1,509 -58.5% emissions (- 17%), and hotel emissions (-14%) compared to 2015. Waste and
water usage have also decreased compared to 2015, with India key to that
Scope 3 Water T CO2e 1,790 1,622 1,687 -5.8% reduction.
Waste T CO2e 401 403 428 6.8%
TOTAL Scope 3 T CO2e 344,592 341,382 316,562 -8.1%
TOTAL EMISSIONS T CO2e 551,773 502,690 471,406 -14.6%
Market-Based
Emissions Scope 2 only Market-Based Emissions T CO2e 162,569 127,616 113,342 -30.3%
Data identified in these tables by a has been reviewed by KPMG with a reasonable level of assurance.
1. Data differs from that reported in the Universal Registration Document (URD) 2019 level of control a company has over an emissions source. are, however, captured with a value of 1,308 tons of CO2e for 2019.
for the following key reasons: 3. All emission sources, except electricity, have been calculated using the emission 6. Our business travel emissions are calculated including the impact of radiative forcing
• A small increase in the scope of reporting in 2019 to include shuttle data between factors recommended by DEFRA: https://www.gov.uk/measuring-and-reporting- for air travel, as well as the impact of hotel night stays. Whilst this is recommended
offices in India; environmentalimpacts-guidance-for-businesses best practice, many companies in our sector do not yet include these two emission
• An error was identified for India air data, with over-reporting of air data due to some sources and therefore caution should be applied trying to compare Capgemini’s
employees booking offline through the global travel agency instead of the company 4. Electricity emissions have been calculated in the main body of the table above, in line
with the GHG Protocol’s “location-based” approach. Regional electricity emission business travel emissions to those of other companies in our sector.
paying centrally for their travel. This resulted in a 4% decrease in India’s air emissions
and a 1.4% decrease in global air emissions. factors have been applied for the UK (DEFRA 2019) and the US (eGrid). For all the 7. The “Market-based emissions” given in the final row of the first table are a
• A few smaller data corrections and updates have been applied for the Netherlands other countries, emission factors from the International Energy Agency (IEA) have recalculation of Scope 2 emissions using the GHG Protocol’s market-based approach.
and Spain, including car travel and energy data for Canada, Australia and Japan; been applied to calculate Scope 2 location-based emissions. Scope 3 “T&D losses” Where possible, market-based emissions have been calculated using supplier-specific
• In addition, data had previously been estimated in cases where it had not been refers to electricity transmission and distribution grid losses i.e. the energy loss that emission factors. Where these are not available, we have used a residual fuel mix
received at the time of the URD (particularly for Q4 2019), these estimation have now occurs in transmitting the electricity from the generation source to our facilities. factor, sourced from RE-DISS for countries in Europe and from green-e.org for US
been replaced with actual data. 5. As recommended by the GHG Protocol, emissions of Fluorinated Gas (F-gas) not and Canada. For a few smaller entities, we have assumed an emission factor of 0
covered by the Kyoto Protocol such as chlorofluorocarbons (CFCs) are not reported for electricity purchased on renewable energy tariffs. In locations where neither
2. Our carbon accounting approach follows the Greenhouse Gas Protocol Corporate supplier-based nor residual fuel mix factors are available, we have used a
Standard - the term “Scope” is used to categorize emissions reported according to the as Scope 1 emissions and are therefore not included above. These F-gas emissions
location-based emission factor.
Capgemini Environmental Sustainability Performance Report 2019/20 - 21Introduction Resourceful Impactful Performance Scorecard Assurance
TABLE 2: ENERGY USE
Metric Unit 2015 Total 2018 Total 2019 Total Change vs 2015 Comments
Office Energy Consumption MWh 290,790 270,991 267,900 -7.9%
Natural Gas MWh 15,530 12,703 11,350 - 26.9% Office energy consumption has reduced across the Group, despite a 4%
Diesel & LPG MWh 10,449 11,156 11,44 9.5% increase in floor area, with improvements in energy efficiency and space
utilisation being key to this. The reduction in natural gas has largely been in
Renewable Electricity MWh 41,642 40,784 87,540 110.2% Spain (-50% vs 2018), France (-41% vs 2018) the Netherlands (-17% vs 2018),
Other Electricity MWh 215,454 199,172 150,319 -30.2% Czech Republic (-23% vs 2018), and the UK (-15% vs 2015). Diesel emissions
Office are reduced by 6%, mainly in the US (-65% since 2018) and Brazil (-31% vs
District Heating MWh 6,001 5,424 5,575 -7.1% 2018), however this is offset by a 31% increase in LPG consumption in India.
Office Cooling MWh 1,714 1,753 1,671 -2.5% The complete transition to renewable electricity in France in 2019 and
continued increase in both renewable energy purchases and solar
% Electricity from renewables % 16.2% 17.0% 36.8% 20.6% generation in India have resulted in a significant increase in renewable
Office energy usage per area MWh/m2 0.170 0.146 0.139 -18.4% energy consumption this year.
Natural Gas MWh 355 34 30 -91.5%
Diesel MWh 641 312 376 -41.3%
The rationalization of our data center portfolio has led to significant
Renewable Electricity MWh 73,331 40,934 67,452 -8.0% reductions in data center energy usage across the Group. At the same time,
Data Other Electricity MWh 90,687 63,467 29,892 -67.0% our average PUE has remained flat, which is positive given that before
Center closure or migration of a data center the PUE tends to increase – the energy
Total Data Center Energy Use MWh 165,013 104,746 97,750 -40.8% overheads such as cooling remain, whilst the amount of computing power
% Electricity from renewables % 44.7% 39.2% 69.3% 24.6% delivered to clients reduces. The PUE of our strategic data centers is notably
lower than that of our overall average.
Average PUE of strategic data centers Average PUE 1.64 1.65 1.64 0.9%
Average PUE of all data centers Average PUE 1.76 1.80 1.79 4.9%
TOTAL Total Energy Use MWh 455,803 375,737 365,649 -19.8%
ENERGY % of Total Electricity from renewables % 27.3% 23.7% 46.2% 18.9%
Notes
1. “Renewable Electricity” includes all renewable electricity purchased on renewable energy tariffs or through renewable energy certificates, as well as a small amount of electricity generated on-site in India and the UK using solar
photovoltaic panels. “Other electricity” includes purchased electricity generated from mixed tariffs which are largely made up of fossil fuel and nuclear sources.
2. Given the nature of our business, many of Capgemini’s offices have large server rooms. These are not considered to be data centers but their presence should be taken into consideration when comparing the energy usage and energy
efficiency of our offices against those in other sectors.
3. Data Center Power Usage Effectiveness (PUE) is a standard industry measure of how energy efficient a data center is. It compares the amount of non-computing overhead energy (used for things like cooling and power distribution) to
the amount of energy used to power IT equipment. A PUE of 2.0 means that for every watt of IT power, an additional watt is consumed to cool and distribute power, whereas a PUE of closer to 1.0 means nearly all the energy is used for
computing. To track the energy efficiency of data centers we use, we calculate a simple average of all data centers, including Capgemini-leased or owned data centers, client-specific data centers which we operate, as well as co-located
data centers which we buy space in. We also calculate an average of our strategic data centers.
4. 69% of the office energy data in France for Q1-Q4 2019 has been estimated. This estimated data accounts for approximately 8% of the total energy use in the Group, 10% of total office energy use and 0.45% of total GHG emissions.
6. For all regions, office energy emissions and data center energy emissions have been calculated using the GHG Protocol location-based approach.
22 - Capgemini Environmental Sustainability Performance Report 2019/20Introduction Resourceful Impactful Performance Scorecard Assurance
TABLE 3: BUSINESS TRAVEL
Metric Unit 2015 Total 2018 Total 2019 Total Change vs 2015 Comments
Business Travel emissions T CO2e 309,903 317,111 294,059 -5.1%
Air Emissions T CO2e 192,179 204,832 188,571 -1.9% Reducing our business travel has been a significant achievement in the
Car Emissions T CO2e 65,855 57,776 54,821 -16.8% context of a continued growth in headcount and revenue. On a per
employee basis, air mileage has reduced by 18%, car emissions by 32%
Travel by Hotel Emissions T CO2e 37,983 37,432 32,649 -14.0% and hotel nights by 3%. There has also been evidence of some modal
Source Rail Emissions T CO2e 5,933 7,463 8,183 37.9% shift to rail, with rail mileage per head increasing by 24% since 2015.
Another important contributor to the overall reduction in emissions has
Taxi Emissions T CO2e 6,542 7,714 7,829 19.7% been the decarbonisation of travel, with both car emission factors and air
Other Travel Emissions T CO2e 1,411 1,895 2,006 42.2% emission factors significantly reducing since 2015.
Travel per
Total Travel emissions per head T CO2e/ employee 1.74 1.55 1.36 -22.0%
head
TABLE 4: WASTE & WATER USE
Metric Unit 2015 Total 2018 Total 2019 Total Change vs 2015 Comments
Waste Waste to Landfill Tonnes 3,735 2,621 2,977 -20.3%
Disposal Waste Recycled Tonnes 1,360 1,166 1,155 -15.1%
Waste to Energy Tonnes 115 105 106 -8.1% There has been a significant reduction in waste generated since 2015
Waste Anaerobic Digestion Tonnes 12 440 545 4598.2% with India, France, Spain, Sweden and UK contributing to this . Recycling
rates have also increased across several regions, including India and Brazil.
Total Waste Tonnes 5,222 4,333 4,783 -8.4% Note that the waste emission factor for landfilled waste significantly in-
Total Waste Emissions T CO2e 400.9 402.7 428.1 6.8% creased in 2016-2019 compared to 2015, which is part of the reason why
our waste emissions have increased even though our landfilled waste and
% of Waste Diverted from landfill % 28.5% 39.5% 37.8% 9.3% our total waste generation have reduced significantly.
Total Water Use Cubic meters 1,700,853 1,541,714 1,603,279 -5.7%
Water Use
Total Water Emissions T CO2e 1,790 1,622 1,687 -5.8%
Notes
1. Hotel emissions are calculated based on emission factors specific to the country in which the traveler is staying. For some countries, emission factors were not available from DEFRA and
therefore have been sourced directly from https://www.hotelfootprints.org (DEFRA emission factors are derived from the same data set).
2. Where mileage data is not available this has been estimated by taking the cost data within that country and applying the average cost per mile ratio from other data within that country
or region.
3. “Other travel emissions” refers to travel by other modes of transportation (bus, tram, motorcycle).
4. The availability of accurate waste and water data varies considerably across the Group, depending on the type of site, the type of lease and local waste arrangements. Where actual data is not
available, it has been estimated using relevant estimation methods. We take a conservative principle of assuming waste has been landfilled where landlords cannot confirm otherwise, and
hence it is likely that a higher proportion of waste is diverted from landfill than what is stated here.
5. For anaerobic digestion and composting, data gathering was rolled out across the Group in 2016, hence why the figure for 2015 is very low.
6. As recommended by DEFRA we calculate both the emissions associated with water supply and the emissions associated with water treatment. As the volume of water being sent for treatment
is not currently metered, we have made an assumption that it is the same as the volume of water supplied.
Capgemini Environmental Sustainability Performance Report 2019/20 - 23Introduction Resourceful Impactful Performance Scorecard Assurance Assurance 24 - Capgemini Environmental Sustainability Performance Report 2019/20
Introduction                                                                  Resourceful                                                                     Impactful                                                     Performance Scorecard                                                                      Assurance

Capgemini S.E.
Registered office: 11, rue de Tilsitt, 75017 Paris
Report by one of the Statutory Auditors on a selection of environmental indicators published in
Capgemini Environmental Sustainability Performance 2019/2020 Report
For the year ending 31 December, 2019

To the shareholders,                                                                                                                                                                     Responsibility of the Statutory Auditor

As requested and in our capacity as the Statutory Auditor of your company (hereinafter                                                                                                   On the basis of our work, our responsibility is to express, at the request of the Entity,
the “Entity”), we hereby report to you on a selection of consolidated environmental                                                                                                      reasonable assurance that the CSR information selected1 by the Entity and identified
information for the year ended December 31, 2019, identified by the symbol (hereinafter                                                                                                  by the symbol in the Environmental report is fairly presented, in all material respects,
named “CSR Information”), and disclosed in the Environmental Sustainability Performance                                                                                                  in accordance with the Guidelines. The conclusions given below relate solely to the CSR
2019/2020 Report of the Entity (hereinafter the “Environmental report”).                                                                                                                 Information and not to the Entity’s Environmental report as a whole.

Responsibility of the entity                                                                                                                                                             We performed our work in accordance with ISAE 30002 and in compliance with the
                                                                                                                                                                                         professional guidelines applicable in France.
The Corporate Social Responsibility & Sustainability division is responsible for preparing
the CSR Information in accordance with the guidelines used by the Entity (hereinafter the                                                                                                Nature and scope of our work
“Guidelines”), summarised in the methodological notes presented in the Environmental
report and available on request at the Entity’s headquarters.                                                                                                                            We conducted interviews with the persons responsible for preparing the CSR Information
                                                                                                                                                                                         in the departments in charge of collecting the information and, where appropriate,
Independence and quality control                                                                                                                                                         responsible for internal control and risk management procedures, in order to:

Our independence is defined by the requirements of article L.822-11-3 of the French                                                                                                      •        assess the suitability of the Guidelines in terms of their relevance, completeness,
Commercial Code and the French Code of Ethics (Code de déontologie) of our profession. In                                                                                                         reliability, neutrality and understandability, and taking into account industry best
addition, we have implemented a system of quality control including documented policies                                                                                                           practices where appropriate;
and procedures regarding compliance with applicable legal and regulatory requirements,                                                                                                   •        verify the implementation of data-collection, compilation, processing and control
the ethical requirements and French professional guidance.                                                                                                                                        process to reach completeness and consistency of the CSR Information and obtain
                                                                                                                                                                                                  an understanding of the internal control and risk management procedures used to
                                                                                                                                                                                                  prepare the CSR Information.

1 	 Total energy Use, Total Office Energy Usage, Office Energy Usage per square meter, Percentage reduction in total energy use compared to 2015 baseline, Total greenhouse gas emissions, Total greenhouse gas emissions per employee, Percentage of reduction in greenhouse gas emissions per employee since 2015, Greenhouse gas emissions related to business travel,
    Greenhouse gas emissions related to business travel per employee, Percentage reduction in business travel emissions per employee compared to 2015 baseline, Share of operations by headcount covered by ISO 14001 certification
                                                                                                                                                                                                                                                                                                        Capgemini Environmental Sustainability Performance Report 2019/20 - 25
2 ISAE 3000 : international standard on assurance engagements other than audits or reviews of historical financial information
Introduction Resourceful Impactful Performance Scorecard Assurance
We determined the nature and scope of our tests and procedures based on the nature and Conclusion
importance of the CSR Information with respect to the characteristics of the Entity, the
human resources and environmental challenges of its activities, its sustainability strategy In our opinion, the CSR information selected by the Entity and identified by the symbol in
and industry best practices. the Environmental report is fairly presented, in all material respects, in compliance with the
Guidelines.
At the Entity level, we performed analytical procedures on the CSR information and
verified, using sampling techniques, the calculation and the consolidation of the data.
Paris-La Défense, on July 9th 2020
At the level of a representative sample of entities selected by us3 on the basis of their
activity, their contribution to the consolidated indicators, their location and a risk analysis, KPMG S.A.
we conducted interviews to verify that procedures are properly applied and to identify
potential undisclosed data, and we performed tests of details, using sampling techniques,
in order to verify the calculations and reconcile the data with the supporting documents.
The selected sample represents between 40% and 79% of the CSR information.
Anne Garans Stéphanie Ortega Frédéric Quélin
We consider that this work enables us to express a conclusion of reasonable assurance for
the information selected by the Entity and identified by the symbol . Partner Partner Partner
Sustainability Services
Due to the use of sampling techniques and other limitations inherent to information and
internal control systems, the risk of not detecting a material misstatement in the CSR
information cannot be totally eliminated.
3 India, France, Netherlands, Italy.
26 - Capgemini Environmental Sustainability Performance Report 2019/20You can also read