INTEGRATED North Bristol NHS Trust - PERFORMANCE REPORT
←
→
Page content transcription
If your browser does not render page correctly, please read the page content below
North Bristol NHS Trust

    INTEGRATED
PERFORMANCE REPORT
 March 2021 (presenting February 2021 data)
CONTENTS

                                                                                       Page
CQC Domain / Report Section              Sponsor / s
                                                                                      Number
                                        Chief Operating Officer
                                        Medical Director and Deputy Chief Executive
Performance Scorecard and Summaries     Director of Nursing                             3
                                        Director of People and Transformation
                                        Director of Finance

Responsiveness                          Chief Operating Officer                         10
                                        Medical Director and Deputy Chief Executive
Safety and Effectiveness                                                                24
                                        Director of Nursing
Patient Experience                      Director of Nursing                             31
Research and Innovation                 Medical Director                                33
                                        Director of People and Transformation
Well Led                                Medical Director and Deputy Chief Executive     34
                                        Director of Nursing
Finance                                 Director of Finance                             40
Regulatory View                         Chief Executive                                 43
Appendix                                                                                45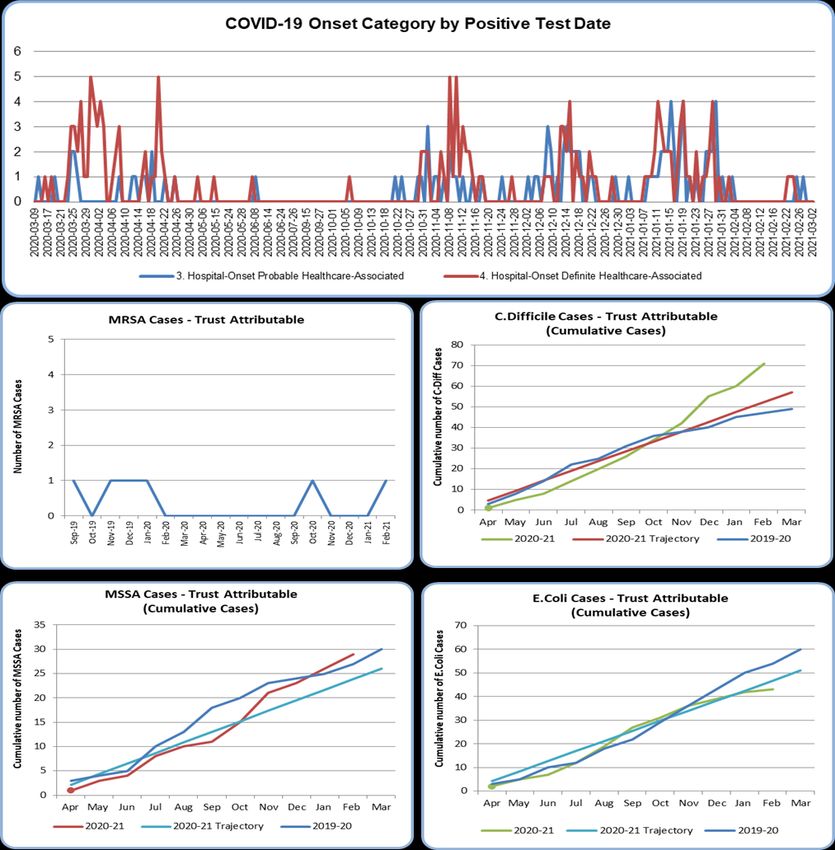
North Bristol Integrated Performance Report

                                                                                                                                                                                                                               Benchmarking
                                                                           Current Month                                                                                                                                (in arrears except A&E & Cancer as
                                                                National
Domain                                Description                            Trajectory  Feb-20   Mar-20 Apr-20 May-20 Jun-20         Jul-20   Aug-20   Sep-20    Oct-20   Nov-20   Dec-20   Jan-21   Feb-21   Trend           per reporting month)
                                                                Standard
                                                                               (RAG)                                                                                                                                     National
                                                                                                                                                                                                                       Performance
                                                                                                                                                                                                                                        Rank      Quartile

               A&E 4 Hour - Type 1 Performance                  95.00%        79.90%     72.43%   80.16%   96.00%   95.47%   94.74%   93.47%   86.90%   87.76%    82.07%   77.95%   73.21%   68.51%   73.33%            77.01%         78/113
               A&E 12 Hour Trolley Breaches                        0             0          48       2        0        0         0       0        0        0        12        3       52       206       7              0 - 195         8/23
               Ambulance Handover < 15 mins (%)                  100%         95.30%     91.06%   95.41%   94.72%   97.38%   98.50%   98.07%   98.01%   76.69%    68.06%   67.67%   57.76%   54.95%   65.81%
               Ambulance Handover < 30 mins (%)                  100%         99.17%     98.15%   99.37%   99.53%   99.56%   99.96%   99.76%   99.83%   96.04%    93.49%   93.75%   88.43%   83.80%   93.37%
               Ambulance Handover > 60 mins                        0             0           2       1        0        0         0       0        0        4        33       26       82       180      57
               Stranded Patients (>21 days) - month end                                    155      120      58       57        74      82       95       114       247      141      144      125      130
               Bed Occupancy Rate                                             93.00%     98.87%   82.25%   50.84%   58.18%   77.11%   82.97%   87.51%   92.30%    94.19%   92.38%   95.10%   95.86%   92.74%
               Diagnostic 6 Week Wait Performance                1.00%        20.97%      5.60%   10.25%   61.24%   65.94%   46.56%   28.98%   32.36%   29.58%    27.47%   26.73%   32.37%   33.04%   27.20%            33.34%        148/252
               Diagnostic 13+ Week Breaches                        0             0         113      114      402     2292     3161     1886     1979     1998      1697     1427     1487     1420     1358                           128/211
               Diagnostic Backlog Clearance Time (in weeks)                                0.1      0.2      1.2      2.7      2.0      1.0      1.0      0.9       0.9      0.8      1.0      1.0      0.8
  Responsive

               RTT Incomplete 18 Week Performance               92.00%        63.94%     82.95%   80.02%   71.82%   64.51%   58.20%   58.48%   63.96%   70.46%    74.00%   74.35%   73.18%   71.62%   70.65%            66.14% 188/390
               RTT 52+ Week Breaches                               0           2893         17      43       130      275      454      648      797     1001      1092     1249     1418     1817     2108            0 - 10663 167/274
               Total Waiting List                                              34435      29552    28516    25877    25518    25265    27512    28814    29387     30214    29632    29611    29759    29716
               RTT Backlog Clearance Time (in weeks)                                       3.0      3.2      4.4      6.9      10.3     9.5      7.6      6.4       5.4      4.8      4.9      5.1      5.7
               Cancer 2 Week Wait                               93.00%        91.26%     89.94%   91.25%   76.01%   93.23%   97.29%   88.11%   78.05%   76.30%    89.01%   78.65%   63.72%   60.03%      -              83.39%        129/133
               Cancer 2 Week Wait - Breast Symptoms             93.00%        96.04%     89.63%   81.82%   81.25%   98.28%   96.62%   96.05%   75.18%   54.04%    87.76%   61.07%   33.77%   49.64%      -              62.67%         69/104
               Cancer 31 Day First Treatment                    96.00%        93.77%     95.36%   97.71%   92.96%   85.64%   95.35%   97.51%   95.78%   90.31%    92.68%   97.01%   95.47%   89.84%      -              94.01%         93/116
               Cancer 31 Day Subsequent - Drug                  98.00%         100%       100%     100%     100%     100%     100%     100%     100%     100%      100%     100%     100%     100%       -              98.01%          1/52
               Cancer 31 Day Subsequent - Surgery               94.00%        82.83%     70.89%   85.09%   75.76%   79.73%   86.96%   92.13%   89.86%   85.19%    87.76%   91.95%   92.22%   77.66%      -              86.33%         57/73
               Cancer 62 Day Standard                           85.00%        86.30%     61.31%   74.15%   73.53%   69.01%   70.12%   75.31%   73.10%   70.07%    72.87%   75.76%   77.39%   65.91%      -              71.18%         94/137
               Cancer 62 Day Screening                          90.00%        85.71%     67.27%   83.95%   85.07%   46.67%   28.57%   44.44%   66.67%   100.00%   77.14%   76.92%   86.36%   78.57%      -              79.78%         38/66
               Mixed Sex Accomodation                              0             0           0       0        0        0         0       0        0        0         0        0        0        0        0
               Electronic Discharge Summaries within 24 Hours    100%                    83.22%   84.09%   84.07%   84.62%   85.89%   83.39%   82.78%   82.99%    84.18%   83.80%   82.98%   81.69%   84.17%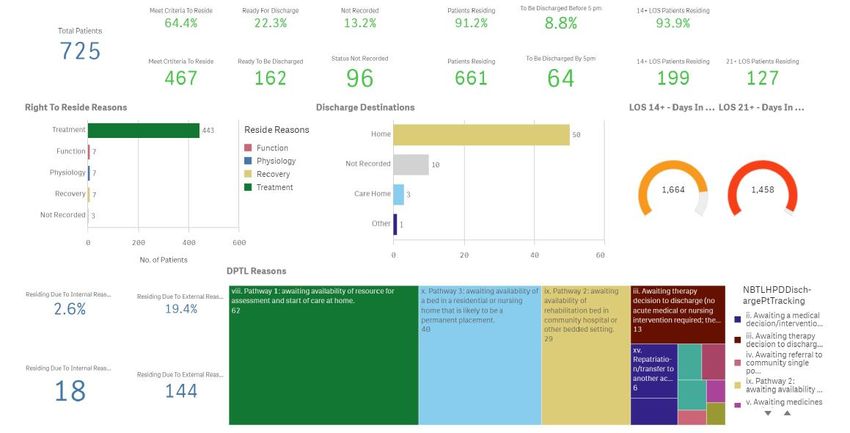
North Bristol Integrated Performance Report
Current Month
National
Domain Description Trajectory Feb-20 Mar-20 Apr-20 May-20 Jun-20 Jul-20 Aug-20 Sep-20 Oct-20 Nov-20 Dec-20 Jan-21 Feb-21 Trend
Standard
(RAG)
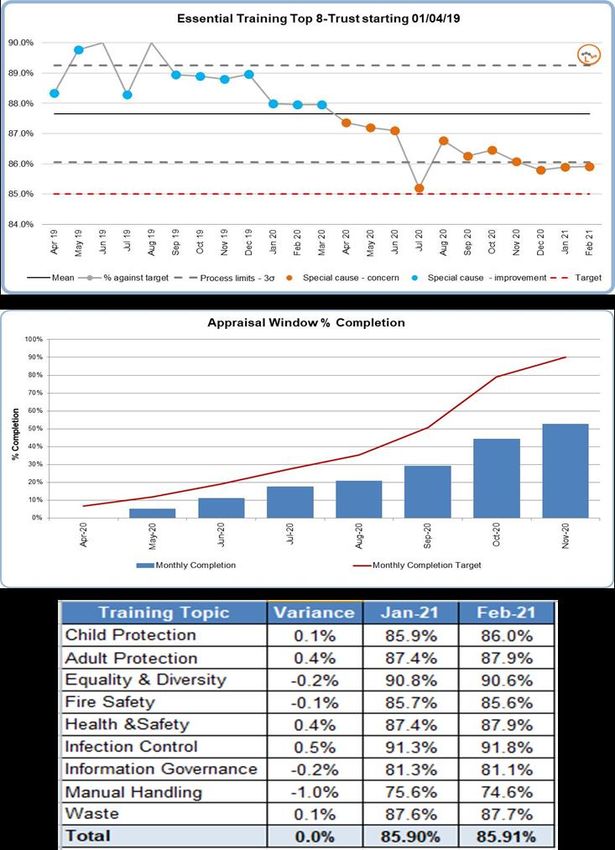
5 minute apgar 7 rate at term 0.90% 0.7% 0.7% 1.3% 1.6% 1.0% 0.6% 0.2% 0.2% 0.6% 0.7% 0.7% 0.5% 0.5%
Caesarean Section Rate 28.00% 34.0% 33.4% 31.5% 33.9% 36.7% 34.6% 39.0% 35.0% 36.4% 31.2% 41.9% 35.1% 38.7%
Still Birth rate 0.40% 0.0% 0.4% 0.2% 0.0% 0.0% 0.4% 0.2% 0.4% 0.0% 0.2% 0.6% 0.5% 0.2%
Induction of Labour Rate 32.10% 41.4% 40.8% 40.6% 38.9% 34.9% 35.4% 38.6% 38.9% 36.6% 39.8% 37.6% 39.8% 33.8%
PPH 1000 ml rate 8.60% 9.2% 9.7% 8.7% 12.9% 11.5% 11.2% 10.7% 8.0% 10.4% 14.2% 8.9% 9.8% 11.6%
Never Event Occurance by month 0 0 0 0 0 0 0 0 0 0 0 0 0 1 0
Serious Incidents 9 10 2 2 4 7 5 4 5 6 4 3 2
Total Incidents 1118 853 597 679 833 948 1028 1056 1202 1049 1040 1007 663
Total Incidents (Rate per 1000 Bed Days) 45 39 45 43 46 47 49 47 50 49 48 41 31
Quality Patient Safety & Effectiveness
WHO checklist completion 95% 99.30% 99.30% 99.50% 99.50% 99.60% 99.70% 99.70% 99.60% 99.60% 99.40% 99.95% 99.79% 99.94%
VTE Risk Assessment completion 95% 94.96% 95.35% 93.45% 93.89% 94.52% 95.40% 94.58% 94.64% 94.66% 94.02% 94.96% 94.48% 93.51%
Pressure Injuries Grade 2 17 29 24 16 13 8 14 13 28 17 17 17 27
Pressure Injuries Grade 3 0 1 1 0 0 0 0 0 1 1 0 0 0 0
Pressure Injuries Grade 4 0 0 0 0 0 0 0 0 0 0 0 0 1 0
Falls per 1,000 bed days 8.54 7.34 10.14 8.84 8.09 7.10 7.71 6.69 9.56 8.93 8.54 9.62 8.64
#NoF - Fragile Hip Best Practice Pass Rate 60.00% 70.91% 2.13% 10.20% 9.43% 47.46% 63.64% 54.17% 77.27% 75.61% 63.64% 35.56% -
Admitted to Orthopaedic Ward within 4 Hours 54.72% 55.36% 85.11% 87.76% 83.02% 86.44% 66.67% 79.17% 67.44% 53.66% 57.14% 35.56% -
Medically Fit to Have Surgery within 36 Hours 71.70% 83.93% 85.11% 67.35% 79.25% 74.58% 72.73% 68.75% 86.05% 80.49% 79.59% 55.56% -
Assessed by Orthogeriatrician within 72 Hours 92.45% 100.00% 95.74% 97.96% 98.11% 98.31% 90.91% 87.50% 93.02% 95.12% 79.59% 75.56% -
Stroke - Patients Admitted 72 97 71 72 79 84 63 83 86 79 80 70 61
Stroke - 90% Stay on Stroke Ward 90% 87.10% 86.67% 87.10% 81.50% 86.20% 80.00% 93.20% 88.00% 84.62% 81.97% 80.88% 58.18% -
Stroke - Thrombolysed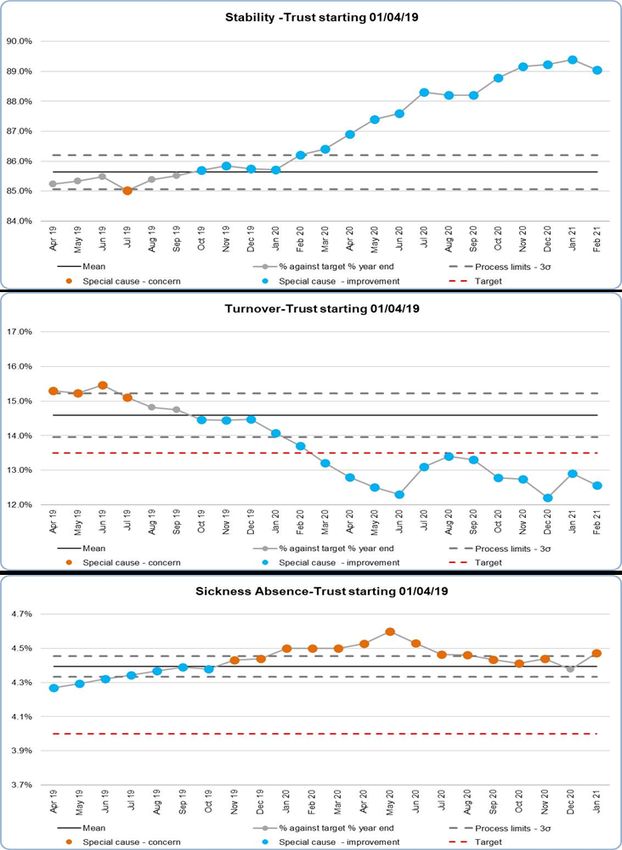
EXECUTIVE SUMMARY
                                                                  February 2021
Urgent Care
Four-hour performance improved, but the Trust did not achieve the performance trajectory of 79.90% with performance of 73.33% in February. The Trust
conceded 57 ambulance handover delays and seven 12-hour trolley breaches, which was an improvement on January’s position. The improved position in
February reflects the reduction in COVID-19 admissions, however, staffing pressures, segregated care and IPC measures continued to negatively impact flow,
affecting performance and preventing achievement of trajectory. The Trust remains in the third quartile for ED performance when compared nationally.
Performance is expected to improve in March.
Elective Care and Diagnostics
The RTT waiting list remained static in February with demand growth offsetting increasing clock stops. There were 2108 patients waiting greater than 52 weeks
for their treatment in February against a revised trajectory of 2893. The continued increase in breaches is due predominately to reduced elective activity as part
of the ongoing COVID-19 response and the impact of the application of the Royal College of Surgeons Clinical Prioritisation guidance. Nationally, the Trust
positioning was static in January, remaining in the third quartile. Diagnostic performance improved in February with improvement reported for most test types in-
month; Non Obstetric Ultrasound and Urodynamics reported the most significant improvement.
Cancer wait time standards
The TWW standard further deteriorated in January and continues to report under trajectory; the majority of breaches were in Breast, Colorectal, Upper GI and
Skin. The 31-Day standard deteriorated more significantly, not achieving the recovery trajectory in January or the national standard and remains in the fourth
quartile when compared nationally. The 62-Day standard failed both the recovery trajectory and the national standard, with the level of deterioration having
moved the Trust from the second to the third quartile in January when compared nationally. It is anticipated that the Trust will continue to fail TWW in February
largely due to breast capacity. The Trust is forecasting achievement of the 31-Day target, but there are continued performance problems with the remaining
standards.
Quality
A revised Maternity data set is being developed, which will provide assurance across a range of areas and will provide more meaningful information as the data
builds across following months. There have been no reported Grade 3 or 4 pressure injuries in February. C. difficile case numbers remain above trajectory with
late sampling and documentation accounting for the majority of the lapses.
Workforce
The Trust turnover saw a small reduction in February to 10.95% (excluding the impact of staff temporarily employed during the COVID-19 response). The Trust
vacancy factor decreased to 3.65% due to the ongoing enhanced HCA resourcing plan, which delivered a net gain of 23.70 WTE in this group. Temporary
staffing demand decreased by 12% in February (equivalent to 136 WTE) in line the reduction in COVID-19 related staff absence. Annual sickness absence saw
limited change in January; however the mix of absence continues to see a reduction in short-term sickness and an increase in long-term sickness,
predominantly relating to COVID-19 sickness and our People Team continue to develop support resources for managers accordingly.
Finance
NHSI/E suspended the 2020/21 financial framework due to COVID-19 response preparations. The revised financial framework for months 1 to 6 required the
Trust to breakeven against an NHSI/E calculated income level and to recover costs incurred in dealing with the COVID-19 pandemic in line with national
guidance. From 1 October 2020 a new financial framework is now in place that requires the Trust to operate within a fixed financial envelope (plus a small
number of specified “outside envelope” cost recoveries) and to deliver a deficit that is consistent with the financial forecast submitted on 22 October 2020.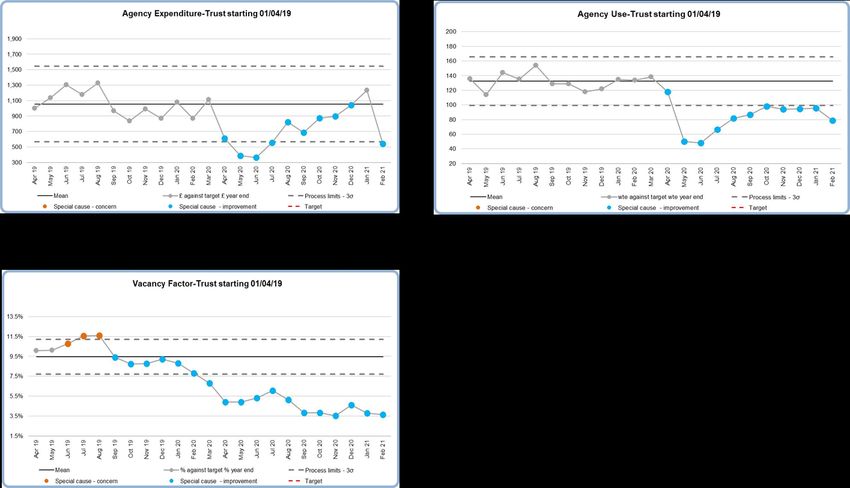
RESPONSIVENESS
                                                        SRO: Chief Operating Officer
                                                                Overview
Urgent Care
The Trust reported a four-hour performance of 73.33% in February, not meeting the performance trajectory of 79.90%. There were seven, 12-hour trolley
breaches, and Ambulance handover delays were reported in-month with 57 handovers exceeding one hour. Despite walk-in attendances reducing as a result of
the national lockdown, attendances did increase to higher than expected towards the end of the month, whilst ambulance arrivals remained consistent with pre-
pandemic levels. Bed occupancy improved, varying between 88.02% and 98.65% in February against the core bed base. Bed occupancy was positively
impacted by a reduction in long stay patients towards the end of the month achieved through the BNSSG enhanced COVID-19 community capacity plan;
supporting a reduction in ED wait for bed delays.

Planned Care
Referral to Treatment (RTT) - 18 week RTT performance reported a deterioration in February, but continues to achieve the trajectory of 63.94%. The number
of patients exceeding 52 week waits in February was 2108 against a recovery trajectory of 2893; the majority of breaches (1256; 59.58%) being in Trauma and
Orthopaedics. Reduced elective activity as a result of the ongoing COVID-19 response and the application of the Royal College of Surgeons Clinical
Prioritisation guidance, leading to some of the longest waiting patients having further extended waits, has been a significant factor in the deterioration in the 52
week wait position and the 18 week RTT performance. In addition, the Trust is still experiencing some patients choosing to defer their treatment due to concerns
with regards to COVID-19 or wishing to wait until they have received the COVID-19 vaccine.
Diagnostic Waiting Times – Diagnostic performance improved, though continued to fail the recovery trajectory with performance at 27.20% in February;
reflective of the continued reduced activity resulting from the third wave of the pandemic. Improvement has been reported for Non-Obstetric Ultrasound resulting
from additional Waiting List Initiative capacity, supporting backlog clearance. The number of patients waiting longer than 13 weeks improved, with a decrease of
3.17% reported in February. Compared nationally, 13 week performance deteriorated marginally in January and remains in the fourth quartile.

Cancer
The Trust achieved one of the Cancer Wating Time (CWT) standards (31-Day subsequent – chemotherapy treatment) and trajectories for January 2021. The
Breast service continues to see an increase of TWW referrals above expected activity levels (34% increase vs. January 2020) and continues to have workforce
constraints in both clinical and diagnostic support. Despite this, Breast have continued to perform well against the 28-Day diagnosis standard with 90% of
patients meeting the timed target vs. a standard of 75%; with most patients offered a one stop appointment by day 18. Overall, the Trust achieved the 28-Day
diagnosis standard and Urology achieved trajectory targets for all standards in January. For February the Trust will continue to fail TWW largely due to Breast
capacity. Achievement of the 31-Day target is anticipated for February, but performance problems persist with the remaining CWT standards.
Areas of Concern
The main risks identified to the delivery of national Responsiveness standards are as follows:
• Lack of community capacity and/or pathway delays fail to support bed occupancy requirements as per the Trust’s response to the COVID-19 pandemic.
• The ongoing impact of COVID-19 Infection Prevention and Control guidance and Clinical Prioritisation guidance on the Trust’s capacity and productivity and
   therefore, ability to deliver national wait times standards.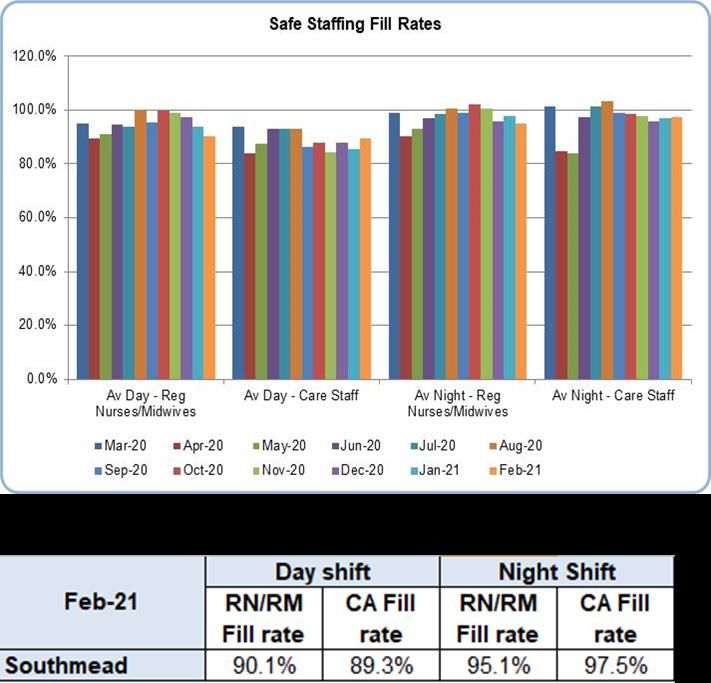
QUALITY PATIENT SAFETY AND EFFECTIVENESS
                               SRO: Medical Director and Director of Nursing & Quality
                                                     Overview

Improvements

Maternity Minimum Data Set : A revised Maternity data set is being developed which will provide assurance across a range of areas and will provide more
meaningful information as the data builds across following months. The Ockenden nationally required maternity assurance report was submitted as required to
NHS England on 15 February 2021 and further assurance will be provided to the Quality & Risk Management Committee meeting on 18 March 2021. There have
been no new HSIB referrals, or new completed reports in the past month relating to individual patient safety incidents.

Pressure Injuries: There have been no reported Grade 3 or 4 pressure injuries in February. The Trust wide Pressure Injury Review Group recommenced in
March with plans to review specific themes from validated pressure injuries in February including medical devices and pressure injuries to heels.

Mortality Reviews / Medical Examiner service – The Trust continues to closely review deaths in hospital with a 95.1% completion rate. The Medical Examiner
service, established across the BNSSG acute trust system is reviewing an increasing number of cases with clear signposting of any concerns into the Trust’s
governance systems.

Areas of Concern

Infection control: C. difficile case numbers remain above trajectory and the cases have been analysed, with late sampling and documentation accounting for
the majority of the lapses. IPC are working with Divisional infection leads to reduce risks. One case of MRSA bacteraemia was identified on 8 February 2021 and
is being investigated following required protocols.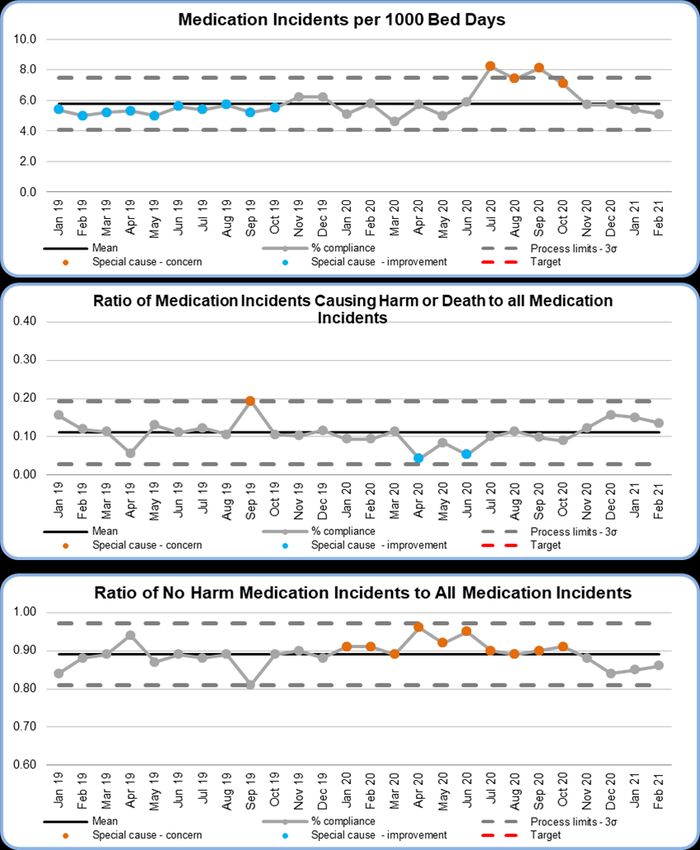
WELL LED
                 SRO: Director of People and Transformation and Medical Director
                                            Overview
Corporate Objective 4: Build effective teams empowered to lead

Vacancies
The Trust vacancy factor decreased to 3.65% in February (from 3.80% in January 2020 (this excludes the impact of the COVID-19 vaccination workforce
recruitment). The greatest net reduction in vacancies was in Additional Clinical Services (unregistered clinical staff) predominantly driven by the enhanced winter
resourcing plan for HCAs. Nurse band 2 and 3 saw a net gain of 23.7 WTE.

Turnover
The Trust turnover is reported as 12.56% in February. Excluding the impact of staff leaving who were on temporary contracts during the COVID-19 response the
Trust turnover is 10.95%, compared to 13.95% in February 2020. All staff groups saw fewer leavers than the same period last year with the most significant
reduction being in clinical fellows, followed by administrative and clerical staff and registered nursing and midwifery.

Prioritise the wellbeing of our staff
The rolling 12 month sickness absence was 4.48% in January, an increase from December reflecting the spike in levels of COVID-19 related sickness. The level
of short term sickness in January 2021 compared with January 2020 was the same with other non-COVID-19 related short term sickness reasons at lower levels.
Long term sickness was 0.50% higher in January 2021 than the same period in the previous year. The Trust saw an 85% reduction in long term sickness driven
by cough/cold/influenza but a 2300 % increase in long term sickness related to infectious diseases which reflects long term COVID-19 Sickness. Management
guidance and support for staff off sick with Long COVID-19/Post-COVID 19 Syndrome has been implemented in response.

Continue to reduce reliance on agency and temporary staffing

Overall temporary staffing demand decreased in February (-12% equivalent to 136 WTE) in line with the significant reduction in COVID-19 related staff absence.
Temporary staff requests for booking reason ‘COVID-19’ and ‘Sickness’ decreased by 26%. As a result bank fill increased and agency fill and unfilled shifts
decreased.

Tier 4 agency use decreased from 7 WTE to 2 WTE in February with both band 5 Registered Nurses (RN) and band 5 Registered Mental Health Nurse (RMN)
use reducing. ICU had the highest RN use in December and January and saw the greatest reduction with the emergency zone seeing the greatest reduction in
RMN use and as a result overall agency expenditure decreased. Tier one agency use also decreased, 23 nursing teams saw a reduction vs 14 team seeing an
increase. Wards and theatres remain the highest areas of tier one agency use, with Theatres Anaesthetics remaining the highest user at 10 WTE.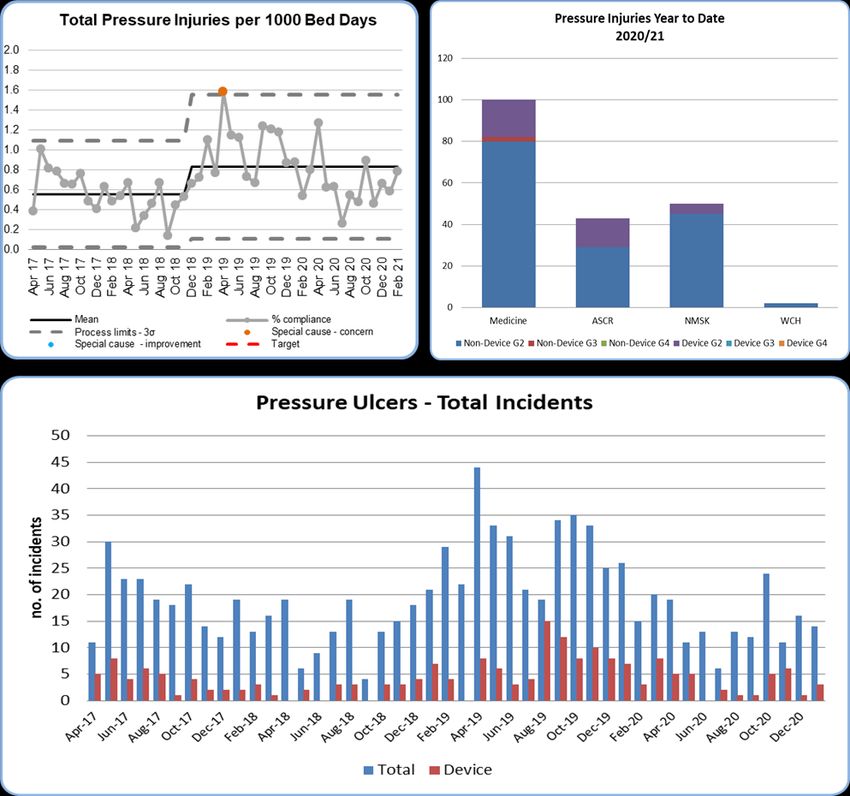
FINANCE                                                                                9
                                                                      SRO: CFO
                                                                      Overview

NHSI/E suspended the 2020/21 financial framework due to COVID-19 response preparations.

The revised financial framework for months 1 to 6 required the Trust to breakeven against an NHSI/E calculated income level and to recover costs incurred in
dealing with the COVID-19 pandemic in line with national guidance.

From 1 October 2020 a new financial framework is now in place that requires the trust to operate within a fixed financial envelope (plus a small number of
specified “outside envelope” cost recoveries) and to deliver a deficit that is consistent with the financial forecast submitted on 22 October 2020.

Highlights:

The Forecast Trust deficit for February is £4.9m, while Actual deficit reported is £2.3m.
Cumulatively the Forecast Trust deficit to month 11 is £17.9m and the Actual deficit is £0.8m.

Cash balance at the end of February £146.6m which includes £55m of “month in hand” cash that was received in April 2020 and will be unwound in March.

Capital spend for the year to date is £18.2m (plan is £24.6m) which includes £4.1m of COVID capital spend.
Responsiveness

Board Sponsor: Chief Operating Officer
           Karen Brown
Urgent Care As anticipated, four-hour performance improved in February but the Trust did not achieve the trajectory of 79.90% with performance of 73.33%. Trust performance has reported below national performance for the second consecutive month. The Trust conceded 57 ambulance handovers exceeding one hour in February and seven 12-hour trolley breaches reflecting a significant improvement on January’s position. The improvement seen in ED performance for February reflects the continued reduction in COVID-19 admissions throughout the month, allowing for de-escalation in the number of Blue wards along with a reduction in the number of COVID-19 patients in ICU. However, staffing pressures, segregated care and enhanced IPC measures continued to negatively impact flow, affecting performance and preventing achievement of trajectory for February. Staffing pressures were more significant in the second half of the month where attendance levels increased and all Divisions saw emergency predictors reached or exceeded. ED performance continues to improve throughout March, currently achieving trajectory with performance of 78.68%.
4-Hour Performance
In February, Majors performance
improved, though continued to be most
notably impacted (61.98%), whilst Minors
performance remained static at 94.80%.
Despite walk-in attendances reducing as a
result of the national lockdown,
attendances did increase to higher than
expected towards the end of the month. In
addition, ambulance arrivals remained
consistent with pre-pandemic levels.
Of the breaches in ED in February,
46.66% were a result of waiting for a
medical bed and 22.72% of delays
resulted from waits for assessment.
Despite being the predominant cause of
breaches for the sixth consecutive month,
Medicine bed capacity contributed to less
than half of the breaches for the first time
since September 2020, with a higher
proportion of breaches in February being
due to waits for assessment..
Bed occupancy improved, varying between
88.02% and 98.65% in February against
the core bed base. Bed occupancy
continues to be positively impacted by a
reduction in long stay patients, supporting
a reduction in ED delays. Across January
and February the bed days for patients
awaiting discharge once medically fit
remained constant.
The Trust position has deteriorated for ED
performance when compared nationally,
though remains in the third quartile. ED
performance for the NBT Footprint stands
NB: The method for calculating bed occupancy changed in June and September due to reductions in the overall bed base resulting from the implementation of IPC at 78.70% and the total STP performance
measures.
was 79.31% for February.Right to Reside Report As of midnight 12/03/21(snapshot), 162 patients (22.3% of all patients) no longer meet the right to reside criteria, and under the Hospital Discharge Guidance model, should be discharged on the day they meet that criteria. Of the numbers that do not meet the right to reside, 88% are waiting for discharge to assess community capacity. Across January and February the bed days for patients awaiting discharge once medically fit remained constant. There has been an improvement in flow for those waiting for pathway 2 as the beds have re-opened following COVID-19 outbreaks. However, there remain constraints in pathway 3 with the prolonged closure of the most complex dementia beds. In addition, whilst there has been a significant increase in the referral levels to pathway 1, the increased complexity of those referred requiring higher levels of care has increased the waiting time significantly and is currently identified as the pathway with the highest number waiting.
Stranded Reporting

                                                              The reported levels for 7 days+ and
                                                              21 days+ are showing a reduction in
                                                              patient numbers and this has
                                                              remained a consistent trend. This
                                                              has led to a percentage bed
                                                              occupancy of 14.67% vs. 17.84% in
                                                              January for patients waiting over 21
                                                              days, as measured against all
                                                              Trusts in the South West.

                                                              The level of people who are
                                                              returning home on pathway 0 or
                                                              pathway 1 has met the NHSE/I
                                                              expectation of 95% across the
                                                              month. This has continued to be
                                                              supported by the Red Cross with
                                                              telephone support for advice and
                                                              signposting.

                                                              The Trust is committed to ensuring
                                                              that we are completing the Single
                                                              Referral Form and therefore the
                                                              handover of care to the community,
                                                              through a timely and effective
                                                              process. Therefore, there will be a
                                                              renewed review of the process for
                                                              completion to ensure a referral is
                                                              accepted first time.

                                                              Current rejection rates for SRFs in
                                                              February vary between 7.50% to
                                                              11.00%.

Data Source: South region NHSI UEC dashboard, w/e 7th March
Diagnostic Waiting Times Diagnostic performance improved to 27.20% in February, but failed to achieve the trajectory of 20.97%. Improvement has been reported for most test types in month. Endoscopy reported a further reduction in activity resulting predominantly from reduced IS capacity. Despite the activity reduction, increased demand coupled with a 2.09% reduction in the backlog improved performance marginally for February. Non-Obstetric Ultrasound reports a significant improvement in month. The overall capacity shortfall arising from COVID-19 IPC measures has been mitigated by additional in-house weekend WLI (Waiting List Initiative) capacity supporting backlog clearance. Weekend activity has now been scheduled for most of the year to support further backlog clearance going forwards. Urodynamics also reported improvement in-month due to an increase in demand and backlog reduction. The number of patients waiting longer than 13 weeks improved, with a decrease of 3.17% reported in February. A high level review continues to be completed for patients exceeding 13 weeks to ensure no harm has resulted from the extended wait times. Nationally, Trust positioning improved slightly for 6-Week performance, though remains in the third quartile. 13 Week performance deteriorated marginally, remaining in the fourth quartile.
Referral to Treatment (RTT)
In February, the Trust reported RTT performance
of 70.65%, exceeding the trajectory of 63.94%. The
waiting list remained static at 29716 in February,
reporting under the trajectory of 34435. Demand
growth following the onset of the pandemic has
been less than anticipated with elective activity
delivering predominantly above plan, resulting in a
lower waiting list than predicted.

Overall, admitted and non-admitted clock stops
increased to 85.91% of last year’s activity in
February, with a greater increase in admitted clock
stops resulting from easing pandemic pressures.
Increased activity was predominantly offset by
increased demand in February resulting in a static
wait list position.

At month end, there were 2108 patients waiting
greater than 52 weeks for their treatment against a
trajectory of 2893; the majority of breaches (1256;
59.58%) being in Trauma and Orthopaedics. In
February, there were 9 patients waiting more than
52 weeks that the Trust had accepted as late
referrals from another Provider; the Trust is
supporting equity of access to Clinical Immunology
and Allergy services within the Region.

The continued increase in breaches is due
predominately to reduced elective activity as part
of the ongoing COVID-19 response and the impact
of the application of the Royal College of Surgeons
Clinical Prioritisation guidance. In addition, the
Trust is still experiencing some patients choosing
to defer their treatment due to concerns with
regards to COVID-19.

Nationally, the Trust’s 18 week performance
positioning in January was static and remains in
the third quartile. The positioning of the 52WW
breaches as a proportion of the overall wait list
improved, though remains in the third quartile.
Cancer: Two Week Wait (TWW)
The Trust failed to achieve the recovery
trajectory and the national TWW standard with
performance of 60.03% in January. Across
2020, TWW breaches were largely due to
Endoscopy capacity now it is largely due to
Breast one stop capacity. The Trust saw 1779
TWW patients in January; 711 breached. The
largest volume of breaches were in Breast,
Colorectal, Upper GI and Skin.

At times this led to TWW patients being seen
outside of normal CWT standards; the deviation
particularly in the Breast and Colorectal
pathways have been agreed by the SWAG
Clinical Group and NBT Clinicians.

The January performance for Breast was
28.03%; a small increase in performance
against their December position of 26.99%,
mainly due to one stop clinic capacity short fall.
Variations in referrals across all modalities and
changes in how primary care deliver services
especially in the reduction of face-to-face
consultations have resulted in increased
demand on TWW services.

In Breast this has resulted in an increase of 226
Breast referrals in January 2021 (877) vs.
January 2020 (651); an increase of 34%
particularly for Breast pain . The service were
also subject to COVID-19 staffing impact to
their Radiology team. However, the average
day seen remains at 18 days and Breast
achieved 90% of patients diagnosed by 28-
Days in January. TWW performance in
February is forecast to be 71.00%.

Although the TWW position is below target, the
Trust is diagnosing 75% of patients within 28-
Days.
Cancer: 31-Day Standard
In January the Trust failed to achieve
the standard with a performance of
89.84%. There were 187 completed
pathways with 19 breaches; 9 in
Skin; 4 in Urology; 2 in Colorectal; 3
in Breast; and 1 in Brain. 31-Day
performance in February is forecast
to be 96%.

The specialties that achieved CWT
target were Gynaecology,
Haematology, Lung, Sarcoma, and
Upper GI. Breast and Urology were
very close to achieving the standard;
Breast with performance of 93.33%
and Urology with performance of
92.86%.

The Trust failed the 31-Day
subsequent overall standard with a
January position of 80.37%;107
patients were treated with 21
breaches. The Trust also failed the
subsequent Surgery standard in
January with a position of 77.66%;
82 patients were treated with 20
breaches. 18 of the 20 breaches
were in Skin; 11 due to sentinel node
biopsy capacity, which was reduced
due to COVID-19 plans to redeploy
theatre staff to ICU surge plans. This
will continue into February.

COVID-19 impact on 104-Day
remains low; in January there were
37 patients waiting longer than 104-
Days. The biggest delay reason is
due to patient choice related to
COVID-19.
Cancer: 62-Day Standard
                                                                                                                       The reported 62-Day performance for
                                                                                                                       January is 65.71% with 110 treatments
                                                                                                                       and 37.5 breaches. The Trust failed both
                                                                                                                       the post COVID-19 recovery trajectory
                                                                                                                       position of 86.10% and the CWT
                                                                                                                       standard of 85.00%. February
                                                                                                                       performance is predicted to be 72%.

                                                                                                                       Skin and Upper GI were the only
                                                                                                                       specialties that achieved 62-Day CWT
                                                                                                                       standard in January; Skin with a
                                                                                                                       performance of 92.31% and Upper GI of
                                                                                                                       100%.

                                                                                                                       Urology failed the 62-Day standard of
                                                                                                                       85.00% achieving 54.55% with 15
                                                                                                                       breaches. They achieved post COVID-19
                                                                                                                       revised trajectory of 52.00%. The majority
                                                                                                                       of the 15 Urology breaches were due to
                                                                                                                       provider delays, specifically turnaround
                                                                                                                       times for template biopsy and Radiology.

                                                                                                                       Colorectal failed to achieve the standard
                                                                                                                       with 36.36%; this was an improvement on
                                                                                                                       December’s performance. They treated
                                                                                                                       11 patients with 7 breaches in January.
                                                                                                                       The majority of this month’s breaches
                                                                                                                       were due to patient fitness and provider
                                                                                                                       delay within the diagnostic and treatment
                                                                                                                       planning stages to Endoscopy and
                                                                                                                       deferral due to medical reasons.

                                                                                                                       Breast 62-Day performance was 69.81%;
                                                                                                                       treating 26.5 patients with 8 breaches. 5
                                                                                                                       breaches were due to complex pathways
                                                                                                                       involving multiple diagnostics or complex
                                                                                                                       bilateral cancers. The Breast pathway is
                                                                                                                       introducing a pain referral triage process,
NB: The breach types come from the internal reporting system and therefore may not exactly match the overall numbers   which will have a positive impact on the
reported nationally.                                                                                                   62-Day pathway going forward.
Cancer 104-Day Patients Live PTL Snapshot as of 2021 The Trust had 50 patients on the live cancer PTL as of 11 January waiting over 104-Days. The report is split into two sections; patients with or without a Decision to Treat (DTT) for cancer treatment. The Trust had 37 patients waiting >104-Days without a DTT: 2 in Breast; 11 in Colorectal; 9 in Skin; one each in Upper GI; Haematology; and Lung; and 12 in Urology. The total number of patients currently over 104- Days on their pathway without a decision to treat has improved further since the January snapshot (43). There were 13 patients with a DTT >104-Days with a confirmed cancer diagnosis: 3 in Breast; and 10 in Urology. There has been a significant increase of Urology 104-Day waiters in this snapshot. However when looking at the breakdown, 6 out of 10 patients were transferred to NBT late into their pathways from external Trusts, all past the 62-Day target. All have treatment plans in place.
Non-Elective Activity vs Plan

•   ED attendances have reported below
    plan since October 2020 in concordance
    with national lockdown rules and
    reduction in minors activity.
•   Non-Elective activity for February has
    increased to near planned levels; the
    increase was predominantly for 0 LoS
    and direct admissions.

NB: March 2021 plan is above 100% due to March
2020 actuals being partially impacted by COVID-19.
Activity vs Plan information includes only Specific
Acute specialties.
Elective Activity vs Plan
• Day case activity in January and
February reduced more than planned
resulting from the impact of the third
wave of the pandemic.
• Overnight admissions have
achieved plan in every period with the
exception of Quarter three and four.
The winter months have been
particularly impacted by elective
cancellations in response to the
second and third wave of COVID-19.
• Outpatient first attendances have
been above plan in most periods.
January has been impacted by the
third wave of the pandemic with
activity increasing in February as
services begin to recover.
• Outpatient follow up attendances
have been above plan for every
period.
• Outpatient procedures have been
above plan in most periods. January
has been impacted by elective
cancellations due to the third wave of
the pandemic.
NB: March 2021 plan is above 100% due to March
2020 actuals being partially impacted by COVID-
19. Data includes activity undertaken in the
Independent Sector on behalf of the Trust. Activity
vs Plan information includes only Specific Acute
specialties.Diagnostic Activity vs Plan
• Endoscopy activity reports
below plan and target from
September. At test level, all
Endoscopy test types reported
below plan for February. This
relates to the under-reporting of
activity due to a coding lag.
• CT activity increased in February
with a corresponding
improvement in performance, but
did not achieve plan.
• MRI activity did not achieve plan
in February, but did achieve the
national standard of 1% for 6-
Week wait performance with
performance at 0.50%.
NB: March 2021 plan is above 100% due to
March 2020 actuals being partially impacted
by COVID-19. Activity vs Plan information
includes only Specific Acute specialties.Safety and Effectiveness
Board Sponsors: Medical Director and Deputy Chief Executive
and Director of Nursing and Quality
Chris Burton and Helen BlanchardCOVID-19 Maternity
QP3 Visiting arrangements within maternity were
reviewed following national guidance on 14
December 2020 and this guidance will be reviewed
to maintain safety of mothers, babies and staff
within BNSSG. Partner visiting on postnatal wards
has been reintroduced following the introduction of
Lateral Flow Testing (LFT).
Incidence of COVID-19 amongst Maternity
population reduced during February as shown
below (-25 since Jan-21).
Perinatal Quality Surveillance Tool
The information provided represents the
recommended information from the Ockenden
investigation report. NBT Maternity is further
developing this dataset to ensure the Board is
informed of safety metrics and indicators.
CNST deadline has been postponed until July 2021
and currently progress against CNST standards is
8/10.
Serious Incidents:
QRMC receives a summary of each serious
incident investigation, including themes and
learning.QP2
Pressure Injuries
The Trust ambition for 2020/21 is:
• Zero for both Grade 4 and 3 pressure injuries.
• 30% reduction of Grade 2 pressure injuries.
• 30% reduction of device related pressure
injuries.
There have been no reported Grade 3 or 4
pressure injuries in February. 27 Grade 2
pressure injuries were reported of which 8 were
related to a medical device.
The incidence summary for the month is as
follows:
Medical Devices: 30%
Heels: 37%
Buttock: 22%
Spine/ Coccyx/ Natal Cleft: 11%
The Trust wide Pressure Injury Review Group
recommenced in March with plans to review
specific themes from validated pressure injuries in
February including medical devices and pressure
injuries to heels.
The Divisions continue to complete peer review
audits. There are specific Quality Focus Meetings
in Medicine to address themes from validated
pressure injuries with identified actions to review
and implement divisionally.QP4
COVID-19 (Coronavirus)
The infection control effort and resources
are focused on managing the COVID-19
pandemic and its impact on the Trust. In
February there was a reduction in both
staff and patient involvement in outbreaks
resulting in fewer hospital onset cases.
All events are the subject of Outbreak
meetings with appropriate PHE input. A
daily infection control huddle led by the
DIPC or deputy DIPC ensured appropriate
actions were taken promptly. Staff across
the Trust have been supported in good use
of PPE and standard IPC precautions.
Additional support has been given to
increase uptake of Lateral Flow Testing
(LFT) both as an early warning tool and
also for outbreak management. The
successful vaccination programme has
contributed to reduction in hospital
outbreaks.
MRSA
One MRSA bacteraemia within the renal
service is being investigated.
C. difficile
The Trust will not achieve the trajectory for
C. difficile cases this year following
increased numbers in autumn 2020 that
have continued in Quarter one 2021. Late
sampling and poor documentation account
for a number of cases and may be a
consequence of the pandemic pressures.
Divisional DoNs with increased support
from IPC are working to return to best
practice. Antibiotics given to patients with
COVID-19 infection may also have
contributed to additional cases.QP2
WHO Checklist Compliance
The Board expects that a WHO surgical safety checklist will be
completed and documented prior to each operation in theatres.
The IPR report of less than 100% is due to issues with data capture. All
cases where WHO was not recorded electronically are reviewed to
ensure that checklist compliance was recorded in the paper medical
records.Medicines Management Medication Incident Rate per 1000 Bed Days NBT had a rate of 5.1 medication incidents per 1000 bed days. Higher levels of reporting are considered an indicator of a strong safety culture. It is thought that rates of reporting fell during the last quarter due to pressures from the pandemic. The Trust will be working to increase reporting again in the months ahead. Percentage of Medication incidents reported as causing Harm or Death During February 2021, 13.5% of all medication incidents are reported to have caused a degree of harm. There has not been an increase in absolute number and the increased percentage is thought to be linked to the reduction in reporting of low level incidents discussed above. North Bristol Trust Medication Incident Reporting Organisations where staff believe reporting incidents is worthwhile are likely to report a higher proportion of "no harm" incidents. During February 2021, “no harm“ incidents accounted for 86% of all NBT reported medication incidents. NBT has a medicines governance process overseen by the Drugs and Therapeutics Committee which reports to Quality and Risk Management Committee.
Mortality Outcome Data

                                                                                                       Mortality Outcome Data
                                                                                                       An increase in deaths was seen in December
                                                                                                       and January, which is likely to have been the
                                                                                                       result of increasing COVID-19 infections, with
                                                                                                       subsequent fall in February a reversal of this
                                                                                                       impact. The SHMI remains within the expected
                                                                                                       range but there is significant lag in reporting this
                                                                                                       number.

                                                                                                       There are no current Mortality Outlier alerts for
                                                                                                       the trust.

                                                                                                       Mortality Review Completion
                                                                                                       Between 01 Dec 2019 and 30 Nov 2020, 95.1%
                                                                                                       of all deaths had a completed review, including
                       Mortality Review Completion                                                     through the Medical Examiner system.
                                                                                   *171 (non high
                                                                                   priority) cases     21 of the 21 deceased patients with Learning
                                                                                   were excluded
                                                                                                       Disability and 33 of the 33 patients with Serious
                                                                                   from any form
                                                                                   of review
                                                                                                       Mental Illness have had completed reviews.
                                                                                   between             Mortality Review Outcomes
                                                                                   January and
                                                                                                       The percentage of cases reviewed by MCR with
                                                                                   April 2020 to
                                                                                   aid with clearing
                                                                                                       an Overall Care score of adequate, good or
                                                                                   a backlog of        excellent is 96.2%. There have been 18
                                                                                   cases               mortality reviews with a score indicating
                                                                                   worsened by         potentially poor, or very poor care which have
                                                                                   the COVID-19        undergone learning review through divisional
                                                                                   pandemic            governance processes. 1 case has been
                                                                                   mortality review    confirmed as SIRI (Feb 20).
                                                                                   suspension.
                                                                                                       Pandemic 3rd Wave Process
                                                                                   All high priority   As agreed with the Clinical Audit and
                                                                                   cases are being     Effectiveness Committee a revised review
                                                                                   reviewed.           process is being instituted to manage a back log
1Inresponse to increased operational pressures as a result of wave 3 of the COVID-19 pandemic as
                                                                                                       of reviews as a result of the pandemic.
agreed at the February CEAC meeting the window for screening has been extended by 1 month and
therefore the date parameters for this IPR are 3 months in arrears as opposed to the usual 2.
Patient Experience
Board Sponsor: Director of Nursing and Quality
Helen BlanchardComplaints and Concerns
In February 2021, the Trust received 43 formal
complaints. This is a slight increase of the number
received in January.
The most common subject for complaints remains
‘Clinical Care and Treatment’. There has been a
consistent increase in complaints regarding
‘Attitude of Staff’ over the past 3 months, and a
notable increase in complaints regarding
‘Discharge Arrangements’ in February.
The 43 formal complaints can be broken down by
division: (the previous month total is shown in
brackets)
ASCR 13 (10) CCS 2 (1)
Medicine 12 (11) NMSK 3 (7)
WCH 11 (8) IM&T 1 (0)
Research 1 (0)
Enquiries and PALS concerns are recorded and
reported separately. In February, a total of 65
enquiries were received by the Patient Experience
Team and 71 PALS concerns were received. This
is an increase of activity from January.
Complaint Response Rate Compliance
The chart demonstrates the % of complaints
responded to within agreed timescales. In February
there has been an improvement in compliance rate,
from 81% in January to 84%. This is still below the
Trust target of 90%.
Of the 32 complaints due to be closed in February,
27 were responded to on or before the due date. 5
complaints were delayed, 2 in WACH, 1 in
Facilities, 1 in NMSK and 1 in ASCR.
Overdue complaints
N.B. Feb-19 and Mar-19 data has been removed for complaints, concerns and overdue complaints owing to data There are no overdue complaints.
quality issues. From June-19 Enquiries have not been included in the ‘concerns’ data.Research and Innovation In addition to the 3442 participants recruited into COVID-19 studies, NBT researchers have also recruited 2195 patients into non-COVID- 19 studies, achieving 104% of target. NBT has also contributed a further 3865 patient data records to the Avon-Cap study (A Pan-Pandemic Respiratory Infection Surveillance Study), which is providing surveillance on the effectiveness of vaccines. NBT suspended 221 studies during the epidemic and 166 studies have been re- started or closed. Due to the second wave, restart needed to slow during November and December 2020 but has resumed in February 2021. NBT continues to work collaboratively with other Trusts to enable patients from Gloucester, Swindon, Bath and greater Bristol to participate in COVID-19 vaccine trials. NBT currently leads 53 research grants (NIHR, charity, industry and other) to a total value of £20.3m, and is a partner on 50 grants to a total value of £6.3m. R&I has just opened a general call for applications to the SHC Research Fund (2020/21) and welcomes any NBT staff member wishing to undertake a research project (up to £20k) in any subject area to apply.
Well Led

Board Sponsors: Medical Director, Director of People and
                  Transformation
          Chris Burton and Jacqui Marshall
Workforce
Resourcing
February 2021 saw a decrease in the demand on Temporary staffing, which
resulted in significant reductions on the need for Tier 4 support and the
resulting reduction in overall spend.
There is also a strong pipeline of Registered and Non Registered staff
coming through the recruitment process.
The NBT eXtra team continue to provide support for short term staffing needs
for the BNSSG Mass Vaccination project. Demand from PCN’s and
Community Pharmacies are increasing and NBT eXtra have filled all 40
requests received so far.
A Spring Nursing Careers digital event took place over 2 days. 50 candidates
registered to attend on the day, and from 20 interviews, 14 offers were made.
February saw a total of 32 offers made and 8 Band 5 Nurse starters, as well
as 6 International Nurse arrivals.
HCA Recruitment saw 22 offers made to Healthcare Support workers in Band
2 and 3 in February and 25 starters. This took our HCA vacancies down to 42
WTETurnover and Stability
Engagement and Wellbeing NBT, as well as being part of the Healthier Together Retention Task and Finish
group (Pathfinder project), is also working at system level to address potential
future increases in turnover due to the work impact on staff of COVID-19. We
have developed the ‘Four Pillars of Recovery’. One of these pillars is retention,
and includes a system-wide focus on:
• ‘Itchy feet’ offer to staff at risk of leaving
• Refreshing our flexible working options
• Recovery leave
• Career conversations
• Communication, engagement/ messaging of the offer to staff (EVP)
• Development opportunities and CPD
The ‘Itchy Feet’ campaign and ’Leaving the Trust’ resources are currently
being refreshed by the People Team within NBT. The Trust is also actively
working on the development of a framework/guidance document for managers
which will enable them to support staff wishing to take extended periods of
leave to aid their recovery, stamina and well-being.
NBT’s approach to retention is currently being audited by KPMG as part of their
rolling programme of audits.
Sickness and Health and Wellbeing
Work undertaken to help improve sickness absence includes:
• Implementing the helpful feedback from KPMG’s recent audit of the ER
Case Tracker, particularly around the management of sickness cases;
• The development and implementation of management guidance and
support for staff off sick with Long COVID-19/Post-COVID-19 Syndrome;
• Review and refresh of the Sickness Absence policy has now commenced;
• Continuation of high level case reviews for the ‘top 30’ LTS with People
Business Partners and senior HR representatives. Partners have found
these sessions helpful in supporting the effective management of the Trust’s
longest sickness cases. A number of the longest cases have now been
resolved;Essential Training Despite challenging staffing conditions, compliance continues to remain inline with the 85% threshold, with eLearning being the main access route. Clinical sessions requiring a practical element remain at a reduced attendance ratio due to social distancing requirements, wherever possible additional session have been added to compensate for this. Leadership & Management Development A reduced programme of offerings will be in place until April 2021 (although content directly related to staff wellbeing or use of eRostering is still available). Apprenticeship Centre Wherever feasible, Apprenticeship activity has continued the pandemic. Effective April 2021, the Trust will be providing extra support sessions to those ward based learners where it has not been possible to have Assessors in clinical environments. Traineeship Programme The Trust has been successful in receiving funding to offer up to 20 places on our Traineeship Programme. This programme, specifically for unemployed 19- 24 year olds from the local community, provides access to 8 weeks of training and work experience. 88% of previous programme participants have been successful in gaining paid employment with NBT. Our next Trainees will join us in April and May 2021. .
The safe staffing report now requires the wards to identify Nursing Associates
                                                                             including Trainees and AHP staff employed in an inpatient area. There are
                                                                             however ongoing issues with the reporting and this has been escalated to
                                                                             Allocate the roster provider. We will be back reporting as soon as it is possible.
                                                                             Wards below 80% fill rate for Registered Staff:
                                                                             for all areas safe staffing maintained through daily staffing monitoring
                                                                             and supplementing with unregistered staff as required
                                                                             Percy Phillips Ward (78.6% Day/ 77.9% Night) unexpected absence,
                                                                             midwifery staff redeployed to support safe care from other services.
                                                                             27b (73.5% Day) Registered staff vacancies
                                                                             7a (60.1% Day / 54.1% Nights) This was a green ward which is intermittently
                                                                             running below full occupancy.
                                                                             7b (79.4% Day) This was a green ward which is intermittently running below full
                                                                             occupancy.
                                                                             Cotswold (53.8%) Reduced occupancy
                                                                             ICU (73% day) Vacancies, Registered staff deployed from ICU Mega Team to
                                                                             support.
                                                                             Wards below 80% fill rate for Care Staff:
                                                                             for all areas safe staffing maintained through daily staffing monitoring
                                                                             and supplementing with registered staff as required
                                                                             Cotswold Ward (47.7% day & 65.1% nights) : Reduction in HCSW required
                                                                             due to lower occupancy
                                                                             8b: (71.7% night) Unregistered staff vacancies safe staffing maintained through
                                                                             daily staffing monitoring and supplementing with registered staff as required
                                                                             26a (79% day) Unregistered staff vacancies safe staffing maintained through
                                                                             daily staffing monitoring and supplementing with registered staff as required
                                                                             7a (52.1% day / 57.4% night) This was a green ward which is intermittently
                                                                             running below full occupancy
                                                                             NICU (49.6% Days / 63.4% Nights) Unregistered staff vacancies, safe staffing
                                                                             maintained through daily staffing monitoring and supplementing with registered
                                                                             staff as required. ,
                                                                             34b (72.7% day) Ward closed for period of time in month.
                                                                             ICU (41.1% day & 43.3% nights) safe staffing maintained through daily staffing
The numbers of hours Registered Nurses (RN) / Registered Midwives (RM)       monitoring and supplementing with ICU Mega Team
and Care Assistants (CA), planned and actual, on both day and night shifts   Quantock Ward (70.8% day) Unregistered staff vacancies
are collated. CHPPD for Southmead Hospital includes ICU, NICU and the        Wards over 150% fill rate:
Birth Suite where 1:1 care is required. This data is uploaded on UNIFY for   33a (207.4% night) higher acuity and increased burns patients
NHS Choices and also on our Website showing overall Trust position and       6b (166.4% night) additional patients requiring enhanced care support with
each individual gate level. The breakdown for each of the ward areas is      RMN and colocation of tracheostomy patients into this area.
available on the external webpage.                                           Rosa Burden (178.3% night) patients requiring enhanced care support
Care Hours per Patient Day (CHPPD) The chart shows care hours per patient day for NBT total and is split by registered and unregistered nursing. The chart shows CHPPD for the Model Hospital peers (all data from Model Hospital). CHPPD are consistent with last month, rostered hours overall are above the required hours due to the decreased patient census and reduced lists. Safe Care Live (Electronic Acuity Tool) The acuity of patients is measured three times daily at ward level. The Safe Care data is triangulated with numbers of staff on shift and professional judgement to determine whether the required hours available for safe care in a ward/unit aligns with the rostered hours available. Staff will be redeployed between clinical areas and Divisions following daily staffing meetings involving all Divisions, to ensure safety is maintained in wards/areas where a significant shortfall in required hours is identified, to maintain patient safety.
Finance

Board Sponsor: Chief Financial Officer
           Glyn Howells
41
Statement of Comprehensive Income
Assurances
The financial position at the end of February shows a year to date
deficit of £0.8m compared to a forecast deficit of £17.9m
The trust achieved breakeven in months 1 to 6 under the cost
recovery regime implemented to support service delivery under
COVID-19 and a deficit of £0.8m when operating within the new
financial envelope.
Income for the month includes a retrospective claim of £0.8m for
Nightingale Hospital costs and a further £0.1m for mass Statement of Financial Position
vaccination services.
Assurances
There are no further key issues to report. The improved cash position of £146.6m (£m up since March) is a result of the current
financial regime of advance payment arrangements presently in place for all NHS
Trusts.
Key Issues
The level of payables is reflected in the Better Payment Practice Code (BPPC)
performance for the year to date in 2020/21 of 86.6% by value compared to an
average of 85.8% for financial year 2019/20.42 Financial Risk Ratings , Capital Expenditure and Cash Forecast Capital expenditure for the first 11 months of the year is £18.2m which compares to a year to date plan of £24.6m. Financial Risk Rating The new financial framework means that a Financial risk rating is no longer calculated or reported to NHSI. Rolling Cash forecast The high level cash flow below is in line with NBT’s element of the forecast submitted to NHSI on 22nd October. This shows that the Trust has will end the year with a circa. £85m cash balance after the unwinding of the month in hand advance payment in March 2021.
Regulatory

Board Sponsor: Chief Executive
        Evelyn Barker
Monitor Provider Licence Compliance Statements at February 2021
Self-assessed, for submission to NHSI
Comp
Ref Criteria Comments where non compliant or at risk of non-compliance
(Y/N)
Fit and proper persons as Governors A Fit and Proper Person Policy is in place.
and Directors (also applicable to All Executive and Non-Executive Directors have completed a self assessment and no issues have been
G4 Yes identified. Further external assurance checks have been completed as appropriate and no issues have been
those performing equivalent or
similar functions) identified.
G5 Having regard to monitor Guidance Yes The Trust Board has regard to NHS Improvement guidance where this is applicable.
CQC registration in place. The Trust received a rating of Good from its inspection reported in September 2019.
Registration with the Care Quality
G7 Yes A number of mandatory actions were identified which are being addressed through an action plan. The Trust
Commission Board receives updates on these actions via its Quality and Risk Management Committee.
Patient eligibility and selection
G8 Yes Trust Board has considered the assurances in place and considers them sufficient.
criteria
A range of measures and controls are in place to provide internal assurance on data quality, including an annual
P1 Recording of information Yes Internal Audit assessment.
P2 Provision of information Yes The trust submits information to NHS Improvement as required.
Assurance report on Scrutiny and oversight of assurance reports to regulators is provided by Trust's Audit Committee and other
P3 Yes Committee structures as required.
submissions to Monitor
NBT complies with national tariff prices. Scrutiny by CCGs, NHS England and NHS Improvement provides
P4 Compliance with the National Tariff Yes external assurance that tariff is being applied correctly. It should be noted that NBT is currently receiving income
via a block arrangement in line with national COVID-19 financial arrangements.
Trust Board has considered the assurances in place and considers them sufficient. It should be noted that NBT
Constructive engagement
P5 Yes is currently receiving income via a block arrangement in line with national COVID-19 financial arrangements.
concerning local tariff modifications
Trust Board has considered the assurances in place and considers them sufficient. It should be noted that the
C1 The right of patients to make choices Yes Trust is currently implementing national COVID-19 guidance on service restoration.
C2 Competition oversight Yes Trust Board has considered the assurances in place and considers them sufficient.
Range of engagement internally and externally. No indication of any actions being taken detrimental to care
IC1 Provision of integrated care Yes integration for the delivery of Licence objectives.Appendix 1: Glossary of Terms
REPORT KEY
Unless noted on each graph, all data shown is for period up to, Abbreviation Glossary
and including, 31 February 2021 unless otherwise stated. AMTC Adult Major Trauma Centre
ASCR Anaesthetics, Surgery, Critical Care and Renal
All data included is correct at the time of publication. ASI Appointment Slot Issue
Please note that subsequent validation by clinical teams can alter CCS Core Clinical Services
scores retrospectively. Chief Executive
CEO
Clin Gov Clinical Governance
CT Computerised Tomography
DDoN Deputy Director of Nursing
DTOC Delayed Transfer of Care
ERS E-Referral System
GRR Governance Risk Rating
HoN Head of Nursing
IMandT Information Management
IPC Infection, Prevention Control
LoS Length of Stay
NBT Quality Priorities 2020/21 MDT Multi-disciplinary Team
Med Medicine
QP1 Enhance the experience of patients with Learning MRI Magnetic Resonance Imaging
Disabilities and / or Autism by making reasonable NMSK Neurosciences and Musculoskeletal
adjustments which are personal to the individual
Non-Cons Non-Consultant
QP2 Being outstanding for safety – at the forefront nationally
Ops Operations
of implementing the NHS Patient Safety Strategy within
a ‘just’ safety culture. P&T People and Transformation
PTL Patient Tracking List
QP3 Ensuring excellence in our maternity services, delivering
RAP Remedial Action Plan
safer maternity care.
RAS Referral Assessment Service
QP4 Ensuring excellence in Infection Prevention and Control RCA Root Cause Analysis
to support delivery of safe care across all clinical
SI Serious Incident
services
TWW Two Week Wait
WCH Women and Children's Health
WTE Whole Time EquivalentYou can also read