Waiter, is that inclusion in my soup? A new recipe to improve business performance
←
→
Page content transcription
If your browser does not render page correctly, please read the page content below

Waiter, is that
inclusion in my soup?
A new recipe to improve
business performance

Research report
November 2012

Joint foreword                                           Contents

Deloitte Australia (Deloitte) and the Victorian Equal
Opportunity and Human Rights Commission are
                                                         Opening up the cookbook to the first page   1
proud to launch Waiter, is that inclusion in my soup?
A new recipe to improve business performance.            Cooking up a storm                          5
This joint initiative reflects our shared view that a
                                                         Inclusion – the missing ingredient          11
focus on diversity and inclusion is both a business
and fairness issue.                                      I want some soup too                        14
                                                         A few practical ideas                       20
We wish to thank the three diverse Australian
businesses that participated in this research project,   Final words                                 24
and of course the 1,550 employees who responded          Methodology and contacts                    26
to Deloitte’s Diversity, Inclusion and Business
Performance survey. Their generosity means that
Australian organisations, both private and public,
can accelerate their own business performance
through diversity and inclusion.

Our innovative research charts new territory and
hence, to some degree, it is a work in progress.
Our aim in releasing it now is to help re-orient
businesses away from their greater level of attention
to diversity compared with inclusion, not realising
that both are equally critical for business success.

In addition to the bias towards diversity, we also see
a lack of certainty about the concept of inclusion
(hence the question: Waiter, is that inclusion in
my soup?). Our research identifies the key indicators
and drivers of inclusion, and thus helps pave the way
for practical changes.

                             Giam Swiegers
                             (CEO, Deloitte Australia)

                             Karen Toohey
                             (Victorian Equal
                             Opportunity and
                             Human Rights Acting
                             Commissioner)
Opening up
the cookbook
to the first page

         Waiter, is that inclusion in my soup?   1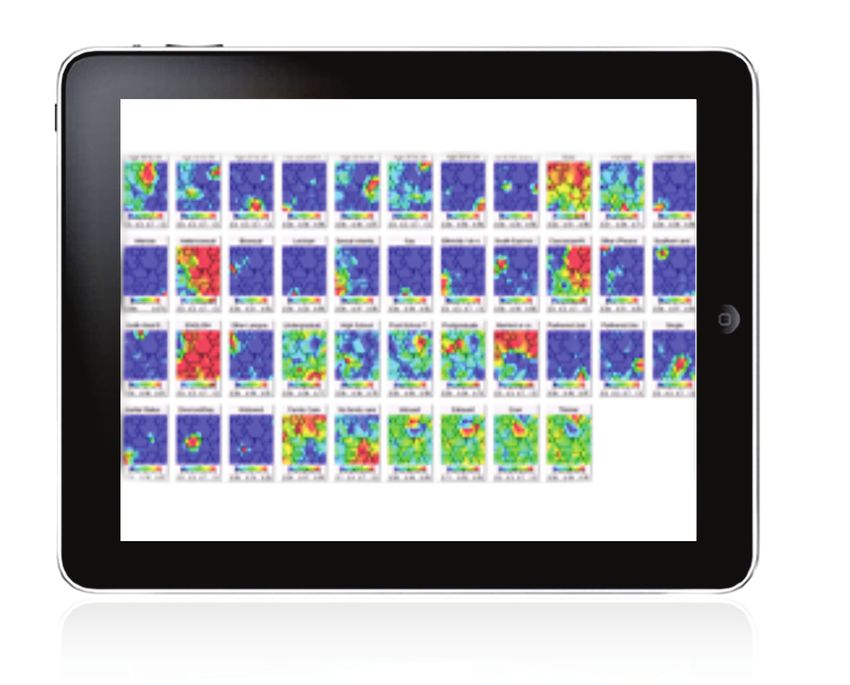
Setting the scene

                                  The pressure is on                                            Taking a step back…then moving forward
                                  Doing more with less, fiscal pressure and constraint,         In order to contextualise this research, we first need
                                  uncertainty, volatility… still common themes for              to take a step back. Of course the starting point for a
                                  organisations across the globe in 2012. It has shaken         general diversity and inclusion story is open to robust
                                  our confidence1 and clarity of response. Unexpectedly         debate (turn of the century? The 60s?), so let’s just
                                  diversity and inclusion are emerging as beacons of            stick with what we have observed over the past three
                                  hope. A little farfetched? Our ground-breaking research       years of significant change.
                                  in three diverse workplaces (manufacturing, retail
                                  and healthcare) demonstrates the tangible uplift in           Around 2010, a host of countries started introducing
                                  business performance when employees think that their          measures (e.g. legislation) to increase female
                                  workplace is highly committed to, and supportive of,          representation on boards2. Contemporaneously,
                                  diversity and they feel highly included.                      business leaders were reflecting on the Global
                                                                                                Financial Crisis and business failures, both in terms
                                  If you are still sceptical, then here is the ultimate punch   of antecedents and preventative measures. Decision-
                                  line. When Deloitte modelled the relationship between         making and bias was a common area of discussion
                                  diversity and inclusion and business performance,             across both domains. The impact of the simultaneous
                                  we identified an ‘uplift’ of 80% when both conditions         exploration of these complex issues by brilliant
                                  were high. More specifically, employees who perceive          minds from diverse disciplines, and the demand from
                                  their organisation is committed to, and supportive of,        business for immediate effective interventions, has
                                  diversity and who feel included, are 80% more likely          been a catalyst for deep insights and change.
                                  to believe they work in a high performing organisation,
                                  in comparison to a workplace perceived as having low          Deloitte captured some of these insights in previous
                                  commitment and support for diversity and employees            thought leadership articles3. These analyses not only
                                  not feeling included. Even when there is high diversity       helped Deloitte to understand and synthesise the
                                  and low inclusion, or low diversity and high inclusion,       plethora of new ideas, but also to identify knowledge
                                  the business outcomes are never as impressive as the          and practice gaps.
                                  high diversity and high inclusion combination.
                                                                                                Firstly, we observed that organisations gave much
                                  We knew we were onto something, but this result               more weight to diversity than inclusion, and yet the
                                  stopped us in our tracks. So we modelled customer             research pointed to diversity + inclusion = improved
                                  service, innovation and engagement. Same deal,                business performance. Secondly we observed that
                                  perceptions of business outcomes are always                   academics and workplace experts struggled to
                                  significantly higher with high diversity and high             articulate a clear definition of inclusion. Our hunch
1 Deloitte Australia, The CFO
                                  inclusion. Clearly the relationship is not a wildcard.        was that if organisations failed to get the diversity and
  Survey Q3 2012: Proceed
  with caution                                                                                  inclusion balance right, and to increase their focus on
2 Deloitte Touche Tohmatsu        These data lead us to argue that a greater focus on           inclusion, then the game-changing potential of this
  (2011) Women in the             diversity and inclusion – and knowing what this               ‘moment in time’ would be lost.
  Boardroom: A global             really means from a practical point of view – is the
  perspective                     way forward.
3 Leadership: Do men and
  women do it differently?
  (2011); Working in an
  ideological echo chamber?
  Diversity of thought as
                                  Our hunch was that if organisations failed to get the
  a breakthrough strategy
  (2011); Only skin deep?
                                  diversity and inclusion balance right, and to increase
  Re-examining the business
  case for diversity (2011) and
                                  their focus on inclusion, then the game-changing
  Inclusive leadership: Will a
  hug do? (2012)
                                  potential of this ‘moment in time’ would be lost

2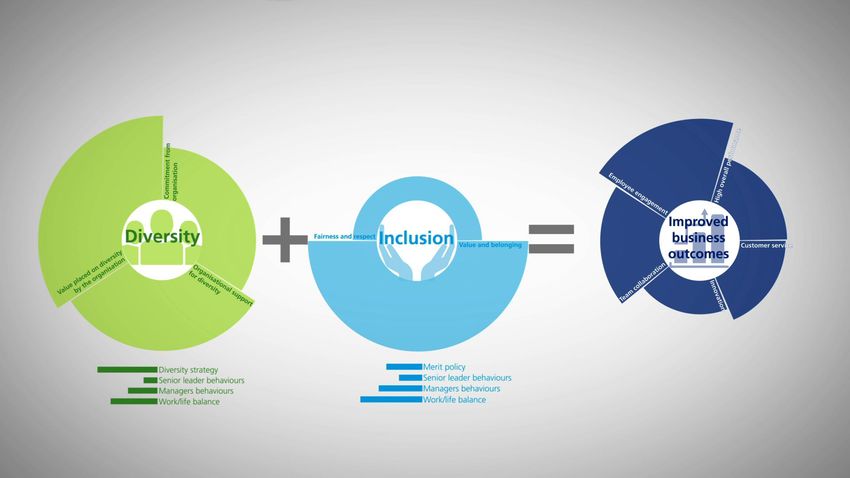
So to move forward, we suggest a new recipe for
success in which there is an equal focus on diversity
and inclusion, facilitated by a clear understanding of
the concept of inclusion and its drivers. That’s what
this report, Waiter, is that inclusion in my soup? A new
recipe to improve business performance, is all about.

 Rebalancing the
  overweighting
   of attention

                                                           Improved                      Providing
      Diversity                     Inclusion               business                    specificity of
                                                           outcomes                      outcomes

                                   Providing
                                   clarity of
                                 understanding

                                                                       Waiter, is that inclusion in my soup?   3
Key findings

Diversity + inclusion     Organisations need           Inclusion is tangible       Work-life balance           Data directs an
= improved business       to increase their                                        is a key signal             organisation’s biggest
performance               focus on inclusion                                                                   bang for buck

When employees think      Rebalancing the              The concept of inclusion    An employee’s ability to    Data can help
their organisation is     focus on diversity and       incorporates both an        balance their work-life     organisations direct their
committed to, and         inclusion, rather than       active process of change    commitments is a key        efforts to unleash the
supportive of diversity   prioritising diversity,      (verb: to include) and an   driver of an employee’s     diversity and inclusion
and they feel included,   will enable organisations    emotional outcome           feeling of inclusion.       potential with greater
employees report better   to unleash their diversity   (I feel included).          It signals that an          precision and confidence.
business performance      potential.                                               employee is seen as         The starting point is
in terms of ability to                                 More specifically,          a whole person with         collecting organisation
innovate, (83% uplift)    This means that if           feelings of inclusion are   a life within and           specific data to identify
responsiveness to         an organisation has          driven by perceptions of    outside the workplace.      the change interventions
changing customer         overweighted their           (i) fairness and respect    Work-life balance is also   which will deliver the
needs (31% uplift)        attention to diversity,      and (ii) value and          read as a signal of the     biggest bang for buck.
and team collaboration    additional effort is         belonging. These two        organisation’s support
(42% uplift).             needed to focus on           elements build upon one     for diversity.
                          inclusion.                   another sequentially.

4
Cooking
up a storm

    Waiter, is that inclusion in my soup?   5
Charting a new direction

       As noted in the foreword, this research is exploratory        Figure 1
       and to some degree a work in progress. That means             Q: ‘I work in a high performing organisation’
       that whilst we have a long wish list of outcomes
       and indicators of business performance, this research         High performing organisation
       covers only some and is weighted towards employee
       perceptions. Nevertheless, these employee insights are        High
       compelling as it is reasonable to assume that they have
       a clear view of workplace operations from the inside.                                                    The end goal

       In terms of perceptual indicators, we asked                                                                 1.80x
                                                                                        1.49x

                                                                     Diversity
       employees about their views on the end goal,
       namely business performance (Q: I work in a high
       performing organisation).

       A picture tells a thousand words: when employees                                The uplift
       think that their organisation is highly committed to,
       and supportive of diversity, and they feel highly included,                        1x                       1.27x
                                                                     Low
       then they are 80% more likely to agree that they
       work in a high performing organisation than if they                       Low                Inclusion                  High
       perceive low support and commitment for diversity
       and low inclusion.

       Compare the statistically significant difference
       between the bottom left quadrant (the baseline
       of low diversity and low inclusion, which we have
       named 1x) with the top right quadrant (high diversity
       and high inclusion). This outcome is coming from
       a low base, but what if an organisation is already
       demonstrably committed to diversity? Performance
       could still improve, and in these circumstances the
       uplift potential of a dual diversity + inclusion focus is
       31% (compare the top left and top right quadrants).

       “A picture tells a thousand words: when employees
       think their organisation is highly committed to, and
       supportive of diversity, and they feel highly included,
       then they are 80% more likely to agree that they
       work in a high performing organisation…”

6
Looking at business
performance from the inside

       So what were employee’s thinking about when                       Figure 3
       they evaluated their organisation’s performance?                  Q: ‘We share diverse ideas to develop innovative
       Understanding their frames of reference gives us                     solutions’
       more confidence in their appraisal, especially when
                                                                         Innovation
       we found that they were looking at performance
       indicators in their direct line of sight, namely:                 High

       1. Customer service
       2. Innovation
       3. Team collaboration.                                                                                             1.83x
                                                                                               1.50x

                                                                           Diversity
       Each time these indicators told the same story: when
       employees perceive that the organisation is highly
       committed to, and supportive of diversity, and they
                                                                                             The uplift
       feel highly included, then they will also give a big tick
       to these three indicators. Moreover, the consistent
       story is also that, whatever the indicator, a greater
                                                                                                1x                        1.31x
       focus on diversity, or a greater focus on inclusion,              Low
       will never deliver to the level of a combined focus                             Low                Inclusion                  High
       (compare the top left and bottom right quadrants).

       Figure 2                                                          Figure 4
       Q1: ‘My work group constantly meets the needs of its              Q: ‘My team works collaboratively to achieve
           clients/customers’                                               our objectives’
       Q2: ‘We are responsive to the changing needs of our
           clients/customers’

       Customer service                                                  Team collaboration

       High                                                              High

                           1.16x 1.16x                1.26x   1.31x                                                      1.42x
                                                                                              1.29x
         Diversity

                                                                           Diversity

                             The uplift
                                                                                             The uplift

                            1x      1x                1.07x   1.04x                             1x                       1.12x
       Low                                                               Low
                     Low                  Inclusion               High                 Low                Inclusion                   High

                                                                                                  Waiter, is that inclusion in my soup?     7
Inclusion and engagement:
same dish, different name?

       Could it be said that we are just talking about            Figure 6
       ‘engagement’ but giving it another name?
                                                                  Employee engagement
       We tested this idea by looking at the key indicators of
                                                                  High
       engagement, namely whether an employee is likely to
       stay with their employer, advocate for their employer
       and go the extra mile (the discretionary effort factor).

       We found that engagement and inclusion are in                                                           2.01x
                                                                                       1.20x

                                                                    Diversity
       fact separate but related concepts. In particular,
       we found that engagement is an outcome of diversity
       and inclusion. Whilst those who feel highly included
       in a workplace with a low commitment to diversity
       are more engaged (67%) compared to those in                                    The uplift
       a workplace with high diversity and low levels of
       inclusion (20%), it is the combined focus on diversity                                                  1.67x
                                                                                         1x
       and inclusion which delivers the highest levels of         Low
       engagement (101%).                                                       Low                Inclusion           High

       For those organisations which have embraced
       the idea that improving levels of engagement is a
       pathway to business performance, but have reached
       an engagement plateau, these findings provide a new
       avenue of action.

       “For those organisations which have embraced the idea
       that improving levels of engagement is a pathway to
       business performance, but have reached an engagement
       plateau, these findings provide a new avenue of action”

8
What about the hard
business data?
Correlations beg further exploration to establish
“If just 10% more employees feel included, causation, but the story makes intuitive sense.
We already know that when employees feel highly
the company will increase work attendance included they feel more engaged in their work.
by almost one day per year per employee” This means that employees are motivated to turn
up to work and to do their best work. On the
other hand, the more an employee feels excluded
Individually and holistically the results of our analysis (e.g. that they are not being treated respectfully or
between diversity, inclusion and perceived business that they do not belong to the team), the less likely
performance tell a powerful story. But, of course, they are to want to participate or bring their full
the collection of even more ‘hard’ data would capabilities to the table. Regardless of the detail,
strengthen the case even further. And this is these two ends of the behavioural spectrum
exactly what we sought. (turning up to work and doing your best work),
seem connected to inclusion and both are vital
Our research found that inclusion not only influences for business performance.
perceptions of business performance but is correlated
to actual business performance as well. Analysing Re-iterating again the ‘work-in-progress’ nature of this
the relationship between inclusion and ‘hard’ data research, the next steps are to look at more outcome
on absenteeism and employee performance ratings, data, such as profitability and sales.
we found that the more included an employee feels,
the more likely they are to be at work (i.e. reducing Figure 8
the cost of absenteeism) and to receive a higher
100
Members who feel included (%)
performance rating. Making this a little more specific,
the data from one organisation demonstrated that if 90
just 10% more employees feel included, the company 80
will increase work attendance by almost one day per 70
60
year (6.5 hours) per employee. 63%
50 60%
40 52%
Figure 7
30
20 27% 25%
(average hours per employee per year)
90 10
80 0
Far exceeds Exceeds Meets Partially Does not
70 expectations expectations expectations meets meet
expectations expectations
Absenteeism
60
50 Individual performance ratings
40
30
20
10
0
0 10 20 30 40 50 60 70 80 90 100
Members who feel included (%)
Waiter, is that inclusion in my soup? 9Diversity + inclusion revisited
From whichever angle you look, the logic of ‘diversity + So while the bottom line always proves true, namely
inclusion = improved business performance’ stands up. high levels of support for, and commitment to,
But more than just pointing to the importance of diversity and high levels of inclusion are needed
both diversity and inclusion to reach the highest level for top performance, disentangling the factors may
of performance, these findings demonstrate a more lead organisations to focus separately on diversity or
sophisticated story about the comparative balance inclusion in the short term. But before we can take
between those two factors in terms of the desired another step forward, we need to be clear about the
business outcomes. concept of inclusion and the drivers. And this might
also cause us to double think whether a separate
Looking at innovation (Figure 3), collaboration focus on diversity and inclusion is sensible or
(Figure 4) and customer service (Figure 2) as specifics, indeed possible.
and comparing the top left and bottom right
quadrants, there is a statistically significant difference
between high diversity/low inclusion and low diversity/
high inclusion (top left, bottom right quadrants),
and a focus on diversity seems to pay a higher bang
for buck on the way to high diversity/high inclusion.
The engagement story is quite different. Once again
comparing these quadrants, inclusion seems to pay a
higher bang for buck on the way to high diversity/high
inclusion.
10Inclusion –
the missing
ingredient
Waiter, is that inclusion in my soup? 11Inclusion – what are
we really looking for?
In comparison to diversity, there is a lack of academic To build this out a little further, the concept of fairness
literature about the concept of inclusion, and if it is and respect is underpinned by ideas about equality
written about, the indicators or the elements and of treatment. Employees look to whether their
drivers tend to be confused. Little wonder then, experiences are similar to comparable others in terms
that there is a lack of clarity and focus in of opportunities, pay, and evaluation, and there is a
organisational practice. strong emphasis on demographic groups as a frame
of reference (e.g. male vs. female ). Essentially, this
We define inclusion as an active process of change first level of inclusion is really just about participation,
or integration, as well an outcome, such as a feeling being in the game.
of belonging. In essence, when organisations or
individuals adapt their practices or behaviours to In contrast, the concept of value and belonging
respond to people, then people feel included. focusses more on the uniqueness of each person
being known and appreciated by the team, not as an
By exploring a broad range of possible indicators, isolated subject matter expert, but one who is integral.
our research has identified that feelings of inclusion Employees look to whether they are seen as a three
are comprised of perceptions of (i) fairness and dimensional person (and not at a superficial level),
respect; and (ii) value and belonging. Moreover we whether they are part of formal and informal networks
can confidently say that these are separate concepts and whether they have a voice in decision-making.
and build upon each other sequentially. This means Essentially, this second level of inclusion is about having
that to feel highly included, a person would not only a voice and being connected.
say that they are treated fairly and respectfully,
but that their unique value is known and appreciated,
and they belong to the group.
“This means that to feel
Figure 9.1 highly included, a person
Deloitte inclusion maturity model would not only say that
Step 2
they are treated fairly and
respectfully, but that their
Step 1
Value unique value is known
and and appreciated, and they
Fairness belonging belong to the group”
and
respect
Uniqueness
Equity
Decision
ment making
Non-
discrimination
Connectedness
d
12Introducing the X factor
– confidence and inspiration
Having identified the perceived performance uplift So this X factor of ‘confidence and inspiration’ has the
It’s a when diversity and inclusion are high, what if we
were to tell you that another element had the
capacity to lift business performance even beyond
our fundamental findings of significant increases in
beautiful capacity to lift perceived business performance business performance through diversity and inclusion.
story of even further?
To sum it all up, inclusion was originally thought
collective Our research found a strong relationship between
feeling confident and safe to speak up (particularly
about in terms of equality of treatment (i.e. fairness
and respect) and we now know that inclusion
intelligence, if the view differs from the majority) and feeling also encompasses feelings of individual value and
driven by inspired to do ‘my best work’. In essence, this is a
story of a high performing team, in which the group
belonging. Moreover, when the setting tips from
‘I feel included’ to ‘we feel included’, the findings
diverse ideas becomes so much more than the sum of its parts,
a story of trust and empowerment, in which
point to a new potential borne out of a large group
of employees feeling inspired by each other. It’s a
which are set people feel confident to contribute without fear or beautiful story of collective intelligence, driven by
free through embarrassment, and in which the mutual sharing of
ideas is both stimulating and energising. And this is
diverse ideas which are set free through inclusive
behaviours. Contrast this to an understanding of
inclusive a story of spiralling benefits, because we also found
that confidence and inspiration drives innovation,
inclusion that stops at ‘let’s just get more diverse
people in the game’. A focus on the bigger potential
behaviours customer service, collaboration and engagement. can reap bigger rewards.
Figure 9.2
Deloitte inclusion maturity model
Differentiator
Inclusion indicators
Step 2
Confidence
and
Step 1
Value inspiration
and
Fairness belonging Enthusiasm
and
respect
Empowerment
Trust
Unleashed
Waiter, is that inclusion in my soup? 13
Inclusion indicatorsI want some soup too 14
What drives diversity
              and inclusion perceptions?

                     Consistent with the view Deloitte proposed in                 In the same way, each of these elements within
                     Inclusive leadership: Will a hug do? we found that            the waterfall also has an indirect effect on
                     the behaviours of senior leaders and managers                 employee perceptions.
                     influence employees’ perceptions about whether an
                     organisation is authentically committed to, values and        So in terms of splashback, this means that the
                     supports diversity, and whether they feel included.           behaviours of a manager indirectly communicate to
                     This finding might come as some surprise to senior            the employee the organisation’s commitment and
                     leaders as it is commonly suggested that managers,            support for diversity. And the employee’s perception
                     with their greater level of direct employee contact,          of diversity influences their feelings of inclusion.
                     drive the employee experience. Whilst this might              The overall effect sizes are reflected in the numbers
                     be true for some issues, in relation to diversity             in brackets inside Figure 10, with a large effect size
                     and inclusion, the results point to the behaviours and        being over .8, a moderate effect being over .5, and a
                     signals of senior leaders as carrying significant weight.     small effect being .2. Notably seven of the 8 factors
                                                                                   identified in Figure 10 have a moderate to large
                     This influence chain can be thought of in terms of a          impact on feelings of inclusion and perceptions of
                     waterfall from the organisation’s diversity strategy,         commitment to, and support for, diversity.
                     or merit policies, to senior leaders, managers and
                     then employees. To stay with that analogy, a waterfall        Interestingly, employees’ feelings of inclusion, as well
                     is dynamic with splashback and spray.                         as their perception of organisational commitment
                                                                                   to diversity, are driven by their tangible day-to-day
                                                                                   experiences of work/life balance. This signals the
                     Figure 10                                                     significant role played by work/life balance as a
                                                                                   driver of diversity and inclusion perceptions.
                     Driver waterfall and effect sizes

versity strategy             Merit policy                     Diversity strategy
   (.778)                      (.629)                              (.778)

Senior leaders              Senior leaders                      Senior leaders
 behaviours                  behaviours                          behaviours
     (.5)                        (.5)                                (.5)

 Managers                     Managers                           Managers
 behaviours                   behaviours                         behaviours
    (.5)                         (.55)                              (.5)

ork/life balance          Work/life balance                   Work/life balance
      (.5)                     (.282)                                (.5)

Perceptions of
ommitment to,                                                   Perceptions of
 and support,                 Feelings of                      commitment to,
 for diversity                 inclusion                         and support,
                                                                 for diversity

                                                                                                     Waiter, is that inclusion in my soup?   15
Case study –
one leader’s story
When the survey results for one organisation were As shown below, business units with a higher uptake
separated into individual business units, it was clear of flexibility, experienced higher levels of inclusion.
which business units were playing on higher ground. For example, in one business unit, the inclusion rating
To delve deeper, knowing that leaders are key drivers for employees who did not work flexibly was 38%
of these perceptions, we interviewed a business unit compared with 83% for those who did.
leader to find out why 87% of his employees said
they felt included in comparison to an average rating Tying this to business outcomes, research shows that
of 49% across the organisation. Not surprisingly, employees who work flexibly actually work longer
given the survey findings about the elements – for half a day, to two days per week – whilst also
of inclusion, his ideas and actions mapped to managing their work/life obligations4.
our inclusion model.
Figure 11
Flexibility in action
Consistent with the survey results identifying the Data from one organisation – the relationship
importance of workplace flexibility as a key driver of between flexibility and inclusion
employee perceptions of a commitment to diversity,
100%
and feeling included, the business unit leader we
interviewed spoke about empowering his workforce 80%
by providing ‘total flexibility to manage their work.’
‘We work considerable hours in the team, they just 60%
don’t need permission for when and where they 40%
do the work. I trust them to manage their time
and interfaces with other people in the business. 20%
It’s cultural and places ownership back onto the
0%
employee, they are empowered to manage the
way that they work and when they work – I am Business units
only interested in the results. If they were to take % of respondents with flexibility
advantage of it, it would show up in their outcomes.’ % of respondents who feel included
Ratifying our hunch, it’s led from the top.
‘Our managing Director is absolutely committed
to a flexible work place.’
4 Hill, E.J., Erickson, J.J.,
Holmes, K.E. and Ferris,
M. (2010) ‘ Workplace
flexibility, work hours and
work-life conflict: Finding an
extra day or two’ Journal of
Family Psychology,
Vol 24(3), pp 349–358.
16respect
Empowerment
Trust
Unleashed
Inclusion indicators
Confidence
and
Value inspiration
and
‘These elements build confidence
Fairness belonging and thus drive high performance.’
and
respect ‘This opportunity helps them to
develop and empowers them.’
‘Everybody is absolutely This isn’t just lip service, ‘It builds confidence and provides
treated with respect. ‘we genuinely want positive reinforcement… We work
Whether they are junior, to know what their closely together and with other
mid-level managers viewpoint is’ and parts of the business, so seeking
or senior leaders in ‘act upon it’. out opinions from different sources
the team you are is just part of what we do.’
encouraged to speak up A sense of value is also
and put your view point created by enabling ‘The key aspect of a high
across… For example, employees to present performing team is passion…
we have a weekly their own work to senior We see their passion in the way
planning meeting, leaders, irrespective that they approach assignments
with students through of level: ‘They take and in the way that they approach
to senior managers, ownership over their other aspects of their life.’
and we are looking for own work… and get
input from everybody.’ the recognition.’
Waiter, is that inclusion in my soup? 17Prioritising actions
Given the focus of this report on rebalancing the Figure 13
attention bias towards diversity, we analysed each
Organisation 2 – Prioritisation matrix
organisation’s current performance against the drivers
of inclusion and diversity. Low Lower importance and Higher importance and
lower performance lower performance
6 2
Current performance was evaluated according to the
1
percentage of respondents who agreed or strongly 4
Current performance
agreed with a driver statement (e.g. Q: I feel valued by
my manager). We also evaluated performance against
the relative importance of this driver in terms of its 7 3
potential impact, and created a prioritisation matrix. Lower importance and Higher importance and
higher performance higher performance
5
As can be seen from the three graphs, the top three
critical areas needing attention (top right hand
quadrant) differ slightly, however a focus on leaders
and merit based policies is common to all. High
Low Importance High
Figure 12 Figure 14
Organisation 1 – Prioritisation matrix Organisation 3 – Prioritisation matrix
Low Lower importance and Higher importance and Low Lower importance and Higher importance and
lower performance lower performance lower performance lower performance
6
Current performance
Current performance
7 2
3 1
5 1 5
4 2
Lower importance and Higher importance and Lower importance and Higher importance and
higher performance higher performance higher performance higher performance
3 7 4
6
High High
Low Importance High Low Importance High
1. Leaders
2. Merit based policies and practices
3. Mangers
4. Diversity
5. Accountability/reward
6. Work life balance
7. Diversity policies and practices
18Ideas from the front line
– merit based policies
and processes
In all three organisations, employees identified Employee ideas to improve implementation
merit based policies and processes as critical to their through consistency, transparency and
perceptions about whether their organisation was accountability
supportive of, and committed to, diversity. They also
identified these policies as influencing their feelings
of inclusion. The prioritisation matrix indicated that
merit based policies and processes were a key area for
“Need more transparency
improvement. in the selection process.”
In particular, employees were asked about whether
promotion and development opportunities are
based on merit; recruitment processes enable
“Improve fairness in
the selection of the best person for the job; promotions and encourage
and performance management processes enable
employees to demonstrate their personal skills sets. different viewpoints.”
Their free text answers pointed to improvements in
the implementation of these policies and processes,
rather than changes to the policies themselves. “Train managers not to
Solutions focussed on raising awareness of similarity recruit people who are
attraction/selection bias, as well as enhancing the
transparency of processes and accountability for
similar to themselves but
outcomes. These suggestions are consistent with to be more open minded.
findings from academic research on the positive
impact of reminding decision-makers, immediately Apply the same to
prior to the selection process, of the organisational
importance of making merit-based decisions, and of
promotions.”
taking personal accountability for outcomes5.
“Ensure that managers
(all the way from the senior
leadership team to the
team leaders) are fair
in their assessment of
subordinates’ performance.”
“Hold managers and
members of senior
5 Petersen, L., and Krings, F.,
(2009) Are ethical codes of leadership accountable
conduct toothless tigers for
dealing with discrimination, for their actions.”
Journal of business ethics,
Vol 85, pp 501-514.
Waiter, is that inclusion in my soup? 19A few practical ideas 20
From theory to practice
The survey results underscored for us the importance Firstly, we now have the building blocks for a
of leaders’ and managers’ behaviours in creating a leadership competency framework so we can develop
culture of inclusion. Our background research however, and measure inclusive leadership. Secondly, we can
highlighted the lack of clarity surrounding the concept identify critical moments in an employee’s life cycle
of inclusion. Much like having an amazing bowl of which have a heightened impact on experiences of
soup, but not being quite sure of the ingredients. diversity and inclusion.
Now that we understand that the key elements of Thirdly we can leverage data analytics to view
inclusion are (i) fairness and respect; and (ii) value employees through a more sophisticated prism
and belonging; which, when combined with diversity than traditional demographics (e.g. male vs. female).
lead to ‘inspiration and confidence’, we see three
opportunities to move from theory into practice. We pursue these three ideas for action with some
preliminary thinking.
The Deloitte Inclusive Leadership
The Deloitte Inclusive Leadership Competency framework
Competency framework
nt
rse tale
t
len
Und
an se ta
ing dive
2. Advanced proficiency
erst
orm iver
ce
Example behaviour
and
s
d
am
Develop
Displays inclusive te
d p ng
ing
e
tiv
an agi
behaviours that
erf
c
self
fe
n
exemplify the values ef
Ma
Ma
of the organisation kin ing
ge
ffe ilid nt
dec ctive Bu tale
isio d iverse
Measurement ns g
loyin
360º feedback Dep
Self Team
Persuading and infl
uencing
diverse individual
lling s
Role mode
viours Insp
inclusive beha ir
Organisation act ing oth
incl
usiv ers to
ely
n
io e
M lati
ct
ax on
re pos
re
i
im sh
d ur
isi ip
g
in d p
s
Shaping
infrastru
ng s
n
and titivenes
vid an
vatio
di
o
Pr
ve
rs
inno
e
the
cture
mpe
g co
in
Driv
3. Mastery proficiency
Example behaviour
Identifies and creates opportunities for diverse 1. Basic proficiency
team members to work together to solve problems Example behaviour
Provides diverse talent with development
Measurement opportunities through a mentoring program
Number of projects identified
Measurement
Representation of diverse talent in
mentoring program
*Based on Deloitte LEAD framework
Waiter, is that inclusion in my soup? 21Moments that matter
Throughout the employee lifecycle, and in our
workplace practices more broadly, there exist
‘moments that matter’. At these points leaders
are more vulnerable to decision-making bias or
behaviours that can unconsciously create advantage
for some and disadvantage for others and
undermine aspirations of diversity and inclusion.
Below, Deloitte provides a snapshot of these
vulnerable moments, and some practical strategies
for leaders and managers to address them.
A snapshot of vulnerable moments…
Not a good ‘fit’ The squeaky wheel Speech bias Strings attached
and priming
Often interviewers use ‘not a According to Susan Cain Whoever speaks first will In some cases, flexibility is
good fit’ to explain selection ‘there is zero correlation set the tone of the meeting, offered with strings attached
decisions that are based between gift of the gab and which can result in an unfair such as career cessation,
on vague and intangible an ability to come up with weighting on their point marginalised work or without
‘gut feel’, that often reflects great ideas’. Yet often those of view and others being an adjustment to workload.
unconscious biases. who self promote get ahead. influenced. Meetings risk
becoming unbalanced.
Example strategy: Example strategy: Example strategy: Example strategy:
Establish strict and transparent Introduce a regular mechanism Circulate the agenda and key Periodically review the quality
criteria for assessing ‘a good for each team member to share questions before the meeting and range of work assigned
fit’ based on the organisations what they are working on and and ask all participants to to flexible and non-flexible
values. their achievements. prepare a brief paragraph employees.
on their views.
22Start looking at people in 3D The first group of men was most closely connected
Deloitte’s artificial data analytics tool, called a to a second group of men who were quite similar
Self-Organising Map (SOM), can provide a more but slightly older, whereas the profile of the young
realistic sense of the ‘types’ of people present in each women and their connectedness to the older group
organisation, rather than a 2D picture of employees of men – was quite distant.
seen through single or double demographic splices
(e.g. race by level). This tool clusters data to identify Why is this insightful? If similarity of demographic
shared multi-dimensional features and also the distance characteristics facilitates relationships through
or connectivity between one persona and another. similarity-attraction bias, then the distance between
demographic groups points to the degree of effort
We used the SOM on one organisation and identified necessary to create a sense of connectedness across
five common ‘groups’ of people, e.g. one being the organisation, and as we know from the findings
heterosexual men aged 40–49 who are Caucasian, on inclusion – connectedness influences a sense of
married and have caring responsibilities, and another belonging. The SOM provides organisations with a
being women aged 25–29 who are ethnically diverse, new way of seeing employees that is more realistic,
heterosexual and have no caring responsibilities. like a 3D perspective, and offers insight into tribes
which is masked by a traditional demographic analysis.
Age 40–49, male, Age 50–59, male, Age 30–34,
heterosexual, heterosexual, Caucasian, married
Caucasian, married, Caucasian, married
family care
Age 20–34,
Caucasian, no
family care
Age 25–29, female,
heterosexual, ethically
diverse, no family care,
undergraduate degree
Waiter, is that inclusion in my soup? 23Final words 24
Final words

               This research captured the views and experiences of       This research not only helps organisations to see
               1,550 employees in three large Australian businesses      business performance through the lens of diversity
               operating in manufacturing, retail and healthcare.        and inclusion, it also highlights the importance of a
               Through their eyes we learned that business performance   balanced focus on both drivers, rather than a lopsided
               could be improved through a dual focus on diversity       focus on diversity. More than just naming the missing
               and inclusion enabling, for example, greater levels of    ingredient of inclusion, organisations can now have
               customer satisfaction. This insight comes at a critical   greater clarity about whether what they are seeing
               moment when businesses are buffeted by challenging        in their workplace soup is, in fact, inclusion. We now
               economic conditions and seeking ideas about stability     know, and can measure, inclusion in terms of fairness
               and growth options.                                       and respect, as well as value and belonging, and we
                                                                         also know what drives feelings of inclusion as well
               If innovation is needed, or higher levels of              as a belief that an organisation is committed to, and
               productivity, this research suggests that some of         supportive of, diversity. This knowledge means that
               the answers lie within easy reach. They are locked        organisations now have greater capacity to implement
               up in the individual and group potential of diverse       our primary finding that diversity + inclusion =
               employees, and can only be unleashed by creating          improved business performance.
               an inclusive working environment.
                                                                         Of course every organisation is different, and in this
                                                                         sense this research only points to a general story.
“The potential to lift business performance                              Prioritising change interventions to deliver the most
                                                                         effective outcomes means that organisations must
is locked up in the individual and group                                 collect and analyse their own data (and hopefully in

potential of diverse employees, and can                                  3D). Once that base is established, the preliminary
                                                                         structured equation Deloitte has developed through
only be unleashed by creating an inclusive                               this research can help organisations predict, with much
                                                                         greater precision, the degree of impact on business
working environment”                                                     performance of a change effort. This means that
                                                                         organisations can focus their scarce resources on those
                                                                         which will deliver the greatest ‘bang for buck’.

                                                                         To view Deloitte’s animation of the relationship
                                                                         between diversity, inclusion and improved business
                                                                         outcomes visit www.deloitte.com/au/waiter

                                                                                          Waiter, is that inclusion in my soup?   25
Methodology and contacts 26
Methodology

      How was the model of diversity and                        Work Life Balance: These questions focussed
      inclusion identified?                                     on employees’ ability to balance their work and
      Sample: The Deloitte Diversity, Inclusion and Business    home life, and respect for these arrangements.
      Performance Diagnostic (DDIBP) scores collected
      from three organisations domiciled in Australia were      How did we identify included/not included
      aggregated creating a sample size of 1,557.               employees? Inclusion scores comprised two
                                                                perceptual indicators; fairness & respect and valued
      Method: The survey was administered in July 2012.         & belonging. An employee was considered included
      An exploratory factor analysis was used to identify       if they had a positive overall perception score.
      the drivers, indicators and outcomes of diversity         Positive perception scores were represented
      and inclusion. The exploratory factor analysis            by favourable responses to items in the survey.
      identified the underlying relationships between           Specifically a positive perception score on inclusion
      the items (questions) in the DDIBP. A confirmatory        was calculated when an individual responded
      factor analysis was used to test the consistency          more times with ‘agree’ or ‘strongly agree’ to each
      of the drivers, indicators and outcome measures.          survey item (rather than ‘slightly agree’ or lower).
      The hypothesised model was then tested using              A weighted score was identified for each respondent
      structural equation modelling with the data of the        using results from the confirmatory factor analysis.
      1,557 respondents. The measures are reliable with a       A weighted score of 4.5/6 or larger was identified
      minimum Cronbach’s alpha coefficient of .7.               as ‘included’.

      Definitions of the drivers:                               Business performance calculations
      Diversity strategy: A group of questions relating to      Employee performance vs. inclusion: Calculated by
      practices that indicate organisational practices are      comparing the percentage of employees ‘included’
      aligned with a diversity strategy, e.g. encouraging       against individual performance ratings.
      diversity in recruitment, diversity being central to
      business strategy.                                        Absenteeism vs. inclusion: Calculated by comparing
                                                                the average hours each employee was absent per
      Merit: These questions focused on practices               year, for each function, against the percentage of
      that ensure fairness in recruitment, progression,         ‘included’ employees for that function.
      development opportunities and performance
      management.                                               Prioritising action for intervention: Calculated by
                                                                comparing the average level of performance for each
      Senior leader behaviours: These questions focused on      of the drivers within each company against their
      senior leaders behaviours in terms of driving inclusion   level of importance. Importance was analysed as the
      and diversity, e. g. creating an inclusive culture,       level of correlation of each driver to inclusion scores
      encouraging use of diverse talent.                        within each company. This allows a personalised
                                                                and contextualised analysis of the priorities for
      Manager behaviours: These questions focussed              each company.
      on managers’ actions that increased diversity
      and inclusion, e.g. their ability to provide feedback,
      listen to employees, inspire commitment to diversity
      and act in a fair and respectful manner.

                                                                                  Waiter, is that inclusion in my soup?   27
Key Deloitte contacts
Juliet Bourke
Partner, Human Capital Consulting
Tel: +61 2 9322 7379
julietbourke@deloitte.com.au
Bernadette Dillon
Director, Human Capital Consulting
Tel: +61 3 9671 7604
bdillon@deloitte.com.au
Richard Fraccaro
Manager, Deloitte Analytics Consulting
Tel: +61 3 9671 7675
rfraccaro@deloitte.com.au
28Key Victorian Equal
Opportunity and Human
Rights Commission contacts
Murray McIntosh
Senior Adviser, Corporate Engagement
Tel: +61 3 9032 3400
Jane Lewis
Senior Education Consultant
Tel: +61 3 9032 3468
About Victorian Equal Opportunity
and Human Rights Commission
The Victorian Equal Opportunity and Human Rights
Commission has responsibilities under three laws:
the Equal Opportunity Act 2010; the Racial and
Religious Tolerance Act 2001; and the Charter of
Human Rights and Responsibilities Act 2006.
We are committed to helping employers and service
providers understand their positive duty to eliminate
discrimination under the Equal Opportunity Act 2010,
and provide the following services to assist:
• An education, training and consultancy service to
equip corporate and community organisations and
advocates to comply and develop good practice
• A free, friendly and accessible Enquiry Line service
available by telephone, email or webchat
• Online information and practical resources about
rights and responsibilities under equal opportunity,
racial and religious vilification and the Charter of
Human Rights and Responsibilities
• A free, fair and timely dispute resolution service.
The Commission also participates in a range of
strategic partnerships and research projects designed
to extend the evidence base around effective equal
opportunity and human rights policy and practice.Contact us Deloitte Grosvenor Place 225 George Street Sydney NSW 2000 Tel: +61 2 9322 7000 Fax: +61 2 9322 7001 www.deloitte.com.au This publication contains general information only, and none of Deloitte Touche Tohmatsu Limited, its member firms, or their related entities (collectively the “Deloitte Network”) is, by means of this publication, rendering professional advice or services. Before making any decision or taking any action that may affect your finances or your business, you should consult a qualified professional adviser. No entity in the Deloitte Network shall be responsible for any loss whatsoever sustained by any person who relies on this publication. About Deloitte Deloitte refers to one or more of Deloitte Touche Tohmatsu Limited, a UK private company limited by guarantee, and its network of member firms, each of which is a legally separate and independent entity. Please see www.deloitte.com/au/ about for a detailed description of the legal structure of Deloitte Touche Tohmatsu Limited and its member firms. Deloitte provides audit, tax, consulting, and financial advisory services to public and private clients spanning multiple industries. With a globally connected network of member firms in more than 150 countries, Deloitte brings world-class capabilities and high-quality service to clients, delivering the insights they need to address their most complex business challenges. Deloitte has in the region of 200,000 professionals, all committed to becoming the standard of excellence. About Deloitte Australia In Australia, the member firm is the Australian partnership of Deloitte Touche Tohmatsu. As one of Australia’s leading professional services firms, Deloitte Touche Tohmatsu and its affiliates provide audit, tax, consulting, and financial advisory services through approximately 6,000 people across the country. Focused on the creation of value and growth, and known as an employer of choice for innovative human resources programs, we are dedicated to helping our clients and our people excel. For more information, please visit Deloitte’s web site at www.deloitte.com.au. Liability limited by a scheme approved under Professional Standards Legislation. Member of Deloitte Touche Tohmatsu Limited © 2012 Deloitte Touche Tohmatsu. MCBD_Mel_11/12_048135
You can also read