Diversity, Employee Morale and Customer Satisfaction: The Three Musketeers
←
→
Page content transcription
If your browser does not render page correctly, please read the page content below
Journal of Economics, Business and Management, Vol. 3, No. 1, January 2015
Diversity, Employee Morale and Customer Satisfaction:
The Three Musketeers
Usmani Sania, Kumari Kalpina, and Hussain Javed
Abstract—This study explores the relationship between II. LITERATURE REVIEW
diversity and customer satisfaction mediated by employee
morale. The study was conducted on the frontline employees of A. Diversity
6 multinational fast food restaurant chains and customers of According to Equal Employment Opportunity
those fast food restaurants in Karachi, Pakistan. The data on Commission (EEOC) traditionally, diversity maybe defined
diversity and employee morale was collected from employees
as, variations in racio-ethnicity, gender and age. Other
through self-reported questionnaires while data on customer
satisfaction was gathered from customers dining in those definitions are panoramic and involve attitudes, perceptions,
restaurants. A convenience based sample of 235 respondents and backgrounds of the employees. Further, some have also
was taken for the study. Exploratory Factor Analysis, incorporated people from different hierarchical levels, and
Confirmatory Factor Analysis and Structural Equation functions in the diversity definition. Robinson & Dechant, [2]
Modelling were run to test the relationship and significance of state the definition of diversity given by Pillsbury Company
the model. The results rejected the mediated relationship of
as "all the ways in which we differ".
diversity and customer satisfaction but showed positive direct
association between diversity and employee morale. In this competitive global market, companies favour the
broadest definition of diversity, a definition which includes
Index Terms—Customer satisfaction, diversity, employee variations in gender, backgrounds, racio-ethnicity, age,
morale. qualities, physical abilities, sexual orientation, attitudes, and
perceptions [2].
Furthermore, Patrick and Kumar [3] explain the notion of
I. INTRODUCTION diversity as having differences in gender, personality,
The reality of today is a diverse workforce. A company cognitive style, ethnic group race, tenure, age, education
with diverse workers serves and competes in a diverse market organizational function, and background etc.
in a better way [1]. In this era of globalization, workforce Jackson, May, and Whitney [4] defined diversity as the
diversity is an opportunity for organizations to create a existence of distinctions between members of a common
competitive advantage; but, managing diversity often create entity. As organizations worldwide become more diverse,
challenges as different people think and act differently organizational life depends upon managing diversity which is
therefore they are receptive to common problems which based on race, gender, ethnicity, national origin, age, and
require assistance for their solution. Employee commitment personality [5].
reflects that employees feel valued for their contribution in A diverse workforce is essential for corporate success [6].
achieving organizational goals i.e. the part they play in Organizations can benefit from and be successful by
achieving organizational performance; therefore managing workforce diversity if they create an organizational
workforce diversity becomes the cornerstone of environment which is able to attract people from different
organizational performance which improves productivity. markets. Diversity when managed effectively encourages
Managing diversity can enhance employees’ morale which competitive advantage by recruiting and selecting the best
people for the job from diverse labour markets regardless of
is expressed as the depiction of their attitude, emotions,
their differences in gender, religion, ethnicity, or
satisfaction and overall point of view towards their
individualities [7].
organization. Increased morale will make an employee
Effective management of diversity not only involves
happier and more productive, and higher productivity will
recruitment of diverse employees but also their retention [8].
lead to higher performance and increased customer
Implementing effective HR practices to deal with the
satisfaction. Customer satisfaction is important because it
workforce diversity enhances organizational performance [9];
enhances customer retention and ultimately leads to
[10]. Effective diversity practices and profits have a strong
profitability in a company.
relationship [11].
This article investigates the effect of cultural diversity of Diversity management means creating an equitable
the employees on customer satisfaction mediated through working environment where employees perform to their full
employee morale. potential without feeling discriminated [12]. Dynamic
companies search for various types of people because it
brings multiplicity of interests, talents, and viewpoints [13].
Both employees and customers are adversely affected when
organizations fail to value diversity and do not try to
Manuscript received August 28, 2013; revised November 4, 2013.
Usmani Sania is with the Iqra University, Pakistan (e-mail:
eradicate discrimination and injustice in the workplace.
sania@iqra.edu.pk). Organizations must focus on universal strategies that value
DOI: 10.7763/JOEBM.2015.V3.147 11Journal of Economics, Business and Management, Vol. 3, No. 1, January 2015
diverse employees and address comprehensive human directly related to morale. Happy employees have high
resource issues [1]. morale while dissatisfied and unhappy employees have low
Diversity enhances innovation, a broad outlook, improved morale. Linz, et al [18] measured employee morale, using job
problem identification and description, various options and satisfaction, organizational commitment, turnover rates,
solutions [8].The notion of diversity embraces recognition complaints and employee strikes as a proxy.
and respect. It is a way of recognizing individual differences
C. Customer Satisfaction
and understanding that each individual is unique. These
differences can be based on everything including political The significance of customer satisfaction is indisputable.
beliefs, religious beliefs, socioeconomic status, and even When obtaining customer satisfaction, one needs to look at
ideologies. Managing diversity involves moving beyond the possible antecedents and determinants of it [21]. In
tolerating the diversity of individuals and accepting and service industry, employees, customers and other
celebrating the rich characteristics of diversity which each stakeholders interact to yield the ultimate service outcome.
person has [3]. As customers are directly involved in the service production
Effective diversity management means following practices function therefore they are called the partial employees. In
that involves appreciating and accepting the humanity, the service environment managers must have skills to
natural environment, and interdependence of cultures; giving manage both their full-time and partial employees [1].
respect for the individualistic experiences, knowledge, skills, Focus on customer satisfaction helps to create a baseline
and qualities; recognizing and understanding that standard of performance and successful business
discrimination based on personal, cultural, and institutions management. Customer satisfaction is an indicator of
creates privileges for some while augments difficulties for company’s profits. It also serves for the establishment and
others; and building associations across differences to work growth of a customer-oriented environment and culture.
together and eliminate these discriminations [3]. The Customer satisfaction compares perceived and expected
significance and impact of cultural diversity increased quality of service and leads to post consumption experience.
immensely as many organizations moved away from It is a post-purchase assessment of the goods or service
domestic, and international strategies to operate as a global relative to a pre-purchase anticipation [22]
organization [14]. Managers must learn the business Customer satisfaction is the outcome of the customer, the
etiquettes, cultural traditions, and courtesies of their global service and the provider of the service. According to Cengiz
counterparts along with understanding their mind-sets, [22], customer satisfaction is the perception of a customer
national character, and managerial viewpoints, in order to with respect to the product or service provided by the
capture business opportunities for collaboration; thus, organization in an effective manner.
diversity can help organizations to enter the international D. Diversity and Employee Morale
arena [15]; [3]. Diversity changes the nature of workplace and
B. Employee Morale relationships among employees. If it is not planned and
Even though the importance of employee morale on managed properly then these changes can cause stress and
performance is highly recognized but there is no consensus lead to negative working relationships and poor employee
on a specific theory or set of factors related to employee morale. Diverse employees may even feel unwelcome in the
morale [16]. workplace, hence removing this perception is essential
The definition of employee morale is mixed with through training, education and organizational activities
controversies. As there are many writers on this phenomenon which will improve work environment and employee morale.
so there are numerous definitions [17]. Various studies have Employees with low morale may have poor relationships
identified employee and organizational characteristics which with colleagues and managers. Encouraging greater
influence morale but morale has been measured by different appreciation for diversity can improve their morale.
people in different ways therefore making comparisons Managers need to change the image of diversity of only
across studies difficult. Hence, forming an effective and abiding by the rules and regulations of equal employment
appropriate strategy to improve employee morale is opportunity and present diversity as a means to improve
problematic. A high morale means the employee is satisfied productivity in the global arena.
with the job, puts in effort, is creative, takes initiative, is E. Employee Morale and Customer Satisfaction
committed to the organization and focuses on achieving In the business world managers are pushed to keep
organizational goals rather than personal goals. Low morale customers happy, look after them so they remain loyal and
leads to high skiving, high turnover, unsolved complaints and buy their products. Employee morale is essential in the
strikes, thereby encumbering firm’s performance [18]. pursuit for achieving customer satisfaction. Content
According to Howitt [16], morale is a feeling not a employees give high-quality service and exert positive
consequence or action, thus it is difficult to quantify it. energy and willingness while dealing with their customers.
Both Lawrence [17] and Hershey [19] state that using Employee satisfaction is a predictor of customer loyalty
terms such as job satisfaction, job frustration, job motivation, while customer loyalty is an important antecedent of
job attitudes and group dynamics complicates the definition financial outcomes. Satisfied employees give a better ROI
of morale. and stay with the company for long term [23].
According to the business dictionary [20] employee Employees with low morale are self-absorbed and are
morale is defined as the depiction of emotions, satisfaction, concerned with the internal politics of the company rather
and overall attitude towards a workplace. Productivity is than the customer which results in low customer satisfaction
12Journal of Economics, Business and Management, Vol. 3, No. 1, January 2015
and net profits. This induces the fear of being redundant and variety of restaurants both local and multinational. The focus
layoffs which further lower their morale [23]. of this study is multinational fast food chains operating in
Retaining good people may have an economic impact on Karachi, Pakistan. The fast food chains incorporated include;
the firm but lying off seldom excites employees. Instead it Pizza Hut (26 branches), Dominos (6 branches), Mc
suppresses creativity, discourages risk-taking, and impedes Donald’s (11 branches), KFC (18 branches), Hardees (1
loyalty. If not fired but the fear of being a target imbibes the branch) and Subway (9 branches).The data was collected
energy and diverts employee’s attention to safeguard their from 470 individuals out of which data on diversity and
careers. This takes them farther from the success of the employee morale was collected from 235 employees from
organization towards finding new jobs for themselves. these fast food branches while data from 235 customers from
Due to the worldwide recession, organizations replace these branches was collected therefore the sample size was
people with technologies and keep employees only to make 235. Convenience based sampling technique was used.
up the deficit. People work longer hours with no
B. Procedures
compensation or appreciation with a fear of becoming the
next victim of the economic downturn. Today, employee All the variables were self- reported therefore attempts
morale is lower than previously because of lack of funds, were made to deal with common method bias issue in the
resources and managerial distress [23]. study by following the recommendations of Podsakoff,
With the current situation of the macro-environment, MacKenzie, Lee, and Podsakoff [25]. Instrument was used to
employees are overworked and underpaid. Companies like collect data on the perceptions for diversity, employee morale
Sears and Southwest Airlines (USA) have been able to create and customer satisfaction.
a linkage between employee satisfaction and customer C. Measures
loyalty. This linkage helps to estimate the company’s 1) Diversity
financial performance [23].
In this global world, the relationships established between Perceptions to diversity was measured using 20 items from
the organizations, its employees and its customers are Workplace Diversity Survey (WDS) created by De Meuse
important for a business’s success. In the service sector, and Hostager [26]. WDS included five dimensions in which
interpersonal relationships determine the success or failure of each dimension had 2 positive and 2 negative items. These
the product that employees sell which transforms the way five dimensions were Emotional reaction, Judgments,
companies manage and measure their performance. Behavioural reactions, Personal and Organizational
Top-level managers now divert their focus on setting profit outcomes. These 20 items were measured on a Likert scale of
goals and shift their attention towards frontline workers and 1 to 5 with 1 being “Strongly Disagree”, 2; “Disagree”, 3;
customers. Investing in employees and technology that helps “Neither Disagree or Agree”, 4; “Agree” and 5 being
front-line workers, revamping recruiting and training, and “Strongly Agree”. Higher scores meant greater acceptability
linking compensation to performance are the factors that lead of diversity in the workplace and positive associations with
to profitability and productivity in this new paradigm so performance.
managers must pay attention to them in order to be successful 2) Employee morale
[24]. This paper researches upon the effect of diversity on Employee morale was evaluated using a developed scale
customer satisfaction mediated through employee morale. from Linz, et al [18]. Respondents rated each statement using
a five-point Likert scale, where 1 is “strongly disagree” and 5
is “strongly agree”. These statements were related to
organizational commitment [27], job satisfaction [28], and
Intention to quit [27], [28].
Fig. 1. Hypothetical model. 3) Customer satisfaction
In this study, DINESERV tool [29] having 29 items (1
item omitted; i.e. “The casual dining restaurant should give
F. Hypotheses
support to employees so they can do their jobs well” as it had
H1. Diversity and customer satisfaction have a negative no concern with the satisfaction of the consumer) was used
relationship which is an modified version of SERVQUAL (22 items).The
H2. Diversity and employee morale have a negative DINESERV tool measures the five dimensions of, assurance,
relationship reliability, tangibles, responsiveness, and empathy. In
H3. Employee morale and customer satisfaction have a DINESERV tool, customers’ expectations have “should”
positive relationship statements while the perception scale assesses the service
H4. Diversity decreases customer satisfaction when performance of the fast food restaurant under consideration.
employee morale is controlled
All the 28 items in perception and expectation instrument
have a Likert scale from 1 “strongly disagree” to 5 “strongly
agree”.
III. RESEARCH METHODS
Customer satisfaction in Inkumsah, [30] had been
A. Data Sampling measured through subtracting the expectation scores from the
In this paper the association between customer satisfaction perception score of each of each service attribute.Customer
and diversity is examined in the fast food industry of Karachi, satisfaction can be measured by P-E; where P denotes
Pakistan. The fast food industry of Pakistan comprises of perceptions while E denotes Expectations; which is called
13Journal of Economics, Business and Management, Vol. 3, No. 1, January 2015
disconfirmation-based measures. SQ (service quality) drives TABLE II: TOTAL VARIANCE EXPLAINED
customer satisfaction [31] while Parasuraman, Ziethaml, and
Berry [32] say that practitioners and the press frequently
substitute the words “service quality” and “customer
satisfaction”. Jain and Gupta, [34] and Parasuraman, et al.
[32] have stated certain conceptual, methodological,
analytical and practical issues related to SERVQUAL scale
and identified that SERVPERF scale has better convergent
and discriminant validity, dimensionality and more variance
is explained as compared to SERVPERF but claiming the
superiority of SERVPERF to SERVQUAL is still arguable B. Exploratory Factor Analysis
(refer to fifth limitation). SERVPERF scale consists of the Exploratory Factor Analysis was carried out in SPSS 17
perceptions towards the service performance i.e. P part from before it was taken further in Amos for Confirmatory Factor
the SERVQUAL tool. Therefore customer satisfaction in this Analysis. The fundamental assumptions for factor analysis
study was assessed using only the 28 items of perceptions such as KMO (Kaiser-Meyer-Olkin Measure) is 0.803 and
from the DINESERV tool which measures the perceptions on Bartlett test of sphericity is less than 0.05.Varimax Algorithm
service in a restaurant. These perceptions on service for the of Orthogonal Rotation was applied to analyse 60 items (12
fast food restaurant are taken as proxy for customer for employee morale, 20 for diversity and 28 for perceptions
satisfaction in this study. on service) for these 3 variables. Table II and Table III shows
D. Statistical Technique that 3 factors were fixed and ultimately 15 items (7 of
employee morale, 4 of diversity, and 4 of perceptions on
Statistical technique used in this study is Structural
service) were retained which explained 55.56% variance in
Equation Modelling (SEM) using Amos 18 version. SEM
the data. These 3 factors were named employee morale,
was applied using two step modelling; in the first stage
diversity and perceptions on service and were further taken in
Confirmatory Factor Analysis (CFA) was run re-specified
AMOS for analysis.
and in the second stage Structural model paths were then
added to show the direct effects of diversity on customer TABLE III: ROTATED COMPONENT MATRIX
satisfaction through employee morale. Prior to that the data
was analysed for normality, outliers and missing values in
SPSS 17 version and upon detection they were corrected.
Also, discriminant validity, convergent validity, composite
reliability, reliability coefficients have been applied and
common latent factor and Harman single factor test was
applied to test for any method variance in the study
IV. RESULTS
Total sample size was of 235 respondents out of which 15
outliers were found using Mahalanobis distance test and their
values were less than 0.001. These outliers were removed and
the retained data was 220 respondents. Data on 3 variables
were collected through the questionnaire. First variable is
“employee morale” which consists of 12 items; second C. Confirmatory Factor Analysis
variable is “diversity” which consists of 20 items; the third Confirmatory factor analysis was used in Amos 18 to
variable “perceptions on service” which consists of 28 items; confirm the three latent constructs of the 15 observed
total 60 items. variables retained from EFA. After three attempts the final
A. Mean, Standard Deviations and Intercorrelations hypothesized model was acquired. Table IV gives the
Table I represents the mean, standard deviation and summary of the models for the CFA and SEM analysis. The
intercorrelations between the 3 variables. The correlation table shows all the goodness of fit indices i.e. CMIN/DF, TLI,
between employee morale, diversity and perception of CFI, RMSEA along with Chi Square and degrees of freedom.
satisfaction were insignificant and low. 15 items were taken from EFA (exploratory factor analysis)
to AMOS. Four items belonged to “Diversity” (used as
diversityy throughout the document due to ellipse issue in
TABLE I: DESCRIPTIVE STATISTICS: MEAN, SD, AND INTERCORRELATIONS
AMOS as diversity was already named in SPSS 17 when
diversity was summed up for correlation calculation), four to
“Perceptions on service” and seven to “Employee Morale”.
In the first model chi square was 120.612 with df =87,
CMIN/DF was 1.386 [must be < 3], TLI was 0.957 [must
be >= 0.95; [35], CFI was 0.964 [must be >= 0.95; [35]]
while RMSEA was 0.042 [must beJournal of Economics, Business and Management, Vol. 3, No. 1, January 2015
TABLE IV: SUMMARY OF MODELS TABLE V: STANDARDIZED AND UNSTANDARDIZED COEFFICIENTS FOR CFA
After inspection, it was found that the Modification
Indices between the error terms e21 and e22 were highly
correlating with each other and had values more than 10; (i.e.)
MI 17.088 from EM1 and EM2. These two error terms were
then correlated in the model using the correlation symbol in
AMOS after which the model was re-run the second time.
In the second model chi square was 101.572, df =86,
CMIN/DF was 1.181, TLI was 0.98, CFI was 0.983 and D. Convergent Validities, Discriminant Validities and
RMSEA was 0.029. Even though the model fit was good Construct Reliabilities
even the second time but still there were few values in Convergent validities, discriminant validities and
standardized regression coefficients which were a little less construct reliabilities were calculated and only one validity
than 0.5 and it affected the reliabilities and validities of the concern was found. Table VI shows all the validities and
variables therefore they were removed. These items included reliabilities for the three latent constructs. All construct
EM1, EM7 and P12. After removing them the model was reliabilities are greater than or equal to 0.7, while the
re-run the third time. In the third model, the values of chi convergent validities of employee morale and perceptions on
square were 50.966, df =51, CMIN/DF was 0.999, TLI was service were good as AVE was greater than 0.5except for
1.000, CFI was 1.000 and RMSEA was 0.00. The third model Diversity which was 0.370. All the discriminant validities are
after specification was a great fit. The third model was the good as MSV of all the variables was less than AVE. Also
final hypothesized model which was taken further for ASV is less than both AVE and MSV.
structural analysis (and, mediation).
TABLE VI: CONVERGENT VALIDITIES, DISCRIMINANT VALIDITIES AND
CONSTRUCT RELIABILITIES
E. Common Method Variance
Method variance occurs due to the measurement method
and not due to the construct. Measurement error threatens the
validity of the study which estimates the associations among
measures. The techniques used in this study to identify any
common method biases include Harman’s single-factor test
and Common latent factor test.
Herman single factor test. Herman single factor test was
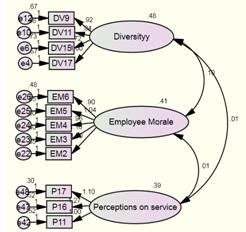
Fig. 2. Results of confirmatory factor analysis. Comparative fit index=1.000;
run to identify common method bias. All the 60 items were
Root mean square error of approximation=0.00, Chi-square=50.966; df=51; entered and one factor was fixed to identify how much
e=error variance is explained by only one factor. It was found that
one factor explained 12.406% of the data, which shows that
Fig. 2 represents the final model created in AMOS 18 after common method bias is not a major threat in the data. KMO
the re-specifications. The figure shows the relationships value 0.728 (must be>0.5) and significance value of
between observed and latent variables. Three latent variables Bartlett’s test of sphericity 0.00 (must be=0.5 therefore the threat in the data.
e21-e22 correlation was also removed automatically. The
figure shows the standardized estimates in CFA analysis. F. Structural Equation Modelling
Table V represents the standardized coefficients or factor Fig. 3 shows the structural model with chi square 50.966,
loadings, unstandardized coefficients and the standard errors df= 51, CMIN/DF 0.999, TLI 1.000, CFI 1.000, and RMSEA
for each of the observed variables retained in the final 0.000 (for ref. see Table IV). Table VII shows all the
hypothesized model having three latent constructs. DV17, standardized and unstandardized regression coefficients for
EM2, and P11 were fixed with the value of “1” as regression the mediating path i.e. employee morale between diversity
weights. and customer satisfaction. The total effect (path c) of
15Journal of Economics, Business and Management, Vol. 3, No. 1, January 2015
diversity on perceptions on service is 0.022, with p there is a zero in between therefore employee morale do not
value0.855 is insignificant, direct effect (path c’) is 0.015 mediate the relationship between diversity and customer
with p value 0.926 is insignificant, and indirect path (ab) is satisfaction. The total effect (path c) is 0.02, with -0.145 and
0.007 with p value 0.545 is also insignificant. The total path, 0.162 bias corrected lower and upper confidence interval, a
direct and indirect path are insignificant therefore employee zero in between them indicates that this path is also
morale do not mediate the relationship between diversity and insignificant, and finally the direct effect (path c’) is 0.014
customer satisfaction. Also there was no direct relationship with -0.162 and 0.16 bias corrected BC lower and upper
found between diversity and customer satisfaction. confidence interval and this path is also insignificant as it
involves a zero in between.
The measurement and structural model was an idealistic fit.
The model tested the relationship between diversity and
customer satisfaction mediated through employee morale.
The results showed that diversity had no effect, direct,
indirect or total on customer satisfaction. Thus there no
relationship was found between diversity and customer
satisfaction hence any mediation. However, there was a
relationship between diversity and employee morale and it
was a positive relationship. All the hypotheses have been
Fig. 3. Hypothesized structural equation model. Comparative fit
index=1.000; Root mean square error of approximation=0.000, rejected.
Chi-square=50.966; df=51; e=error
TABLE VII: RESULTS FROM STRUCTURAL EQUATION MODELLING V. DISCUSSION
Numerous studies have identified worker and workplace
characteristics which affect morale [36], [37], [18]. This
study has tested the effect of diversity on customer
satisfaction through employee morale. One important
precedent of employee morale which has not yet been tested
is the perceptions of diversity.
Employee morale is imperative to business operations
which leads to increased job satisfaction and efforts, value in
the work and dedication to the organization, and the
importance of organizational goals than personal goals, thus,
However one intriguing insight was found during the study, increasing organization’s performance [23], [18].
that diversity has a positive relationship with employee In service based organizations, people provide the product.
morale. Path a was found significant in the study with 0.222 This product is their interaction with customers. Investment
standardized regression weight and 0.015 sig value. Also the in people and technology that supports front-line workers is
lower and upper bias corrected point estimate of diversity on their prime motive. Thus, exceptional customer service does
employee morale was 0.065 and 0.375 which does not not happen on its own; rather it has to be created; manifested
include zero and is therefore significant. The beta shows the in the system and in the people. Today, the product of service
positive value not the negative value which was hypothesized is different from the products which are manufactured. If
in H2, hence if diversity increases, employee morale also customer service is an important concern to an organization,
increases. It means that there is greater acceptance, then people have to be important element in solving this
appreciation and value for diversity among the fast food concern. To make an organization productive, it needs to
employees as they do not feel discriminated based on motivate its intellectual capital and two motivators are job
ethnicity, race, colour, creed, origin, age, gender and so on. satisfaction and commitment which are part of employee
Table VIII shows all the point estimates and bootstrapping morale which refer to one’s feelings and attitudes towards the
results at 95% Confidence Interval for all the direct, indirect job and organization [24].
and total paths in structural equation modelling. In this study no relationship was found between employee
morale and customer satisfaction but distinguished in the way
TABLE VIII: POINT ESTIMATES AND BC 95% CI FOR INDIRECT EFFECTS
that this study measures customer satisfaction using
DINESERV (perceptions) tool. Nevertheless it gave new
insight into the relationship between diversity and employee
morale. Notably, the present study substantiated the positive
direct effect of diversity on employee morale and diversity
appeared as a strong precursor of employee morale in the fast
All the three paths direct, indirect and total areinsignificant food restaurant setting.
and have 0 within the lower and upper confidence intervals.
The indirect effect (path ab) was insignificant with point
estimate 0.006. The bias corrected (BC) lower and upper VI. LIMITATIONS
confidence interval are -0.015and 0.045 which means that Firstly, the sampling unit understudy is not generalizable
16Journal of Economics, Business and Management, Vol. 3, No. 1, January 2015
to a larger population because the sample size of 220 in Karachi. The proposed model of diversity can also be
respondents is low; also only one city (i.e. Karachi) and one implemented in other departments in the head offices of these
industry (i.e. fast food) was examined in the study. restaurant chains, different service industries, different types
Secondly, the discriminant validity of diversity is a major of restaurants or in various value chain activities or
issue in the study i.e. the convergent validity is good and intermediaries in the supply chain and marketing field.
there is correspondence between similar items but Thirdly, with respect to measurement issues, this study used a
discriminant validity of diversity is not good it is unable to be questionnaire for collection of data; future research may use
distinguished from dissimilar items. It leads to the third other methodologies to reduce response bias and increase
limitation which response bias. As most of the front line discriminant validity and reliability of diversity. Researchers
employees which responded asked for assurity that their jobs may adopt “triangulation” (i.e. collecting data using three
will not be jeopardized, also that this information will not be different methodologies), for e.g. observations, interviews,
shared with anyone and their names will not be identified. and self-reported questionnaires so that the reliability of the
Thus response bias could be because of employees being results of their study may be improved and they may be able
worried about their job security and reluctance to voice their to capture the diversity, morale and customer satisfaction
opinions which lead to false responses or responses with issues in depth. Fourthly, the Perceptions on service could be
patterns or malingering. loaded on 5 factors based on the previous organizational
Fourthly, the five dimensions of DINESERV [29] were not literature, and can be tested empirically. Finally, customer
used to make five factors in perceptions on service; instead satisfaction can be measured using different tools to find any
they were all loaded on one factor together. If the five possible relationship between diversity, employee morale
dimensions of reliability, assurance, responsiveness, and customer satisfaction.
tangibles and empathy would have been created then it would Employee loyalty and customer loyalty strengthens each
be a 2nd order CFA and the results may also be changed.
other, increasing job satisfaction and customer value.
Fifthly, using DINESERV Perceptions (P) adapted version
Concisely, if employees are more satisfied then so will be
of SERVPERF (for restaurant industry) to measure customer
customers. HR practices are revealed in employee behaviours,
satisfaction may not be accepted by critics as a debate have
attitudes and feelings, and customer satisfaction. Diversity,
been going on in the past between SERVQUAL(P-E) and
employee morale and customer satisfaction gained
SERVPERF(P) tools. Stating in favour of performance-based
prominence in organizational literature in the past century, all
measures (SERVPERF), Cronin and Taylor [31] argue that
differently; through this study this new association was tested
researchers usually evaluate the components of overall
but unfortunately found no evidence of such an incidence.
satisfaction or perceived quality by customers assess the
However, the results of this study provided significant
performance of the business processes of the organization.
Despite the fact that evaluating perceptions is a general insights into the underlying effect between diversity and
practise; it does not suggest that performance measures are employee morale. Future studies may use this model to
better than disconfirmation measures. As verified by further test their relationship in other settings.
Parasuraman, Berry & Zeithaml [33], SQ measurements (P-E)
which involve expectations along with perceptions give REFERENCES
extensive and detailed information than those that only [1] S. C. Kundu, “Managing cross cultural diversity,” Delhi Business
Review, vol. 2, no. 2, 2001.
focuses on perceptions. In addition, the information produced [2] G. Robinson and K. Dechant, “Building a business case for diversity,”
by disconfirmation-measures has greater analytical value and The Academy of Management Executive, vol. 11, no. 3, pp. 21-31,
this higher analytical value of SERVQUAL compensates the 1997.
[3] H. A. Patrick and V. R. Kumar, “Managing workplace diversity issues
loss in predictive power as compared to SERVPERF and challenges,” SAGE Open, vol. 2, no. 2, 2012.
according to Parasuraman, et al. [32]. [4] S. E. Jackson, K. E. May, and K. Whitney, “Under the dynamics of
Lastly, Yap, and Kew [38] differentiated between diversity in decision-making teams,” in Team Effectiveness and
Decision Making in Organizations, R. A. Guzzo & E. Salas (Eds.), San
customer satisfaction and service quality. According to them, Francisco: Jossey-Bass., 1995, pp. 204-261.
customer satisfaction may be an outcome of any dimension [5] J. B. Shaw and E. B. Power, “The effects of diversity on small work
besides quality such as needs, equity, perceptions of fairness group processes and performance,” Human Relations, vol. 51, no. 10,
while dimensions of quality service are specific and based on pp. 1307-25, 1998.
[6] J. R. W. Joplin and C. S. Daus, “Challenges of leading a diverse
ideals or excellence. Also customer satisfaction has more workforce,” The Academy of Management Executive, vol. 11, no. 3, pp.
conceptual antecedents as compared to service quality. 32-47, 1997.
Besides, judgements on satisfaction are based on experience [7] N. Cornelius, Human Resource Management: A Managerial
Perspective, Cornwall: Thomson Business Press, 1999.
with the service provider while judgements on quality may [8] B. D. Netto and A. S. Sohal, “Human resource practices and workforce
not [38]. diversity: An empirical assessment,” International Journal of
Manpower, vol. 20, no. 8, pp. 530-547, 1999.
[9] J. P. Fernandez, The Diversity Advantage, New York: Lexington
Books, 1993.
VII. CONCLUSIONS [10] P. Grace, “Danger-diversity training ahead: Addressing the myths of
diversity training and offering alternatives,” The 1994 Annual:
In view of the limitations, this study has several Developing Human Resources, pp. 189-99, 1994.
implications for future research. Firstly, future researchers [11] R. Hayles and R. A. Mendez, The Diversity Directive, New York:
can conduct a nationwide study on a larger sample size and McGraw-Hill.
[12] C. Torres and M. Bruxelles, “Capitalizing on global diversity,” HR
on different sampling units which would generalize their Magazine, pp. 30-33, 1992.
findings. Secondly, this study focussed only on frontline [13] M. Simmons, New Leadership for Women and Men - Building an
employees of different branches of fast food restaurant chains Inclusive Organization, England, Gower Publishing Ltd., 1996.
17Journal of Economics, Business and Management, Vol. 3, No. 1, January 2015
[14] N. J. Adler, International Dimensions of Organizational Behaviour, [30] W. A. Inkumsah, “Measuring customer satisfaction in the local
Cincinnati, Ohio: South- Western College Publishing, 1997. ghanaian restaurant industry,” European Journal of Business and
[15] G. Hofstede, Cultures and Organisation: Intercultural Cooperation Management, vol. 3, no. 2, pp. 125-138, 2011.
and Its Importance for Survival: Software of the Mind, London, [31] J. J. Cronin and S. A. Taylor, “Measuring service quality: A
England: HarperCollins, 1994. Re-examination and extension,” Journal of Marketing, vol. 56, pp.
[16] P. Howitt, “Looking inside the labor market: A review article,” Journal 55-68, 1992.
of Economic Literature, XL, 125-38, 2002. [32] A. Parasuraman, V. A. Ziethaml, and L. L. Berry, “Reassessment of
[17] A. C. Lawrence, The Significance of Industrial Morale for Improved expectations as a comparison standard in measuring service quality:
Work Performance, Pretoria: Unisa, 1996. Implications for future research,” Journal of Marketing, pp. 111-124,
[18] S. J. Linz, L. K. Good, and P. Huddleston, “Worker morale in Russia: 1994.
An exploratory study,” Journal of Managerial Psychology, vol. 21, no. [33] A. Parasuraman, L. L. Berry, and V. A. Zeithaml, “Guidelines for
5, pp. 415-437, 2006. conducting service quality research,” Marketing Research, pp. 34-44,
[19] R. Hershey, Organizational Morale. New York: Kings Point, 1985. 1990.
[20] Employee Morale. (May 16, 2013). [Online]. Available: [34] S. K. Jain and G. Gupta, “Measuring service quality: SERVQUAL vs.
http://www.businessdictionary.com/definition/employee-morale.html SERVPERF scales,” Vikalpa, vol. 29, no. 2, pp. 25-37, 2004.
[21] E. Day and M. R. Crask, “Value assessment: The antecedent of [35] J. B. Schreiber, A. Nora, F. K. Stage, E. A. Barlow, and J. King,
customer satisfaction,” Journal of Consumer Satisfaction “Reporting structural equation modeling and confirmatory factor
Dissatisfaction and Complaining Behaviour, vol. 13, pp. 52-60, 2000. analysis results: A review,” The Journal of Educational Research, vol.
[22] E. Cengiz, “Measuring customer satisfaction: Must or not,” Journal of 99, no. 6, pp. 323-338, 2006.
Naval Science and Engineering, vol. 6, no. 2, pp. 76-88, 2010. [36] G. F. Koeske and S. A. Kirk, “The effect of characteristics of human
[23] J. Abbott, “Does employee satisfaction matter? A study to determine service workers on subsequent morale and turnover,” Administration in
whether low employee morale affects customer satisfaction and profits Social Work, vol. 19, no. 1, pp. 15-31, 1995.
in the business-to-business sector,” Journal of Communication [37] D. H. Knight, S. Ahmad, and R. G. Schroeder, “When do feedback,
management, vol. 7, no. 4, pp. 333-339, 2003. incentive control and autonomy improve morale? The importance of
[24] L. Jerome and B. H. Kleiner, “Employee morale and its impact on employee-management relationship closeness,” Journal of Managerial
service: What companies do to create a positive service experience,” Issues, vol. 13, no. 4, pp. 466-482, 2001.
Managing Service Quality, vol. 5, no. 6, pp. 21-25, 1995. [38] S. F. Yap and M. L. Kew, “Service quality and customer satisfaction:
[25] P. M. Podsakoff, S. B. MacKenzie, J. Y. Lee, and N. P. Podsakoff, Antecedents of customer's re-patronage intentions,” Sunway Academic
“Common method biases in behavioral research: A critical review of Journal, vol. 4, pp. 59-73, 2007.
the literature and recommended remedies,” Journal of Applied
Psychology, vol. 88, no. 5, p. 879, 2003. Usmani Sania was born in Karachi, Pakistan on 26th
[26] K. P. D. Meuse and T. J. Hostager, “Developing an instrument for of April 1986. The author’s has completed Bachelor in
measuring attitudes toward and perceptions of workplace diversity: An Business Administration (2008) and Master in
initial report,” Human Resource Development Quarterly, vol. 12, no. 1, Business Administration (2010) from Iqra University,
pp. 33-51, 2001. Main Campus, Karachi, Pakistan. The specializations
[27] J. Cook and T. Wall, “New work attitude measures of trust, in MBA were in 2 field; Finance and Supply Chain
organizational commitment and personal need non-fulfilment,” Management. Currently doing PhD from Iqra
Journal of Occupational Psychology, vol. 53, no. 1, pp. 35-53, 1980. University in Management.She has worked at
[28] J. R. Hackman and G. R. Oldham, “Development of the job diagnostic Dawlance Pvt Ltd as a senior officer
survey,” Journal of Applied Psychology, vol. 60, no. 2, pp. 159-170, Planning/Receiving. Also she has interned at RBS
1975. (Royal Bank of Scotland) in compliance department and Total Atlas
[29] H. J. Kim, C. Cahon, and J. Miller, “Assessing service quality in Lubricants in supply chain department (distribution). Currently she is
Korean casual-dining restaurants using DINESERV,” Journal of working as a Lecturer at Iqra University in Management Sciences
Foodservice Business Research, vol. 6, no. 1, pp. 67-86, 2003. Department, Main Campus, Karachi, Pakistan. Her Research Interests are in
the field of HR management.
18You can also read