BBVA Foundation European Values Study Values and attitudes in Europe regarding the public sphere - Part one
←
→
Page content transcription
If your browser does not render page correctly, please read the page content below
BBVA Foundation European
       Values Study
          Part one:
Values and attitudes in Europe
 regarding the public sphere

                      Department of Social Studies and Public Opinion
                                                     September 2019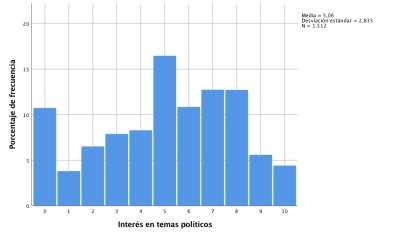
• The BBVA Foundation’s 2019 European Values Survey examines a broad set of
  values and attitudes held by the adult population of five European countries:
  Germany, the United Kingdom, France, Italy and Spain. The values and attitudes
  considered address both the public (politics, economics, the media, trust) and
  private (religion, ethics, science, environment) domains.

• This presentation confines itself to diverse aspects of the public sphere. A
  comparative analysis of these values and attitudes identifies commonalities and
  differences across and within the five societies by reference to
  sociodemographic and cultural factors: age, sex, educational level and declared
  political orientation.

• Empirical information was gathered through a survey of a representative
  sample of 1,500 people aged 18 and over in each of the European Union’s top
  five most populated countries.

• The fieldwork was carried out by Ipsos between April and July 2019. The design
  and analysis of the study data are the work of the BBVA Foundation Department
  of Social Studies and Public Opinion.

                                                                                    2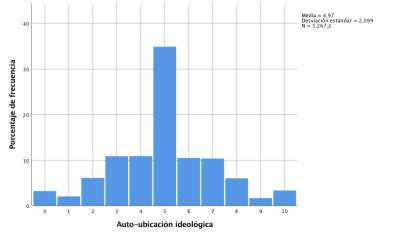
• The aim of the study is to capture a broad set of preferences, values and beliefs
  that inform individual conduct in multiple facets of public and private life, and
  to examine how these conducts interrelate in the two domains.
• Values operate as a kind of “cognitive, normative and emotional GPS” that helps
  individuals navigate their way around complex issues and situations on which
  they have limited information, aiding them in their decision-making: they help
  identify what is “good” (valuable) and “right” (which kind of individual and
  institutional behaviours are obligatory, permitted or “forbidden”). This is a
  “soft” and “latent” universe, but one that is effective and stable.
• At different times there may exist an alignment or dissonance, a state of
  compatibility or inconsistency (open or latent) between the dominant values
  and attitudes of a given society and that same society’s institutional and
  normative framework. Social and political change is in large part driven by the
  interaction between institutions and policies and the latent universe of the
  public’s perceptions, values and attitudes. In democratic, plural societies, the
  dominant values and attitudes tend to coexist and, occasionally, clash with the
  specific worldviews of certain (minority) groups or segments with their own
  sub-cultures.

                                                                                      3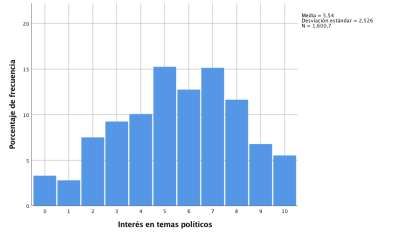
• The map of cultural “intangibles” – values and attitudes – of the adult
  population is fairly stable in its main contours, but may be affected or modified
  as a result of exceptional events (crises) or the emergence of new information
  of singular importance, visibility and reach. On the individual plane, the
  universe of internalized values will hold out strongly against any attempt at
  change based on persuasion or propaganda. And any wholesale shift in public
  values and attitudes will tend to unfold only slowly, the product of fragmentary
  and cumulative processes.
• In these times of globalization and real-time communications networks, a
  society’s values and attitudes can be shaped over a shorter time frame by
  particularly significant events (“tipping points”) and movements arising in other
  geographical areas.
• When mapping a society’s values and attitudes, it is neither necessary nor
  useful to posit the existence among the population of structured, all-
  encompassing ideologies of the kind found solely among “elites” (in the
  sociological sense of the term). But although relations may be looser than those
  bounded by an ideological framework (endowed with a cognitive, evaluative
  foundation and doctrinal “sources”), we do find meaningful (non-random)
  affinities or clusters among values and attitudes (of the public sphere, the
  private sphere and also between the two).                                           4
• The study provides an essentially descriptive map of values and attitudes
  relative to the public sphere, identifying the characteristics of Spain that most
  stand out in comparison to the other four European countries in mid-2019 and,
  for selected indicators, considering how they have varied over the last fourteen
  years. Four main strands:

                                                 •   Map of interest in current affairs
          Interest, information and              •   Following current events though the media
          participation in the public sphere     •   Participation in social and political activities
                                                 •   Associationism
                                                 • Declared political orientation
               Declared political orientation,   • Views on how democracy is working and its
               democracy, the role of the          relationship with the rule of law
               state and territorial             • Attitudes to political parties and the political class
               identification                    • View of the responsibilities of the state
                                                 • Territorial identification
                                                 •   Trust in professional groups
               Trust in groups and               •   Trust in institutions
               institutions                      •   Perceptions of corruption
                                                 •   Perceptions of the law courts and the media

                                                 • Perception of the economic situation
           Concerns over global issues           • Attitudes towards global challenges: climate change,
                                                   immigration, reception of refugees and “fake news”
                                                                                                            5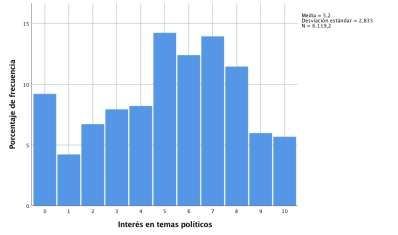
Interest, information and participation in
the public sphere
 • Map of interest in current affairs
 • Following current events through the
   media
 • Participation in political and social
   activities
 • Associationism
MAP OF INTERESTS

• In all countries, interest in politics stands at a mid-point on the interest scale (from 0 to 10). Health and the
  environment are the issues attracting most declared interest, followed by culture, the economy, technology
  and science. The bottom spot is occupied by interest in celebrities.
• The Spanish score below the average of the other four European countries in interest in politics, and above the
  average in interest in world affairs, the economy, science and medicine and health.

                “Could you please tell me how interested you are in each of the issues I am going to read out?”
                   Average on a scale from 0 to 10, where 0 means that you have no interest at all and 10 that you have a great deal of interest
                                                                        Base: all cases.
                                 Spain         Other countries          France          United Kingdom              Germany        Italy
 10

  8

  6

  4

  2

  0
      Medicine and Environment Culture         Economy        Science      Technology      Interna-       Crime          Sport        Politics     Celebrities’
        health                                                                          tional affairs   (murder,                                     lives
                                                                                                         robbery)

                                                                                                                                                                  7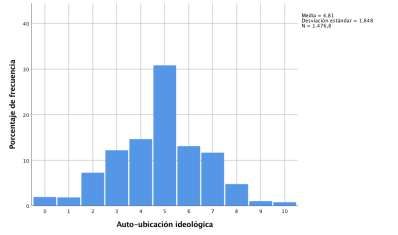
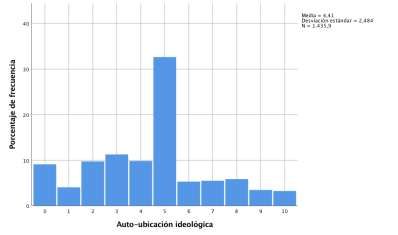
INTEREST IN POLITICS
• The distribution of interest in politics shows a large segment in Spain positioned at the lowest end of the scale
(scores from 0 to 2), distant from the European average. In Germany, by contrast, this group represents around
half the percentage recorded for Spain.
“Could you please tell me how interested you are in each of the issues I am going to read out?”
POLITICS. Distribution on a scale from 0 to 10, where 0 means that you have no interest at all and 10 that you have a great deal of interest. Base: all cases.
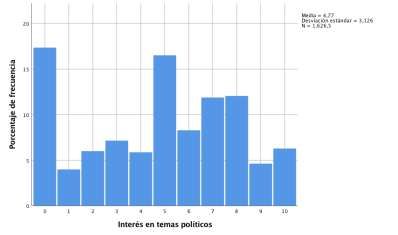
8INTEREST IN POLITICS
• In Spain, and in the United Kingdom, the “mode” (response with most mentions) on the interest scale is “0”,
evidencing extreme disinterest or outright rejection. This extremely low score distorts (reduces) the average.
“Could you please tell me how interested you are in each of the issues I am going to read out?”
POLITICS. Distribution on a scale from 0 to 10, where 0 means that you have no interest at all and 10 that you have a great deal of interest. Base: all cases.
Spain Other countries United Kingdom
Percentage
Percentage
Percentage
interest in politics interest in politics interest in politics
Germany France Italy
Percentage
Percentage
Percentage
interest in politics interest in politics interest in politics
9INTEREST IN POLITICS BY SEGMENT
• In Spain interest in politics is keener among younger people, those with more years of study and those
identifying as on the political left. There is only a minor difference between men and women.
• In the other four countries, men report more interest in politics and the age distribution is the opposite of
Spain’s, with interest growing as we advance through the age groups. Interest is also greater among those of a
higher educational level and those declaredly on the political left.
“Could you please tell me how interested you are in each of the issues I am going to read out?”
POLITICS. Average on a scale from 0 to 10, where 0 means that you have no interest at all and 10 that you have a great deal of interest
Base: all cases.
Spain Other countries
Total 4,8 5,2
Sex
Male 4,9 5,6
Female 4,6 4,8
Age
18-24 5,3 4,6
25-34 5,0 4,9
35-44 5,2 5,2
45-54 4,6 5,3
55-64 4,9 5,3
65 years old or over 4,2 5,5
Age finished studying
15 or under 3,9 4,4
16 to 19 4,9 5,0
20 or over 5,7 5,9
Declared ideology
Left (0 - 4) 5,8 5,8
Centre (5) 4,2 4,9
Right (6 - 10) 5,1 5,5
10
0 2 4 6 8 10 0 2 4 6 8 10MAIN NEWS SOURCE
• Alongside interest, informedness about current issues is a prerequisite for participating in the diverse aspects
of public life. TELEVISION remains the main medium for keeping up with current affairs. Next come
NEWSPAPERS, adding together print and online editions, while a similar proportion opt for DIGITAL MEDIA
(social networks and news aggregation websites). A smaller proportion state RADIO as their first option.
Television leads by a wide margin in Italy and Spain, while in Germany, France and the United Kingdom
preferences are more evenly distributed.
“What is the main medium you use to keep up with current affairs?” First mention. Base: all cases.
Television
Spain 54% 11% 12% 6% 11% 4%2%
Radio
Other countries 48% 11% 17% 3% 9% 8% 3%
Print newspapers (+ online version)
Italy 63% 3% 10% 3% 9% 9% 2%
Exclusively online newspapers
Germany 46% 9% 21% 1% 8% 10% 5% Social networks
News aggregation websites like Google News,
France 45% 20% 16% 4% 8% 5%3% Yahoo News, etc.
Conversations with colleagues, friends or
family members
United Kingdom 39% 11% 19% 4% 12% 9% 4%
DK/NA
0% 20% 40% 60% 80% 100%
11TOP TWO NEWS SOURCES
• Focusing on the two main media used to follow news in the five European countries, it is clear that television
dominates strongly, particularly in Italy and Spain.
• In second place come newspapers, in both print and digital versions, with the former especially popular in
Germany and the latter winning out in France and United Kingdom. Spanish respondents are the least likely of
this group to state print newspapers as their first or second news channel of choice.
• The third spot goes to strictly digital media like social neworks and news aggregation sites, an option particularly
favored in the United Kingdom and Italy, where they are already closing in or level with newspapers.
• Radio lags behind the rest, despite being a widely followed medium in France.
“What is the main medium you use to keep up with current affairs?”
First + second mention Base: all cases.
United
Spain Other countries Italy Germany France Kingdom
Television
78% 71% 82% 75% 69% 60%
All newspapers
37% 43% 39% 43% 46% 45%
Print newspapers
12% 24% 23% 35% 20% 19%
Online newspapers that also have a print version 16% 14% 11% 6% 18% 20%
Exclusively online newspapers, that is, with no print version
9% 6% 6% 2% 8% 6%
Social networks + news aggregation websites
31% 35% 39% 33% 27% 41%
Social networks
22% 19% 20% 16% 17% 23%
News aggregation websites like Google News, Yahoo News,
etc. 9% 16% 19% 17% 10% 18%
Radio
28% 29% 16% 32% 41% 28%
Conversations with colleagues, friends or family members
16% 15% 17% 15% 11% 15%
12MAIN NEWS SOURCE AMONG YOUNG PEOPLE
• While those aged 25 and older state the television as their medium of choice to follow current affairs, its
popularity drops considerably among the 18-24 age group, which exhibits a clear preference for digital media
like news aggregation websites and, principally, social networks.
• The importance of exclusively digital media among the 18-24 age group is common to all the countries
analyzed (in declining order, social networks, news aggregation websites and online newspapers).
“What is the main medium you use to keep up with current affairs?” First mention. Base: all cases.
Television
18 to 24 years old 29% 2% 8% 8% 36% 15% 2%
Radio
Spain
Print newspapers (+ online version)
25 years old and over 56% 11% 13% 5% 9% 3%2%
Exclusively online newspapers
Social networks
18 to 24 years old
Other countries
19% 3% 14% 5% 33% 17% 9%
News aggregation websites like
Google News, Yahoo News, etc.
Conversations with colleagues,
25 years old and over 51% 11% 17% 3% 7% 7% 3% friends or family members
DK/NA
0% 20% 40% 60% 80% 100%
13NEWSPAPER CONSUMPTION
• Newspaper reading (print + online) varies significantly across the five European countries.
• The highest daily readership is in France and Germany, with Italy bringing up the rear. In Spain, reading
frequency stands below the average of the other four countries, with a third of respondents reporting that
they never read a newspaper.
“How often do you read the newspaper in either the print or online edition (excluding sports only
newspapers)?” Base: all cases.
Spain 29% 16% 20% 34%
Other
32% 22% 21% 24%
countries Every day
Several times a week
France 38% 20% 20% 23%
Several times a month
Never or almost never
Germany 37% 29% 18% 15% DK/NA
United
30% 16% 23% 29%
Kingdom
Italy 22% 20% 27% 30%
0% 20% 40% 60% 80% 100%
14PARTICIPATION BY ACTION
• A key indicator of individuals’ connection with the public sphere is their participation in diverse political and
social actions, over and above voting. This participation varies between countries, with petition signing and
product boycotts the most common forms of activism. The French are the most active on this count with the
British in second place. The Spanish population stands out for its higher participation vs. the European
average in demonstrations and strikes, on a par with France.
“Have you done any of the things I am going to read out in the last 12 months?”
Percentage answering yes. Base: all cases.
Other United
Spain France Germany Italy
countries Kingdom
Signed a petition in a signature collection campaign 20% 27% 37% 39% 20% 14%
Boycotted or stopped using certain products for political,
10% 24% 42% 28% 20% 7%
ethical or environmental reasons
Taken part in online surveys or referendums to approve or
8% 14% 17% 24% 9% 8%
reject some measure
Collaborated with some civic association or non-
18% 12% 23% 15% 6% 6%
governmental organization (NGO) to support social causes
Taken part in demonstrations 18% 10% 18% 7% 7% 9%
Got in contact with a politician or authority to draw their
6% 11% 12% 19% 7% 6%
attention to some problem
Taken part in a strike 10% 5% 9% 2% 3% 6%
Collaborated in the campaigns or activities of a political
3% 4% 3% 5% 3% 4%
party
Given money to a political party or organization 2% 4% 3% 6% 3% 3%
100%
80%
Those carrying out at least one 64%
60% 53%
of the public participation 45%
36% 36%
actions listed 40%
26%
20%
0%
Spain Other countries France United Kingdom Germany Italy 15NUMBER OF PARTICIPATION ACTIONS
• Almost two thirds of Spanish respondents had not engaged in any of the actions listed, showing that
participation is a minority pursuit.
• The distribution of number of actions per country confirms a higher degree of activism in France, followed by
the United Kingdom, with the Italians at the other extreme.
Distribution of actions engaged in over the last 12 months. Base: all cases.
Spain 64% 13% 8% 9% 6%
Other countries 55% 15% 11% 13% 5%
Italy 74% 9% 7% 7% 3%
Germany 64% 15% 10% 9% 2%
United Kingdom 47% 16% 12% 17% 8%
France 36% 21% 15% 20% 8%
0% 20% 40% 60% 80% 100%
None 1 2 3 to 4 5 to 9
16PARTICIPATION IN DEMONSTRATIONS
• In 2019, participation in demonstrations was highest in Spain and France. This squares with the results of 2009
and 2012, when the same two countries headed the list.
• In Spain, involvement in demonstrations in 2019 was rather less than in 2012, but ahead of the level of 2009.
“Have you done any of the things I am going to read out in the last 12 months?”
Take part in demonstrations
Percentage answering yes. Base: all cases.
United
Spain France Italy Germany Kingdom
BBVA FOUNDATION EUROPEAN MINDSET
STUDY 2009 12% 17% 8% 5% 3%
BBVA FOUNDATION WORLDVIEWS STUDY
2012 23% 14% 14% 7% 4%
BBVA FOUNDATION EUROPEAN VALUES
STUDY 2019 18% 18% 9% 7% 7%
17PARTICIPATION IN ELECTIONS*
Participation in the last legislative elections and European elections
Last legislative elections European elections 2019
Spain 2019 75.8% 60.7%
Germany 2017 76.2% 61.4%
France 2017 (avge 1st and 2nd round) 45.7% 50.1%
Italy 2018 72.9% 54.5%
United Kingdom 2017 68.7% 36.9%
* These are official voter turnout data, i.e., not taken from the 2019 Values Study. 18CONNECTION WITH POLITICAL PARTIES
• Only a small minority report any kind of direct support for political parties or involvement with their activities.
• In Spain, 4% have participated by collaborating in campaigns and activities and/or giving money, against a 6%
average in the other four countries.
“Have you done any of the things I am going to read out in the last 12 months?”
Percentage answering yes. Base: all cases.
Other United
Spain France Germany Italy
countries Kingdom
Collaborated in the campaigns or activities of a political
3.3% 3.9% 3.0% 5.1% 3.4% 4.2%
party
Given money to a political party or organization 2.1% 3.7% 3.2% 5.7% 2.9% 3.0%
TOTAL: Collaborated in the campaigns or activities of a
political party and/or given money to a political party or 4.2% 6.0% 4.6% 8.1% 5.4% 5.8%
organization
19PARTICIPATION BY SEGMENT
• A look at the percentage engaging in at least one of the nine personal participation activities (excluding
voting) reveals that participation by segment is notably uneven; higher among young people, those of a higher
educational level, those most interested in politics and, most patently, those identifying with the political left.
In Spain, the segments identifying with the right and, especially, the center, are relatively inactive.
Percentage engaging in at least one participation activity.
Base: all cases.
Spain Other countries
Total 36% 45%
Sex
Male 37% 43%
Female 36% 46%
Age
18-24 48% 52%
25-34 42% 50%
35-44 42% 49%
45-54 37% 47%
55-64 39% 43%
65 years old or over 22% 35%
Age finished studying
15 or under 21% 26%
16 to 19 41% 39%
20 or over 50% 59%
Declared ideology
Left (0- 4) 51% 58%
Centre (5) 26% 43%
Right (6-10) 31% 42%
Interest in politics
Low interest (0-4) 26% 34%
Medium interest (5) 29% 41%
High interest (6-10) 49% 53%
0% 20% 40% 60% 80% 100% 0% 20% 40% 60% 80% 100%
20AGGREGATE INDICATOR OF ASSOCIATIONISM
• Associationism is a strongly ingrained practice in France, Germany and the United Kingdom, with Italy and
Spain at more than twenty points distance.
• By type of activity, associationism is largely concentrated in activities of a non-political nature such as sports
or leisure.
Percentage belonging to at least one association. Base: all cases.
100%
80%
60%
51%
48% 47%
43%
40%
25% 26%
20%
0%
Spain Other countries France Germany United Kingdom Italy
Sports or recreational activities 5% Sports or recreational activities 22%
Charitable or welfare asociations 6% Charitable or welfare asociations 8%
Cultural or artistic associations 6% Cultural or artistic associations 7%
Religious associations 4% Religious associations 7%
Trade unions 4% Trade unions 6%
21MAP OF COUNTRIES BY LEVEL OF PUBLIC
PARTICIPATION AND ASSOCIATIONISM
60
GE Germany
FR
50 SP Spain
GE FR France
UK
IT Italy
UK United Kingdom
Associationism
40
30
IT SP
20
10
20 30 40 50 60 70
Aggregate indicator of participation in political and social activities
22Public participation and Newspaper consumption and public Newspaper consumption and
associationism participation associationism
Associationism Associationism
(belong to at least Took part in at least (belong to at least
Took part in one association) 1 activity one association)
at least 1 Doesn’t Newspaper Didn’t Newspaper Doesn’t
activity Belongs belong consumption Took part take part consumption Belongs belong
Took part 62% 28% Every day 44% 21% Every day 39% 26%
Spain Didn’t take Spain Never-Almost Spain Never-Almost
38% 72% 20% 43% 26% 37%
part never never
Took part 64% 29% Every day 37% 27% Every day 38% 26%
Other Other Other
countries Didn’t take 36% 70% countries Never-Almost 19% 28% countries Never-Almost 17% 29%
part never never
Took part 75% 52% Every day 41% 32% Every day 41% 34%
France Didn’t take France Never-Almost France Never-Almost
25% 48% 18% 31% 18% 28%
part never never
Took part 72% 36% Every day 36% 23% Every day 35% 24%
United United United
Kingdom Didn’t take 28% 64% Kingdom Never-Almost 22% 36% Kingdom Never-Almost 22% 35%
part never never
Took part 53% 21% Every day 39% 36% Every day 44% 30%
Germany Didn’t take Germany Never-Almost Germany Never-Almost
47% 79% 12% 16% 10% 19%
part never never
Took part 52% 17% Every day 29% 19% Every day 28% 20%
Italy Didn’t take Italy Never-Almost Italy Never-Almost
48% 83% 22% 33% 22% 33%
part never never
23Relations between indicators of connection with the public space (associationism,
participation, following of news media)
Greater involvement in the public
sphere Less involvement in the public
• Medium or medium-high connection with sphere
the public sphere via diverse types of • Medium or medium-low connection with the
political and social participation public sphere via diverse types of political
• Medium to medium-high level of and social participation
associationism • Low level of associationism
• Medium-high level of daily press readership • Low level of daily press readership
France
United Countries Italy
Kingdom Spain
Germany
24Declared political orientation,
democracy, the role of the state and
territorial identification
• Political self-identification
• Views on how democracy is working
and its relationship with the rule of law
• Attitudes to political parties and the
political class
• Views on the responsibilities of the
state
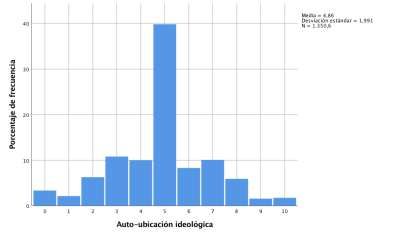
• Territorial identificationDECLARED POLITICAL ORIENTATION
• A standard indicator to classify or segment citizens is to ask them to position themselves politically on the left-
right spectrum (in this study, on a scale from 0 to 10).
• A relative majority position themselves at or close to the center of the political arc. The Spanish are the most
declaredly left-wing of the Europeans, with the left group almost twice the size of the group identifying as on
the right, and the furthest left segment (0, 1, 2) doubling that of all other countries analyzed.
“When talking about politics, we tend to use the expressions left and right. Imagine a scale from 0 to 10 where 0
corresponds to the “left” and 10 to the “right”. In which box would you place yourself?” Base: all cases.
Distribution 0 to 10 Average 0 to 10
Spain 20% 19% 29% 10% 11% 12% 4,4
Other countries 10% 19% 30% 18% 10% 14% 5,0
France 10% 18% 38% 13% 9% 12% 4,8
Germany 10% 25% 28% 23% 6% 8% 4,8
United Kingdom 11% 19% 36% 16% 8% 11% 4,9
Italy 8% 13% 18% 19% 15% 27% 5,5
0% 20% 40% 60% 80% 100% 0 5 10
0-2 3-4 5 6-7 8 - 10 DK/NA
26DECLARED POLITICAL ORIENTATION
“When talking about politics, we tend to use the expressions left and right. Imagine a scale from 0 to 10 where 0
corresponds to the “left” and 10 to the “right”. In which box would you place yourself?” Base: all cases.
Spain Other countries France
Percentage
Percentage
Percentage
Declared ideology
Declared ideology Declared ideology
Germany United Kingdom Italy
Percentage
Percentage
Percentage
Declared ideology Declared ideology Declared ideology 27DECLARED POLITICAL ORIENTATION
• Spain stands out for the size assymetry between its most left-leaning segment (2 out of every 10) and that of
the extreme right (1 out of every 10), breaking with the pattern observed in other European countries.
Segments placing themselves furthest to the left (scores 0+1+2) and furthest to the right (scores 8+9+10)
20%
Spain
11%
10%
Other countries
10%
10%
France
9%
Left 0 to 2
10% Right 8 to 10
Germany
6%
11%
United Kingdom
8%
8%
Italy
15%
0% 10% 20% 30% 40%
28DECLARED POLITICAL ORIENTATION BY SEGMENT
• There is a sharp difference in the proportion of young Spaniards identifying as on the left with respect to their
European peers, to the extent that the furthest left segment (0, 1, 2) is almost four times larger.
• In the five countries, identification with the political left increases with degree of interest in politics and
educational level. This last factor operates especially strongly in Spain (difference of 9 versus 4 points between
the two extremes of years of study).
Spain Other countries
“When talking about Total 10% 19% 30% 18% 10% 14%
20% 19% 29% 10% 11% 12%
politics, we tend to use the
Sex
expressions left and right.
Imagine a scale from 0 to 10 Male 21% 21% 28% 9% 11% 9% 10% 20% 28% 20% 11% 12%
where 0 corresponds to the Female 19% 17% 30% 10% 11% 14% 10% 18% 32% 16% 8% 16%
“left” and 10 to the “right”.
Age
In which box would you
place yourself?” 18-24 31% 16% 25% 10%5% 11% 8% 23% 27% 15% 9% 18%
Distribution on a scale from 0 to 25-34 27% 13% 27% 6% 15% 12% 11% 21% 28% 16% 8% 15%
10. Base: all cases.
35-44 22% 19% 32% 8% 10% 11% 9% 21% 31% 16% 8% 15%
45-54 14% 21% 31% 14% 7% 13% 10% 18% 31% 19% 9% 12%
55-64 23% 19% 28% 8% 10% 12% 14% 18% 30% 16% 10% 12%
65 years old or over 14% 21% 27% 11% 15% 12% 11% 17% 30% 18% 12% 14%
Age finished studying
15 or under 15% 19% 29% 10% 11% 17% 8% 13% 28% 15% 13% 22%
16 to 19 21% 17% 30% 10% 12% 10% 8% 16% 33% 19% 10% 15%
20 or over 24% 20% 28% 9% 10% 9% 12% 25% 29% 18% 8% 9%
Interest in politics
Low interest (0-4) 14% 13% 33% 9% 10% 22% 8% 15% 34% 15% 8% 20%
Medium interest (5) 16% 19% 35% 9% 11% 9% 10% 16% 33% 19% 9% 14%
High interest (6-10) 28% 24% 23% 10% 12%4% 11% 23% 26% 20% 11% 10%
0% 20% 40% 60% 80% 100% 0% 20% 40% 60% 80% 100%
0-2 3-4 5 6-7 8 - 10 DK/NA
29CHANGING VIEWS ON HOW DEMOCRACY IS WORKING
• The balance of opinion on how democracy is working is negative in every country except Germany, where the
average scores are strongly positive. British respondents exert a large negative influence on this outcome.
• Views on the health of democracy have turned sharply for the worse in the United Kingdom and, also, France,
if we compare 2019 results with those of 2009 and 2012. Scores in Spain and Italy have improved with respect
to 2012 (by one point in Spain) but without recouping the higher values of ten years back.
“How well do you think democracy is working right now in (COUNTRY)?”
Average on a scale from 0 to 10, where 0 means very badly and 10 means very well. Base: all cases.
4,6
Spain 3,6
5,3
6,5
Germany 6,1
6,1
4,5 Eurpean Values Study 2019
Italy 3,7 Worldviews and Values 2012
5,2
European Mindset 2009
4,2
France 4,8
5,2
3,5
United Kindom 4,9
4,9
0 2 4 6 8 10
30VIEWS ON DEMOCRACY BY EDUCATIONAL LEVEL
• Views on how well democracy is working turn more positive with years of study. This effect is readily
discernible in Germany, France and the United Kingdom, less so in Italy, and absent in the case of Spain.
“How well do you think democracy is working right now in (COUNTRY)?”
Average on a scale from 0 to 10, where 0 means very badly and 10 means very well. Base: all cases.
15 or under 16 to 19 20 or over
10
8
6,5 6,6
6,2
6
5,1
4,6 4,6 4,7 4,6 4,6 4,7
4,5
3,9 4,1 3,9 3,9
4 3,6
3,1 3,3
2
0
Spain Other countries Germany Italy France United Kingdom
31VIEWS ON DEMOCRACY BY DECLARED POLITICAL ORIENTATION
• In Spain, Italy and the United Kingdom, those politically on the right are more upbeat about how democracy is
working than those identifying as on the left.
• Declared ideology produces no significant differences in either Germany or France.
“How well do you think democracy is working right now in (COUNTRY)?”
Average on a scale from 0 to 10, where 0 means very badly and 10 means very well. Base: all cases.
Left (0-4) Centre (5) Right (6-10)
10
8
6,6 6,5
6,3
6
5,1 5,0 5,0
4,9
4,4 4,6 4,6 4,5 4,5
4,3 4,2 4,4
3,9
4 3,5
3,2
2
0
Spain Other countries Germany Italy France United Kingdom
32DEMOCRACY AND THE RULE OF LAW
• There is an ample consensus in all countries to the effect that “respect for the law is essential to safeguard
democracy.”
“Could you tell me how much you agree or disagree with the following statements?”
Percentage in agreement, with scores from 6 to 10 on a scale from 0 to 10, where 0 means completely disagree and 10 means completely
agree. Base: all cases.
Respect for the law is essential to safeguard democracy
Spain 84%
Other countries 89%
Italy 91%
Germany 90%
France 90%
United Kingdom 85%
0% 20% 40% 60% 80% 100%
33DEMOCRACY AND THE RULE OF LAW
“Could you tell me how much you agree or disagree with the following statements?”
Percentage in agreement, with scores from 6 to 10 on a scale from 0 to 10, where 0 means completely disagree and 10 means completely
agree. Base: all cases.
Respect for the law is essential to safeguard democracy
Spain Other countries
Total 84% 89%
Sex
Male 85% 90%
Female 83% 88%
Age
18-24 77% 86%
25-34 80% 84%
35-44 83% 90%
45-54 83% 90%
55-64 88% 91%
65 years old or over 87% 90%
Age finished studying
15 or under 85% 86%
16 to 19 82% 89%
20 or over 85% 91%
Declared ideology
Left (0 - 4) 83% 91%
Centre (5) 83% 90%
Right (6 - 10) 91% 92%
0% 20% 40% 60% 80% 100% 0% 20% 40% 60% 80% 100%
34POLITICAL PARTIES
• A salient aspect of each society’s political culture is the view held of the role of political parties and political
elites.
• There is a broad consensus that political parties are necessary to defend citizens’ interests, expressed most
strongly in Germany and moderately in France. This blanket agreement stands alongside the widespread
perception that the mainstream parties are falling down in their duty to represent people, a feeling
particularly strong in Italy and France.
“Could you tell me how much you agree or disagree with the following statements?”
Percentage in agreement, with scores from 6 to 10 on a scale from 0 to 10, where 0 means completely disagree and 10 means completely
agree. Base: all cases.
Political parties are necessary to defend citizens’ The mainstream political parties no longer
interests represent people like me
Spain 67% 55%
Other countries 64% 66%
Germany 82% 55%
Italy 61% 75%
United Kingdom 59% 63%
France 52% 69%
0% 20% 40% 60% 80% 100% 0% 20% 40% 60% 80% 100% 35THE POLITICAL CLASS
• Citizens express strong disaffection with the political class: in every country, the political class is seen as
placing their own interests before the interests of society.
• It is perhaps not surprising then that clear majorities share the idea that society needs leaders who have not
come from mainstream politics, a view that finds particular support in France.
“Could you tell me how much you agree or disagree with the following statements?”
Percentage in agreement, with scores from 6 to 10 on a scale from 0 to 10, where 0 means completely disagree and 10 means completely
agree. Base: all cases.
Politicans pay more attention to their own Our society needs leaders that do not come
interests than the interests of society from mainstream politics
82% 62%
Spain
81% 68%
Other countries
77% 67%
Germany
87% 69%
Italy
United Kingdom 78% 60%
France 80% 74%
0% 20% 40% 60% 80% 100% 0% 20% 40% 60% 80% 100%
36VIEW OF PARTIES BY DECLARED POLITICAL ORIENTATION
• The disaffection expressed in the statement “the mainstream political parties no longer represent people like
me” varies as a function of citizens’ political leanings:
• In Italy and Germany, agreement is strongest among those declaredly on the right
• In Spain, conversely, this view finds more support among those identifying with the left.
“Could you tell me how much you agree or disagree with the following statements?”
Percentage in agreement, with scores from 6 to 10 on a scale from 0 to 10, where 0 means completely disagree and 10 means completely
agree. Base: all cases.
The mainstream political parties no longer represent people like me
Left (0- 4) Centre (5) Right (6-10)
100%
79%
80% 76%
70% 71% 71% 69%
67% 67% 69%
66%
62% 63% 62% 63%
60% 55% 54%
49% 51%
40%
20%
0%
Spain Other countries Italy France United Kingdom Germany
37FACTORS INFLUENCING PEOPLE’S VOTES
• Respondents cite a range of factors as influencing their decision to vote for a particular party: ideological or
programmatic factors, others to do with professional competence and ability to manage the economy, the
ethical values of the party’s leaders, and the impression that it defends the interests of their social group.
• In Spain, the political program is singled out as the most important factor weighing in the choice of party,
followed by ability to manage the economy, ideology and the ethical values of its leaders. Only 9 percent
choose the more abstract considerations of knowledge and professional competence
“Which of the following factors weighs most in your decision to vote for a party at election time?” Base: all cases
100%
7% 6% 7% The fact that it defends the interests
80%
10% 18% 7%
of my social group
17% 13%
12% 19% 12%
3% The ethical values of its leaders
60% 9% 14% 18%
17% 15%
The knowledge and professional
20% competence of its leaders
18% 14% 10%
13% Its ability to manage the economy
40% 15%
8% 6% 11%
17% 8% 22%
The ideology
20%
9% 31% 31% 30% The political program
26%
21%
11%
0%
Spain Other countries United Kingdom France Germany Italy
38STATE VERSUS INDIVIDUAL RESPONSIBILTY
• The role assigned to the state in ensuring citizens a decent standard of living is a key dimension of Europe’s
political culture. Very large majorities in Spain, Italy and, at a distance, France believe that it is primarily the
state rather than the individual that should exercise this responsibility.
• In Germany, followed by the United Kingdom, a majority believe that each individual is responsible for
ensuring themselves a decent standard of living.
“Of the two statements I am going to read out, which one comes closer to your opinion?” Base: all cases.
Spain 76% 20% 4%
Responsibility for ensuring
that all citizens enjoy a decent
Other countries 51% 43% 7% standard of living should lie
mainly with the state
Italy 64% 29% 7% It is mainly up to each
individual to ensure they enjoy
a decent standard of living
France 54% 39% 7%
DK/NA
United Kingdom 44% 48% 8%
Germany 41% 54% 5%
0% 20% 40% 60% 80% 100%
39RESPONSIBILITY OF THE STATE ACCORDING TO DECLARED POLITICAL
ORIENTATION
• Political leanings are a clear differentiating factor for how people see the state’s role in ensuring citizens a
decent standard of living: with the exception of Germany, those declaredly on the left assign more
responsibility to the state than those on the political right.
• In Spain and Italy, even a sizeable majority of those identifying with the center and a smaller majority on the
right believe that the state should exercise this role.
Percentage responding: “Responsibility for ensuring that all citizens enjoy a decent standard of living should lie mainly
with the STATE” Base: all cases
Left (0- 4) Centre (5) Right (6-10)
100%
85%
80% 75%
73%
68% 69%
62% 61%
59% 58%
60%
51%
47% 46% 46%
43% 42% 42%
40% 35%
31%
20%
0%
Spain Other countries Italy France United Kingdom Germany
40RESPONSIBILITY OF THE STATE
• Ample consensus around the state taking on provision of classic welfare state functions like universal health
coverage and pensions, but lesser agreement (“quite a lot of responsibility”) around it curbing the operation
of market mechanisms with regard to prices, wages and company profits.
• Spaniards stand out in their stronger preference for the state to intervene in every area and facet.
Do you think the state should take a lot of, quite a lot of, not much or no responsibility for …? Base: all cases.
Spain Other countries
Providing health coverage to all
citizens 87% 11% 70% 24% 3%
Assuring a good enough pension
87% 11% 67% 27% 4%
for retired people
Controlling prices 40% 37% 14% 5%
60% 28% 9%
57% 31% 8% 32% 40% 18% 8%
Controlling wages
Controlling companies’ profits
49% 31% 14%3,40% 32% 33% 21% 11%
0% 20% 40% 60% 80% 100% 0% 20% 40% 60% 80% 100%
A lot Quite a Not None DK/NA
lot much at all
41RESPONSIBILITY OF THE STATE
• The preference for greater state intervention in market variables like prices, wages and profits is especially
marked in Spain, Italy and France. Respondents in the United Kingdom are far less keen, especially regarding
company profits, with Germans the second most reluctant for the state to impinge on such terrain.
Do you think the state should take a lot of, quite a lot of, not much or no responsibility for …?
Percentage answering a lot + quite a lot. Base: all cases
Providing health coverage to all citizens
Assuring a good enough pension for retired people
Controlling prices
Controlling wages
Controlling companies’ profits
98%98% 96%96%
100% 94%94% 94% 95%96% 94%95% 92%
88%88% 89% 89%
83%
80% 77% 79%
80%
72% 74%76%
65% 67%68%
63%
60%
60% 56%
49%
40%
20%
0%
Spain Other countries Italy France Germany United Kingdom
42DISTRIBUTION OF INCOME
• Citizens in four of the five countries analyzed accept that income should vary according to a person’s
qualifications, with agreement strongest in the United Kingdom, France and Germany.
• Spain is the outlier in this respect: opinions are split between the two options offered, with a slight edge for
those defending income equality irrespective of qualifications.
“Of the two statements I am going to read out, which comes closer to your opinion?” Base: all cases
Spain 49% 43% 8%
Income should be more evenly distributed,
Other countries even if it means that those who are more
29% 64% 7%
qualified earn about the same amount as
those who are less qualified
Italy 35% 55% 10%
Differences in income are necessary so
those who are more qualified earn more
Germany 29% 67% 4% than those who are less qualified
France 28% 67% 6% DK/NA
United Kingdom 24% 69% 7%
0% 20% 40% 60% 80% 100%
43DISTRIBUTION OF INCOME ACCORDING TO EDUCATION AND
POLITICAL ORIENTATION
• In Spain, income differentiation according to qualifications finds slightly more support among those with
university studies and, particularly, those positioning themselves on the right of the political spectrum. A
majority of those identifying as centrists favor an even distribution.
• In the other four countries, the preference for income differences extends to all segments, and increases with
educational level and as we move rightwards along the political spectrum.
“Of the two statements I am going to read out, which comes closer to your opinion?” Base: all cases
Spain Other countries
Total 49% 43% 8% 29% 64% 7%
Age finished studying
15 or under 49% 43% 8% 40% 52% 8%
16 to 19 53% 38% 9% 31% 62% 7%
20 or over 45% 47% 9% 28% 66% 6%
Declared ideology
Left (0 - 4) 52% 41% 7% 38% 57% 5%
Centre (5) 49% 43% 9% 28% 66% 6%
Right (6 - 10) 42% 52% 6% 28% 67% 5%
0% 20% 40% 60% 80% 100% 0% 20% 40% 60% 80% 100%
Income should be more evenly distributed, even if it means that those who are more qualified earn about the same amount as those who are less qualified
Differences in income are necessary so those who are more qualified earn more than those who are less qualified
DK/NA 44TAXATION VERSUS INEQUALITY
• Opinions are divided in almost every country regarding the ideal level of taxes to correct inequalities.
- A majority in France and the United Kingdom line up behind high taxation to reduce inequalities
- A majority of Italians state a preference for low taxation, even if it means not reducing inequalities
- Spaniards and Germans are divided between both alternatives.
“Of the two statements I am going to read out, which comes closer to your opinion?” Base: all cases
Spain 43% 40% 17%
It is better to have high
Other countries 40% 43% 17% taxation in order to reduce
inequalities
France 50% 33% 17%
It is better to have low
taxation even if that means
not reducing inequalities
United Kingdom 49% 38% 13%
DK/NA
Germany 42% 43% 15%
Italy 20% 57% 23%
0% 20% 40% 60% 80% 100%
45TAXATION VERSUS INEQUALITY ACCORDING TO POLITICAL
ORIENTATION AND INTEREST IN POLITICS
• Both in Spain and across the other four countries, on average, the preference for high taxation to reduce
inequalities is significantly greater among those declaredly on the left than those positioning themselves in
the centre or on the right. This option also finds wider support as a function of interest in political issues.
“Of the two statements I am going to read out, which comes closer to your opinion?” Base: all cases.
Spain Other countries
Total 43% 40% 17% 40% 43% 17%
Age finished studying
Left (0 - 4) 53% 32% 15% 55% 33% 12%
Centre (5) 38% 42% 20% 41% 44% 15%
Right (6 - 10) 38% 52% 10% 34% 52% 13%
Interest in politics
Low interest (0-4) 33% 46% 21% 33% 49% 18%
Medium interest (5) 39% 44% 17% 39% 44% 17%
High interest (6-10) 47% 40% 14% 54% 32% 15%
0% 20% 40% 60% 80% 100% 0% 20% 40% 60% 80% 100%
It is better to have high taxation in order to reduce inequalities
It is better to have low taxation even if that means not reducing inequalities
DK/NA
46NATIONAL IDENTIFICATION
• Citizens in the five European countries express a high degree of identification and pride of belonging with
regard to their respective nation-state and some of its symbolic manifestations.
“How much do you agree or disagree with the following statements?” Average on a scale from 0 to 10 where 0 means you
“completely disagree” and 10 means you “completely agree”. Base: all cases.
I feel identified with the When a team or sports person from
I’d rather have (NATIONALITY) (COUNTRY) is successful at
flag of (COUNTRY)
nationality than any other international sports events, I feel
proud of being (NATIONALITY)
7,7
7,3
Spain 7,8
7,5
7,3 7,5
Other countries
7,9
6,9 7,3
Germany
7,6 7,8
Italy 8,0
7,4 7,0 7,5
United Kingdom
France 7,1 7,3 7,1
0 2 4 6 8 10 0 2 4 6 8 10 0 2 4 6 8 10
47NATIONAL IDENTIFICATION
• Pride of belonging is extremely strong across all segments, reaching its highest levels, both in Spain and the
other countries, on average, among older age groups and those declaredly on the right and centre, but tendng
to decline with educational level.
“How much do you agree or disagree with the following statements?” Average on a scale from 0 to 10 where 0 means you
“completely disagree” and 10 means you “completely agree”. Base: all cases.
I’d rather have (NATIONALITY) nationality than any other
Spain Other countries
Total 7,7 7,5
Sex
Male 7,7 7,5
Female 7,8 7,6
Age
18-24 6,5 6,9
25-34 7,0 7,0
35-44 7,2 7,2
45-54 7,9 7,2
55-64 8,0 7,8
65 years old or over 8,5 8,3
Age finished studying
15 or under 8,5 8,2
16 to 19 7,5 7,7
20 or over 7,0 7,2
Declared ideology
Left (0 - 4) 6,8 7,0
Centre (5) 8,3 7,5
Right (6 - 10) 8,6 8,1
0 2 4 6 8 10 0 2 4 6 8 10 48NATIONAL IDENTIFICATION
• The strong identification observed with national flags accentuates as we ascend through the age groups and
also among those positioning themselves centre or right, and again diminishes with educational level.
• The left-right divide around identification with the national flag is especially marked in Spain.
“How much do you agree or disagree with the following statements?” Average on a scale from 0 to 10 where 0 means you
“completely disagree” and 10 means you “completely agree”. Base: all cases.
I feel identified with the flag of (COUNTRY)
Spain Other countries
Total 7,3 7,3
Sex
Male 7,1 7,3
Female 7,5 7,2
Age
18-24 6,2 6,8
25-34 6,5 6,7
35-44 6,8 7,1
45-54 7,3 7,1
55-64 7,3 7,4
65 years old or over 8,3 7,9
Age finished studying
15 or under 8,1 8,0
16 to 19 7,0 7,4
20 or over 6,6 6,9
Declared ideology
Left (0 - 4) 5,9 6,6
Centre (5) 8,1 7,3
Right (6 - 10) 8,6 7,9
0 2 4 6 8 10 0 2 4 6 8 10 49NATIONAL IDENTIFICATION
• Compared to ten years ago (BBVA Foundation European Mindset Study 2009), the high observed level of
national identification and pride of belonging has increased in France and, to a lesser extent, in Italy and
Spain. Though still high, it has nonetheless diminished slightly in the United Kingdom.
“How much do you agree or disagree with the following statements?” Average on a scale from 0 to 10 where 0 means you
“completely disagree” and 10 means you “completely agree”. Base: all cases.
I’d rather have (NATIONALITY) nationality than any other
United
Spain Germany Italy France Kingdom
BBVA FOUNDATION EUROPEAN MINDSET STUDY 2009 7.4 8.1 7.5 6.9 8.3
BBVA FOUNDATION EUROPEAN VALUES STUDY 2019 7.7 7.9 7.6 7.1 7.4
I feel identified with the flag of (COUNTRY)
United
Spain Germany Italy France Kingdom
BBVA FOUNDATION EUROPEAN MINDSET STUDY 2009 6.9 6.4 7.4 5.8 7.5
BBVA FOUNDATION EUROPEAN VALUES STUDY 2019 7.3 6.9 7.8 7.3 7.0
When a team or sportsperson from (COUNTRY) is successful at international sporting events, I feel proud to be NATIONALITY
United
Spain Germany Italy France Kingdom
BBVA FOUNDATION EUROPEAN MINDSET STUDY 2009 7.4 7.2 7.5 6.1 8.0
BBVA FOUNDATION EUROPEAN VALUES STUDY 2019 7.8 7.3 8.0 7.1 7.5
50IDENTIFICATION WITH DIFFERENT TERRITORIES
• Most citizens in the five European societies happily reconcile various territorial identities. Although
preferences lean slightly towards the areas closest to home and their daily lives (city and region), they also
identify strongly with their respective countries. Degree of identification with Europe is in the medium-high
interval (upwards of six points with the United Kingdom just a little behind the other countries average). The
French stand out for the strength of their identification with their country.
“People can identify with or feel part of different places. Can you tell me to what extent you identify with …?
Average on a scale from 0 to 10 where 0 means that you “do not identify at all” y 10 that you “identify strongly”. Base: all cases.
Your city (REGION) (COUNTRY) Europe
10,0
8,1 8,1
7,9 7,8
8,0 7,5 7,6
7,3 7,2 7,2 7,2 7,3 7,3
7,1 7,1 7,0 7,0 7,0
6,4 6,4
6,0 6,0 6,0 6,1
6,0 5,7
4,0
2,0
0,0
Spain Other countries Germany Italy United Kingdom France
51NATIONAL INTEGRATION FACTORS
• Europeans attach considerable importance to a common language in facilitating coexistence within a country.
This is most strongly felt in Germany, followed by Italy and France, with citizens in Spain and the United
Kingdom rather less convinced. The second placed factor is having the same customs and traditions, which finds
support among a wide majority of Italians and over half of Germans. A third believe it is important to have the
same ethnic origin – a majority in Italy and almost half in Germany, while a smaller percentage, with the
notable exception of Italy, see sharing a religion as of less weight.
• The Italians are those attaching most importance to homogeneity across all four aspects mentioned, followed
by the Germans. The British, conversely, exhibit perceptions proper to a multicultural society.
“To what extent do you believe the following factors are important for coexistence in (COUNTRY)?”
Percentage answering “very + quite important” Base: all cases.
Speak the same Have the same customs and Have the same Share the same religion
language traditions ethnic origin
Spain 62% 45% 27% 25%
Other countries 77% 48% 36% 28%
Germany 87% 54% 48% 31%
Italy 80% 69% 57% 52%
France 79% 38% 21% 17%
United Kingdom 60% 31% 16% 10%
52
0% 20% 40% 60% 80% 100% 0% 20% 40% 60% 80% 100% 0% 20% 40% 60% 80% 100% 0% 20% 40% 60% 80% 100%EU MEMBERSHIP
• A majority are of the opinion that belonging to the European Union has been good for their country.
• This feeling is especially strong in Spain – more than 15 points above the average of the other four
countries. The French, Germans and British see membership as “positive” or “very positive”. The
exception is Italy, where views are more evenly split between positive, negative and neutral, albeit
with the favourable position winning out.
“In general, would you say that (COUNTRY’S) membership of the European Union Difference TOTAL POSITIVE-
has so far been…?” Base: all cases TOTAL NEGATIVE
Spain 10% 53% 15% 14% 1%7% 48%
Other countries 8% 39% 25% 18% 5% 5% 25%
France 6% 48% 20% 19% 5%3% 31%
Germany 12% 39% 30% 13% 3%4% 36%
United Kingdom 11% 39% 19% 17% 8% 6% 24%
Italy 4% 31% 32% 22% 6% 5% 7%
0% 20% 40% 60% 80% 100% 0% 20% 40% 60% 80% 100%
Very positive Positive Neither positive nor negative (DON’T READ) Negative Very negative DK/NA
53PERCEPTION OF EU INSTITUTIONS
• The idea that “EU institutions are very distant from citizens” finds widespread support, and a majority are not
convinced that all member countries exercise an equal influence. Where respondents most differ is on
whether the EU’s economic policy benefits the citizens of their own country.
• The Germans stand out as having the most favourable views on the EU and its effects.
“How much do you agree or disagree with the following statements?” Average on a scale from 0 to 10 where 0 means you
“completely disagree” and 10 means you “completely agree”. Base: all cases.
European Union institutions All countries have the The European Union’s economic policy is
are very distant from citizens same influence in the good for the large majority of (COUNTRY’S)
European Union citizens
Spain 6,8 3,7 5,6
Other countries 6,7 3,8 5,3
France 6,8 3,0 4,8
Italy 6,7 3,7 4,8
Germany 6,6 4,9 6,0
United Kingdom 6,5 3,4 5,6
0 2 4 6 8 10 0 2 4 6 8 10 0 2 4 6 8 10 54THE UNITED KINGDOM’S EXIT FROM THE EU
• Asked about the United Kingdom’s prospective exit from the European Union, citizens perceive negative
fallout on various fronts. Chiefly: over 45% in every country (60% in the United Kingdom) believe it may lead
other countries to follow suit, and a large proportion are convinced that it will weaken the EU’s influence in
the world. They are also dubious as to whether Brexit will improve cooperation among the remaining member
countries or make the EU stronger overall. Between 21 and 36 percent see it as likely to weaken European
science and culture, especially in Germany and the UK itself.
“Facing a possible exit of the United Kingdom from the European Union, I would like you to tell me how much you agree
(strongly, quite strongly, not much or not at all) with the following statements”
Percentage agreeing “strongly + quite strongly” Base: all cases
Will lead to other countries also wanting to leave the European Union
Will weaken the European Union’s role in the world
Will weaken European science and culture
Will improve cooperation among the remaining member countries
Will make the European Union stronger
100%
80%
60%
60%
50% 49%
46% 45% 46% 46%48% 45%43%
42% 42%
40% 36% 34%
30% 31% 29%
26%24% 27% 25% 27% 26%
21% 21% 19%
20%
18%
14% 14%
11%
0%
Spain Other countries United Kingdom Italy Germany France 55What do Europeans think?
Negative view of how democracy is currently working in their respective countries (with the
Democracy exception of Germany)
Rule of law Ample agreement around the importance of the rule of law in safeguarding democracy
Recognition of the need for political parties coexists with reservations about mainstream parties
Democr
Political
(especially in France and Italy)
parties
acia
políticos
Regarded as necessarily responsible for provision of pensions and universal healthcare, and less so
The state in controlling variables central to the operation of markets (prices, wages, profits)
Democr Spain excepted, the preference is for differences in income reflective of educational level and
Income
acia personal qualifications
National High degree of national identification and pride of belonging. A shared language is seen as an
identification essential pillar in facilitating coexistence within each country
The balance of opinion is largely positive on EU membership, except in Italy, though EU institutions
The EU are widely regarded as being too distant from citizens.
56What do the Spanish think and want?
• Reservations about how well democracy is working, although sentiment has improved
somewhat since 2012
• Of the five survey countries, the one whose citizens identify most strongly with the political
left
• They are rather less critical towards the mainstream political parties
• Identification with the nation state and its symbols on a par with the other survey countries
• Most vehement in their demand for classic welfare state provisions and the first to advocate
greater state intervention in key areas of the market
• They believe income should be more evenly distributed, even if that means more and less
qualified people earn about the same
• The country most positive on EU membership.
57Trust in groups and institutions • Trust in professional groups • Trust in institutions • Perceptions of corruption • Perceptions of the law courts and media
INTERPERSONAL TRUST

• Interpersonal trust hovers around the mid-point on the scale in all survey countries, with some variation: the
  highest levels correspond to Germany and the United Kingdom, and the lowest to France.
• Spain, together with Italy, occupies an intermediate position. The least trusting segment is largest in Spain,
  followed by France and Italy.

  “On the whole, would you say most people can or cannot be trusted?” Average and distribution on a scale from 0 to 10, where 0 means
           that the majority of people “cannot be trusted at all” and 10 means that the majority of people “can be trusted completely”. Base: all cases.

                                                                                                                                                           59
CHANGING LEVELS OF INTERPERSONAL TRUST
• Interpersonal trust has risen slightly in Spain with respect to 2012 and 2009, and by 2019 had edged above the
mid-point on the scale. In Germany too, levels of interpersonal trust have augmented in the decade.
• In Italy, conversely, the level of trust accorded to “the majority of people” has steadily deteriorated.
“On the whole, would you say most people can or cannot be trusted?” Average on a scale from 0 to 10, where 0 means that the majority
of people “cannot be trusted at all” and 10 means that the majority of people “can be trusted completely”. Base: all cases.
5,2
Spain 4,7
4,9
6,2
Germany 6,0
5,7
5,8 European Values Study 2019
United Kingdom 5,6 Worldviews and Values 2012
5,6
European Mindset 2009
5,2
Italy 5,7
5,9
4,9
France 4,6
5,2
0 2 4 6 8 10
60TRUST IN PROFESSIONAL GROUPS
• Doctors, teachers, scientists and engineers, in that order, occupy the upper reaches of the professional trust
map, while politicians, bankers and religious personnel fall below the trust threshold, most notably in Spain.
“How much do you trust the following groups and persons?” Average on a scale from 0 to 10, where 0 means that “you do not trust them at
all” and 10 means that “you trust them completely”. Base: all cases.
Spain Other countries
Doctors 7,9 7,5
Teachers 7,5 7,0
Scientists 7,3 7,0
Engineers 6,9 6,8
Police officers 6,5 6,9
Environmentalists 6,1 6,2
Military personnel 5,7 6,7
Government employees 5,5 5,5
Judges 5,5 6,4
Businessmen/women 5,1 5,2
Journalists 5,0 4,9
Religious personnel 3,7 5,0
Bankers 3,4 4,5
Political leaders 3,2 3,8
0 2 4 6 8 10 0 2 4 6 8 10
61TRUST IN PROFESSIONAL GROUPS
• With the exception of politicians, professional groups related to the state obtain high levels of trust, with the
police occupying the top spot ahead of military personnel and judges.
• In contrast, citizens in every country, with the sole exception of Germany, express a strong distrust of political
leaders.
• Average trust in these groups in Spain trails the average of the other four countries, except in the case of
government employees.
“How much do you trust the following groups and persons?” Average on a scale from 0 to 10, where 0 means that “you do not trust them at
all” and 10 means that “you trust them completely”. Base: all cases.
Other United
Spain countries Germany Kingdom France Italy
Police officers 6.5 6.9 7.3 7.0 6.5 6.7
Military personnel 5.7 6.7 6.3 7.0 6.9 6.6
Judges 5.5 6.4 7.2 6.7 6.0 5.7
Government
5.5 5.5 5.4 5.3 5.8 5.3
employees
Political leaders 3.2 3.8 5.0 3.4 3.2 3.6
62You can also read