Democracy, Culture, and Contagion: Political Regimes and Countries Responsiveness to Covid-19* - Oxford Martin School
←
→
Page content transcription
If your browser does not render page correctly, please read the page content below
Democracy, Culture, and Contagion: Political
Regimes and Countries Responsiveness to Covid-19*
         Carl Benedikt Frey†, Chinchih Chen, and Giorgio Presidente

                      Oxford Martin School, Oxford University

                                         May 13, 2020

                                              Abstract
        A widely held belief is that autocratic governments have been more effective in reduc-
    ing the movement of people to curb the spread of Covid-19. Using the Oxford COVID-19
    Government Response Tracker (OxCGRT), and a real-time dataset with daily information
    on travel and movement across 111 countries, we find that autocratic regimes imposed
    more stringent lockdowns and relied more on contact tracing. However, we find no ev-
    idence that autocratic governments were more effective in reducing travel, and evidence
    to the contrary: countries with democratically accountable governments introduced less
    stringent lockdowns but were approximately 20% more effective in reducing geographic
    mobility at the same level of policy stringency. In addition, building on a large litera-
    ture on cross-cultural psychology, we show that for the same policy stringency, countries
    with more obedient and collectivist cultural traits experienced larger declines in geographic
    mobility relative to their more individualistic counterparts. We conclude that, in terms of
    reducing mobility, collectivist and democratic countries have implemented relatively ef-
    fective responses to Covid-19.

Keywords: Covid-19, Democracy, State Capacity, Culture, Policy
JEL: H11; H12; P48; Z1

* Freyand Presidente gratefully acknowledge funding from Citi.
†
 Corresponding author: carl.frey@oxfordmartin.ox.ac.uk

                                                  1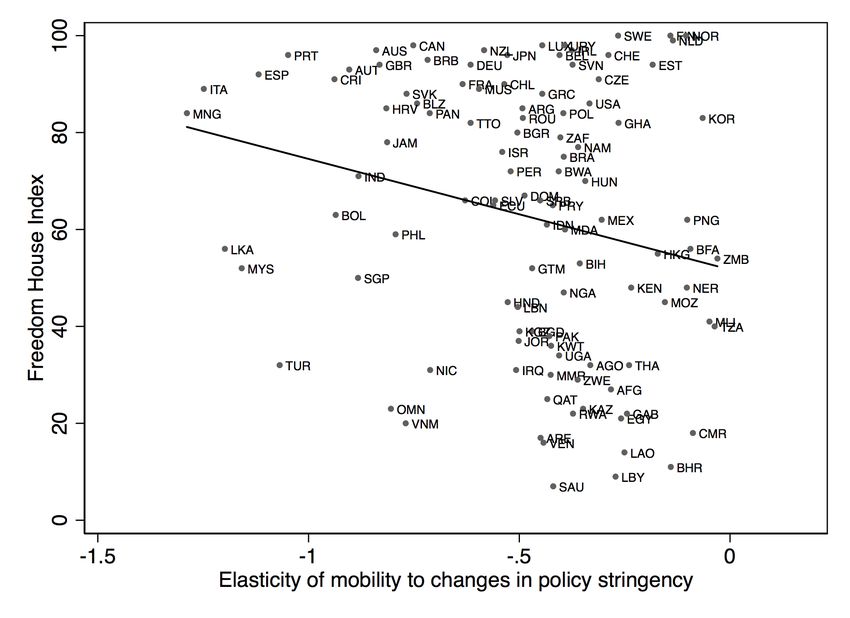
1 Introduction
The Covid-19 pandemic is unfolding at a time when democracy is in decline. Data from Free-
dom House (2020) shows that democracy has been in recession for over a decade, and the rate
at which countries have lost civil and political rights has accelerated since the 2000s (Diamond,
2019). A key concern is that Covid-19 will exacerbate the decline of democracy. As the New
York Times puts it, “China and some of its acolytes are pointing to Beijing’s success in coming
to grips with the coronavirus pandemic as a strong case for authoritarian rule” (Schmemann,
2020). Even the World Health Organization (WHO) has called its forceful lockdown “perhaps
the most ambitious, agile and aggressive disease containment in history” (Kuo, 2020). This
raises serious questions: have autocratic regimes generally been able to take more stringent
policy measures to restrain people from moving around spreading the virus, and have their
policies been more effective?
Governments around the world have introduced unprecedented measures to curb travel in
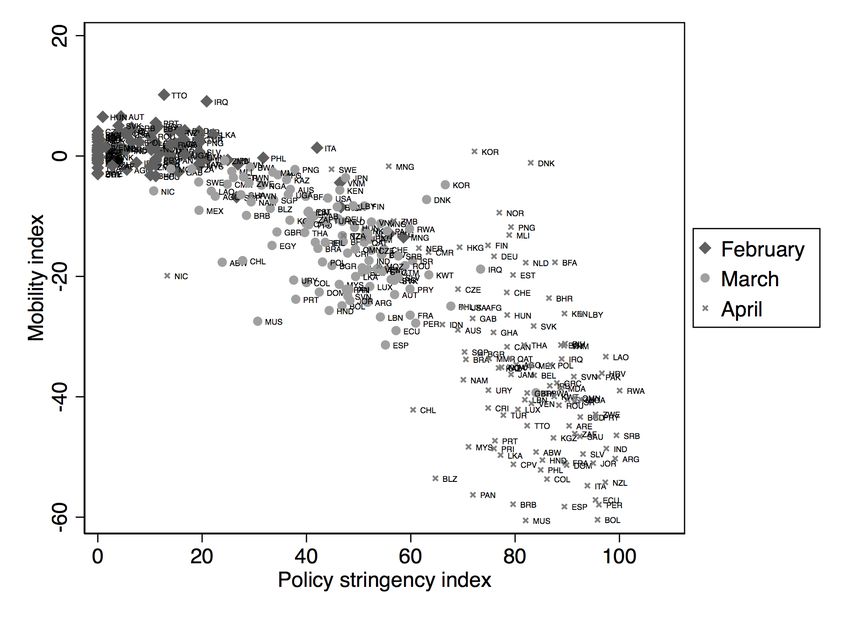
order to halt the spread of Covid-19. Figure 1 shows how travel fell in a number of selected
countries as time passed and more stringent policy measures were introduced. However, even
at similar levels of policy stringency, there is a wide variation in cross-country mobility. In this
paper, we examine the institutional and cultural underpinnings of this variation, tracing gov-
ernments responses to the Covid-19 pandemic at the national level. By exploiting a real-time
dataset with daily information on mobility trends and policy restrictions in 111 countries since
the beginning of the lockdown, we estimate the differential responses and their effectiveness in
democratic and authoritarian nation states.
We split the analysis in two stages. In the first stage, we regress an index of restrictions on
mobility on daily confirmed cases of Covid-19 and their interaction with a proxy for whether
a country is democratic.1 Exploiting time variation in policy and infections, we are able to
include country fixed effects and purge our estimates from country-specific characteristics po-
tentially affecting the spread of the virus and the policy response.2 We find that for a given
number of infections, our policy stringency index was 17 percent higher in autocratic regimes.3
Figure 1 here
The second stage of our analysis regresses changes in people’s mobility on policy strin-
gency and its interaction with proxies for democracy. Again, we include country fixed effects
that allows us to estimate the impact of institutions on the effectiveness of time-varying restric-
tions, while minimising the bias from country-specific characteristics. We find that although
1
Daily confirmed Covid-19 cases are assumed to be the main variable considered by policy makers when
deciding on mobility restrictions.
2
Given the daily frequency of our data and the relatively short time period under analysis, we deem it unlikely
that unobserved time-varying characteristics would bias the estimated coefficients.
3
The number refers to column 3 of Table 2 in Section 3.
2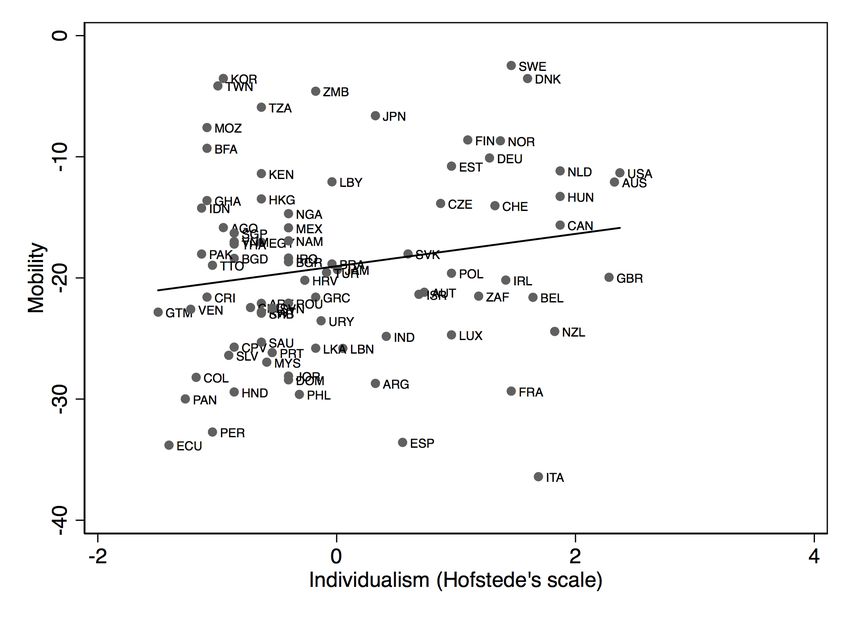
autocratic regimes tend to impose more stringent lockdowns, there is no evidence that they
were more effective in reducing travel. On the contrary, we find robust evidence that countries
with democratically accountable governments introduced less stringent lockdowns but experi-
enced approximately 20% larger declines in geographic mobility at the same level of policy
stringency. The positive correlation between an index of political and civil rights and our esti-
mated elasticities of mobility to policy restrictions is presented in Figure 2. In our regression
analysis, we find this relationship to be robust across a variety of specifications: in our baseline
specification we find that on average, a ten percent increase in policy stringency corresponds
to a 5% reduction in geographic mobility, while in countries with autocratic government, the
reduction is one percentage point lower.4 In other words, governments policy measures appear
to be less effective in autocratic countries.

                                                  Figure 2 here

     It is of course possible that the capacity of the state to enforce the lockdown matters more
than the political system in place. Indeed, a large literature emphasises the role the state’s abil-
ity to implement a range of policies in order to effectively respond to a crisis as well as driving
economic development (Besley and Persson, 2009; 2010; Fukuyama, 2011; 2015; Johnson and
Koyama, 2017; Migdal, 1988).5 To that end, we explore the role of state capacity, proxied by
the percentage of armed forces in the total labour force, in shaping the effectiveness of gov-
ernments responses to Covid-19. We find that at the same level of policy stringency, countries
with greater state capacity saw steeper reductions in geographic mobility. However, the nega-
tive correlation between autocracy and declining mobility remains statistically significant, also
when accounting for state capacity.
     Another complementary theory is that some cultures are more obedient than others, prompt-
ing people to better follow more stringent lockdown measures. For example, several studies
have documented that Western Europeans and their cultural descendants in North America and
Australia stand out as being particularly individualistic and independent, while revealing less
conformity, obedience, in-group loyalty (see Heine, 2007; Henrich et al., 2010; Henrich, 2017;
Schultz et al., 2019). Individualistic countries appear to have a dynamic advantage leading
to higher economic growth by giving social status rewards to non-conformism and innovation
(Gorodnichenko and Roland, 2011), and take out more patents for inventions (Gorodnichenko
and Roland, 2017).6 The flipside of an individualistic culture is that it can make collective
action more difficult (Gorodnichenko and Roland, 2015), such as mounting a coordinated re-
sponse to a pandemic. This hypothesis is supported by the positive correlation between the
   4
     The numbers refer to column 2 of Table 5 in Section 4.
   5
     For instance, several scholars, including Amsden (1989); Wade (1990); and Evans (1995), have attributed the
economic success of South Korea and Taiwan to state capacity.
   6
     The observation that the United States is especially individualistic is not new and dates at least as far back as
de Toqueville (1835).

                                                          3
widely used Hofstede’s (2001) scale, which we employ to measure the variation in individ-
ualism across countries, and the reduction in geographic mobility (Figure 3). Regression re-
sults show that at the same level of policy stringency, less individualistic countries experienced
sharper declines in mobility, and that the relationship remains robust also when adding a full
set of controls. We note that our findings are in line with research showing that individualistic
cultural traits are associated with negative attitudes towards government interventions (Pitlik
and Rode, 2017).
The remainder of this paper is structured as follows. Section 2 outlines the construction
of our dataset. In section 3, we discuss our empirical strategy and the determinants of policy
stringency. Section 4 describes our methodology and explores the elasticity of geographic
mobility to policy stringency. In section 4.2, we investigate the role of democratic institutions
and state capacity in shaping the effectiveness of governments policy responses. Section 4.3
explores the role of cultural traits in understanding patterns of geographic mobility. Finally, in
section 5, we outline our conclusions.
Figure 3 here
2 Data
We build a dataset allowing us to trace the daily spread of Covid-19 cases, government’s re-
sponse to the pandemic, and the movement of people across 111 countries over the entire
lockdown period to date. Data on movement and travel were collected from Google’s Commu-
nity Mobility Reports, and matched with information on policy restrictions, testing, and tracing
from the Oxford Covid-19 Government Response Tracker (OxCGRT) (Hale et al., 2020). Table
1 provides some summary statistics for the variables of interest in our analysis.
The Google Community Mobility Reports provide daily data on Google Maps users who
have opted-in to the ”location history” in their Google accounts settings across 132 countries.
The reports calculate changes in movement compared to a baseline, which is the median value
for the corresponding day of the week during the period between the 3rd of January and the
6th of February 2020. The purpose of travel has been assigned to one of the following cate-
gories: retail and recreation, groceries and pharmacies, parks, transit stations, workplaces, and
residential.
OxCGRT is a novel dataset which is published by the Blavatnik School of Government at
the University of Oxford. It contains various lockdown measures, such as school and work-
place closings, travel restrictions, bans on public gatherings, and stay-at-home requirements,
etc. These measures are complied into a stringency index, which is constantly updated to re-
flect daily changes in policy. This allows us to analyse policy changes as well as geographic
mobility patterns on a daily basis. Data on testing policy and contact tracing is also taken from
4OxCGRT.7
To measure democratic institutions, we collect data from two sources. Following BenY-
ishay and Betancourt (2014), who argue that democracy constitutes both civil and political
rights, we use the civil and political rights country score from Freedom in the World 2020,
compiled by Freedom House. The second variable is a dummy variable equal to 1 if a country
classified as authoritarian, taken from Dictatorship Countries Population 2020, compiled by the
World Population Review.8
To examine the role of culture, we employ the widely used individualism-collectivism mea-
sure from Hofstede’s (2001), which integrates questions about goals, achievement-orientation,
and family ties.9 One advantage with this measure is that it has been validated in a number of
studies.10 For robustness, we also create a novel measure of attitudes towards obedience and
conformity using data from the World Value Survey (WVS), which is based on face-to-face
interviews and uniformly structured questionnaires (Inglehart et al., 2014).11 Inspired by the
obedience and conformity dimensions highlighted by Schultz et al. (2019), we run a Principal
Component Analysis (PCA) to construct an “obedience index”.12 The drawback of compiling
the WVS variables into an index is that we lose observation if at least one of the subcompo-
nents is missing for a certain country. However, we believe that this measure better captures
the dimensions of obedience and conformity described by Schultz et al. (2019).
Table 1 here
3 Political Regimes and Covid-19 Policy
To assess whether authoritarian governments tend to implement more stringent mobility re-
strictions, we estimate OLS regressions of the following form:
h i
Φc,t = α0 + α1 Covidc,t + α2 Covidc,t × Dc + uc + ut + ηc,t (1)
7
See Hale et al. (2020) for more details on variable construction.
8
The countries classified as authoritarian are: Afghanistan , Algeria, Angola, Azerbaijan, Bahrain, Brunei,
Burundi, Cameroon, Chad, China, Cuba, Democratic Republic of Congo, Ethiopia, Gabon, Hong Kong, Iran,
Iraq, Kazakhstan, Laos, Libya, Macao, Mauritania, Nicaragua, Oman, Qatar, Russia, Rwanda, Saudi Arabia,
South Sudan,Sudan,Syria, Thailand,Turkey, Uganda, United Arab Emirates, Uzbekistan, Venezuela, Vietnam
9
A higher value on the scale corresponds to higher individualism.
10
For an overview, see Gorodnichenko and Roland (2017)
11
The variables are based on the percentage of respondents placing weight on the following values: obedience
(respondents say whether obedience is an important value to be taught to children); proper behaviour; family ties;
religiousness.
12
The PCA shows that the first component has an eigenvalue of 2.7 and explains 54% of the variation, and that
the second component has an eigenvalue of 0.97 and explains 20% of the variation. The first component has an
eigenvalue larger than 1 and it explains more than half of the common variation across the variables, justifying our
choice of using it as an obedience index.
5Specification (1) assumes that policy stringency Φc,t in country c and date t, depends on
the contemporaneous impact of Covid-19, Covidc,t . The variable Covidc,t is the log number
of daily confirmed cases of infection. This specification allows policy to vary between demo-
cratic and authoritarian countries, which is proxied by Dc .13 Because Φc,t varies by country and
date, (1) allows for the inclusion of country fixed effect, uc . Time fixed effects ut , purge the
estimates from the impact of confounders affecting all countries in the sample. Given the high
frequency of the data, most country-specific confounders are absorbed by the country fixed
effect. However, one possibility is that there are factors associated with economic develop-
ment and/or geography, which might be correlated with being a democracy, that also affects
policy stringency. This would lead to omitted variable bias in our regressions. To mitigate
such concerns, unless differently stated, all specifications control for the interaction between
the Covidc,t and the logarithm of real GDP per capita and a full set of geography dummies.
Building on the intuition that countries that were exposed to SARS or MERS have managed
Covid-19 more effectively, we also include a dummy for experience with these past epidemics.
In (1), the coefficient of interest is α2 , which measures the differential policy stringency in
response to the pandemic, in democracies relative to authoritarian countries. Because Dc varies
at the country level, we cluster standard errors accordingly.
3.1 Main Results
Our OLS estimates speak to the popular perception that authoritarian governments have mounted
stricter lockdowns and rely more on contact tracing to curb the spread of the Coronavirus.
Specifically, we find that when the number of confirmed Covid-19 infections doubles, policy
stringency increases by 7% in democratic countries. In authoritarian countries, a doubling of
cases is associated with an increase in stringency 17% higher than in democracies (column 3
of Table 2).14
Many commentators have noted that countries like Taiwan and South Korea might have
benefited from greater experience with past epidemics. However, on average, we find no statis-
tically significant differences in policy stringency in countries which have been more exposed to
epidemics in the past.15 Instead, countries that experienced SARS or MERS, were more likely
to implement more comprehensive testing policies (columns 2-3 of Table 2). For instance,
South Korea has implemented open public testing, such as “drive through” testing available to
asymptomatic people. This might explain why South Korea did not experience a larger drop in
mobility (Figure 1): strict restrictions on movement might have been unnecessary so far as it
13
Our baseline proxy for democracy is a continuous variable taking values between 0 and 100, with higher
values corresponding to stronger democratic institutions (see Section 2 for details). In some specifications, we use
a dummy variable Dc = 1 if a country is a democracy and 0 otherwise. Other than constituting a useful robustness
test, using such an alternative variable facilitates the interpretation of the coefficients.
14
Due to limited data availability, in Table 2 we lose 21 countries in column 2, and 17 countries in column 3.
15
We flag a country as having experience with past epidemics if they experienced more than fifty SARS or
MERS cases.
6managed to contain Covid-19 early on. Finally, we note that authoritarian countries were more
likely to implement contact tracing (column 5 og Table 2). While we are unable to disentan-
gle the precise factors driving these relationships, our findings speak to the general perception
that democracies with a stronger sense of liberal values and privacy have been more reluctant
engage in tracking the movement of people. Examples include the United States and France,
which did not implement large-scale contact tracing early on during the pandemic.
Table 2 here
Table 3 here
4 The Determinants of Geographic Mobility
In this section, we explore the effectiveness of the lockdown measures taken in reducing ge-
ographic mobility across countries. We begin by elucidating the relationship between policy
stringency and geographic mobility. We next proceed to examine whether autocratic regimes
have been more effective in reducing movement and travel (section 4.2). Finally, in section 4.3,
we explore how different cultural traits have shaped peoples compliance with the lockdown
measures taken by their governments.
Our analysis is based on the following specification:
h i
Mc,t,m = β0 + β1 Φc,t + β2 Φc,t × Xc + uc,m + ut + εc,t,m (2)
where, Mc,t,m is the mobility index in country c, date t and mobility category m. As dis-
cussed in Section 2, mobility indexes are provided for different mobility categories,
m = {workplace, grocery, transit, retail and entertainment, residential, park}
One concern might be that mobility in parks, for example, could be systematically higher
in countries with a larger number of parks, or a temperate climate. Thus, in (2) we include
country-mobility category fixed effects, uc,m , which allow to purge the estimates from constant
unobserved characteristics of each particular mobility category in a given country. In (2), the
coefficient of interest is β2 , which measures the differential impact of policy stringency for
countries characterised by each variable in Xc . Again, unless differently stated, all specifica-
tions control for the interaction between policy stringency and the logarithm of real GDP per
capita, a dummy for experience with epidemics, and our geographic controls.
7To construct Figure 2, we also estimate country-specific mobility elasticities to changes in
policy using the following linear model:
C
X h i
Mc,t,m = δ0 + δ1 Φc,t + δ2k Φc,t × uk
k=1
h i
+δ3 Φc,t × Xc + uc,m + ut + εc,t,m (3)
where, C is the total number of countries and uk = 1 when k = c. The elasticity of mobility
to changes in policy stringency for country c0 is given by:
dMc0 ,t,m
= δ1 + δ2c0 uc0
dΦc0 ,t
4.1 Main Results
By how much did geographic mobility decline as lockdown measures were introduced? On av-
erage across all countries in our sample, a ten percent increase in policy stringency is associated
with a 4.2% reduction in geographic mobility (column 1 of Table 4). To put these numbers in
perspective, from February to the end of April, policy stringency increased by 34% on average,
which corresponds to a reduction in mobility by roughly 14%.
To be sure, the average effects discussed above hide a great deal of heterogeneity, not least
since people move around for different purposes. In the United Kingdom, for example, people
are allowed to commute to work provided that the job cannot be done from home. The richness
of the Google Mobility Reports, which categorises all travel according to its purpose, allows us
to better distinguish between essential and non-essential activities. We deem mobility related
to ”grocery and pharma” as well as ”workplaces” to be essential travel.16 These categories can
be distinguished from mobility related to ”parks” and ”retail and recreation”, which captures
trends for places like restaurants, cafes, shopping centres, theme parks, museums, libraries, and
movie theatres. We label these activities as non-essential. Based on this distinction, we find
that while both essential and non-essential declined markedly in response to increases in policy
stringency, non-essential mobility was 15% more responsive (columns 2-3 of Table 4).17
Table 4 here
16
While we recognise that not all workplace travel might in fact be essential, most workplaces that are still open
will fall into the essential category.
17
In making the distinction between non-essential and essential travel, we exclude mobility categories “transit”
and “residential”, as they might capture both essential and non-essential travel. For instance, mobility in residential
places might simply capture people taking out their rubbish or collecting their mail.
84.2 Democracy and State Capacity
As noted, while authoritarian governments have introduced stricter lockdowns (Table 2), whether
they have been effective in reducing movement and travel remains an open question. To that
end, we turn to exploring the relationship between democracy and the ability of governments to
implement policy to reduce geographic mobility. The relationship is a priori unclear. As Gorod-
nichenko and Roland (2015) point out, ”one cannot claim that autocracy is more efficient than
democracy – or vice-versa – in dealing with pathogen prevalence.” For example, March and
Olsen (1984) and Fukuyama (2011; 2015) have emphasized the possibility of political gridlock
in democracy, while Olson (1982) has argued that interest groups can stifle democracies, espe-
cially as interest groups become powerful and organized over time. In the context of Covid-19,
it is possible that political divisions and strong business interests make it harder to introduce
stringent lockdowns in democracies. At the same time, Xue and Koyama (2019) find that polit-
ical repression reduces social capital, and Acemoglu et al. (2019) show that democracy causes
faster economic growth, through the provision of more public goods and lower levels of social
unrest, which might make restriction on movement and travel more acceptable.
Our findings show that while autocracies have taken more radical measures to reduce the
movement of people relative to democracies (Table 2), they have been less effective in imple-
menting them (Table 5). Specifically, restrictions on movement are roughly 20% less effective
in reducing geographic mobility in authoritarian countries on average (column 2 of Table 5).
Of course, one concern is that the relative effectiveness of democracies simply reflects greater
state capacity. Indeed, a large literature emphasises the role of state capacity in allowing gov-
ernments to implement their policies (Besley and Persson, 2009; 2010; Fukuyama, 2011; John-
son and Koyama, 2017; Migdal, 1988). Consistent with this literature, we find that the state’s
ability to enforce the lockdown matters. The correlation between enforcement, proxied by the
percentage of armed forces’ officials in the total labor force, and mobility declines, is negative
and strongly significantly (columns 1-4 of Table 5). At the same time, we find that a greater
ability to enforce the restrictions does not seem to matter for mobility related to groceries,
pharma and workplaces (columns 5-6 of 5 ). This speaks to the intuition that unlawful mobility
to parks and social gatherings are more likely to be sanctioned by law enforcement officials.
However, we note that even when accounting for state capacity, both our democracy vari-
ables remain strongly economically and statistically significant: greater protection of political
and civil rights is associated with larger reductions in geographic mobility, while our auto-
cratic regime dummy is associated with smaller mobility declines. Across all specifications,
the effects on non-essential travel are somewhat larger.
Table 5 here
94.3 Culture
In addition, different cultural traits may have shaped the effectiveness of governments lockdown
measures. While societies differ on many cultural dimensions (see Boyd and Richerson, 1988;
2005; Henrich, 2010; 2017), cross-cultural psychologists view the individualism-collectivism
distinction as the main divider (Heine, 2007; Schultz et al., 2019).18 Specifically, we build on
the intuition of Gorodnichenko and Roland (2015), who argue that collectivist countries are
more capable of solving collective action problems, such as mounting a coordinated response
to a pandemic.
Table 6 shows how cross-cultural differences are related to peoples compliance with their
government’s lockdown measures.19 As expected, and as shown in column 1, people in more
individualistic societies were less obedient to the lockdown, where movement fell by less at the
same policy stringency. This is especially true of non-essential travel, where the individualist
societies stand out. Reassuringly, when using our obedience index instead, we find that in more
obedient societies, mobility declined more significantly at a given level of policy stringency.20
Also in this case, the result holds in the full sample, but especially for non-essential travel.
Table 6 here
5 Conclusion
Democracies can get trapped in institutional arrangements that make problem-solving harder
(Fukuyama, 2011; 2015). Political divisions, checks and balances, and special interest groups
can cause gridlock (March and Olsen 1984; Olson, 1982), and limit democratic governments
ability to effectively respond to a crisis, like Covid-19. Yet so far, as noted by the New York
Times, “it is hard to draw up a conclusive balance sheet on the relative disease-fighting abilities
of autocracies and democracies” (Schmemann, 2020).
This paper constitutes a first partial assessment. Exploring governments policy responses
across 111 countries over the whole lockdown period up until the latest Google Mobility Re-
ports data release, we find that even though autocracies have introduced more stringent lock-
18
Cross-cultural differences have deep historical roots. For example, scholars have compared herders and farm-
ers, showing that the independence and mobility of herding make herding cultures more individualistic, whereas
farming cultures are more collectivistic (Nisbett et al., 2001). This is especially true of rice farming (Talhem et
al., 2014). Because rice paddies need standing water, people in rice regions needed to build elaborate irrigation
systems—a labour-intensive burden that fell on villages, not isolated individuals. And the legacies of rice farming
are continuing to affect people in the modern world. Even within China, Talhem et al. (2014) find that people in
rice regions have a more collectivist psychology today still, relative regions growing wheat.
19
In many cases, cultural values tend to be similar in countries characterised by geographical proximity (Hof-
stede, 2001). Therefore, in order to prevent geographical controls from absorbing the variation in cultural values,
which is our focus, we drop them in this part of the analysis.
20
Due to the data limitations involved in the construction of the obedience index (see Section 2), the number
of observations is lower in columns 2, 4 and 6. All results hold if we restrict the analysis to the same number of
observations in all columns. The table is available upon request.
10downs and use more contact tracing, democracies have seemingly been more effective in meet-
ing the policy objective of reducing geographic mobility in their countries. We also show that
state capacity to enforce the lockdown is associated with sharper declines in movement and
travel. That said, the negative correlation between autocracy and declining mobility remains
statistically significant, also when accounting for state capacity. This is in line with studies
showing that political repression reduces social capital and perceptions that support coopera-
tion (Xue and Koyama, 2019), while democracies provide more public goods and experience
less social unrest (Acemoglu et al., 2019), making people more likely to follow and support
government interventions in democratic societies. However, what drives this relationship is a
line of enquiry that deserves further attention.
Finally, building on a growing literature showing that individualistic societies—where con-
formity, obedience, in-group loyalty are perceived to be less important—tend to be more dy-
namic and innovative, we provide evidence that for a given level of policy stringency, more
conformist countries saw steeper declines in travel relative to their more individualistic counter-
parts. In other words, the flipside of the individualism that drives dynamism and inventiveness
is that it makes collective action harder, such as a collective coordinated response to a pan-
demic. Indeed, countries with more individualistic cultural traits have more negative attitudes
towards government interventions (Pitlik and Rode, 2017).
Our results lead us to conclude that collectivist and democratic countries have mounted
relatively effective responses to Covid-19 in terms of reducing geographic mobility. However,
cultural traits and the form of government in place are likely to be interrelated. For instance,
Gorodnichenko and Roland (2015) have shown that collectivist countries are more likely to
experience a transition towards autocracy while individualist countries are more likely to expe-
rience a transition towards democracy. Therefore, in light of our results, an interesting direc-
tion for future research is studying how compliance with mobility restrictions varies across the
individualism-collectivism spectrum in countries with similar institutional arrangements.
11References
[1] Acemoglu, D., Naidu, S., Restrepo, P., & Robinson, J. A. (2019). Democracy does cause
growth. Journal of Political Economy, 127(1), 47-100.
[2] Amsden, A. H. (1989). Asia’s next giant: South Korea and late industrialization. Oxford
University Press.
[3] BenYishay, A., & Betancourt, R. (2014). Unbundling democracy: Political rights and civil
liberties. Journal of Comparative Economics, 42(3), 552-568.
[4] Besley, T., & Persson, T. (2009). The origins of state capacity: Property rights, taxation,
and politics. American economic review, 99(4), 1218-44.
[5] Besley, T., & Persson, T. (2010). State capacity, conflict, and development. Econometrica,
78(1), 1-34.
[6] Boyd, R., & Richerson, P. J. (1988). Culture and the evolutionary process. University of
Chicago Press.
[7] Boyd, R., & Richerson, P. J. (2005). The origin and evolution of cultures. Oxford University
Press.
[8] Chua, R. Y., Huang, K. G., & Jin, M. (2019). Mapping cultural tightness and its links to
innovation, urbanization, and happiness across 31 provinces in China. Proceedings of the
National Academy of Sciences, 116(14), 6720-6725.
[9] Diamond, L. (2020). Ill Winds: Saving Democracy from Russian Rage, Chinese Ambition,
and American Complacency. Penguin Books.
[10] Evans, P. B. (1995). Embedded autonomy: States and industrial transformation. Princeton
University Press.
[11] Fendos, J. (2020). Lessons From South Korea’s COVID-19 Outbreak: The Good, Bad,
and Ugly. The Diplomant, March 10.
[12] Freedom House (2020). Democracy Index. https://freedomhouse.org/countries/freedom-
world/scores
[13] Fukuyama, F. (2011). The origins of political order: From prehuman times to the French
Revolution. Farrar, Straus and Giroux.
[14] Fukuyama, F. (2015). Political order and political decay: From the industrial revolution
to the globalization of democracy. Macmillan.
[15] Google LLC ”Google COVID-19 Community Mobility Reports.”
12[16] Gorodnichenko, Y., & Roland, G. (2011). Which dimensions of culture matter for long-
run growth?. American Economic Review, 101(3), 492-98.
[17] Gorodnichenko, Y., & Roland, G. (2015). Culture, institutions and democratization (No.
w21117). National Bureau of Economic Research.
[18] Gorodnichenko, Y., & Roland, G. (2015). Are there cultural obstacles to democratisation?.
VoxEU, May 14.
[19] Gorodnichenko, Y., & Roland, G. (2017). Culture, institutions, and the wealth of nations.
Review of Economics and Statistics, 99(3), 402-416.
[20] Hale, Thomas, Sam Webster, Anna Petherick, Toby Phillips, and Beatriz Kira (2020).
Oxford COVID-19 Government Response Tracker, Blavatnik School of Government. Data
use policy: Creative Commons Attribution CC BY standard.
[21] Heine, S. (2007). Cultural Psychology. New York: Norton
[22] Henrich, J. (2017). The secret of our success: how culture is driving human evolution,
domesticating our species, and making us smarter. Princeton University Press.
[23] Henrich, J., Heine, S. J., & Norenzayan, A. (2010). The weirdest people in the world?.
Behavioral and Brain Sciences, 33(2-3), 61-83.
[24] Hofstede, G. (2001). Culture’s consequences: Comparing values, behaviors, institutions
and organizations across nations. Sage Publications.
[25] Inglehart, R., Haerpfer, C., Moreno, A., Welzel, C., Kizilova, K., Diez-Medrano, J., ...
& Puranen, B. (2014). World values survey: Round six-country-pooled datafile version.
Madrid: JD Systems Institute, 12.
[26] Johnson, N. D., & Koyama, M. (2017). States and economic growth: Capacity and con-
straints. Explorations in Economic History, 64, 1-20.
[27] Kuo, L. (2020). How did China get to grips with its coronavirus outbreak?. The Guardian,
March 9.
[28] March, J. and Olsen, J.P. (1984). The new institutionalism: organizational factors in po-
litical life. The American Political Science Review, 78(3), 734-749.
[29] Migdal, J. S. (1988). Strong societies and weak states: state-society relations and state
capabilities in the Third World. Princeton University Press.
[30] Nisbett, R. E., Peng, K., Choi, I., & Norenzayan, A. (2001). Culture and systems of
thought: holistic versus analytic cognition. Psychological Review, 108(2), 291.
13[31] Olsen, M. (1982). The rise and decline of nations: economic growth, stagflation, and
social rigidities. Yale University Press.
[32] Pitlik, H., & Rode, M. (2017). Individualistic values, institutional trust, and interventionist
attitudes. Journal of Institutional Economics, 13(3), 575-598.
[33] Wade, R. (1990). Governing the market: Economic theory and the role of government in
East Asian industrialization. Princeton University Press.
[34] Schmemann, S. (2020) The Virus Comes for Democracy Strongmen think they know the
cure for Covid-19. Are they right?, New York Times, April 2.
[35] Schulz, J. F., Bahrami-Rad, D., Beauchamp, J. P., & Henrich, J. (2019). The Church,
intensive kinship, and global psychological variation. Science, 366(6466).
[36] Talhelm, T., Zhang, X., Oishi, S., Shimin, C., Duan, D., Lan, X., & Kitayama, S. (2014).
Large-scale psychological differences within China explained by rice versus wheat agricul-
ture. Science, 344(6184), 603-608.
[37] Tocqueville, A. D. (2000). Democracy in America. 1835. Trans. Harvey C. Mansfield and
Delba Winthrop. Chicago: University of Chicago Press.
[38] Xue, M. M., & Koyama, M. (2019). Autocratic rule and social capital: evidence from
imperial China. Working paper.
14Figure 1: Lockdown measures and cross-country reduction in mobility
This figure shows, for each country, the monthly average mobility index (vertical axis) and the policy stringency index (horizontal axis). See Section 2 for details on the variables used.
Sources: OxCGRT; Google Community Mobility Reports
15Figure 2: Cross-country elasticities of mobility to changes in policy stringency and democracy
The figure shows the Freedom House Index (vertical axis) and the estimate elasticity of mobility to policy restrictions. The elasticities are calculated by estimating model (3) in Section 4
with OLS. Sources: authors’ calculations based on OxCGRT, Google Community Mobility Reports and Freedom House
16Figure 3: Cultural values and cross-country reduction in mobility
The figure shows the average mobility index (vertical axis) and a country-level measure of individualism (Hofstede’s scale) on the horizontal axis. Sources: authors’ own calculations based
on Hofstede (2001); OxCGRT; Google’s COVID-19 Community Mobility Reports
17Table 1: Summary statistics
Mobility rates Country x Date Mean Std. Dev. 25% 50% 75%
Park 9375 -16.42 31.75 -38 -10 2
Retail and recreation 9459 -31.12 31.60 -61 -24 -1
Grocery & pharmacy 9424 -15.61 23.91 -30 -7 2
Workplaces 9477 -23.25 28.12 -48 -16 2
Transit 9426 -32.35 31.28 -60 -29 -2
Residential 9208 11.68 11.85 1 9 20
Policy Country x Date Mean Std. Dev. 25% 50% 75%
Policy stringency index 18540 33.86 35.92 0 15.47 71.57
Contact tracing 16619 .83 0.83 0 0 2
Testing policy 16791 0.99 0.85 0 0 2
Confirmed cases 11680 6750.74 43014.02 1 61 950
Confirmed deaths 11680 437.87 2944.25 0 1 18
Democracy, state capacity, culture N. of countries Mean Std. Dev. 25% 50% 75%
Civil and political rights (FH index) 210 56.70 30.64 29 61 86
Armed forces (%) 165 1.16 1.19 0.44 0.79 1.45
Individualism (std) 102 0 1 -0.86 -0.40 0.87
Obedience (PCA index) 54 0 1.61 -1.09 0.21 1.07
The notation “std” indicates that a variable has been standardised. Sources: Google Community Mobility Reports (coverage period 15/02/2020-26/04/2020); OxCGRT (coverage period
01/01/2020-03/05/2020); Freedom House; Hofstede (2001); World Bank.
Table 2: Determinants of policy stringency
(1) (2) (3)
Policy stringency Policy stringency Policy stringency
Log number of COVID-19 cases 0.0467*** 0.0900*** 0.0715***
[0.00910] [0.0137] [0.0147]
Cases × civil and political rights -0.000304***
[9.25e-05]
Cases × autocratic country 0.0142**
[0.00543]
Cases × experience with past epidemics -0.00863 -0.0114
[0.00810] [0.00786]
Observations 11,576 10,285 10,458
R-squared 0.869 0.890 0.886
Number of countries 150 129 133
Policy x controls no yes yes
Country FE yes yes yes
Time FE yes yes yes
The table presents OLS estimates from regressing the policy stringency index on the log number of COVID-19 infections (column 1). Column 2 includes an interaction between infections
and the Freedom House index, and infections and a dummy equal to 1 if a country has experienced more than fifty SARS or MERS cases. Column 3 replaces the Freedom House index with
a dummy equal to 1 if the World Population Review flags a country as a non-democracy. Columns 2 and 3 include as controls the interaction between infections and: i) log GDP per capita
(2018); ii) continent dummies, and iii) countries’ latitude. Errors are clustered at the country-level. The coefficients with ? ? ? are significant at the 1% level, with ? ? are significant at the
5% level, and with ? are significant at the 10% level.
18Table 3: Determinants of testing policy and contact tracing
(1) (2) (3) (4) (5) (6)
Testing Testing Testing Contact tracing Contact tracing Contact tracing
Log number of COVID-19 cases 0.0325 0.0326 0.0426 0.0317 0.00150 -0.0542
[0.0284] [0.0871] [0.0921] [0.0257] [0.0686] [0.0723]
Cases × civil and political rights 0.000205 -0.000937**
[0.000465] [0.000449]
Cases × autocratic country -0.000837 0.0407
[0.0262] [0.0363]
Cases × experience with past epidemics 0.0750*** 0.0756*** 0.00206 -0.00738
[0.0248] [0.0244] [0.0261] [0.0303]
Observations 10,046 9,089 9,206 9,819 8,956 9,080
R-squared 0.530 0.573 0.566 0.392 0.447 0.438
Number of countries 148 129 133 146 128 132
Policy x controls no yes yes no yes yes
Country FE yes yes yes yes yes yes
Time FE yes yes yes yes yes yes
The table presents OLS estimates from regressing indexes of testing policy (columns 1-3) and contact tracing (columns 4-5) on the log number of COVID-19 infections. Columns 2 and 5
include an interaction between infections and the Freedom House index, and infections and a dummy equal to 1 if a country has experienced more than fifty SARS or MERS cases. Columns
3 and 6 replace the Freedom House index with a dummy equal to 1 if the World Population Review flags a country as a non-democracy. Columns 2, 3, 5 and 6 include as controls the
interaction between infections and: i) log GDP per capita (2018); ii) continent dummies, and iii) countries’ latitude. Errors are clustered at the country-level. The coefficients with ? ? ? are
significant at the 1% level, with ? ? are significant at the 5% level, and with ? are significant at the 10% level.
Table 4: Elasticities of mobility to policy stringency
(1) (2) (3)
Mobility Non-essential Essential
Policy stringency -41.67*** -56.49*** -48.93***
[3.627] [5.335] [4.560]
Observations 47,466 15,838 15,836
R-squared 0.476 0.656 0.703
Number of country-mobility category cells 666 222 222
Country FE yes yes yes
Time FE yes yes yes
The table presents OLS estimates from regressing all mobility categories (column1), mobility to parks, retail and entertainment (column 2) and mobility in workplaces, grocery and
pharmacies (column 3) on the policy stringency index. Errors are clustered at the country-level. The coefficients with ? ? ? are significant at the 1% level, with ? ? are significant at the 5%
level, and with ? are significant at the 10% level.
Table 5: Elasticities of mobility to policy stringency: the role of democracy and state capacity
(1) (2) (3) (4) (5) (6)
Mobility Mobility Non-essential Non-essential Essential Essential
Policy stringency -34.02*** -48.15*** -53.85*** -73.58*** -39.53*** -54.61***
[11.37] [10.29] [18.68] [17.05] [14.08] [11.93]
Policy stringency × civil and political rights -0.265*** -0.370*** -0.289***
[0.0667] [0.0943] [0.0925]
Policy stringency × autocratic country 9.158** 12.77** 12.20*
[4.384] [5.924] [6.295]
Policy stringency × % armed forces -4.081** -3.633** -8.047*** -7.421** -2.704 -2.131
[1.663] [1.802] [2.617] [2.890] [2.509] [2.624]
Observations 43,804 43,804 14,610 14,610 14,608 14,608
R-squared 0.484 0.481 0.675 0.670 0.718 0.715
Number of country-mobility category cells 612 612 204 204 204 204
Policy x controls yes yes yes yes yes yes
Country FE yes yes yes yes yes yes
Time FE yes yes yes yes yes yes
The table presents OLS estimates from regressing all mobility categories (columns1-2), mobility to parks, retail and entertainment (column 3-4) and mobility in workplaces, grocery and
pharmacies (column 5-6) on the policy stringency index. Columns 1, 3 and 5 include an interaction between policy stringency index and the Freedom House index. Columns 2, 4 and 6
replace the Freedom House index with a dummy equal to 1 if the World Population Review flags a country as a non-democracy. All columns include the interaction between policy
stringency and: i) the percentage of armed forces officials as a percentage of the total labor force; ii) dummy for experience with epidemics; iv) continent dummies, and v) countries’ latitude.
Errors are clustered at the country-level. The coefficients with ? ? ? are significant at the 1% level, with ? ? are significant at the 5% level, and with ? are significant at the 10% level.
19Table 6: Elasticities of mobility to policy stringency: the role of cultural traits
(1) (2) (3) (4) (5) (6)
Mobility Mobility Non-essential Non-essential Essential Essential
Policy stringency -52.87*** -43.93*** -83.23*** -58.28** -54.93*** -53.23***
[11.18] [13.08] [17.61] [21.77] [13.47] [14.72]
Policy stringency × individualism 3.149* 7.970** 2.656
[1.884] [3.578] [1.901]
Policy stringency × obedience -3.684* -8.253** -3.105
[2.071] [3.481] [2.495]
Observations 34,856 18,538 11,620 6,180 11,618 6,178
R-squared 0.472 0.473 0.651 0.637 0.699 0.718
Number of country-mobility category cells 486 258 162 86 162 86
Policy x controls no yes yes yes yes yes
Country FE yes yes yes yes yes yes
Time FE yes yes yes yes yes yes
The table presents OLS estimates from regressing all mobility categories (columns1-2), mobility to parks, retail and entertainment (column 3-4) and mobility in workplaces, grocery and
pharmacies (column 5-6) on the policy stringency index. Columns 1, 3 and 5 include an interaction between policy stringency index and Hofstede’ scale. Columns 2, 4 and 6 replace
Hofstede’ scale with an index of obedience. The index of obedience is the first component of a Principal Component Analysis (PCA) based on World Value Survey (WVS) data (see Section
2 for details). All columns include as controls the interaction between policy stringency and i) log GDP per capita (2018), and ii) dummy for experience with epidemics. Errors are clustered
at the country-level. The coefficients with ? ? ? are significant at the 1% level, with ? ? are significant at the 5% level, and with ? are significant at the 10% level.
20You can also read