No. 1110 2020 - Banco de la República
←
→
Page content transcription
If your browser does not render page correctly, please read the page content below
Does Geographical Complexity of
 Colombian Financial Conglomerates
 Increase Banks’ Risk? The Role of
 Diversification, Regulatory Arbitrage
 and Funding Costs

 By: Pamela Cardozo
 Paola Morales-Acevedo
 Andrés Murcia
 Beatriz Pacheco
 No. 1110
 2020

Bogotá - Colombia - B ogotá - Bogotá - Colombia - Bogotá - Colombia - Bogotá - Colombia - Bogotá - Colombia - Bogotá - Colombia - Bogotá - Colombia
Does Geographical Complexity of Colombian Financial Conglomerates Increase Banks’
 Risk? The Role of Diversification, Regulatory Arbitrage and Funding Costs*

 ǂ
 Pamela Cardozo† Paola Morales-Acevedo‡ Andrés Murcia Beatriz Pacheco§
 pcardoor@banrep.gov.co amoralesacevedo@imf.org amurcipa@banrep.gov.co

 The opinions, statements, findings and interpretations contained in this document are the sole responsibility
 of the authors and do not represent the position of Banco de la República or its Board of Directors. All errors
 and omissions in this work are our responsibility.

 Abstract

 During the last decade Colombian international financial conglomerates (IFC)
 expanded abroad, significantly increasing their geographical complexity. This
 paper analyzes the effect of this change in geographical complexity on the risk
 level of individual Colombian banks. We use monthly bank-level data on
 financial indicators and complexity measures for the period 2007- 2018. We use
 the Z-score as a measure of bank risk and the number of countries in which a
 Colombian IFC has foreign banks subsidiaries as a measure of geographical
 complexity. Our results suggest that complexity is associated with higher levels
 of individual bank risk, as a result of an expansion to countries with large GDP
 co-movements and lower regulatory qualities. In addition, we find that banks
 with access to international funding respond differently to monetary policy
 changes. In particular, during periods of domestic monetary policy tightening
 (loosening), individual banks of complex IFCs present higher (lower) levels of
 risk, suggesting that the monetary policy risk taking channel is affected by the
 level of geographical complexity.

Keywords: bank risk, geographical complexity, monetary policy.
JEL codes: E52; F65; G21; G28; G32

__________________________________________________________________________________________________
* This paper is part of the project “Complexity in International Banking: Patterns and Implications for Risk” of
the International Banking Research Network (IBRN). This work was benefited by the comments and suggestions
made by Linda Goldberg; Claudia Buch; Bryan Hardy; Hernando Vargas and Cédric Tille.
** The authors are †Chief Officer for Monetary and International Investment Division at the Central Bank of
Colombia, ‡Financial Sector Expert at the Monetary and Capital Markets Department at the International
 ǂ
Monetary Fund and Director of the International Affairs Unit at the Central Bank of Colombia. §Beatriz
participated in this project when she was Advisor at the Financial Superintendence of Colombia. We are grateful
to Alejandra Rosado, Mónica Rodríguez, Andrés Amaya and Nicolas Jiménez for their research assistance.
Efecto de la Complejidad Geográfica de Conglomerados Financieros en el Riesgo
 Bancario: papel de la diversificación, el arbitraje regulatorio y los costos de fondeo*

 ǂ
 Pamela Cardozo† Paola Morales-Acevedo‡ Andrés Murcia Beatriz Pacheco§
 pcardoor@banrep.gov.co amoralesacevedo@imf.org amurcipa@banrep.gov.co

 Las opiniones, declaraciones, conclusiones e interpretaciones contenidas en el presente documento son
 responsabilidad de los autores y no representan la posición del Banco de la República ni de su Junta Directiva. Los
 errores y omisiones en este trabajo son responsabilidad de los autores.

 Resumen

 Durante la última década, los conglomerados financieros colombianos se han
 expandido internacionalmente aumentando significativamente su grado de
 complejidad geográfica. Aprovechando esta notoria expansión, este documento
 analiza el efecto de la complejidad geográfica de los Conglomerados Financieros
 Internacionales (CFI) en el nivel de riesgo de los bancos colombianos. Para el
 análisis, empleamos datos mensuales a nivel bancario sobre indicadores
 financieros y medidas de complejidad para el período 2007-2018. Utilizamos la
 métrica del Z-Score como una medida del riesgo bancario y el número de países
 en los que un CFI colombiano tiene filiales de bancos extranjeros como medida
 de complejidad geográfica. Nuestros resultados sugieren que una mayor
 complejidad geográfica está asociada con niveles más altos de riesgo bancario.
 Los canales por los cuales se da esta relación están asociados con unas altas
 correlaciones en el ciclo económico de los países a los cuales los CFI se
 expandieron, así como con menores niveles de calidad regulatoria en esos países.
 Además, encontramos que los bancos con acceso a fuentes internacionales
 responden de manera diferente a los cambios en la política monetaria. En
 particular, durante los períodos de endurecimiento (relajamiento) de la política
 monetaria interna, los bancos individuales de IFC más complejos presentan
 niveles de riesgo más altos (más bajos), lo que sugiere que el nivel de complejidad
 geográfica afecta el canal de toma de riesgos de la política monetaria.

Palabras clave: riesgo bancario, complejidad geográfica, política monetaria.
Códigos JEL : E52; F65; G21; G28; G32

__________________________________________________________________________________________________
* Este documento pertenece al Proyecto “Complexity in International Banking: Patterns and Implications for Risk” de
la International Banking Research Network (IBRN). Este trabajo se benefició de los comentarios y sugerencias de
Linda Goldberg; Claudia Buch; Bryan Hardy; Hernando Vargas y Cédric Tille.
** Los autores son †Subgerente Monetaria y de Inversiones Internacionales del Banco de la República, ‡Experta
en Sector Financiero del Departamento de Análisis Monetario y de Mercado de Capitales del Fondo Monetario
 ǂ
Internacional y Director de la Unidad de Asuntos Internacionales del Banco de la República. § Beatriz participó
en este Proyecto cuando era Asesora en la Superintendencia Financiera de Colombia. Se agradece la asistencia
de Alejandra Rosado, Mónica Rodríguez, Andrés Amaya y Nicolas Jiménez.

 2
1. Introduction

During the last decade Colombian financial conglomerates expanded abroad, significantly
increasing their degree of geographical complexity. In a short period, three financial
Colombian conglomerates became relevant players in the banking sectors of Panama, El
Salvador, Costa Rica, Guatemala, Honduras, and Nicaragua. They absorbed the operation
of local banks and of international subsidiaries of global groups, who left those countries
after the Global Financial Crisis (GFC), in response to tighter international regulation or
changes in internal business models.

 Despite the important expansion of international financial conglomerates (IFC), in
both advanced and emerging economies, there is scarce empirical research on the
relationship between geographical complexity and bank risk. The literature has analyzed
international and intra-national bank expansion, but results are mixed and in some sense
contradictory. Some papers find that higher geographical complexity and a higher share of
foreign subsidiaries increase banks’ riskiness (e.g, Krause et al., 2017), and that
geographically diversified Bank Holding Companies (BHCs) choose riskier loans (Demsetz
and Strahan; 1997). Others find that bank risk falls as BHCs expand geographically,
suggesting evidence of diversification gains through higher complexity (e.g. Goetz et al.
(2016), Levine et al. (2015) and Faia et al. (2017)).

 Colombia provides the right setting to study the relationship between complexity
and bank risk, considering the notorious increase in geographical complexity. This paper
addresses the following two questions: i) Does geographical complexity of IFCs have an
effect on the level of risk of individual banks? ii) Does geographical complexity affect the
sensitivity of bank risk to changes in domestic monetary policy? Answering them sheds
light on the effects that complexity has on bank riskiness, helping policy makers to
determine whether further regulations on IFC is needed.

 The paper also attempts to identify the channels through which geographical
complexity affects individual bank risk, focusing on the main channels highlighted by the
literature. The first one is associated with higher asset diversification by means of an
expansion into locations that have a low correlation with their business cycles (Goetz et al.,
2016; Faia et al., 2017). The second one relates to the presence of regulatory arbitrage, by
which BHCs expand towards countries with less strict regulation (Faia et al., 2017). The third
one refers to gains in terms of lower funding costs, since the expansion of IFC allows
managing liquidity on a global scale (Cetorelli et at., 2016).

 3
We use monthly bank-level data on financial indicators and complexity measures
for the period 2007-2018. The z-score is used as our measure of bank risk, in line with recent
literature in banking (e.g. Altunbas et al., 2018, Krause et al., 2017). This variable is regressed
on a measure of geographical complexity, defined as the number of the countries in which
a Colombian IFC has foreign bank subsidiaries, together with a set of bank characteristics.
Bank and time fixed effects are included to control for unobserved heterogeneity at a bank
and time level.

 Our results suggest that complexity is associated with higher levels of individual
bank risk. In terms of the channels through which geographical complexity affects bank risk,
we find that IFCs expanded to regions with highly correlated business cycles, suggesting
that diversification gains were not significant. On the contrary, a large and positive
correlation seems to increase the levels of individual bank risk. We also find that some IFCs
exploited possible regulatory arbitrage opportunities by expanding the operations to
countries with less strict regulations. Funding costs turned out to be another relevant
transmission mechanism, showing that more complex entities reduced bank risk through
lower funding costs and higher availability of resources. Reinforcing the funding cost
mechanism, we also find that the duration of monetary policy cycles affects complex
banking institutions differently. In particular we find the risk levels of complex institutions
are especially affected by prolonged periods of monetary policy tightening, suggesting that
the monetary policy risk taking channel depends on the level of geographical complexity.
Our results survive a battery of controls and robustness tests.

 This paper is divided in eight sections including this introduction. In the second, we
present some related literature; in the third section we refer to the expansion of Colombian
financial conglomerates in the region. In the next three sections we present the description
of the data, the empirical strategy, and the main results, respectively. In the seventh section,
we present some robustness checks and in the eight section, we conclude.

 2. Literature Review

 Both economic theory and empirical evidence provide conflicting views on the
relation between geographic complexity and bank risk. The theoretical views, portfolio
theory, predicts that geographic expansion could reduce bank risk if this process is
accompanied by the inclusion of assets which are imperfectly correlated with existing assets
(Diamond, 1984; Boyd and Prescott, 1986). On the other hand, the literature grounded on
agency-based models suggests that banks could decide to expand geographically to gain

 4
private benefits, probably ignoring the increase in individual bank risk. Agency costs tend
to increase through higher monitoring costs affecting the incentives of the banks, and,
consequently their risk profiles (Berger and Ofek, 1996; Servaes, 1996). Associated costs of
monitoring an international group tend to be higher, and thus it is natural to expect that
processes of geographical expansions of banks could be accompanied by some deterioration
in their asset quality (Brickley et al., 2003; Berger et al. 2005) and some increases in their
funding costs (Jensen (1986), Jensen and Meckling (1976), and Scharfstein and Stein (2000)).

 In the empirical arena, Demsetz and Strahan (1997), Chong (1991), Acharya et al.
(2006), and Krause et al. (2017) find that geographically diversified bank holding companies
become riskier through less capital and riskier loans. In contrast, Goetz et al. (2016), Levine
et al. (2015); Faia et al. (2017), Akhigbe and Whyte (2003), and Deng and Elyasiani (2008)
find that bank risk falls as BHCs expand geographically suggesting the presence of
diversification gains through higher complexity. The mixed and contradictory results in the
empirical literature is even more surprising considering that many papers have focused on
the case of United States. This might be due to different metrics for bank risk and
geographical complexity, and identification strategies.

 Krause et al. (2017) use alternative variables to measure bank complexity to explain
the stability of bank's Z-score and the probability of requiring state aid between 2008 and
2014 for a set of countries. 1 The authors find that a greater geographical complexity and an
increase in the proportion of foreign affiliates are associated with an increase in bank risk
and with a higher probability of requesting state aid. Additionally, a greater proportion of
non-banking subsidiaries significantly reduces the possibility of requesting state aid,
suggesting that the effects of a geographical expansion process differ depending on the type
of foreign subsidiaries.

 In the same vein, Acharya et al. (2006) use some other measures of risk (doubtful and
nonperforming loans/assets (DOUBT), the standard deviation of DOUBT, the ratio of loan
loss provisions to assets, the monthly stock return volatility) and geographical
diversification measures (based on Hirschman Herfindahl type of indexes) for the Italian
bank industry in the nineties to show that a higher diversification is not always an optimal
strategy for a bank. The study focuses on two empirical relationships: the one between bank
returns and risk and the degree of bank diversification; and the other that analyses how the
entry of banks via lending into new sectors could affect their risk profile. They find that

 1 Austria, Belgium, Germany, Cyprus, Spain, Finland, France, Greece, Ireland, Italy, Malta, Netherlands,
Portugal, Slovenia and Slovakia.

 5
when a bank expands into industries with a high degree of competition or a lack of prior
lending, some losses by diversification could surge. These losses are transmitted through
the worsening of credit quality and therefore a reduction in bank returns. Their results
suggest that diversification could reduce bank returns while producing riskier loans for
high-risk banks, and that diversification for low-risk banks tends to cause an inefficient risk-
return trade-off.

 Goetz, Laeven and Levine (2016) is one of the papers that find that a higher
geographical complexity tends to decrease bank risk. They study the United States case and
obtain that geographic expansion reduces the risk when the bank holding company expands
towards metropolitan areas with asynchronous economic cycles. Another paper in the same
line is Levine et al. (2015). They find that in the United States geographic expansion can
reduce funding costs. The authors identify that the reduction of funding costs is higher in
banks headquartered in states with lower macroeconomic covariance with the overall
economy. The correlation of the business cycle appears as a key factor to explain how
banking complexity affects bank risk.

 Other papers have highlighted the role of funding costs as a key channel to
understand the link between bank risk and geographical complexity. For instance, Cetorelli
and Goldberg (2012) show that U.S. global banks can smooth the effects of a tighter
monetary policy rate on their lending rate by drawing on subsidiary resources. For Asia,
Lee and Bowdler (2019) find a strong evidence of the hampering of monetary policy
transmission to loans interest rates through bank internationalization, and weaker evidence
of hampering in transmission to lending quantities. Some recent contributions on the bank
risk taking literature (in the spirit of Borio and Zhu (2012)) have reported that the duration
of monetary cycles affects the risk levels of banks and firms. For example, Cecchetti et.al
(2018) find that the leverage ratio and other measures of firm level vulnerability increase for
banks and non-banks as domestic monetary policy easing periods persists. They find similar
results on foreign financial sector firms when the U.S. eases policy. Their results are
consistent with the suggestion that lower funding costs reduce agency problems, prompting
banks to shift into riskier assets.

 Faia et al. (2017) also find a negative correlation between the foreign expansion of
banks and their risk. The authors analyze European G-SIBs. Based on individual risk
measures (e.g. CDS spreads, bank provisions, standard deviation of profitability and the Z-
Score) and systemic risk measures (conditional capital short-fall, long-run marginal
expected shortfall, ∆CoVaR computed using either CDS prices or equity prices), the authors

 6
conclude that geographical diversification reduce individual and systemic risks. They find
some evidence that expansion to countries with looser regulations affects bank's risk.

 In summary, despite the presence of mixed results, the literature highlights mainly
three channels through which geographical complexity might affect individual bank risk.
The first one is associated with gains in terms of asset diversification by means of an
expansion into locations that have a low correlation with their business cycles (Goetz et al.,
2016; Faia et al., 2017). The second one relates to the presence of regulatory arbitrage, by
which BHCs expand towards countries with less strict regulation (Faia et al., 2017). The third
one refers to gains in terms of lower funding costs since the expansion of IFC allows
managing liquidity on a global scale (Cetorelli et at., 2016).

 3. Geographic Complexity in Colombia

During the last decade, Colombian financial conglomerates expanded abroad, mainly to
Central America, significantly increasing their geographical complexity. In 2006 these
conglomerates had 29 foreign subordinates, with assets of USD 4 billion. By 2018, the
number of foreign subordinates had risen to 220, with assets of USD 91 billion (Figure 1).
These changes highlight the importance of the major geographical complexity over the last
years. In contrast, the number of Colombian financial conglomerates´ entities located in
Colombia changed -1,85% during 2014-2018 (162 to 159).

 Panama is the main location of foreign subordinates for the Colombian financial
conglomerates, with 54 entities and a share of 27% of the total number of foreign
subordinates. Panama is followed by other countries in Central America, i.e. El Salvador,
Guatemala and Costa Rica, with an average of 24 entities. With smaller participations stand
Mexico, Chile and Peru, with an average number of 13 entities (Figure 2).2

 2 Others refer to those countries with less than 10 foreign subordinates.

 7
Figure 1. Foreign subordinates of Colombian financial conglomerates 2006 - 2018

 • 231 subordinates • 220 subordinates
 • 230 subordinates • Assets US$91,463 • Assets US$91,222
 • Assets US$78,839
 • 208 subordinates 2018
 2017
 2016
 • Assets US$59,153 2015
 2014
 • 160 subordinates 2013 • 233 subordinates
 • Assets US $36,904 2012 • 213 subordinates • Assets US$87,070
 2011 • Assets US$70,638
 • 163 subordinates
 • 46 subordinates 2010
 • Assets US$41,265
 • Assets US$11,203 2009 • 120 subordinates
 • Assets US$25,824
 2008
 • 35 subordinates • 42 subordinates
 • Assets US$10,400
 2007 • Assets US$11,170

 2006
 • 29 subordinates
 • Assets US$3,861
 Source: Financial Superintendency of Colombia. Assets correspond to the addition of individual entities’ assets and
 expressed in USD million. Figures in 2018 until sep-18.

 Figure 2. Number of entities located abroad by country
 65
 55
 45
 35
 25
 15
 5
 jun-15

 jun-16

 jun-17
 jun-14

 dic-14

 dic-15

 dic-16

 dic-17
 mar-14

 mar-15

 mar-17

 mar-18
 mar-16
 sep-15

 sep-16

 sep-17
 sep-14

 PANAMA EL SALVADOR GUATEMALA COSTA RICA
 MEXICO CHILE PERU OTHERS*
 Source: Financial Superintendency of Colombia.

 The expansion of Colombian financial conglomerates abroad began with the non-
financial sector and it was rapidly followed by financial entities in order to meet their
funding needs (Figure 3). In March 2018, banks represented 36% of the financial entities
located abroad.

 8
Figure 3. Number of entities located abroad by sector

 120

 115

 110

 105

 100 FINANCIAL
 NON-FINANCIAL
 95

 90
 jun-15

 jun-16

 jun-17
 jun-14

 dic-14

 dic-15

 dic-16

 dic-17
 sep-14

 sep-15

 sep-16

 sep-17
 mar-14

 mar-15

 mar-16

 mar-17

 mar-18
 Source: Financial Superintendency of Colombia.

 The expansion of Colombian banks abroad is mainly concentrated in Central
America (92% of assets abroad in banks) and South America (4%), in countries where
Spanish is the official language (as in Colombia). The vast expansion started in 2007 with
Bancolombia, the biggest bank in the country, buying Bancoagricola in El Salvador (Figure
4)3. It continued with the purchase of BAC Credomatic by Banco de Bogotá (the second
largest bank in Colombia) at the end of 2010. 4 Between 2012 and 2013 Colombian banks
bought HSBC’s operations in Central and South America. Davivienda, the third largest bank
in Colombia, took HSBC´s operations in Central America (excluding Panama). Banco de
Bogotá purchased Grupo Reformador in Guatemala and BBVA in Panama. Bancolombia
bought 40% of Agromercantil Group, and an additional 20% in 2015.

 3 The top three positions in the ranking by assets of Colombian banks remained unchanged for at least
the last 10 years.
 4 BAC Credomatic was a Central American financial conglomerate.

 9
Figure 4. Main foreign acquisitions by Colombian banks since 2007

 ACQUIRING DATE ACQUISITION COUNTRY PRICE (USD MILLION)
 BANCOLOMBIA jun-07 Banagrícola Salvador 900
 oct-13 HSBC Panama Panama 2233
 oct-13 Agromercantil* Guatemala 256
 BANCO DE BOGOTÁ dec-10 Bac Credomatic Central America 1920
 jun-13 Grupo Financiero Reformador Guatemala 411
 dec-13 BBVA Panama 490
 DAVIVIENDA nov-12 HSBC Central America (without Panama) 801
 GNB SUDAMERIS oct-13 HSBC Peru 165
 oct-13 HSBC Paraguay 50
 *USD 216 million in 2013 and USD 40 million in 2015.
 Source: Financial Superintendency of Colombia.

 Several reasons might explain this wave of expansion. First, it went hand in hand
with the dynamics of foreign direct investment by Colombian businesses in Central
America.5 Second, Colombia was experiencing high economic growth rates6, and Colombian
banks had access to funding in the external markets. Third, Colombian banks wanted to
diversify markets in order to find potential for growth. Central America was appealing
because its banking industry was less developed than in Colombia. With these motivations
and funding, Colombian banks bought large local banks in Central America in order to
become important players. The desire of Colombian banks to expand into Spanish speaking
countries with high Colombian foreign investment coincided with the retrenchment of
European banks, who divested their small businesses to cut costs, raise funds, and offset the
impact of a prolonged economic decline in Europe.7 The expansion also shows some
herding behaviour: the biggest Colombian bank moving first, then the second, then the third
largest.

 In March 2018 the assets of foreign banks were 25% of the total assets of banking
entities within Colombian financial conglomerates. Nowadays, Colombian banks are big
players in the banking sector of Panama, El Salvador, Costa Rica, Guatemala, Honduras,
and Nicaragua (Figure 5).

5 From 2002 to 2013 the stock of Colombian foreign direct investment in Central America, excluding banks´
investments, grew on average 20% yearly.
6 The GDP in Colombia expanded 6,9% yoy in 2007, following a growth of 6,7% yoy in 2006.

7 In 2009, BBVA Panama had to restrict its operations to only serve residents in Panama, given that Panama

was considered as an offshore financial center for the OECD and that Spain considered it a tax heaven.

 10
Figure 5. Share of Colombian Ownership in the Banking System by Geographical
 Location
 GEOGRAPHICAL ASSETS OF FOREIGN ASSETS OF THE SHARE IN THE
 LOCATION BANKING SUBORDINATES BANKING SYSTEM BANKING SYSTEM
 PANAMA 28,654 118,151 24%
 EL SALVADOR 9,346 17,554 53%
 COSTA RICA 8,957 17,913 50%
 GUATEMALA 6,654 41,315 16%
 HONDURAS 3,613 22,297 16%
 NICARAGUA 1,617 7,346 22%
 PERU 1,711 110,416 2%
 PARAGUAY 1,033 20,752 5%
 Source: Financial Superintendency of Colombia. Assets corresponds to the addition of individual entities’
 assets and expressed in USD million. Data as of end of September 2018.

 4. Empirical Analysis

Our empirical analysis is divided in two parts. In the first part, we analyze how geographical
complexity of domestic financial conglomerates affects the risk of local banks, and explore
the channels that explain this relationship. In the second part, we examine if bank risk is
affected by the interaction between geographical complexity and changes in monetary
policy.

4.1 Does geographical complexity of IFCs have an effect on the level of risk of individual banks?

 As mentioned, the literature has found contradictory results with respect to the effect
that geographical complexity has on bank risk. Therefore, we examine what is the effect in
the Colombian case by estimating the following equation:

- ( ) = 0 + 1 _ + ℎ −1 + + + (1)

 where − ( ) denotes the inverse of natural logarithm of the Z-Score8 for local bank
 in month . We use the z-score as the risk measure, following Altunbas, Binici and
Gambacorta (2018) and other recent papers in the literature. Under this definition, variables
with a positive coefficient increase bank risk. As a measure of geographical complexity we
use _ , which denotes the number of countries in which the financial
conglomerate of local bank has foreign bank subsidiaries. A positive (negative) coefficient

8 The Z-Score is defined as: −̂ ̅̅̅̅̅̅+

 = . As the z-score is highly skewed, we use the natural
 ( )
logarithm of the Z-Score.

 11
 1 would indicate that a larger degree of geographical complexity decreases (increases) the
distance to default, or in other words, increases (decreases) bank risk. We also include a set
of lagged bank characteristics as controls that include bank size (measured by the natural
logarithm of total assets), the deposits to assets ratio and the loan to assets ratio. In addition,
we include different combinations of time and bank fixed effects to control for any observed
or unobserved heterogeneity at a time and bank level.9

 We then proceed to analyze which channels explain the relationship between
geographical complexity and bank risk. We do so by analyzing the channels highlighted by
the literature: assets diversification, regulatory quality and funding costs.

4.1.1 Diversification

 The idea behind the diversification channel is that by expanding into locations with low
GDP co-movement, conglomerates might be able to reduce risk (Goetz et al., 2016; Faia et
al., 2017). On the other hand, expanding to locations with high business cycle co-movement
might exacerbate common risk exposures. To examine the relevance of this channel, we
estimate the following model.

 ( ) = 0 + 1 _ + 2 _ ∗
 + 3 + ℎ + + + (2)

where the coefficient 2 indicates if the degree of diversification contributes to explain the
relationship between geographical complexity and bank risk.

4.1.2 Regulatory Arbitrage

 The regulatory arbitrage channel refers to the tendency of banks to expand towards
countries with less strict regulation, which can lead to an increase in risk. To examine the
role of regulatory environments in explaining the negative impact of geographical
expansion on bank risk we include an interaction term with a measure of regulatory quality,
as follows:

− ( ) = 0 + 1 _ + 2 _ ∗
 + 3 + ℎ + + + (3)

9 Throughout the paper, the reported standard errors are heteroskedasticity robust and adjusted for clustering

at a bank level.

 12
where the coefficient 2 indicates if regulatory quality in destination countries contributes
to explain the relationship between geographical complexity and bank risk.

4.1.3 Funding Costs

 The funding cost channel refers to the presence of gains in terms of lower funding costs
for geographically complex financial conglomerates. Since the expansion of IFC allows
managing liquidity on a global scale, funds are allocated across offices in different
geographic locations based on relative needs (Cetorelli and Goldberg, 2011, 2012a, 2012b).
At the same time, complex IFC might have more access to external capital markets. To
analyze the relevance of this channel in explaining the relationship between geographical
complexity and bank risk, we include an interaction term between geographical complexity
and the natural logarithm of the foreign indebtedness of bank in time .

− ( ) = 0 + 1 _ + 2 _ ∗ ln( )
 + 3 ln( ) + ℎ + +
 + (4)

4.2 Does geographical complexity affect the sensitivity of bank risk to changes in domestic monetary
policy?

 To answer this question, we start by examining the effects of a quarterly change in
the domestic monetary policy rate by estimating the following model:

 − ( ) = 0 + 1 + 2 ∗ ∆ −3 + 3 ∆ −3
 + ℎ + + (5)

 In addition, we analyze if prolonged monetary policy easing has an effect on bank
risk. We follow the approach of Cecchetti et al. (2017) by adding interactions with a measure
of the duration of monetary policy easing.

 − ( ) = 0 + 1 _ + 2 _ ∗ ∆ −1 + 3 ∆ −1
 + 4 _ ∗ −1 + 5 −1
 + ℎ + + (6)

 13
 is defined in two different ways: 1) as the number of consecutive quarters
of interest rates cuts based on the nominal short-term rate (equation (7)), and 2) as the extend
of consecutive drops (equation (8))10.

 1
 1 = { −1 + 1 < −1 (7)
 0 ℎ

 1
 ℎ MAt = 8 ∑8τ=1 it−τ+1

 2 | − −1 | < −1
 2 = { −1 + (8)
 0 ℎ

5 Data and Descriptive Statistics

This paper uses mainly two datasets. The first one contains monthly banks’ financial
statements collected by the Superintendencia Financiera de Colombia (SFC), the supervisor of
Colombia’s financial system. The information covers the period between 2007 and 2018 and
includes 2999 observations of 29 local banks.

 The second dataset comprises unique information on the international presence of
Colombian financial conglomerates, on a monthly basis for the period 2007- 2018. In
particular, our measure of geographical complexity is built using the information of the
location of Colombian banks’ foreign subsidiaries. The dataset includes more detailed
information for the period comprised between 2014 and 2018. In particular, it contains
information on other types of financial and non-financial entities, and on the exact amount
of assets, liabilities, equity, deposits and loan portfolio of banks’ foreign subsidiaries. The
first part of the dataset (from 2007 to 2013) comes from public sources, while the second part
(from 2014 to 2018) comes from the SFC.

 These two dataset are merged and for the local banks that do not belong to any domestic
IFC our measure of geographical complexity takes the value of zero. Table 1 presents
summary statistics of bank and IFC characteristics included in our regressions. ( ) has
a mean of 4.41 with a standard deviation of 0.86. Our measure of geographical complexity
has a mean value of 0.91, a minimum of zero and a maximum of 9. There is a large variation
on the bank controls, with the average bank having a deposit to assets ratio of 67 percent,

10 When 2 is used as a measure of duration, ∆ −1 is not included in the specification.

 14
evidencing the high deposit dependency of Colombian banks, a loan to asset ratio of 70 percent and an equity ratio of 15 percent. Finally, as macroeconomic controls we include the quarterly change in monetary policy rate and the quarterly change in the real GDP, that in the sample period averaged -0.05 percent and 0.91 percent, respectively. As additional measures of the fluctuations on the monetary policy rate we include the duration variables. During the sample period, the average period of consecutive drops (hikes) on the monetary policy interest rate was equal to 2.13 (2.91) quarters, while the accumulate drop (hike) on those periods was equivalent to 0.74 (0.60) basis points. 6 Empirical Results 6.1 Geographical Complexity and Bank Risk Overall, our findings suggest that a larger geographical complexity increases bank risk and are consistent with the results in Demsetz and Strahan (1997), Chong (1991), Acharya et.al (2006) and Krause et al. (2017). Table 2 provides the regression results on the relationship between geographical complexity and bank risk (equation (1)). Columns I through IV report results of models that include _ and various combination of bank and time fixed effects. In Columns V through VIII we add bank characteristics. The first two models provide a negative and non-statistically significant coefficient which would suggest the absence of an effect of geographical complexity on bank risk. However, when stronger specifications that incorporate bank fixed effects or other bank characteristics are used, we find a positive and statistically significant coefficient. We then proceed to analyze which channels explain the negative relationship between geographical complexity and bank risk. 6.1.1 Diversification To examine the relevance of this channel, we start by estimating the correlation of the Colombian business cycle with the business cycle of each of the countries, , in which Colombian financial conglomerate have bank subsidiaries, using a rolling window of 30 years. The correlations between the Colombian business cycle and that of Honduras, Paraguay, Costa Rica, El Salvador, Guatemala and Peru seem to be relatively high as 15
presented in Figure 6 (Panel A)11. This might be surprising at a first look, given that contrary
to Colombia most of these countries are net commodity importers and variations in the oil
price may affect them differently. Nonetheless, the correlations seem to reflect common
exposures of Central and South America countries, e.g., a high exposure to the U.S.
Therefore, we would not expect to find gains of diversifications in terms of “low” business
cycle co-movement.

 Figure 6. Correlation of Business Cycles with Colombia
 Panel A. Correlation by Country. Panel B. Weighted correlation by IFC.

 With these individual correlations we built our first proxy for diversification, which
corresponds to the weighted correlation for each financial conglomerate based on the
number of bank subsidiaries they have in each country at every point in time12 13, see Figure
6 (Panel B). The results from equation (2) are reported in Table 3 (Panel A) and suggest that
large co-movements of business cycles increase bank risk. Indeed, when the interaction term
is included the coefficient _ switches its sign to negative, indicating that these
large business cycle co-movements are a key determinant of the positive relationship
between geographical expansion and bank risk.

11The figure presents the business cycle correlations of the countries in which the Colombian IFCs have more
presence in terms of bank subsidiaries’ assets.
 ∑∀ −1 ∗ ( , )
12 = .
 −1
13For banks that do not belong to any of the financial conglomerates that expanded abroad,
is equal to one (i.e., there are not diversification gains). For banks that belong to a conglomerate that has bank
subsidiaries in Colombia and abroad, ponders the number of Colombian subsidiaries by
one and the sum of foreign subsidiaries by the correlation with their respective countries.

 16
As an alternative proxy for diversification we built an index based on the bilateral
synchronization employed by Agrimon (2017) and Kalemli-Oskan et. al (2013). The
synchronicity of business cycles is measured as the negative of the absolute difference
between country k and country j’s real GDP growth rates14. As it is highlighted by Agrimon
(2017), a higher value of this measure (closer to zero) indicates a higher level of bilateral
synchronization among countries15. This measure is preferable to the simple correlation
measure, since it generates higher variability and it is not subject to the sample period (see
Figure 7 (Panel A)).

 Figure 7. Business Cycle Synchronization (BCS)

 Panel A. BSC by Country. Panel B. Weighted BCS by IFC.

 As it is done in Agrimon (2017), we built the index ℎ as
a weighted average of the bilateral synchronization indices. As before, the weights are
calculated based on the number of bank subsidiaries of each IFC has in each country at every
point in time16, see Figure 7 (Panel B).

 Estimates for equation (2) using ℎ as a proxy for
diversification are reported in Table 3 (Panel B). Consistent with the results using business
cycle correlation indices, we find that a higher degree of business synchronization (i.e., a

14 = −|ΔY − ΔY |
15 Bilateral synchronization would be equal to zero for banks that do not belong to a conglomerate that has
expanded abroad.
 ∑∀ −1 ∗ , ,
 ℎ =
16 .
 −1

 17
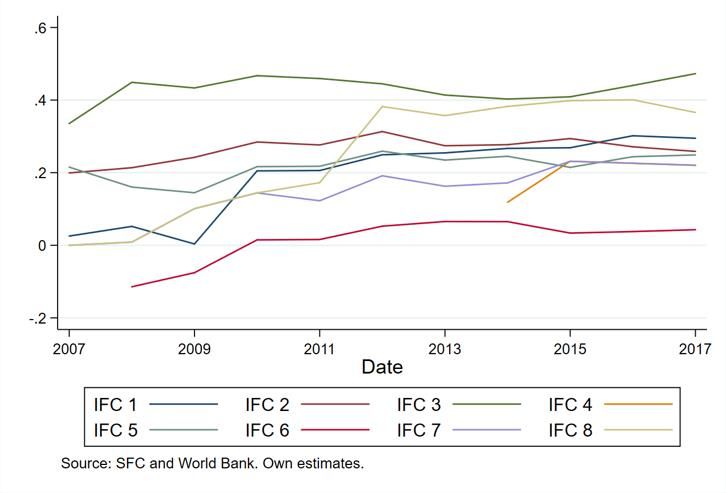
more negative level in the index) is associated with higher risk for banks that belong to a
more complex conglomerate. This once again confirms that diversification plays an
important role on the relationship between geographical expansion and bank risk.

6.1.2 Regulatory Arbitrage

 To examine the role of the regulatory environments in explaining the negative impact
of geographical expansion on bank risk we use the regulatory quality index of the World
Bank, which captures perceptions on the ability of the government to formulate and
implement sound policies and regulations. The regulatory quality index has been
consistently lower than the Colombian one for Guatemala, Paraguay and Honduras. El
Salvador, Panama and Bahamas also had some periods of lower regulatory quality during
the sample period (2007-2018). On the contrary, Costa Rica, Peru, Barbados and Cayman
Island tend to have higher regulatory quality index than Colombia, see Figure 8 (Panel A)17.

 We built the index as a weighted average of the differences
between the (host) countries’ regulatory qualities and Colombia’s regulatory quality.
 will be positive when the financial conglomerate is present mostly in
countries with higher quality of regulation and negative when it is present mostly in
countries with lower quality of regulation.18.

 Figure 8. Regulatory Quality Index19
 Panel A. By Country.

17The figure presents the regulatory quality index of the countries in which Colombian IFCs have more presence
in terms of bank subsidiaries’ assets.
 ∑∀ −1 ∗
18 = .
 −1
The is positive when regulatory quality is greater in the host country than in
Colombia and it is negative when it is lower.
19Note that we exclude Bahamas, Barbados and Cayman Island from Panel A, due to their small participation
in terms of assets, but take them into account for the weighted average presented in Panel B.

 18
Results of estimating equation (3) are presented in Table 4. They suggest that the
interaction between regulatory quality and geographical complexity increases the distance
to default, or in other words, decreases bank risk. This implies that local banks, which
belong to an IFC that expanded into countries with higher regulatory quality indexes, will
experience less risk, compared to those that belong to an IFC that expanded to countries
where the regulatory environment is less strict. These results contribute to explain the
positive relationship between geographical complexity and bank risk.

6.1.3 Funding Costs

 As mentioned, the funding cost channel refers to gains in terms of lower funding costs
for geographically complex financial conglomerates. The results of equation (4) are
presented in Table 5 and suggest that banks with larger amounts of foreign funding that
belong to a more complex IFC are less risky (i.e., have a larger distance to default). These
results would imply that the positive relationship between geographical complexity and
bank risk is not explained by the foreign indebtedness of individual banks. On the contrary,
banks without foreign funding that belong to a complex IFC tend to be riskier (notice that
the magnitude of the coefficient of _ increased with respect to our main
specification).

 To further understand this potential channel, we evaluate if the level of foreign
indebtedness of a bank depends on its degree of complexity, by estimating the following
regression model:

 ln( )
 = 0 + 1 _ + ℎ +
 + (9)

 The results, presented in Panel A of Table 6, suggest that banks that belong to a more
complex conglomerate have a higher foreign indebtedness. What is more, by estimating a
similar specification using loan level data, we can confirm that complex banks receive higher
loan amounts from foreign banks that belong to the same financial conglomerate (Panel B).
This is consistent with the important role of internal capital markets and also of intragroup
funding activities.

 19
To evaluate the effects of local monetary policy we analyze if the level of foreign
indebtedness of complex conglomerates is sensitive to changes in domestic monetary policy
(Table 7. Panel A). By estimating Equation (10), we find that banks that belong to a complex
conglomerate tend to increase (decrease) their foreign indebtedness when domestic
monetary policy is tighten (soften). On the other hand, the interest rate charged to complex
banks is higher, but it decreases (increases) when monetary policy is tightened (soften), in
particular for loans granted by a foreign bank that belongs to the same conglomerate (see
Table 7. Panel B). These results provide evidence that complex banks are able to get larger
amounts of foreign funds, at a lower cost, especially during periods of monetary policy
tightening. In other words, we find some evidence that banks can substitute domestic by
external funds when the internal cost of capital increases.

ln( )
 = 0 + 1 _ + 2 _ ∗ ∆ −3 + 3 ∆ −3
 + (10)

6.2 Geographical Complexity and Monetary Policy20

 At a first look, changes in domestic monetary policy do not seem to affect banks’ risk,
nor have a particular effect over the banks that belong to a complex IFC, as suggested by the
results presented in Table 8. However, when we incorporate the duration of monetary
policy easing in the model, we find that bank risk tends to decrease during periods of
monetary policy loosening, especially for banks that belong to a complex IFC. This effect
also depends on the degree of geographical complexity. These results are robust to the two
definitions of duration (see Table 9, Panels A and B).

 We also analyze if the interaction of geographical complexity and monetary policy is
symmetrical during periods of monetary policy tightening. For this, we re-define the
duration variables based on consecutive periods of interest rate hikes. The results are
presented in Table 10 (Panels A and B) and suggest that bank risk increases during periods
of monetary policy tightening, especially for banks that belong to a complex IFC, and the
effect depends on the degree of geographical complexity. The magnitude of the coefficients,
however, are significantly higher with respect to the case of monetary policy loosening,
indicating that the risk of banks that belong to complex IFC is more sensitive to periods of
monetary policy tightening.

 20The results presented in this section are robust to the different definitions of duration based on the
nominal two-year and 10-year sovereign yields.

 20
These results could be driven by the selections of borrowers of banks that belong to a
more complex conglomerate. These banks might focus on more risky borrowers at home
(which are expected to be more sensitive to changes in monetary policy), hoping that the
diversification benefits of an expansion to other credit markets will neutralize their losses.
If this is the case, we should observe a larger deterioration on the credit quality of the
portfolio of more complex banks during periods of monetary policy tightening. This will
also be consistent with an asymmetric effect of changes in monetary policy. To analyze if
this is the case, we estimate the regression model presented in equation (11), where
 is defined as the ratio of doubtful loans to total loan portfolio. This
variable is regressed on our measure of geographical complexity and the duration of
monetary policy tightening and easing.

 2
 = 0 + 1 _ + 2 _ ∗ −1
 2
 + 3 −1 + (11)

 The results, presented in Table 11, suggest that there is a substantial increase on the
doubtful loans ratio for complex banks during periods of monetary policy tightening (Panel
A). Although the increase in doubtful loans is generalized for all banks (i.e., 3 is positive
and statistically significant), the increase is higher for banks that belong to a complex IFC.
On the other hand, during periods of monetary policy loosening (Panel B) there seems to be
a general decrease on the doubtful loans ratio, but there is not a differential effect for the
banks that belong to a complex IFC (i.e., 2 is not statistically significant).

7 Robustness

 We do two types of robustness checks. First, we present the results of the main
estimations only for those Colombian financial conglomerates that absorbed the operations
of international subsidiaries, who left those countries after the Global Financial Crisis (GFC),
in response of tighter international regulation or changes in internal business models. The
objective of these additional estimations is to evaluate a group of banks whose reasons for
expansion were purely exogenous. The results are presented in Tables 12, 13 and 14. As it
can be observed, the overall results remain unchanged in terms of the sign and the
significance of the coefficients, while the magnitude of the coefficients increase. These
results provide confidence that our results are not being driven by an endogeneity issue.

 21
As a second robustness check, we match the group of banks that expanded abroad with
banks that have similar characteristics but did not expand.21 We do so in order to control
for possible confounding bias. The results, presented in Tables 15 to 17, are consistent with
our main results, the sign and significance of the coefficients remain unaffected, while their
magnitude is at times larger. This provides confidence that the effects on risks are certainly
explained by the increase of bank complexity and not by other confounding factors.

8 Conclusions

 Colombia represents an interesting case study to evaluate the effects of an exogenous
international expansion of local financial conglomerates. Several Colombian IFC expanded
to Central America and the Caribbean, as a result of the retrenchment of international
subsidiaries of global groups that left those countries after the Global Financial Crisis (GFC)
in response to tighter international regulation or changes in internal business models.

 In this paper, we use this exogenous variation to evaluate the effect that changes in the
degree of geographical complexity of Colombian IFC have had on the level of risk of
domestic banks. Our findings suggest that an increase in geographical complexity is
associated with an increase of individual bank risk. This positive correlation is explained
mainly by two channels: i) a lower asset diversification through an expansion to locations
with a high business cycle synchronization; and ii) the potential presence of regulatory
arbitrage, through an expansion into countries with less strict regulatory frameworks. On
the contrary, we find that those banks with more access to foreign funding, at a lower cost,
exhibited a decrease on bank risk. These results are strong and survive a battery of controls
and robustness tests.

 Finally, this paper finds evidence that banks that belong to a more complex IFC are
more sensitive to changes in local monetary policy. In particular, during periods of
monetary policy tightening (loosening) these banks experience higher (lower) levels of risk.
These changes on the level of individual risk seem to be associated with a more prominent
risk taking from this type of institutions, which is evidenced by a larger deterioration of
their loan portfolio during periods of monetary policy tightening.

21
 We perform the matching using the percentiles of various financial indicators (e.g. capital ratio, profitability).

 22
9 References

 Acharya, V.V., I. Hasan, and A. Saunders (2006). Should banks be diversified?
Evidence from individual bank loan portfolios. The Journal of Business 79 (3): 1355–1412.

 Agrimon, I. (2017). Descentralized Multinational Banks and Risk Taking: The
Spanish Experience in the Crisis. Banco de España.

 Akhigbe, A. and A. M. Whyte (2003). Changes in market assessments of bank risk
following the Riegle-Neal Act of 1994. Journal of Banking & Finance 27: 87-102.

 Altunbas, Y., M. Binici and L. Gambacorta (2018) Macroprudential policy and bank
risk. Journal of International Money and Finance 81(C): 203-220.

 Berger, A., N. Miller, M. Petersen, R. Rajan and J. Stein (2005). Does function follow
organizational form? Evidence from the lending practices of large and small banks. Journal
of Financial Economics 76: 237 – 269.

 Berger, P. and E. Ofek (1995). Diversification’s effect on firm value. Journal of Financial
Economics 37: 39 – 65.

 Brickley, J., J. Linck, and C. Smith Jr. (2003). Boundaries of the firm: evidence from
the banking industry. Journal of Financial Economics 70: 351 – 383.

 Borio, C. and H Zhu (2012). Capital regulation, risk-taking and monetary policy: A
missing link in the transmission mechanism? Journal of Financial Stability.

 Boyd, J.H. and E .C. Prescott (1986). Financial intermediary-coalitions. Journal of
Economic Theory 38: 211-232.

 Carmassi, J. and R. Herring (2016). The Corporate Complexity of Global
Systemically Important Banks. Journal of Financial Services Research vol. 49 nos. 2-3 (June):
175-202.

 Cecchetti, S.G., T. Mancini-Griffoli, M. Narita and R. Sahay (2018). U.S. or Domestic
Monetary Policy: Which Matters More for Financial Stability?

 Cetorelli, N. and L.S. Goldberg (2012). Banking globalization and monetary
transmission. J. Finance 67 (5), 1811–1843.

 Cetorelli, N. and L. Goldberg (2016). Organizational Complexity and Balance Sheet
Management in Global Banks. NBER Working Paper 22169. Cambridge MA.

 23
Chong, B.S. (1991). The effects of interstate banking on commercial banks’ risk and
profitability. Review of Economics and Statistics 73: 78-84.

 Demsetz, R. S., P. E. Strahan (1997). Diversification, size, and risk at bank holding
companies. Journal of Money, Credit, and Banking 29, 300 – 313.

 Deng, S. and E. Elyasiani (2008). Geographic diversification, bank holding company
value, and risk. Journal of Money, Credit and Banking 40(6): 1217–1238.

 Diamond, D (1984). Financial Intermediation and Delegated Monitoring. Review of
Eco- nomic Studies LI: 393-414.

 Faia, E., G. Ottaviano, and I. S. Arjona (2017). International Expansion and Riskiness
of Banks. Centre for European Policy Research. Discussion Paper 11951. London.

 Goetz, M. R., L. Laeven, and R. Levine (2016). Does the geographic expansion of
banks reduce risk? Journal of Financial Economics 120: 346-362.

 Jensen, M.C. (1986). Agency costs of free cash flow, corporate finance, and takeovers.
American Economic Review 76: 332 – 329.

 Jensen, M.C. and W.H. Meckling (1976). Theory of the firm: managerial behavior,
agency costs and ownership structure. Journal of Financial Economics 3: 305-360.

 Kalemli-Ozcan, S., E. Papaioannou and J.L. Peydró (2013). Financial regulation,
financial globalization, and the synchronization of economic activity. Journal of Finance 68:
1179-1228.

 Krause, T., T. Sondershaus, and L. Tonzer (2017). Complexity and Bank Risk during
the Financial Crisis. Economic Letters 150: 118-121.

 Levine, R., Lin, C. and W. Xie, (2015). Geographic Diversification and Banks’
Funding Costs. Mimeo.

 Lee, S. and C. Bowdler (2019). Banking sector globalization and monetary policy
transmission: Evidence from Asian countries. Journal of International Money and Finance 93:
101-116

 Scharfstein, D.S. and J.C. Stein (2000). The dark side of internal capital markets:
divisional rentseeking and inefficient investment. Journal of Finance 55: 2537-2564.

 Servaes, H. (1996). The value of diversification during the conglomerate merger
wave. Journal of Finance 51: 1201 – 1225.

 24
Levine, R., Lin, C. and W. Xie, (2015). Geographic Diversification and Banks’
Funding Costs. Mimeo.

 25
TABLE 1. Descriptive Statistics of variables used in the regression
The table provides the definition of bank and IFC characteristics. The mean, median, standard deviation, min and max are presented for every variable.

Variables Units Definition N Mean S t. Dev Median Min Max
Dependent Variable
ln (Z) - M onthly natural logarithm of the Z-score. 2'999 4.41 0.86 4.50 1.70 6.56
IFC characteristic
 Number of countries in which the financial conglomerate has
Span location
 foreign subsidiaries. 2'999 0.91 2.02 0.00 0.00 9.00
Bank-specific characteristics
 Bank size - Log of total assets. 2'999 22.72 1.62 23.13 18.24 25.75
 Deposits/Assets % Ratio of total depositos to total assets. 2'999 67.40 16.16 71.68 0.00 89.30
 Loans/Assets % Ratio of total loans to total assets. 2'999 70.69 15.03 71.90 5.24 97.00
Macroeconomic variables
 Δi(t-3) % Quarterly change in the monetary policy rate. 2'999 -0.05 0.00 0.69 -3.00 1.00
 Gdp growth (t-3) % Quarterly change in the real GDP. 2'999 0.91 0.85 0.89 -2.67 2.43
TABLE 2. Effect of Geographical Complexity on Bank Risk
The table reports regression results from specification (1). The dependent variable is the inverse of natural logarithm of the
Z-Score. Columns (I-IV) report results of a model that includes Span Location (the number of countries in which the bank
subsidiaries of the conglomerate are active), as a measure of geographical complexity and different combinations of bank
and time fixed effects. Columns (V-VIII) add bank characteristics. Definitions of the variables can be found in Table 1.
Coefficients are listed in the first row, robust standard errors that are corrected for clustering at the bank level are reported
in the row below in parentheses, and the corresponding significance levels are in the adjacent column. Note: *** Significant
at 1%, ** significant at 5%, * significant at 10%.

Dependent Variable -ln (Z Score)
Models I II III IV V VI VII VIII

Geographical Complexity
 Span_location_b -0.043 -0.039 0.070** 0.109*** 0.064 0.068 0.117*** 0.110***
 (0.035) (0.038) (0.026) (0.032) (0.040) (0.046) (0.028) (0.032)
Bank Characteristics
 Bank size (t-1) -0.270** -0.263** -0.330* -0.198
 (0.108) (0.116) (0.185) (0.226)
 Deposits/Assets (t-1) 0.944 0.709 -0.204 -0.997**
 (0.803) (0.853) (0.410) (0.460)
 Loans/Assets (t-1) -1.704*** -1.523** 0.204 -0.320
 (0.547) (0.570) (0.507) (0.578)

Observations 2,861 2,861 2,861 2,861 2,861 2,861 2,861 2,861
Adjusted R-squared 0.009 0.018 0.516 0.544 0.162 0.168 0.528 0.551
Cluster Bank Bank Bank Bank Bank Bank Bank Bank
Bank FE No No Yes Yes No No Yes Yes
Time FE No Yes No Yes No Yes No Yes

 27
TABLE 3. Geographical Complexity & Diversification
The table reports regression results from specification (2). The dependent variable is the inverse of the natural logarithm of
the Z-Score. Columns (I-IV) report results of a model that includes Span Location as a measure of geographical complexity,
the diversification proxy; and the interaction between the two variables. Different combination of bank and time fixed effects
are also included. Columns (V-VIII) add bank characteristics. Definitions of the variables can be found in Table 1.
Coefficients are listed in the first row, robust standard errors that are corrected for clustering at the bank level are reported
in the row below in parentheses, and the corresponding significance levels are in the adjacent column. Note: *** Significant
at 1%, ** significant at 5%, * significant at 10%.

Panel A. Measure of diversification: weighted business cycle correlation for the conglomerate.
Dependent Variable -ln (Z Score)
Models I II III IV V VI VII VIII

Geographical Complexity & Diversification
Span_location_b -0.085 -0.068 -0.205* -0.146 0.020 0.051 -0.294** -0.199*
 (0.108) (0.117) (0.104) (0.108) (0.183) (0.183) (0.118) (0.111)
Weighted Correlation (l.gdp)*Span_location_b 0.162 0.132 0.840*** 0.765** 0.051 -0.037 1.179*** 0.931**
 (0.317) (0.336) (0.296) (0.315) (0.521) (0.523) (0.363) (0.341)
Weighted Correlation (l.gdp) 0.033 0.080 -0.247 -0.284 -0.375 -0.352 -0.517 -0.540
 (0.361) (0.392) (0.216) (0.290) (0.388) (0.394) (0.432) (0.418)

Bank Characteristics
 Bank size (t-1) -0.292** -0.289** -0.368* -0.391
 (0.115) (0.120) (0.201) (0.232)
 Deposits/Assets (t-1) 0.837 0.777 -0.435 -0.864*
 (0.824) (0.851) (0.445) (0.484)
 Loans/Assets (t-1) -1.747*** -1.770*** 0.329 -0.085
 (0.556) (0.530) (0.648) (0.640)

Observations 2,634 2,634 2,634 2,634 2,634 2,634 2,634 2,634
Adjusted R-squared 0.008 -0.013 0.547 0.549 0.174 0.156 0.558 0.557
Cluster Bank Bank Bank Bank Bank Bank Bank Bank
Bank FE No No Yes Yes No No Yes Yes
Time FE No Yes No Yes No Yes No Yes

Panel A. Measure of diversification: weighted business cycle synchronization for the conglomerate.
Dependent Variable -ln (Z Score)
Models I II III IV V VI VII VIII

Geographical Complexity & Diversification
Span_location_b 0.067 0.101 0.231*** 0.255*** 0.188** 0.207** 0.275*** 0.264***
 (0.063) (0.070) (0.039) (0.050) (0.080) (0.089) (0.054) (0.058)
Business Cycle Sinchronization *Span_location_b 0.047* 0.057* 0.055** 0.056** 0.062* 0.069* 0.064** 0.058**
 (0.023) (0.028) (0.022) (0.022) (0.035) (0.038) (0.023) (0.023)
Business Cycle Sinchronization -0.023 -0.012 -0.101** -0.094* -0.093 -0.089 -0.101* -0.099*
 (0.070) (0.078) (0.046) (0.051) (0.082) (0.088) (0.050) (0.054)

Bank Characteristics
 Bank size (t-1) -0.284** -0.280** -0.252 -0.302
 (0.114) (0.119) (0.191) (0.231)
 Deposits/Assets (t-1) 0.826 0.743 -0.262 -0.823
 (0.824) (0.855) (0.456) (0.508)
 Loans/Assets (t-1) -1.658** -1.564** 0.093 -0.382
 (0.614) (0.639) (0.757) (0.711)

Observations 2,634 2,634 2,634 2,634 2,634 2,634 2,634 2,634
Adjusted R-squared 0.015 0.001 0.541 0.547 0.179 0.162 0.547 0.554
Cluster Bank Bank Bank Bank Bank Bank Bank Bank
Bank FE No No Yes Yes No No Yes Yes
Time FE No Yes No Yes No Yes No Yes

 28
You can also read