Border Report - Port of Tauranga and Rotorua Airport - Kiwifruit Vine Health
←
→
Page content transcription
If your browser does not render page correctly, please read the page content below
Border Report – Port of
Tauranga and Rotorua Airport
August 2013
Purpose
A preliminary report to understand the level of risk the Port of Tauranga (POT) and Rotorua Airport
present to the Bay of Plenty kiwifruit industry with the intent of determining if the current level of
protection is adequate.

Background
Biosecurity in New Zealand consists of a multi –layer system that begins offshore with pre-border
activities, incorporates the border and continues post-border into New Zealand where it becomes a joint
effort between central government, regional councils, industry, community groups, and all New
Zealanders, (a paper describing this system in more detail can be found on the KVH website
www.kvh.org.nz/kiwifruit_biosecurity_risks). This paper will review a single layer, border interventions at
ports of entry. Any port of entry has the potential to bring unwanted pests and diseases into New
Zealand that could be detrimental to the kiwifruit industry, however, given the high concentration of the
kiwifruit industry in the Bay of Plenty, this report has focused on the ports of entry in the immediate
proximity to this region, which are the Port of Tauranga and the Rotorua Airport.

The Port of Tauranga is New Zealand’s second largest port by container volume, and a major stop on the
cruise ship circuit. Rotorua Airport is an International Airport receiving two trans-Tasman flights a week.
Imports into POT, cruise ships, and passenger traffic through Rotorua Airport are all potential pathways
for risk items to enter New Zealand and each will be reviewed to provide an overview of operations,
potential risks that each present and how these risks are being mitigated. This review is a preliminary step
in KVH’s on-going wider biosecurity activities and will later be developed further, which may include
application of the lessons learned to other ports of entry or more detailed studies of high-risk items.

The level of risk that a particular port presents to the kiwifruit industry can be approximated by
considering the level of risk of the import pathway (what is being imported, where is it coming from, and
where is it going to), how that risk is being managed (by pre-border and border interventions), and the
proximity of the port to kiwifruit producing regions. Figure 1 illustrates the volume of imports into each
New Zealand seaport over the past year, and distinguishes bulk imports from containerised. Bulk imports
are typically products with a low biosecurity risk such as oil and coal, however it should be noted that the
category also may include animal feed such as palm kernel expeller which has gained attention for
biosecurity risks in the media recently and is reviewed further later in this report. Containerised imports
present a higher biosecurity risk to the kiwifruit industry as they are more likely to transport pests with
significant impact potential, either as hitchhikers on the surface of the container, or within the container
on high risk items such as fresh produce that are containerised for transport.

There are three New Zealand ports in close proximity to kiwifruit regions that handle the vast majority of
imports into New Zealand; Northport (Whangarei), Ports of Auckland and Port of Tauranga (Figure 1). A
brief investigation into Northport revealed that over 99 % of imports were low risk items such as oil and
petroleum products, fertiliser and coal. Therefore Northport was considered to be low risk for the
introduction of threats to the kiwifruit industry.

1   Kiwifruit Vine Health Inc www.kvh.org.nz [Border Report, Matt Dyck, August 2013]
Over 60% of container imports arrive at either the Port of Tauranga or Ports of Auckland. The close
proximity of these ports to kiwifruit producing regions categorises these as high risk and warrants further
investigation, with the Port of Tauranga the subject of this first report.
Figure 1. Volume of imports by port, April 2012 – March 201. (Source: Ministry of Transport).
Port of Tauranga
To understand the level of risk of the Port of Tauranga we must consider:
The growth trends of the port
Where imports are coming from?
What products are being imported?
What are the risks and how are these being mitigated?
Are there gaps that need to be addressed?
Background
The Port of Tauranga (POT) is New Zealand’s largest port by total volume and second largest by container
volume behind Ports of Auckland. Together POT and Ports of Auckland represent over 60% of New
Zealand’s container trade per year. Exports are a major revenue source for POT given its close proximity
to the forestry, dairy and kiwifruit production regions, but the volume of imports entering POT is also
significant and rapidly increasing (Figure 2). In 2012, 6 million tonnes of imports were unloaded at the
POT, a 300% increase from the volume recorded in 1999. As POT operates as a hub port, almost half of
these imports are not considered “true imports” as they arrived via another New Zealand port or were
loaded onto another vessel in port as a trans-shipment. “True imports” into POT, that is those arriving
directly from another country and passing through the border, totalled 3.5 million tonnes in 2012 which is
the third largest volume of any NZ port behind Whangarei and Auckland with 5.7 million and 3.6 million
tonnes respectively.
2 Kiwifruit Vine Health Inc www.kvh.org.nz [Border Report, Matt Dyck, August 2013]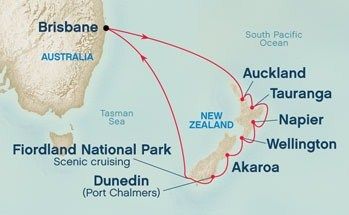
Figure 2. Import volumes to Port of Tauranga have risen steadily over the past 50 years, and dramatically since 1999.

Where do imports come from?
By region
An important consideration of risk factors is the country of origin from which imports are arriving. By
region, most imports to POT arrive from Asia (39%), Australia and the Pacific (25%), or via other NZ ports
(21%).

Table 1. Volume of imports to Tauranga by region (2012)

                                         Volume                Volume            Value           Value1
    Imports                           (000 Tonnes)           (% of Total)       (NZ$ M)        (% of total)
    Total Asia                            2,404                  39%             2,322            39%
    Australia and Pacific                 1,536                  25%             1,840            31%
    North America                          485                   8%               614             10%
    Middle East and Africa                 234                   4%               152             3%
    U.K & Europe                           82                    1%               615             10%
    Other NZ ports                        1,329                  21%
    Total Imports                         6,190                 100%              5,900            94%

1
 N.B. Total value is the official value of all true imports, regional values have been manually assigned from top ranking countries
and do not include all the smaller nations and therefore do not add to 100%.

Over the past decade there has been a major shift the source of imports into the POT. In 2000, Asia was a
small player with just 11% of imports, and Australia and North America were the dominant exporters with
51% and 31% of total imports respectively. Since 2000, imports from Australia have increased, but as a

3     Kiwifruit Vine Health Inc www.kvh.org.nz [Border Report, Matt Dyck, August 2013]
proportion of the total they have declined as a result of the dramatic increase in imports coming from
Asia which have increased over 1100% from 2000 - 2012 (Figure 3).
3,000.00
2,500.00
2,000.00 Australia
NZD (Millions)
Asia
1,500.00
Europe
North America
1,000.00
500.00
-
2000 2001 2002 2003 2004 2005 2006 2007 2008 2009 2010 2011 2012
Figure 3. Imports from top 20 countries by value, grouped by region (2000 – 2012)
By country
Australia is the largest exporter to POT, and sends more than twice as much as of any other single
country. China, is the second largest exporting country into POT and accounts for about a third of all Asian
imports. Imports from China have increased by over 1600% since 2000 and are largely responsible for the
huge growth of Asian imports seen in Figure 3.
What are the major trends by country in the last decade?
Ranking export countries by value, and comparing a countries’ rank in 2000 against 2012 serves as an
indicator of the major trends by country over the past decade (Table 2). We can relate these trends to
biosecurity risks by considering that emerging nations with short histories of trade that have shown major
growth may be considered high risk given the limited exposure of our biosecurity system to these nations.
The 6 countries with the largest growth are highlighted in Table 2 and notably, four are in the wider South
East Asia (Singapore, Thailand, Vietnam & India), one is in the Middle East (Israel) and the other is in
South America (Argentina). This shows a shift from our traditional trading partners of Australia, Europe
and North America to the more emerging regions such as South East Asia.
4 Kiwifruit Vine Health Inc www.kvh.org.nz [Border Report, Matt Dyck, August 2013]Table 2. Imports by country to Port of Tauranga 2000 vs. 2012. Countries with the greatest increase in ranking over this 12 year
period highlighted in green.
2000 2012
Country rank NZD % of Total Country rank NZD % of Total
Australia 1 912,280,584 48% Australia 1 1,840,115,226 31%
USA 2 489,760,848 26% China 2 705,303,108 12%
Canada 3 70,520,947 4% USA 3 438,387,255 7%
Japan 4 60,210,919 3% Singapore 4 386,693,785 7%
Morocco 5 50,708,087 3% Japan 5 290,579,344 5%
China 6 41,916,505 2% Thailand 6 233,758,810 4%
Korea,
Republic of 7 29,106,303 2% Malaysia 7 214,921,749 4%
Mexico 8 21,152,789 1% Indonesia 8 179,006,363 3%
Taiwan 9 19,533,468 1% Canada 9 175,641,523 3%
Malaysia 10 17,459,790 1% Germany 10 141,794,081 2%
Korea,
Germany 11 16,662,108 1% Republic of 11 118,182,517 2%
United
Kingdom 12 15,274,116 1% Israel 12 109,161,339 2%
Singapore 13 12,657,006 1% Taiwan 13 105,593,226 2%
Indonesia 14 11,557,359 1% Italy 14 101,551,529 2%
United
Thailand 15 11,083,829 1% Kingdom 15 90,996,081 2%
Italy 16 7,583,541 0% France 16 69,539,237 1%
Sweden 17 7,478,636 0% Netherlands 17 59,426,537 1%
France 18 7,019,816 0% Viet Nam 18 46,424,259 1%
Puerto Rico 19 6,997,153 0% Morocco 19 43,384,866 1%
New Zealand 20 6,983,939 0% India 20 41,822,722 1%
South Africa 21 6,417,701 0% Argentina 21 41,488,608 1%
Netherlands 22 6,060,642 0% Mexico 22 35,564,163 1%
Summary for biosecurity risk of import trends:
Import volumes into POT are increasing dramatically and biosecurity resources need to keep pace.
Australia, China and USA are the main countries sending imports, however those from South East Asia
have been increasing rapidly.
Products imported
Oil, fertiliser and coal account for almost a third of imports into POT by volume but represent relatively
low biosecurity risk so will not be examined further in this report.
Fruit
Fruit are of significant interest as pests transported in these shipments are likely to impact the kiwifruit
industry. Almost 10% of fruit imported to New Zealand arrives at the POT. Most fruit coming into POT
comes from the USA (Figure 4), however proportionally their share has decreased from over 90% in 2001
to 29% in 2012. Australian imports have increased steadily and are now almost on par with USA supplying
over 25% of all fruit into Tauranga. Other countries that have strong growth trends for fruit imports to
POT include Vietnam, Indonesia, Thailand and Italy (Figure 5).
5 Kiwifruit Vine Health Inc www.kvh.org.nz [Border Report, Matt Dyck, August 2013]50
Total
United States of America
45
Australia
Turkey
40 Canada
China, People's Republic of
35
30
NZD (millions)
25
20
15
10
5
-
2000 2001 2002 2003 2004 2005 2006 2007 2008 2009 2010 2011 2012
Year Year Year Year Year Year Year Year Year Year Year Year Year
Figure 4. Fruit imports into Port of Tauranga, total and 5 largest fruit export countries 2000 – 2012.
30%
25% 2011
% of total fruit imports
2012
20%
2013
(NZD)
15%
10%
5%
0%
Figure 5. Leading fruit exporters to the Port of Tauranga with USA excluded to illustrate recent trends of other countries
(2011-2013)
6 Kiwifruit Vine Health Inc www.kvh.org.nz [Border Report, Matt Dyck, August 2013]6
United States of America
China
5
Australia
4 Canada
India
NZD (millions)
3 Fiji
2
1
0
2000 2001 2002 2003 2004 2005 2006 2007 2008 2009 2010 2011 2012
Year
Figure 6. Vegetable imports to Port of Tauranga from leading export countries, excluding the USA (2000-2012).
Vegetables
Between 5 and 10 % of New Zealand’s vegetable imports arrive into the POT and of these, almost half are
from the USA. Vegetable imports from China have been increasing steadily and there have been short but
large fluctuations in volumes from Australia and Fiji (Figure 6). These fluctuations may present high risk as
large volumes arrive from a country border protection is not regularly exposed to.
Unloading efficiency
Increases in the POT have partly come about as a result of transport efficiencies.
Table 3. Improvements in transport efficiencies at the Port of Tauranga 1992 - 2012
Year Cargo per ship Cargo handled per
(tonnes) working day
(tonnes)
1992 8,351 4,292
2012 12,293 8,165
Reduced turnaround times for visiting vessels is a priority for POT to increase trading competitiveness and
in 2003, an Australian Productivity Commission benchmarking study rated Sulphur Point as the most
efficient container handling facility in Australasia. Recent high speed container crane purchases and
upgrades of existing cranes will improve efficiencies even further. A key question is how does MPI
manage this external pressure for efficiencies, against their own biosecurity objectives? MPI state that
efficiencies are created through a high degree of cooperation between the POT and MPI. MPI imposes
delays on shipments when necessary, so there are incentives from an efficiency perspective for
companies to achieve a high level of biosecurity compliance.
What are the risks?
Imports into the POT may be contaminated with pests and diseases that could pose serious risks to our
kiwifruit industry. These pests could contaminate items inside containers, or hitchhike on the container or
vessel surface.
7 Kiwifruit Vine Health Inc www.kvh.org.nz [Border Report, Matt Dyck, August 2013]KVH has produced a list of the organisms considered to pose the most serious threats to the kiwifruit
industry, available on our website (www.kvh.org.nz/kiwifruit_biosecurity_risks). The table below (Table 4)
provides an example of possible entry pathways for some of the high risk pests on this list. The possible
entry pathways are from countries that; are known to have the pest present, and export known host
commodities to the POT. The list serves as an example with only some high risk pests and larger export
nations considered, the true list of all possible pathways will be much greater.
Table 4. Example of some high risk organisms and possible entry pathways based on distribution of pest and imports into the Port
of Tauranga
Pest Distribution Host Possible entry pathways include
Mediterranean Africa, Fruit Contaminated fruit from Ecuador,
Fruit Fly Mediterranean, South Africa, Greece, Turkey or
Central & South Western Australia
America, West
Australia
Queensland Fruit Australia, New Fruit Contaminated fruit from Australia
Fly Caledonia, French
Polynesia
Oriental Fruit Fly Asia, South East Fruit Contaminated fruit from
Asia Philippines, Thailand, Indonesia,
Vietnam or China
White Peach Global Fruit & plant Fruit or plant material from
Scale material almost any country could contain
White Peach Scale
Spotted Wing Eastern Asia, Fruit Contaminated fruit from USA,
Drosophila Europe, North China or Italy
America
Brown China, Japan, Hitch-hiker, Sea containers and wood
Marmorated Korea, USA, found on packaging from China, Japan,
Stink Bug Switzerland inanimate Korea, USA most likely pathways.
objects & fruit
How are these risks being managed?
Risk assessment is the process used by MPI to determine the likelihood of an organism or disease
entering, establishing, or spreading in New Zealand, the likely impact to the country if this was to occur,
and the options available for managing this risk. Import Health Standards specify the risk management
actions that must be undertaken to manage the biosecurity risks associated with imports such as; the
heat treatment of imported foods, disease testing of animals and inspection of used vehicles before
shipment. MPI communicates these standards to exporting countries that then ensure their products
meet New Zealand requirements and have government verification of compliance in the form of an
export assurance certificate to MPI. The intent of these pre-border measures is to create a continuous,
targeted programme to move risk reduction measures offshore. Only high risk items have an associated
Import Health Standard, but every container regardless of risk must have an accompanying quarantine
declaration. This attests to the cleanliness of the sea container and whether it contains wood packaging
that can harbour unwanted insects or fungi. The container must be inspected internally and externally to
ensure it is clean (free of dirt, grass, insects, seeds etc.) and signed by a manager of the packing or
exporting facility. Equivalence systems such as the Sea Container Hygiene System (SCHS) improve sea
container cleaning procedures offshore, and provide MPI with increased confidence reducing the level of
8 Kiwifruit Vine Health Inc www.kvh.org.nz [Border Report, Matt Dyck, August 2013]intervention required at the border. MPI reports that the implementation of SCHS between MPI and some Pacific Island nations resulted in a reduction in contaminated containers from 50 % to less than 5%, a result that reduces the number of interventions required and greatly improves the strength of the biosecurity system. At the border, MPI must then check documentation to verify that appropriate pre-border measures have occurred and perform border inspections to ensure that no hitchhiker organisms are present. Border inspections by MPI operate on risk profiles both for the nature of the item, and the import pathway and previous history of country and company sending the item. The process for an import entering New Zealand begins with import agents who lodge an entry with Customs for the item to be imported, which produces a tariff code labelling the item and indicating the nature of the products being imported. New Zealand Customs, New Zealand Food Safety Authority, and MPI all have a list of codes of items considered high risk that will automatically trigger a warning flag for the relative authority. For MPI, high risk biosecurity items that will always generate a flag include timber and produce. A second risk profiling system operates in parallel and is managed by the Integrated Targeting and Operations Centre (ITOC) which provides intelligence on pathways, importers and shipping agents and may trigger flags of its own for high risk pathways, i.e. if an importer has previously sent items that did not meet the conditions of the Import Health Standard then a flag would be placed on that importer. An item is only considered low risk when no flags are produced from either of these systems. About 1% of low risk items are inspected for hitchhiker organisms by MPI (but should have been inspected by exporting country as per above). High risk items will have their Import Health Standard checked to ensure compliance and determine if any extra treatments are necessary. If an item fails to meet IHS requirements the importer will have a choice of three options at their own cost; treat, reship or destroy. The auditing scheme provides additional incentives for compliance, because non-compliant importers are subject to, and charged for, increased inspections for future shipments. If a pest is found in a container the importer may choose to treat, reship or destroy and in most instances MPI will not try to identify the species of pest present. However if the pest is found in fresh produce MPI will always send the organism to a Pest Identification Laboratory as horticultural pests present a high risk of potential impact to our primary industries. MPI keep a record of all pests sent for identification and state that this is used to respond to emerging risks. When KVH reviewed this data we were only able to access records up to 2009 and highlight the need to access such information as a recommendation from this report. Between 2005 and 2009 there were 180 instances where pests were sent for identification of which 137 were species not present in New Zealand. The majority of organisms found were ants, mites and beetles. There were five instances in this time period where kiwifruit from Italy was contaminated with pests which on three occasions were dead scale insects, and the other two were live ground beetles and bean weevils. The scale insects could not be identified to a species level but it should be noted that Italy has the organism White Peach Scale (Pseudaulacaspis pentagona) which has caused significant damage to their kiwifruit industry and is an unwanted organism in New Zealand. The detection of these organisms at the border indicates our border interventions were successful in this instance, however pre- border measures by the exporter at the Italian end were inadequate and therefore MPI should have imposed controls to rectify this. Further investigation into actions taken by MPI in this instance is 9 Kiwifruit Vine Health Inc www.kvh.org.nz [Border Report, Matt Dyck, August 2013]
warranted coupled with a review of more recent interception data to determine if mitigation measures
were successful in improving biosecurity standards for Italian kiwifruit exports.
Transitional facilities
Once MPI has cleared a container at the port, it is transferred to a transitional facility for unloading.
Transitional facilities are MPI approved sites for receiving containers such as freight forwarding
companies or other private businesses. Every container that is devanned (unloaded) at a Transitional
Facility must have an MPI accredited person (AP) present. These APs have been through an MPI approved
course about biosecurity awareness and what to do if they find a biosecurity risk.
About 70% of containers that arrive into POT are sent to Auckland and redistributed at transitional
facilities such as Metro Port (which is a POT subsidiary). The remainder of containers are distributed to
other transitional facilities of which there are a large number, with 300 in the Bay of Plenty alone and
5000 throughout New Zealand.
MPI acknowledge that having such a large number of transitional facility operators presents a risk and
have amended biosecurity regulations with the intent on tightening the control on these operators
through stricter penalties for non-compliance, which includes instant fines and temporary licence
suspension. Transitional facilities are audited at an interval of up to 18 months, which can be reduced to
as short as three month intervals for those with poor compliance history, again providing an added
incentive for the business to maintain a high level of compliance to reduce the level of MPI intervention.
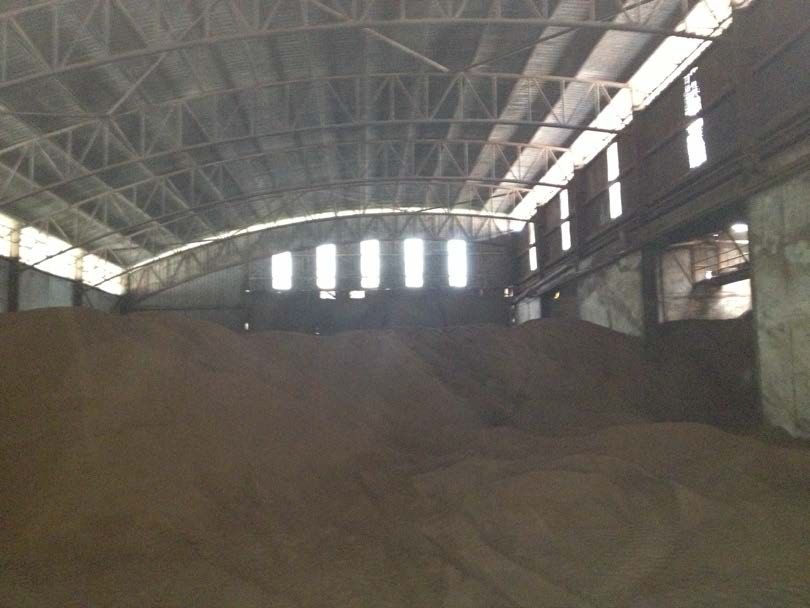
Case Study: Palm Kernel Expeller (PKE)
Palm Kernel Expeller (PKE) is an import that draws attention from the wider public as a result of the
massive increases in use of this product and the media attention several biosecurity issues have gained in
the media. Imports of PKE into New Zealand have risen sharply from less than 100,000 tonnes a decade
ago to over 1.5 million tonnes in 2012. PKE is a by-product of palm oil and over 90% comes from Malaysia
and Indonesia, and the rest mainly coming from Papua New Guinea. PKE is bulk shipped with two or three
ships carrying 40 -60,000 MT arriving in New Zealand every month, of which most (60-70%) arrives at POT
given its proximity to New Zealand’s agricultural regions.
Phytosanitary requirements for PKE are specified in the Import Health Standard, which include heat
treatments to over 80°C and treatment en-route with phosphine or methyl bromide, measures sufficient
to eliminate any unwanted organisms entering with shipments. On arrival shipments are inspected by an
MPI biosecurity officer and if any contaminants are found an approved method of further treatment is
under taken to mitigate any biosecurity risk. Between 2010 and 2011 a MPI border survey was conducted,
randomly inspecting consignments of processed
animal feed imports including PKE. A total of 98
consignments were inspected with no regulated
organisms being found and no slippage identified by
surveyors after routine inspection by MPI. Any pests
found in PKE shipments to date are known to occur
in NZ, and therefore are likely to have contaminated
the shipment after entry into NZ.
10 Kiwifruit Vine Health Inc www.kvh.org.nz [Border Report, Matt Dyck,
FigureAugust 2013] Palm Kernel Expeller (PKE) storage shed in
7. Contained
MalaysiaRecently, media attention has scrutinised this pathway resulting in an audit report into Malaysian and
Indonesian supply chains and a review of the PKE Import Health Standard. These audit reports (available
on the MPI website), found several supply chain lapses that MPI must address, but overall considered this
to be a low risk pathway.
Summary of biosecurity risk Port of Tauranga
Given the significant volume of imports entering the Port of Tauranga, it is likely that a residual level of
risk must remain despite MPI’s border and pre-border interventions. It is difficult to know the level of this
residual risk and if it is within acceptable limits. MPI run an internal 1% container verification audit on all
containerised cargoes, to ensure their risk profiles hold true but what is needed is a slippage report by the
MPI Performance Assurance Group (PAG) measuring slippage against compliance targets to provide a
better understanding of the level of this residual risk. PAG undertake these reports periodically, targeting
specific areas and pathways such as the Passenger Compliance Report in July 2012 that focused on
international airports. These are usually undertaken at a national level and such a report into container
imports would be useful for determining the risk that remains for the kiwifruit industry.
The large number of transitional facilities is concerning and a closer examination of these is warranted to
determine the risk they may present.
Cruise Ships
Background
The number of cruise ships visiting the Port of Tauranga has increased by over 1100% in the past 20 years
and is expected to continue growing (Table 5).
Table 5. Number of cruise ship visits per year into Port of Tauranga
Year Number of cruise ship visits
1992 7
2012 83
The 83 cruise ships that visited during the 2012/ 2013 season brought 211,000 passengers and crew into
Tauranga. A similar number of ships are expected in the 2013/ 2014 season but with larger ships visiting,
forecasts suggest that passenger and crew numbers could reach as high as 240,000 for the upcoming
season.
Despite the number of passengers and the size of the industry, this pathway is considered low risk given
the routes that cruise ships follow. Cruise ships enter New Zealand following one of the three main
routes listed below in decreasing order of frequency; a) Dunedin first New Zealand port then travel north
arriving in Tauranga as 5th NZ port; b) Auckland as 1st New Zealand port and Tauranga 2nd; c) Tauranga
1st New Zealand port (Figure 8). Of the 83 cruise vessels that arrived in 2012, the vast majority arrived by
route (a), only three vessels arrived in Tauranga as the first New Zealand port of call. MPI assign vessels
with risk profiles with the first port of call having the highest risk profile and highest level of border
enforcement, with risk and level of enforcement decreasing for subsequent ports thereafter.
11 Kiwifruit Vine Health Inc www.kvh.org.nz [Border Report, Matt Dyck, August 2013](a) (b) (c)
Figure 8. Main routes of cruise ships entering New Zealand a) Dunedin first NZ port, (b) Auckland first NZ port and (c)
Tauranga first NZ port.
What are the risks?
The major risk that cruise ships present is passengers bringing fruit contaminated with unwanted
organisms off the vessel on to shore.
How are risks being managed?
MPI and New Zealand Customs work together to manage the risks that cruise ships present to our
borders. At the cruise ship’s last overseas port prior to NZ, at least one and up to three officers will board
the ship and complete passenger processing en-route to NZ. The officers assess biosecurity risk of the
passengers and the ship itself. Passengers are risk profiled and complete arrival cards, and the ship’s
stores are inspected for risk items and pests. Any risk items should be detected at this stage and
biosecurity messages communicated to passengers.
Upon arrival at port passengers are allowed to disembark with only bottled water. To reduce risk, fruit
served at meals during the cruise is peeled and cut to discourage passengers attempting to take it ashore.
MPI also take a risk profile based approach to cruise ships, as they do for other border pathways and
apply a high level of intervention for high risk items and a much lower level of interventions for low risk
items. The risk profile for cruise ships primarily consists of the number of ports in New Zealand the ship
has visited prior to the port of interest, with the first New Zealand port considered the highest risk and
then decreasing for subsequent ports thereafter. Compliance history of the vessel is another important
factor for risk profiling. Vessels with a good compliance record are considered low risk and subject to less
interventions than those with poor compliance records. Interventions are an inconvenience to both
passengers and crew and therefore act as an incentive for ships to create a good compliance record.
Regardless of the risk profile, all vessels are met by an MPI officer in port, low risk vessels are subject to
spot checks and hand searches, while high risk vessels receive more comprehensive searches (that
sometimes includes detector dogs) on a higher number of passengers. MPI report that compliance from
cruise ships has been good and consider this to be a pathway of much lower risk than international air
passenger arrivals, given the timeframe cruises have for communication, and the restrictions that
passengers are to disembark without luggage and only bottled water.
Summary
Cruise ship routes, compliance history and the restriction that passengers may only disembark with
bottled water should make this a low risk pathway. Slippage monitoring is required to determine if this
statement is true. MPI does perform their own verification monitoring on a certain number of passengers
to ensure that risk profiles hold true but a larger report into slippage monitoring by the MPI Performance
Assurance Group (PAG) would be useful to determine the residual risk this pathway presents after pre-
12 Kiwifruit Vine Health Inc www.kvh.org.nz [Border Report, Matt Dyck, August 2013]border measures and border interventions. The high number of passengers and crew using this pathway
may warrant the use of detector dogs to screen disembarking passengers, especially when Tauranga is the
first or second New Zealand port visited.
Recreational Vessels
Background
In addition to the Port of Tauranga, Tauranga has another Place of First Arrival, the Tauranga Bridge
Marina for yachts. There are typically around 20-30 arrivals per yacht season in Tauranga, but this
decreased significantly since the MV Rena incident in 2011.
What are the risks?
Biosecurity risks may be present on recreational vessels in the vessel structure, foodstuffs, animals or
plants on board, refuse, or on passengers and crew.
How are risks being managed?
All yachts into Tauranga are met on arrival by MPI and New Zealand Customs Services. Vessels may opt
for “full clearance” or partial clearance called “coastwise”. MPI reports that the vast majority vessels
entering Tauranga opt for full clearance which involves the removal, treatment or disposal of any items
not permitted under an Import Health Standard (IHS) which includes any potential pests or diseases
carried directly on the vessel structure.
Coastwise clearance means that vessels do not receive full clearance and remain under biosecurity
surveillance while in New Zealand territorial waters to ensure they comply with specific biosecurity
conditions and garbage control (garbage removed and disposed of the same way as commercial vessels).
Coastwise vessels are only permitted to visit ports approved as places of first arrival subsequent to their
port of arrival and must seek permission to do so. MPI state that this option is only taken by some super-
yachts with animals on board, in which case they will be bonded with a payment of up to $10,000 and
subject to weekly inspections cost recovered at an hourly rate and permitted only one movement with
approval from a senior advisor in Wellington.
MPI state that yachts have a high compliance rate with inspectors taking a close examination of the entire
yacht looking for risk items. Common seizures are generally food items such as fruit, meat, seeds and
dairy products. Most of the yachts that come into Tauranga as a first port are local residents who are
based here and have headed up to the islands to have a warmer winter and familiar with MPI’s
biosecurity requirements. The remainder are generally delivery crews sailing a vessel purchased offshore
to New Zealand or race events such as the clipper round the world yacht race where crews are extremely
weight conscious eating freeze dried foods rather than fresh and considered low risk.
Summary
Recreational vessels receive a thorough inspection from MPI on arrival, and given the type of passengers
that make up the majority of vessels using this pathway it should present low risk. As per the pathways
above, MPI does perform their own verification monitoring on a certain number of vessels to ensure that
risk profiles hold true but a larger report into slippage monitoring by the MPI Performance Assurance
Group (PAG) would be useful to determine the residual risk this pathway presents after pre-border
measures and border interventions.
13 Kiwifruit Vine Health Inc www.kvh.org.nz [Border Report, Matt Dyck, August 2013]Rotorua Airport
Background
Rotorua International Airport is one of seven international airports in New Zealand. International flights
began between Sydney and Rotorua in December 2009, initially with 3 flights per week, but in January
2010 these were reduced to 2 flights per week that arrive Tuesday and Saturday afternoons. However
there have been a number of instances of flights being cancelled due to low demand, especially in the
winter months.
Air New Zealand is currently operating an Airbus 320 on the Sydney to Rotorua route, and the airport’s
annual report indicates that 23,035 international passengers moved through the airport in 2012. This
figure covers both departing and arriving passengers, and MPI’s records indicate from July 2011 to May
2012 that 10,452 passengers were processed (these are the actual number of passenger arrivals from
Australia and excludes crew). The number of passengers arriving was down from the year before by over
1,300 passengers, reflecting the general lower trend of passenger arrivals for all NZ airports apart from
Queenstown which had 97,226 arrivals up nearly 10,000 from the year previous.
The airport’s MPI approval notice restricts passenger and crew numbers to 160 per flight, so that staffing
is sufficient to process this maximum number of passengers. MPI staffing for a flight is 4 staff, and the
personnel involved all come from Tauranga and are based at the port in Mount Maunganui.
Most flights arrive with passenger numbers that are well below this so that MPI staffing levels should be
more than adequate to process arriving passengers. On the basis of 2 arriving flights into Rotorua per
week with 10,452 passenger arrivals over the year indicates on average 100 passengers per flight, well
within the limit imposed by MPI.
During a KVH visit to the airport, a flight being processed by MPI, which involved 91 arriving passengers,
70 New Zealanders, 20 Australian’s and 1 European. This mix was consistent with other arriving flights
according to MPI.
What are the risks?
Air passengers present a much different risk to cruise ship passengers as there is a much shorter time to
communicate biosecurity messages and there is a higher risk that passengers will have risk items on them.
Of the possible risk items entering New Zealand, fruit would be one of the highest concerns given the
presence of the Queensland Fruit Fly in Australia, among other unwanted pests and diseases. However
trans-Tasman flights are considered low risk, and Australians and New Zealander passengers are also
considered low risk due to their familiarity with biosecurity procedures and regulations. As a result
Rotorua Airport MPI staff only issue between two to four infringement notices per year for these flights.
How are these risks being managed?
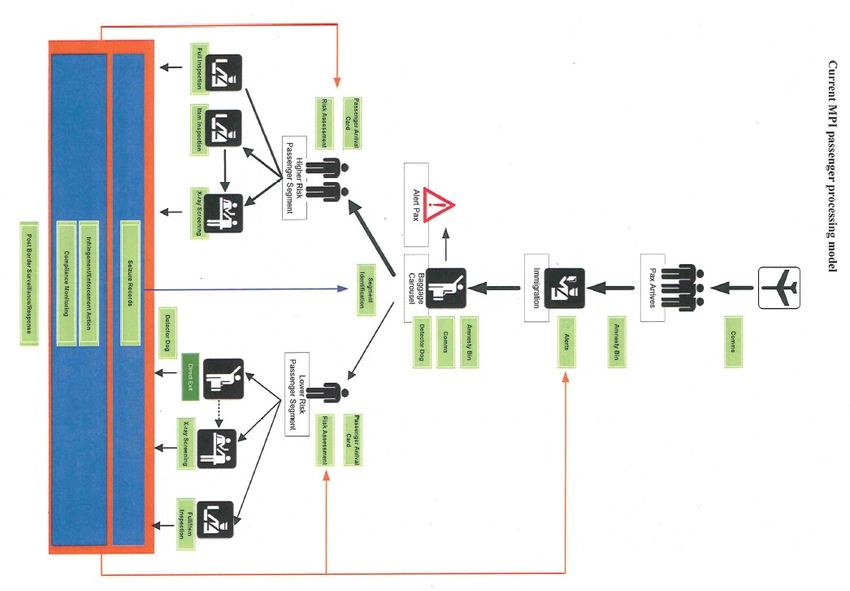
A variety of measures are used in passenger processing, including awareness material, inflight
announcements, arrival cards, amnesty bins, risk assessment, x-ray machines and full searching. A copy of
the passenger processing model used by MPI at airports is attached (Appendix 1). All these measures for
passenger processing are available at Rotorua Airport, but the one additional measure that is not
available is the use of a detector dog which is used in some other New Zealand airports in the arrival hall
baggage carousel area, and also in the direct exit lane.
14 Kiwifruit Vine Health Inc www.kvh.org.nz [Border Report, Matt Dyck, August 2013]Observations from a KVH visit to the Rotorua Airport reported that facilities were compact but appeared
adequate for the passenger numbers, with good signage including a prominent sign over the baggage
carousel of a $400 fine if biosecurity risks not declared. There were two amnesty bins for passengers to
dispose of risk items before being processed with good associated signage on both. Immediately after
Customs MPI had two risk profilers who spoke to every passenger asking if they had any biosecurity risk
and clarifying any biosecurity related question from the passengers. After baggage collection there was
another MPI officer questioning them and reading their declaration card, before their bags were either x-
rayed or searched based on the MPI risk profiling activities, or they were allowed to direct exit. The
majority of passengers went through the x-ray lane, with no risk goods identified, and only one passenger
on the flight had a risk item, dirty shoes, which were declared, and these were cleaned before the
passenger exited.
Having observed the arriving flight KVH felt that MPI had more than sufficient trained resource to process
the passengers, and that the standard they operated to was very high in ensuring that biosecurity risks if
present were identified. The risk profile of passengers was low, and with the flight departing from Sydney
meant there was also a low risk compared to other Australian ports. Having a detector dog at Rotorua
when arriving international passengers are cleared would have two potential additional benefits,
detecting biosecurity risks on passengers that are not identified by risk profiling or x-raying, and in raising
biosecurity awareness of biosecurity requirements to arriving passengers.
Not all passenger bags at Rotorua are x-rayed, and MPI reports that nationwide 42% of passengers use
direct exit, with Wellington having the highest level in 56% of arriving passengers using direct exit,
predominantly due to the flights being Trans-Tasman and having a higher portion of the NZ and Australian
passport holders being eligible to use direct exit. Observation at Rotorua Airport indicated 20% of
passengers were direct exited, and remainder were sent through x-ray lane or were searched.
Providing MPI are operating a fully resourced and trained processing team, that is meeting or exceeding
the compliance objectives of 98.5%, then a maximum of 1.5% of passengers (over 150) are leaving the
airport each year with biosecurity risks present, which may not be significantly reduced by having a beagle
present.
Summary
Rotorua Airport seems to present a low biosecurity risk and from an airport perspective there is a far
greater risk from passengers arriving in Auckland given that is where over 70% of international passengers
land and is located only two hours from the Bay of Plenty. An objective assessment would suggest that it
would seem more logical to work with MPI in reducing the greatest risk (from Auckland), than by trying to
reduce an already very low risk even lower in Rotorua.
15 Kiwifruit Vine Health Inc www.kvh.org.nz [Border Report, Matt Dyck, August 2013]Recommendations and future directions
This paper reviews border interventions at two ports of entry in the Bay of Plenty, the Port of Tauranga
and Rotorua Airport. The paper provides an overview of the potential pathways that pests may enter
these ports and some of the border interventions used by MPI to mitigate the risk that these pathways
present, as part of a wider biosecurity system. MPI operates risk profiling and performs verification audits
to confirm that profiles hold true and allocate border resources accordingly.
The following actions are recommended to strengthen this process:
1. MPI’s Process Assurance Group (PAG) should undertake a large-scale slippage-monitoring study
for container imports, cruise ship passengers and recreational vessels, similar to the Passenger
Compliance Report for airports completed in July 2012. This would provide a better
understanding of the level of residual risk that each pathway presents after MPI pre-border
measures and border interventions.
2. MPI should provide to KVH pest identification records for years more recent than 2009. These
apparently exist but were not provided to KVH when requested. Access to these records would
provide evidence that MPI is using this information to respond to emerging risks, and would be a
useful for industry to recognise what is being intercepted at the border and better prepare for
post-border surveillance and response should an incursion occur. It would also be useful
information as part of an MPI-industry partnership.
3. MPI should provide records of more recent interception data of pests on kiwifruit from Italy.
Between 2005 and 2009 there were five border interceptions of pests on kiwifruit from Italy, but
there is no evidence as to what has happened since 2009. A record of more recent interception
data would reveal if MPI has successfully mitigated this risk by working with Italian authorities or
exporters.
4. There should be a closer examination of the large number of transitional facilities to determine
the risk they may present.
5. MPI should use detector dogs to screen disembarking cruise ship passengers at the Port of
Tauranga due to the high number of passengers and crew entering the city via this pathway.
The systems employed by MPI at these ports of entry should be consistent with other ports of entry in
New Zealand. Using these principles a similar approach could be taken and expanded to consider other
ports of entry, and other pathways that may not have been included in this report.
16 Kiwifruit Vine Health Inc www.kvh.org.nz [Border Report, Matt Dyck, August 2013]Appendix 1 17 Kiwifruit Vine Health Inc www.kvh.org.nz [Border Report, Matt Dyck, August 2013]
You can also read