Associated British Ports Port of Southampton Fifth Cruise Terminal Full Business Case - MHCLG Funding - Solent LEP
←
→
Page content transcription
If your browser does not render page correctly, please read the page content below

Redacted Version

                   Associated British Ports
                    Port of Southampton
                    Fifth Cruise Terminal
     Full Business Case – MHCLG Funding

                                              1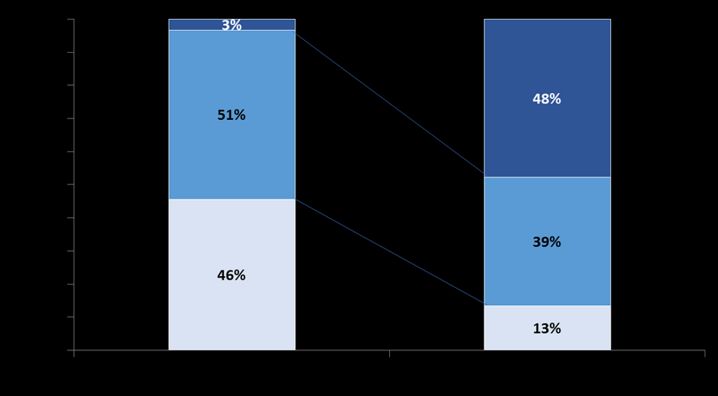
Redacted Version

Contents
1     Executive Summary ......................................................................................................................... 3
2     Strategic Case .................................................................................................................................. 4
3     Project Proposals ............................................................................................................................ 7
4     Economic Case ................................................................................................................................ 8
    4.1      Options Considered................................................................................................................. 8
    4.2      Methodology for CBA.............................................................................................................. 9
    4.3      Economic assumptions of additional calls ............................................................................ 12
    4.4      Investment costs and benefits .............................................................................................. 13
    4.5      Cost Benefit Analysis ............................................................................................................. 14
    4.6      CBA Sensitivities .................................................................................................................... 14
    4.7      Solar Benefits ........................................................................................................................ 15
    4.8      Methodology for Job Creation .............................................................................................. 16
    4.9      Job Creation Figures .............................................................................................................. 17
5     Financial Case ................................................................................................................................ 18
    5.1      Project cost breakdown ........................................................................................................ 18
    5.2      Spend Profile ......................................................................................................................... 18
    5.3      Revenue and Affordability Information ................................................................................ 19
    5.4      Funding Contribution ............................................................................................................ 22
6     Management Case ........................................................................................................................ 23
    6.1      Procurement route ............................................................................................................... 23
    6.2      Project Plan ........................................................................................................................... 23
    6.3      Project Management ........................................................................................................... 24
    6.4      Internal Governance ............................................................................................................. 24
    6.5      Monitoring Performance ...................................................................................................... 25
    6.6      Statutory consents and legal agreements ............................................................................ 26
7     Risk Management ......................................................................................................................... 27
    7.1      Project Construction Risk ...................................................................................................... 27
    7.2      Project Finance Risks............................................................................................................. 28

                                                                                                                                                       2
Redacted Version
1 Executive Summary
The Port of Southampton is one of the world’s leading cruise ports and is a major economic
generator in the Southampton and Solent region. The Port typically handles over 500 cruise
ship calls a year and over 2 million passengers. The Port operates in a globally competitive
marketplace and competes hard for ship calls with ports in Europe and around the world.
The cruise sector has been growing strongly for a number of years - both in terms of the
number and, in particular, size of cruise ships operating. Southampton is the only port in the
UK equipped to accept the new generation of large cruise ships (over 5,000 passengers).
The Port has been working to grow market share at the expense of other mainland
European ports and has secured contracts with two cruise lines to operate from
Southampton for the next twenty years. These contracts require additional cruise capacity in
the Port in the form of a major new cruise facility - the Port’s fifth cruise terminal.
Whilst the income from the two lines is welcome, it is not sufficient to justify investment in a
new cruise terminal on its own. The project to construct a new cruise terminal was signed off
by the ABP Board in Summer 2019 with a business case assuming other cruise customers
would be secured soon after terminal opening in 2021.
Enabling works commenced in 2019 and the contract was awarded in March 2020 to Brymor
Construction Ltd to deliver the new Terminal for commencement of operations in April 2021.
When the impact of Covid-19 on the cruise sector became apparent, work on the project was
paused due to supply chain uncertainty and consequently the additional costs required to
deliver the facility in time for the start of the 2021 cruise season as planned.
Whilst the 30 ship calls of the two new lines guarantee have a value to the wider UK
economy of over £80million in the first year alone, the value to ABP of these two operators
alone is small and not sufficient to justify the completion of the terminal in 2021.
There is very a high confidence level in the medium and long term future of cruise sector,
notwithstanding the very real impact the current global pause of cruise is having on the city
of Southampton and the wider economy.
The prospect of support from the government’s Getting Building programme was sufficient
for ABP to instruct a partial restart of work to allow programme to be maintained for
completion in 2021 whilst the grant is being considered.
ABP is seeking funding of £8million in order to allow the fifth terminal to open as originally
planned and to prevent the two new cruise line customers from being lost to the UK and
diverting their ships to operate in other European ports such as Hamburg and Kiel.
The terms of the contracts with these two new customers are such that, without the terminal,
the lines will not call in Southampton as planned. If this funding is confirmed, the project can
be completed for the cruise season in 2021, securing the benefits of the additional cruise
ship calls for the Solent and wider area.
This report considers the economic benefits, affordability and management of the proposed
terminal which is assessed to generate a BCR of 112 to 1 over the lifetime of the project and
a BCR of 10:1 for the public funding element in the first year alone.
3Redacted Version
2 Strategic Case
The Port of Southampton is Europe’s leading embarkation cruise port, typically welcoming
around 2 million passengers per annum on 500 cruise calls.
The Port of Southampton operates in the global cruise market. Some 85% of UK cruise
embarkations (Home Port Call) are through the Port of Southampton, facilitating in the order
of 14,000 jobs in the Solent region. Each cruise vessel call is worth on average £2.7 million
to the economy through passenger and line spend with more than half of these benefits
estimated to stay in the Solent area1.
No other UK port can handle the large cruise vessels and liners that call in Southampton.
Cruise activity at Southampton mirrors that of the global cruise market. The long-term future
for cruises in Southampton is positive. Southampton’s geographical location means that it is
ideally placed to take advantage of voyages to the Mediterranean and Baltic areas, as well
as transatlantic cruises. Over the longer term to 2040, ABP forecasts that Southampton will
welcome almost 700 cruise call days every year and up to 4.5 million passenger
movements, sustaining existing employment numbers and generating growth in both
employment and gross value added (GVA).
Southampton Cruise Market Forecast to 2040
5,000
XXXXXXXXXXXXXXXXXXXXXXXXXXXXXXXXXXXXXXXXXXXXXXXXXXXX
4,500
XXXXXXXXXXXXXXXXXXXXXXXXXXXXXXXXXXXXXXXXXXXXXXXXXXXX
Passenger volume (‘000 passengers)
4,000
XXXXXXXXXXXXXXXXXXXXXXXXXXXXXXXXXXXXXXXXXXXXXXXXXXXX
3,500
XXXXXXXXXXXXXXXXXXXXXXXXXXXXXXXXXXXXXXXXXXXXXXXXXXXX
Near term capacity
3,000
XXXXXXXXXXXXXXXXXXXXXXXXXXXXXXXXXXXXXXXXXXXXXXXXXXXX
2.5M pax
XXXXXXXXXXXXXXXXXXXXXXXXXXXXXXXXXXXXXXXXXXXXXXXXXXXX
2,500
XXXXXXXXXXXXXXXXXXXXXXXXXXXXXXXXXXXXXXXXXXXXXXXXXXXX
2,000
XXXXXXXXXXXXXXXXXXXXXXXXXXXXXXXXXXXXXXXXXXXXXXXXXXXX
1,500
CAGR = 11.4%
XXXXXXXXXXXXXXXXXXXXXXXXXXXXXXXXXXXXXXXXXXXXXXXXXXXX
1,000
XXXXXXXXXXXXXXXXXXXXXXXXXXXXXXXXXXXXXXXXXXXXXXXXXXXX
500
XXXXXXXXXXXXXXXXXXXXXXXXXXXXXXXXXXXXXXXXXXXXXXXXXXXX
0
XXXXXXXXXXXXXXXXXXXXXXXXXXXXXXXXXXXXXXXXXXXXXXXXXXXX
2000 2005 2010 2015 2020 2025 2030 2035 2040
Historic Low Base High
For the UK to secure this increased activity, additional terminal capacity is required to ensure
that Southampton retains its place as a primary embarkation port as well as one that is
increasingly attractive to [day] calling cruises.
The Port must continue to innovate and provide world class infrastructure if we are to retain
these global brands, the benefits to the local economy and the transition to zero emissions in
the maritime economy.
In addition, the Cruise Lines International Association (CLIA), which represents 95% of the
global cruise capacity, notes that 19 new build ships are due to enter service in the next few
years2. New builds show a shift towards larger vessels, which deliver higher yields and
increase port infrastructure challenges. Globally, cruise travel makes up less than 3% of the
1
Economic Significance of the Port of Southampton (2019) Deloitte and Ekosgen (Internal Report)
2
CLIA 2019 State of the Cruise Industry Outlook https://cruising.org/-/media/research-updates/research/state-of-the-cruise-industry.pdf
4Redacted Version
holiday market. With c 25.3 million passengers sailing in 2017, compared to 15.8 million in
2007, supported by new vessel build investment of c.$53bn to 2026, strong growth is expected
to continue.
New build cruise vessels order book 2016-2026 showing increase
in vessel size
ABP wishes to capitalise on this increased demand, to grow passenger volumes and maintain
both our strong UK market position and our Europe leading turnaround cruise status.
The development of a fifth cruise terminal enables Southampton to cater for new business
from new larger ships and to secure and sustain existing cruise business which is at risk of
moving to competing ports – including Hamburg and Kiel - if terminal capacity cannot be
secured by lines for peak [weekend] periods.
Southampton has a strong record of delivering cruise infrastructure supporting industry
growth. Recent investments in all four existing terminals with Royal Caribbean Cruise Line
and Carnival Corporation include building Ocean Terminal in 2009; the redevelopment of City,
QEII, Ocean and Mayflower Cruise Terminals completed in 2015, and the current
redevelopment of Ocean for deployment of P&O Iona (2020).
The travel and tourism sector has been particularly hard hit by Covid-19. The cruise sector in
particular which generates over £10 billion3 to the national economy each year has not yet
announced when the full cruising programme will resume. Clearly the easing of restrictions
throughout the whole of the travel and tourism sector is not yet confirmed and thus the
situation remains fluid.
The Port has remained operational throughout the Covid-19 lockdown period and ABP has
implemented appropriate working procedures and measures to keep staff and port users
safe. ABP does not see any impediment to resuming full operational functionality when the
cruise market resumes.
Working with the cruise lines, ABP has identified a number of key drivers that point to a
strong recovery in 2021.
3
CLIA 2020
5Redacted Version
Table 1 Cruise Sector Recovery Drivers
Recovery Driver Evidence
A high proportion of 2020 cancellations have taken
vouchers rather than refunds and rebooked for 2021.
Pent-up Demand For example:
Royal Caribbean: >55%
Saga: >50%
CLIA Survey data on likelihood to return to cruising
Strong Cruising Sentiment showed only a decline of just 1% from 80% in
December 2019 to 79% in April 2020
For modern vessels, break even capacity is c. 30%,
therefore cruises can proceed and be profitable even
Favourable Break Even Points
if social distancing means they cannot achieve usual
occupancy or yield levels
Lines are promoting positive marketing and putting in
place measures to reassure passengers such as pre-
Positive Marketing boarding screening, free medical checks, re-
configuration of air handling and tighter destination
procedures.
86% of UK Home Port calls (embarkation and disembarkation) take place in Southampton.
Southampton is the only UK port capable of handling the larger cruise vessels that will
increasingly dominate the cruise market. We are confident that the market will return to
passenger numbers seen in the past few years in the 2021 cruise season with further growth
thereafter.
With the offer of a fifth cruise terminal, Southampton can safeguard the UK’s market position
by delivering suitable capacity to lines that do not regularly call at present. This is a forward-
looking decision based on belief in medium and long term prospects of the cruise industry.
By taking this step, all major and medium sized cruise lines will see Southampton as the port
of choice for years to come in a very important north European market, and with a fleet
composition that continues to welcome larger vessels to the fleet.
Enabling works commenced in 2019 and the contract was awarded in March 2020 to Brymor
Construction Ltd to deliver the new Terminal for commencement of operations in April 2021.
When the impact of Covid-19 on the cruise sector became apparent, work on the project was
paused due to supply chain uncertainty and consequently the additional costs required to
deliver the facility in time for the start of the 2021 cruise season as planned. MHCLG
funding is imperative to release the economic benefits to the wider economy that are
generated by this proposal. The shareholders and the ABP Board have agreed that
construction to completion will recommence if the funding is secured
If ABP is unable to secure funding the economic opportunity of £85M will be lost in year 1
alone.
NB Effects of shore power have not been included in this appraisal document
6Redacted Version
3 Project Proposals
This scheme will deliver a fifth cruise terminal in Southampton capable of supporting single
large ship (c. 6,500 passengers) Home Port Calls (HPCs) or dual small/medium ship (c.
3,000 passengers) Port Calls (PCs).
The facility is scoped to deliver an agile, customer centric, handling capability for a wide
range of current and planned cruise ships. The building will also be constructed with a solar
installation that is designed to be a net contributor in terms of energy generated compared to
predicted energy consumption.
A new cruise terminal (“the proposed development”) is proposed immediately adjacent to
Berth 102 in the Western Docks. The Terminal will comprise of a high quality designed
building that will provide an internal floorspace of approximately 8,900m² and with a height of
approximately 10m above the surrounding ground level.
The proposed building will provide the operational requirements of a modern day cruise
terminal, and will have the ability to accommodate the new generation of cruise vessels. The
building will be served by a delivery area, and by access facilities for coaches and cars.
The access facilities include:
• Vehicle access routes to and from the Terminal building and associated facilities from
Dock Gate 10;
• new and improved pedestrian and cycle access from Dock Gate 10;
• coach parking – to enable in the order of 60 coaches to park in close proximity to the
terminal building;
• a passenger drop-off area located immediately adjacent to the terminal building; and
• 330 parking spaces for use by passengers located in close proximity to the terminal
building – with charging facilities for electric vehicles.
7Redacted Version
4 Economic Case
The aim of this section is to demonstrate that the proposed investment in new cruise
facilities delivers high value for money. We can demonstrate that the project is expected to
deliver as least 112.6:1 benefit to costs ratio (BCR) in the considered scenario.
The analysis in this section has been conducted in accordance with the recommendations of
HM Treasury Green Book on appraisal and evaluation.
4.1 Options Considered
In accordance with Green Book Guidance, options were considered at the preliminary stage
by ABP in order to identify the preferred option. Subsequently, detailed societal cost benefit
analysis (CBA) was undertaken for the preferred option.
A review of the future infrastructure required to accommodate the future demand for cruise
travel identified the following long list of options:
Option 1 – Business as usual or no action taken.
Option 2 - Consider intensifying the use of existing terminals on days when there is currently
reduced demand, eg midweek.
Option 3 – Operation of a temporary terminal to facilitate demand
Option 4 – Construction of a new landmark terminal building that would enable increased
numbers of cruise calls to Southampton.
Table 2 Long List of Options
Option Advantages Disadvantages
Option 1 – Business as None identified No additional cruise activity. Loss of existing
usual or no action cruise customers as existing cruise lines with
taken preferential berthing intensify use of weekend
peak capacity.
Consequence is loss of cruise activity to non
UK ports.
Option 2 – Consider This option would intensify the This option would lead to a loss of cruise
intensifying the use of efficiency and throughput of an activity and corresponding economic value
existing terminals on individual terminal and we within the supply chain.
days when there is continue to pursue this with calling We have engaged with the cruise companies
currently reduced cruises. in respect of utilising the terminal on midweek
demand, eg midweek days, eg Mondays, Tuesdays, Thursdays with
reduced fees; however, there was little or no
enthusiasm for this offer.
The consequence is that cruise lines could
relocate to other non UK ports eg Hamburg
and Kiel where capacity is available.
MSC trialled increased turnaround calls mid-
week due to insufficient peak availability - in
the subsequent year they reduced calls,
redeploying the increased volume via
Hamburg due to lack of passenger demand.
Option 3 - Operation of Provides a short term solution for As cruise ships new builds are increasingly
a temporary terminal to a small proportion of cruise calls larger vessels, temporary terminals are not
facilitate demand that can physically be operated suitable for the majority of vessels resulting in
through a temporary facility if the vessel bookings being rejected. This situation
cruise line will accept a lesser has occurred with bookings from existing and
guest experience. new cruise lines.
Even if cruise ships can be operated through
a temporary terminal, they provide a lesser
8Redacted Version
Option Advantages Disadvantages
guest experience and are not desired by
cruise lines and guests. Cruise lines such as
Saga, which can technically be operated
through a temporary terminal, have rejected
use of temporary terminals due to the lower
guest experience.
Consequence is loss of cruise activity to non
UK ports.
Option 4 - Construction Provides additional and dedicated Capital Cost
of a new landmark berth and terminal capacity;
terminal building increases ABP revenue and
significantly enhances GVA to the
city and region.
Option 4 emerged as the preferred option as this is the option that would be most effective
as accommodating increased demand and present the most attractive solution for cruise line
customers.
4.2 Methodology for CBA
Social cost benefits analysis for the preferred option is presented below and is based on net
present value of economic costs and benefits include investment and its multiplier effects,
economic impacts that additional calls bring to the economy with multiplier effects.
The economic and environmental costs and benefits have been monetised, with their
respective assumptions and detailed results presented below. The Net Present Value (NPV)
of costs and benefits as well as Benefits to Costs Ratio (BCR) are calculated in and
discounted to year 2020.
The total costs and benefits have been compared under the following two scenarios:
• Baseline scenario: Business as usual with no additional cruise passenger berths or
facilities.
• Option 4 scenario: the construction and operation of a new terminal meaning that the
Port will be able to attract around 80 additional vessels and 190,000 passenger
movements per annum.
The impacts calculated within this social cost benefit analysis are relative to the Baseline
scenario stated above.
Baseline scenario
Our Baseline scenario assumes no increase in the number of calls per annum.
Under the baseline scenario, the Port is effectively capped at its current capacity of 500
cruise vessels per annum. Whilst it may be possible for a small number of additional calls to
be accommodated under the Baseline Scenario, all four existing cruise terminals are in use
for the duration of the main cruise season which extends from March through to October.
Thus additional call volumes have been discounted from further analysis.
9Redacted Version
New Cruise Terminal scenario
ABP expects the number of additional cruise ship calls in Southampton Port to follow the
profile below.
Table 3 Base assessment case illustrating the predicted number of calls over the asset’s lifetime
Year Year No. Additional Ships during year
1 2021 30
2 2022 30
3 2023 30
4 2024 30
5 2025 50
6 2026 50
7 2027 60
8 2028 60
9 2029 60
10 2030 60
11 2031 80
12 2032 80
13 2033 80
14 2034 80
15 2035 80
16 2036 80
17 2037 80
18 2038 80
19 2039 80
20 2040 80
21 2041 80
22 2042 80
23 2043 80
24 2044 80
25 2045 80
Assumptions
• The model is set up using real 2019 prices. Impacts are discounted at a rate of 3.5%,
as recommended for social appraisal in the Green Book, and are discounted to the
year 2020.
• The evaluation period is set to 25 years in operation to reflect the full life of assets,
which is estimated to be between 25 and 30 years.
• The facility is assumed to be open for business in May 2021.
• The business case assumes that two customers are signed up to operate from the
terminal in 2021 if the terminal is completed for 30 calls per annum. ABP assumes that
additional customers are taking space in 2025 and 2027. Revenues are guaranteed
from these two customers for 20 years.
• The split of Home Port Calls and Port of Calling or Calling Cruises is estimated to be
90/10. There are currently around 500 cruise calls at Southampton each year, 90% of
which are Home Port Calls (HPC). The composition of calls between HPCs and “Port
of Call” calls (PC) is assumed to stay constant. An HPC is where a ship will have a
10Redacted Version
high turnover of passengers, while also restocking supplies, whereas, a PC is a mid-
journey stop.
• The average economic value generated by a cruise vessel is £2.7M. A HPC vessel is
stated to be worth £3.0m to the economy and a PC vessel £1.5m4.
Interdependencies
There are no identified interdependencies associated with this project.
Additionality considerations
The following groups of actors are expected to be affected by the project:
• The Ministry of Housing, Communities and Local Government (MHCLG), as the
party providing £8M of funding.
• Associated British Ports (ABP), as the party providing the remainder of funding
requirement (£34M) and being responsible for annual maintenance costs.
• Vessel owners/ operators, as the parties who will be able to identify Southampton as
part of their cruise itinerary.
• Suppliers of infrastructure providers, including construction sector, who will see an
increase in demand for their services triggered by the activity of infrastructure
providers.
• The service-oriented economic sector of Solent area, which would see an increase
in its economic activity as a response to more passengers arriving to the region.
• The Solent region, the citizens of which will experience the economic effects of
additional cruise activity.
Analysing these different groups of stakeholders and their potential intersections, the
following additionality factors have been identified:
1. There have been a number of studies into the benefits of the cruise sector over
time, which have also been used by the LEP in various source documents. The
figure which is regularly referenced is the average £2.5 million benefit per call
which originated in an Atkins 2011 report. We have recently commissioned an
internal review (Deloitte / Ekosgen, 2019) which estimates this figure as being £2.7
million per call on average.
2. The Cruise Lines International Association (CLIA) has produced figures estimating
the value of cruising to the UK economy (June 2020). With Southampton
representing 86% of the home port call market, our data is consistent with that
produced by CLIA. CLIA information highlighted that a 90 day shutdown in UK
cruise activity has an economic loss of £888 million representing 5,525 jobs and
£287 million in wages. Given Southampton’s importance in the UK cruising market,
much of this impact will be reflected in the Southampton and Solent area.
4
Economic Significance of the Port of Southampton (2019) Deloitte and Ekosgen. Internal Report for ABP
11Redacted Version
3. With the wider economic benefits felt within the regional area, there are significant
opportunities as a result of this proposal to create employment and value in the
supply chains of port services, general maritime services, marine engineering as
well as the wider leisure and tourism sector.
4. The costs and benefits included in the analysis are considered to be part of the net
impacts, as the effects correspond to different agent groups or are not
compensated or double-counted. An example of the latter is the service-oriented
economic sector of the Solent area that would enjoy benefits due to: higher
economic activity during the construction period; higher economic activity if the
Port hosts more cruise calls when the project becomes operational; and also as a
part of the City of Southampton who will enjoy environmental benefits of the
project.
As stated above, economic benefits comprise economic impacts of additional calls,
additional employment and benefits associated with investment.
4.3 Economic assumptions of additional calls
The main scenario examined includes the assumption that an investment in additional
terminal capacity results in additional calls from cruise ships. These calls include both HPC
and PC, of which HPCs make up 90% of total calls and PCs account for 10% of calls
according to ABP projections.
The economic benefit of these additional calls is calculated by applying Gross Value Added
(GVA) economic multipliers to the number of additional calls to capture the benefits to local
businesses or increased passenger footfall, and the resulting increase in demand. These
economic multipliers were calculated on the basis of data on the economic significance of
the Port of Southampton, which estimated the direct and secondary impacts of cruise ship
calls separately for HPCs and PCs.
The HPC GVA multiplier is £3m per call, with 53% of this value estimated to stay in the
Solent region. The PC GVA multiplier is £1.5m, with 51% of this value estimated to stay in
the Solent region. These multipliers, and estimations of the percentage of the benefit of
additional calls accruing to the local area, are based on estimations by Deloitte (2019)5.
5
Economic Significance of the Port of Southampton (2019) Deloitte and Ekosgen. Internal Report for ABP
12Redacted Version
Table 4 Economic impact assumptions
Assumption Value Source
Home Port Calls
HPC share of calls 90% ABP
HPC national GVA multiplier (per call) £3 million Deloitte (2019), ABP confidential
Benefit (GVA) accruing to local Solent region 53% Deloitte (2019), ABP confidential
HPC FTE multiplier (FTEs/call) 60.26 Deloitte (2019), ABP confidential
Benefit (FTE) accruing to local Solent region 53% Deloitte (2019), ABP confidential
Port Calls
PC share of calls 10% ABP
PC national GVA multiplier £1.5 million Deloitte (2019), ABP confidential
Benefit (GVA) accruing to local Solent region 51% Deloitte (2019), ABP confidential
PC FTE multiplier (FTEs/call) 20.12 Deloitte (2019), ABP confidential
Benefit (FTE) accruing to local Solent region 43% Deloitte (2019), ABP confidential
Upon delivery of the new cruise terminal project when the additional calls are realised,
supplies for the cruise ship (e.g. food, equipment and general consumables) are available
within the region for purchase by the cruise line. To account for supply chain effects that do
not necessarily take place locally, our calculations assume that only a share of the economic
benefits due to additional calls will stay in the Solent area, according to estimations by
Deloitte6.
4.4 Investment costs and benefits
A total investment of £42.0M is assumed to be spent to open the terminal in time for the
2021 cruise season with a total spend of £25.3M in the calendar year 2020 and £16.7M in
the calendar year of 2021.
Although these investment costs represent a fixed-price quote by suppliers, one of the
sensitivities presented in section 4.64.6 considers a case where investment costs are 10%
higher (lower bound for capital expenditure optimism bias adjustment for Equipment /
development, according to the optimism bias guidance in the Green Book).
As this is a project that has already commenced but placed on hold because of Covid-19,
ABP has undertaken on going dialogue with suppliers and contractors during the lockdown
period and adjusted pricing and timeframes to reflect the present economic and employment
conditions.
In the sensitivity analysis, we also explore the consequential benefit that this investment will
have through the supply chains of the construction sector. The benefit of the investment to
the local economy is calculated by calculating the GVA multiplier effect to the investment
total. These benefits are a result of higher economic activity in the supply chain as a result of
investment, including job creation.
To capture the impact on the Solent area only, these benefits have been adjusted to reflect
the expected proportion of the economic benefits that would remain in the local economic
area. In this sense, the calculations assume that 90% of the suppliers would come from the
local/regional area.
6
Economic Significance of the Port of Southampton (2019) Deloitte and Ekosgen. Internal Report for ABP.
13Redacted Version
4.5 Cost Benefit Analysis
In this section we present the NPV of costs, benefits and benefit to cost ratios (BCRs) for the
project. As noted above in Table 3, the base assessment case assumes that 30 additional
calls will visit the terminal in 2021 rising to 80 additional calls by 2031.
These 30 calls are guaranteed by a commercial agreement between two cruise lines and
ABP if the terminal is in place by the commencement of the cruise season in 2021.
30 cruise ships visiting Southampton in the first year of operation alone would result in
£81.0m in GVA benefits to the UK economy assuming an average benefit of £2.7m per call,
for a cost to the UK of £8M in funding.
Over the 25 year lifetime of the project the total GVA in benefits is £4,731M equating to a
BCR of 112.6:1.
4.6 CBA Sensitivities
Having considered the main business case with 30 additional calls in year 1 and 80 calls per
annum by 2031, this section considers how the benefits and BCR are affected by changes in
some of the assumptions.
The GVA of the benefits and the BCRs for a range of scenarios are presented in the table
below.
Table 4 Sensitivity analysis for CBA
Total BCR G’ment
G’ment GVA BCR Total
No. Scenario Description Project £8M
Investment benefits Investment
costs Investment
Base case number of
calls and adjustment
1 Main case of GVA benefits to £42.0m £8.0m £4,731m 112.6 591
£3.0M for HPCs and
£1.5M per PC
30 additional calls
Adjustment
starting in 2021 with
2 of HPC and £42.0m £8.0m £4,482m 106 560
average GVA per call of
PC GVA
£2.7m
Investment /
Higher construction costs are
capital costs 10% higher than
3 due to expected; 30 additional £46.2m £8.0m £4,731m 102.4 591
adverse calls starting in 2021
prices with £3.0M for HPCs
and £1.5M per PC
Fewer calls
than 10 additional calls per
4 business annum between 2021 - £42.0m £8.0m £4,266m 101.6 533
model 2024
assumptions
Lower GVA Reduction in average
5 per vessel benefits per call to £42.0M £8.0m £4,356m 103.7 544
call £2.2M GVA
Fewer calls 10 additional calls per
than main annum between 2021 -
6 £42.0m £8.0m £5,346m 127.3 668
case and 2024 investment
extension of scenario
14Redacted Version
Total BCR G’ment
G’ment GVA BCR Total
No. Scenario Description Project £8M
Investment benefits Investment
costs Investment
building Evaluation period is
lifespan adjusted to 30 years
Assumes main case
number of calls and
Adjustment
adjustment of GVA
7 of HPC and £42.0M £8.0m £3,112.5m 74.1 389
benefits to £2.0M for
PC GVA
HPCs and £0.75M per
PC
10 additional calls per
Adjustment annum 2021 – 2024
8 of calls and and adjustment of GVA £42.0M £8.0m £2,962.5m 70.5 370
GVA per call to £2.0M for HPCs and
£0.75M per PC
Adjustment Adjustment of GVA to
9 of GVA per £1.0M for HPCs and £42.0M £8.0m £1,560.4m 37.2 195
call £0.4M per PC
Sensitivity analysis shows that in all scenarios considered the BCR is 37.2 to 1 or higher
when considering total investment. This equates to a BCR of 195: when just the £8M
government investment is taken into consideration.
This lowest case scenario assumes a significantly lower GVA per call of £1.0M per HPC and
£0.4M per PC.
4.7 Solar Benefits
ABP is committed to extending our portfolio of solar generation projects on the Port estate.
Currently around 20% of ABP electricity usage is generated by solar and our ambition is to
increase this figure to >40% by end 2021.
The fifth terminal will be designed to accommodate a 850kW system on its roof structure
generating nearly 700,000 kWh of electricity per annum. The terminal will use an estimated
200,000 kWh per annum which means that it will be a net generator of power for other port
activities over the course of a year. This equates to a net saving of approximately 142,000kg
of carbon (142tCO2e) per annum.
The monetary damage avoided by not emitting a tonne of CO2 is expressed through carbon
price projections in £ per tonne of CO2e published by BEIS7. Traded prices are applied to
electricity consumption in those scenarios where the electricity emission factor differs from
zero (electricity is sourced from the grid).
The value of carbon is applied using the information published in BEIS’s Updated Short-term
Traded Carbon Values Used for UK public policy appraisal8. The low value per tonne of
carbon is £2.33; central case is £12.76 and the high case values carbon at £25.51. Thus the
monetary value placed on carbon savings ranges from £330 – £3,622 per annum.
7
https://www.gov.uk/government/publications/valuation-of-energy-use-and-greenhouse-gas-emissions-for-appraisal
8
https://www.gov.uk/government/collections/carbon-valuation--2
15Redacted Version
4.8 Methodology for Job Creation
The local economic benefits that arise due to investment in a new cruise terminal include the
creation of additional employment opportunities that would not exist under the Baseline
scenario. These jobs include those jobs created directly as a result of investment, including
construction jobs and maintenance jobs, and jobs created indirectly, due to the multiplier
effect of the investment within the local economy.
Job creation has been estimated for each year separately and then averaged out and
expressed as FTE per year for presentation purposes. Only jobs based in the Solent area
are considered for this analysis. That is, the project will have a higher impact on
employment, if this indicator is viewed on national scale.
Construction jobs
The number of construction full-time (FTE) jobs created is estimated for this business case
according to the assumption stated in the Explanatory Note included in the Solent Prosperity
Fund’s Technical Guidance: Large Projects and Programmes9. The guidance states that
projects should estimate that for every £1 million invested, this will result in 12.5 construction
jobs (FTE).
Port (ABP) jobs
The number of direct jobs (FTE) related to the ongoing maintenance of the cruise terminal is
estimated to be 5 FTEs per annum by ABP. This estimation is based on the information
available at this stage and ABP’s experience of operating existing cruise terminals at the
Port.
Additional jobs that are an indirect result of the investment are calculated by applying a
multiplier to the FTE maintenance jobs estimated to be created by the investment, according
to the average port sector FTE multiplier of 2.66 for Solent area10. The resulting additional
jobs are then adjusted to reflect the expected percentage that will remain within the area
assuming again 90% of local jobs. This equates a total of 13 FTEs.
Additional employment
Additional calls will not only bring a higher economic activity to the Solent area, but also
additional employment growth to support this activity.
Deloitte11 calculated that around 13,000 FTEs are associated with cruise activity regionally
rising to over 27,000 nationally based on 500 cruise calls and 1,800,000 passengers (DfT
2017 port throughput data) annually in Southampton. These figures are weighted by the
dominance of Carnival UK cruise activity at the Port also noting the presence of its
headquarters based in Southampton.
Assuming an increase of 800,000 passenger movements per annum associated with the
development of a fifth cruise terminal; adopting the Deloitte methodology and discounting by
80% (to account for smaller HQ activity for other lines) indicates an increase of 1,244 FTEs
or if discounted by 90% equates to an additional 622 FTEs regionally. A precautionary
9
https://solentlep.org.uk/media/2724/spf-large-projects-tech-guidance.pdf
10
The 2.66 Total Jobs multiplier is taken from figure 19 of “The economic role and contributions of the maritime sector in the Solent LEP area”, a
report for the Solent LEP and Maritime UK published in May 2018 by Cebr.
11
Economic Significance of the Port of Southampton (2019) Deloitte and Ekosgen. Internal Report for ABP.
16Redacted Version
estimate of 622 FTEs which will comprise employment opportunities associated with the
shipping line, marine services and the wider supply chain has been assumed.
4.9 Job Creation Figures
The project is expected to create the following number of jobs during the lifetime of the
project:
• 525 construction FTE during 2020/2021;
• 13 direct and indirect port-related FTEs; and
• 622 FTEs due to additional calls from 2021 onwards.
17Redacted Version
5 Financial Case
5.1 Project cost breakdown
The details of the project cost breakdown are presented below.
Terminal
Enabling Air bridges Third Party
Month construction Solar (£) Others (£) Total (£)
Works (£) (£) Suppliers (£)
(£)
Spend to
5,634,227.68
Date 1,861,891.00 922,206.00 348,250.00 2,501,880.68
Jun-20 293,410.00 89,060.59 332,875.00 132,840.87 848,186.46
Jul-20 2,027,269.00 332,875.00 132,840.87 2,492,984.87
Aug-20 2,215,369.00 522,363.64 132,840.87 2,870,573.51
Sep-20 2,465,368.00 522,363.64 132,840.87 3,120,572.51
Oct-20 2,619,012.00 522,363.64 132,840.87 3,274,216.51
Nov-20 2,676,301.00 522,363.64 132,840.87 3,331,505.51
Dec-20 2,637,235.00 522,363.64 312,847.50 80,000.00 132,840.87 3,685,287.01
Jan-21 2,501,815.00 522,363.64 312,847.50 132,840.87 3,469,867.01
Feb-21 2,270,040.00 522,363.64 312,847.50 132,840.87 3,238,092.01
Mar-21 1,941,909.00 522,363.64 312,847.50 132,840.87 2,909,961.01
Apr-21 1,517,425.00 522,363.64 312,847.50 360,000.00 132,840.87 2,845,477.01
May-21 996,586.00 1,044,727.27 312,847.50 245,277.42 2,599,438.19
Jun-21 787,685.00 11,192.54 360,000.00 112,439.21 1,271,316.75
Jul-21
Aug-21
Sep-21
Release of
Retention 408,294.00 408,294.00
Total (£) 27,219,609.00 1,022,459.12 6,760,000.00 1,877,085.00 800,000.00 4,320,846.88 42,000,000.00
5.2 Spend Profile
The following is a cumulative spend profile for the project costs.
xxxxxxxXXXXXXXXXXXXXXXXXXXXXXXXXXXXXXXXXXXXXXXXXXXXXXXXXXXXXXX
XXXXXXXXXXXXXXXXXXXXXXXXXXXXXXXXXXXXXXXXXXXXXXXXXXXXXXXXXXXXX
XXXXXXXXXXXXXXXXXXXXXXXXXXXXXXXXXXXXXXXXXXXXXXXXXXXXXXXXXXXXX
XXXXXXXXXXXXXXXXXXXXXXXXXXXXXXXXXXXXXXXXXXXXXXXXXXXXXXXXXXXXX
XXXXXXXXXXXXXXXXXXXXXXXXXXXXXXXXXXXXXXXXXXXXXXXXXXXXXXXXXXXXX
XXXXXXXXXXXXXXXXXXXXXXXXXXXXXXXXXXXXXXXXXXXXXXXXXXXXXXXXXXXXX
XXXXXXXXXXXXXXXXXXXXXXXXXXXXXXXXXXXXXXXXXXXXXXXXXXXXXXXXXXXXX
XXXXXXXXXXXXXXXXXXXXXXXXXXXXXXXXXXXXXXXXXXXXXXXXXXXXXXXXXXXXX
XXXXXXXXXXXXXXXXXXXXXXXXXXXXXXXXXXXXXXXXXXXXXXXXXXXXXXXXXXXXX
XXXXXXXXXXXXXXXXXXXXXXXXXXXXXXXXXXXXXXXXXXXXXXXXXXXXXXXXXXXXX
XXXXXXXXXXXXXXXXXXXXXXXXXXXXXXXXXXXXXXXXXXXXXXXXXXXXXXXXXXXXX
XXXXXXXXXXXXXXXXXXXXXXXXXXXXXXXXXXXXXXXXXXXXXXXXXXXXXXXXXXXXX
X
18Redacted Version
5.3 Revenue and Affordability Information
ABP has assessed the return from the project if additional customers are secured would be
6.1% if ABP was to fund in totality. ABP’s internal hurdle rate is at least 10.5% and at this
level, it has indicated that completion of the project would not proceed. With an £8M
contribution, the project return rises to 8.5% - still well below ABP’s internal hurdle rate - but
given the strategic nature of the project, ABP has indicated that it would proceed with the
project.
If funding is confirmed, ABP’s shareholders have indicated their commitment to this
proposal that will ensure the fifth cruise terminal is open for business in time to support
cruise in 2021.
Table 5 refers to the project revenue assuming grant funding.
Table 6 refers to the project revenue assuming no grant funding.
19Redacted Version
Table 5 Project revenue assuming grant funding
Table Redacted
20Redacted Version
Table 6 Project revenue assuming no grant funding
Table Redacted
21Redacted Version
5.4 Funding Contribution
ABP has applied for funding contribution of £8M to enable the terminal to be open in time for
the 2021 cruise season.
Table 7 Expenditure Profile by Calendar Year
Year 2020 (£) Year 2021 (£) Total (£)
MHCLG Funding Required (Capital) 4,000,000 4,000,000 8,000,000
ABP Contribution (Capital) 21,257,554 12,742,446 34,000,000
Total (£) 25,257,554 16,742,446 42,000,000
Table 8 Expenditure Profile by Percentage
Year 2020 Year 2021 Total
MCHLG Funding Required (Capital) 9.5% 9.5% 19%
ABP Contribution (Capital) 50.6% 30.3% 81%
Total % 61.2% 39.8% 100%
Total (£) 25,257,554 16,742,446 42,000,000
We suggest that the funding is drawn down from the LEP at the end of quarters 3, 4, 1 and 2
such that the total value does not exceed 19.05% of the total project cost or up to a
maximum of £8M whichever is the lower.
22Redacted Version
6 Management Case
6.1 Procurement route
Public Procurement (Utilities Contract) Regulations 2016, also known as OJEU, apply to
projects and activities relating to developments for the purpose of the provision of airports or
maritime or inland ports or other terminal facilities to carriers by air, sea or inland waterway.
A competitive tender process has been undertaken throughout this process under the Public
Procurement Regulations.
ABP’s standard procedure is to tender the works on a design and build basis under the
OJEU process. As this is a project that was paused following commencement because of
Covid-19, ABP has maintained a dialogue with suppliers and sub-contractors during the
lockdown period and adjusted pricing and timeframes to reflect the present economic and
employment conditions.
The contractor Brymor was selected as the preferred contractor. Brymor Construction Ltd is
a regional contractor based in the Portsmouth area. It will appoint a number of local
subcontractors to assist with project delivery.
6.2 Project Plan
The key project milestones as a result of the adjusted programme as a result of the impact of
Covid-19 is presented in the table below.
Table 9 Project Milestones
Project Milestones/ Start Date Milestone /
Key Stages Completion Date
20/08/2020 14/10/2020
Erect Steel frame
24/09/2020 22/10/2020
Concrete deck to Mezzanine
24/09/2020 15/12/2020
Ground Floor Slab
01/10/2020 28/10/2020
Pre-cast Cladding and Stairs
08/10/2020 09/12/2020
Glulam Insulation
29/10/2020 22/12/2020
External Cladding and Roofing
05/11/2020 07/01/2021
Install Rooflights
26/11/2020 10/02/2021
Install curtain walling, windows and doors
20/08/2020 09/10/2020
External Plant Area
15/10/2020 02/12/2020
Internal Plant Area
09/10/2020 15/06/2020
Plant Room Fit out
26/10/2020 31/03/2020
First Fix
09/12/2020 18/03/2020
Internal Fit Out First Fix
28/01/2021 08/04/2021
Lift installation
25/02/2021 21/04/2021
Balustrades
23Redacted Version
25/02/2021 15/04/2021
Plasterboard Ceilings and Plastering
11/03/2021 15/04/2021
Raised Access Floors
30/04/2021
Testing and Commissioning
14/05/2021 25/06/2021
Air bridges
First Cruise Ship 01/05/2021
6.3 Project Management
Procurement Strategy
We have a dedicated group procurement strategy in place which covers all processes
concerned with the planning, purchasing and managing ABP’s supply chain portfolio which
includes:
• Planning and specification of requirements
• Sourcing, tender evaluation and negotiation
• Contract formation, administration and management
• Requisition, purchase and receipt
• Payment to suppliers
• Stores and logistics management
• Contract performance management
• Supplier performance and risk management
Collectively these activities are known as Group Procurement function and they are directed
by the office of our Chief Financial Officer which owns all policies, process and procedures
relating to procurement activity across the ABP Group.
Project Team
We have considerable experience of managing and delivering large scale port infrastructure
projects including other cruise terminals, capital dredging, container terminal quays, new
warehousing and large-scale solar installations.
A dedicated Project Delivery Manager is assigned to manage specification and contractor
supervision to ensure the project is delivered on time and on budget.
A Project Team Organogram is illustrated below.
Redacted
6.4 Internal Governance
ABP’s Project Governance processes align with the Association of Project Management
guidelines, whereby:
24Redacted Version
• A Project Sponsor will be identified from the outset (a Director or member of the senior
management team) who will be accountable for the project achieving its intended
objectives. For this project, the Project Sponsor is Port Director, Alastair Welch.
• A Project Manager will be assigned from the outset responsible for leading the project
team. For this project, the Project Delivery Manager is Clive Vardarkis.
• Minimum monthly updates are scheduled to review programme, cost control, quality,
risk/issues and H&S.
• A clear change control procedure is in place.
All major capital projects within the ABP Group are subject to the company’s project
governance procedures which provide for:
• Planning, costing and scheduling expertise with, where appropriate, independent
challenge from ABP’s group resource.
• Structured sourcing and tendering.
• Contract management capability.
• Careful control of contractual correspondence.
ABP will work with the LEP to meet any necessary audit requirements.
6.5 Monitoring Performance
Performance of the scheme will be tracked through standard project management and
governance processes during the construction phase. This process involves representation
from the Head of Projects and Procurement.
The Project Delivery Manager produces a monthly report which is presented to the Project
Steering Committee that covers the exact programme, risk and financial position each
month. Any changes to scope, cost or project variations are discussed at this meeting and
can only be undertaken if the Steering Committee agree.
The outcomes to track our monitoring framework and evaluation framework are presented in
the tables below.
Table 10 Project Milestones, Monitoring Performance Indicators and Owners
Milestone / Desired Named owner
Indicator Anticipated timeframe
outcome responsible
Award of Contract Contract signing Completed ABP Project Sponsor
Re-commencement on Site According to Programme TBC by main contractor ABP Project Manager
Progress on site measured
Programme against project delivery Throughout project ABP Project Manager
programme
Progress measured against
Budget Throughout project ABP Project Manager
project delivery programme
Go Live Data According to Programme May 2021 ABP Project Manager
No. vessels per annum
No. of calls Annual basis ABP
using facility
No. passengers per annum
No. of passengers Annual basis ABP
using facility
25Redacted Version
Following completion by the main contractor, the terminal and its facilities will be tested to
ensure compliance with positioning and pre-commissioning of all equipment including:
• Functioning of equipment / plant rooms.
• Mechanical installation of equipment.
• Site testing and pre-commissioning.
During operation, the scheme’s success will be monitored and evaluation by:
• Number of vessels per annum using facility.
• Number of passengers using the facility per annum.
6.6 Statutory consents and legal agreements
The project will be delivered by virtue of general permitted development powers under Part 8
of Schedule 2 of The Town and Country Planning (General Permitted Development)
(England) Order 2015 SI 2015/596.
26Redacted Version
7 Risk Management
7.1 Project Construction Risk
The main construction risks of the project are summarised in the table below and have been
agreed by the Project Sponsor, Alastair Welch, Port Director.
Table 11 Project Risks, Likelihoods, Potential Impacts and Mitigation Measures
Risk Likelihood Potential Impact Responsibility Mitigation Measures
If funding is not
secured, the project will
Partnership working with the LEP;
Funding Risk Unknown be immediately paused ABP / LEP
submission of FBC
and not be delivered in
2021.
Delivery Scheduling of works; Project
Delay of installation; ABP /
Schedule cannot Meetings with the contractor to
Low loss of business Contractor
be met identify risks at an early stage.
Increased costs of ABP /
Cost Increase Fixed price tendering
Low installation contractor
Detailed preparation of
Unsuitable facility;
specification; Design and Build
Design Risk Low Delay of installation and ABP
contract
increased costs
Fixed price contract
Project Meetings with the
Delay and increased ABP /
Build Risk Low contractor to identify risks at an
costs of installation Contractor
early stage.
Ground investigations; dust
Environmental Contamination and
ABP / suppression measures, wheel
Risk during Low localised emissions
Contractor washes, construction plant
Construction during ground works
switched off when not in operation
Disruption to
Forward planning and
Port activities Disruption to port ABP /
Low engagement with port operational
during operations Contractor
planning team
construction
Service Risks Disruption to operations
Low ABP Regular maintenance, servicing
and capability
Underutilised facility
due to effects of Covid Fixed guarantees with cruise
Performance /
Unknown 19 on cruise passenger ABP companies
Volume Risk
confidence and take up
of cruises
The proposal is wholly consistent
Change in government
Regulatory Risk Low ABP with Government and local
policy
authority ambitions and plans
Detailed preparation of
Delay of installation and
Contractual Risk Low ABP specification; Design and Build
cost increase
contract
Delay in scheme
delivery due to Daily dialogue with main
manufacturing contractor. [Suppliers have
Delay to Terminal ABP /
supply chain Low confirmed that accelerated
opening Contractor
delays and/or programme can be achieved to
available operate facility in May 2021.]
personnel
27Redacted Version
7.2 Project Finance Risks
Cost overruns will be minimised by closely defined project specification informed by port
engineering specialist knowledge and expertise. ABP has gone out to tender on a fixed cost
basis and the risk of any cost overruns will be borne by the main contractor.
The main project risks and their impact on project finances is presented below.
Table 12 Project Finance Risks, Potential Impact and Mitigation
Potential
Risk Likelihood Impact on Mitigation / Control Measures
Cost
Detailed specification provided within
Project costs are higher tender documents.
Low None
than previously estimated Contractor to bear cost overruns – fixed
price tender
Delay in funding affects
project re-start date or
project does not meet None but
funder requirements Low wider GVA Project will be cancelled
benefits lost
Exchange rate fluctuations
have a bearing on tender Negligible None Fixed price contract
prices
Fixed price contract; Cost Control
Manager; variance analysis; audit
Increased costs during process; defined change approval
Unknown Unknown
installation process; alignment of contractual
commitments with project costs and
schedule
Change control to be implemented for all
future potential changes from RIBA Stage
Changes to the design Increase in 2 onwards A design reserve will be
Low included in the budget (in addition to a
throughout project delivery costs
project contingency)
Construction period longer Detailed Master Programme will be
than anticipated (e.g. No impact on prepared setting out realistic and
unforeseen challenges cost but wider achievable timescales for the Project.
Low
identified on site) GVA benefits
lost
Daily dialogue with main contractor
Professional cost consultants appointed
to determine costs and risks. Costs will
Cost estimates prove to be include a contingency and design reserve
inaccurate Increase in Risks to cost increases will be included in
Low
costs main Risk Register and subject to risk
management procedures
Fixed price tender
28You can also read