RESEARCH Costs and benefits of aerial 1080 operations to Western weka (Gallirallus australis australis) - New Zealand Ecological Society
←
→
Page content transcription
If your browser does not render page correctly, please read the page content below
Tinnemans
New  Zealand
           et Journal
              al.: Impact
                      of Ecology
                          of 1080 (2019)
                                  on weka43(1): 3353 © 2018 New Zealand Ecological Society.

                  RESEARCH

Costs and benefits of aerial 1080 operations to Western weka
(Gallirallus australis australis)

Joris S.J. Tinnemans1*, Graeme P. Elliott1, Tristan E. Rawlence1, Anja McDonald1,
Mara A. Nydegger Bell1, Christopher W. Bell2 and Kirsty J. Moran1
1
  Biodiversity Group, Department of Conservation, Private Bag 5, Nelson 7042, New Zealand
2
  Department of Conservation, 13B Wall Place, Porirua 5022
*
  Author for correspondence (Email: jtinnemans@doc.govt.nz)

Published online: 17 October 2018

         Abstract: The impact of aerially applied 1080 poison on a Western weka (Gallirallus australis australis) population
         was assessed at Tennyson Inlet, Marlborough Sounds, between September 2010 and June 2016. We estimated
         mortality and the incidence of sublethal poisoning as a direct consequence of two aerial 1080 operations and
         examined the differences in nest success, chick survivorship and adult survivorship. Most weka in the treated
         block appear to have been sublethally poisoned but only one of 58 (1.8%) radio-tagged weka died as a direct
         consequence of 1080 application. Both adult and chick survivorship were higher in the treated block, but nest
         success was unaffected by the observed reduction in rat and stoat abundances following the 1080 operation.
         The net effect of aerial 1080 application on this weka population was positive when the operation followed a
         beech (Nothofagaceae) mast and stoat (Mustela erminea) irruption, as adult and chick survivorship after the
         operation exceeded adult mortality during the operation. However, 1080 operations carried out when stoats
         are uncommon may have a minor negative impact on weka populations due to the risk of primary poisoning
         without compensatory increases in survivorship.
         Keywords: compound 1080, Gallirallus australis, mortality, nest success, non-target species, pest control,
         sodium fluoroacetate, weka

Introduction                                                          Anderson 1992; Powlesland et al. 1999, 2000; Schadewinkel
                                                                      et al. 2014). The net effect of 1080 use, weighing non-target
The aerial application of sodium fluoroacetate (1080) has been        mortality against the effects of reduced predation, has not
a common method for the control of introduced mammals                 been adequately monitored for many native species (Veltman
in New Zealand forests since the late 1950s. In the past, the         & Westbrooke 2011), including weka (Gallirallus australis).
majority of aerial 1080 operations targeted brushtail possums              Weka are particularly vulnerable to 1080 poisoning (Spurr
(Trichosurus vulpecula; Eason et al. 1993) in an effort to            1979), because they are omnivorous and known to ingest the
reduce the transmission of bovine tuberculosis from possums           type of pellets used in poison operations (Spurr 1993; Hartley
to dairy cattle (Livingstone 1994). More recent operations            et al. 2000). For this reason, weka were identified as a high
have targeted ship rats (Rattus rattus; Innes et al. 1995)            priority species for additional research (Spurr & Powlesland
with the aim of reducing predation of native fauna (Innes &           1997). Despite their inquisitive nature, several studies have
Barker 1999). Pest control operations that target rodents have        indicated that the number of adult weka killed by 1080 is low
most often been undertaken during beech (Nothofagaceae)               (Miller & Anderson 1992; Spurr & Powlesland 1997; Walker
masts, to prevent rodents reaching plague-like proportions            1997; van Klink & Tansell 2003; van Klink 2008), although
in response to the increased food availability (King 1983).           only one study (van Klink 2013) has monitored radio-tagged
The shift to rodent control in response to beech masts, and           birds through a pre-fed cereal bait operation to accurately
an accumulation of knowledge on the application of 1080,              estimate mortality when 1080 is applied using the most recent
has led to an increased frequency in 1080 operations over             protocols (Veltman et al. 2014).
conservation land and changes in the method of application                 Direct mortality of weka caused by primary and secondary
(Eason et al. 2006; Elliott & Kemp 2016).                             poisoning is only part of the picture (Innes & Barker 1999).
     Individuals of many native New Zealand bird species are          The other aspect is the effect of a reduction in predator
known to have been killed during 1080 operations (Veltman             abundance on the weka population. This second aspect has not
& Westbrooke 2011). Despite these deaths, the populations of          been adequately studied. Anecdotal reports and earlier studies
several forest bird species have been shown to benefit from           suggest the presence of mustelids (Mustela spp.) and cats
1080 because of reduced predator abundances (Miller &                 (Felis catus) can reduce adult weka survivorship (Beauchamp
DOI: 10.20417/nzjecol.43.7
New Zealand Journal of Ecology, Vol. 43, No. 1, 2019
et al. 1998; TSRP 2009) and reproductive success (Bramley 2014. In addition to the beech mast, many other plant species
1996). Since secondary poisoning will reduce the number of also produced noticeably large quantities of fruit/seed in the
mustelids and cats in a treated area (Gillies & Pierce 1999; summer of 2014.
Murphy et al. 1999), a positive effect of 1080 on weka is
likely. To determine the net impact of current aerial 1080 Poison operations
application methods we monitored a weka population through Two aerial 1080 operations were conducted in the treatment
two aerial 1080 operations in Tennyson Inlet, Marlborough block during this study. Both operations included a non-toxic
Sounds. We studied (1) the mortality of adult weka, (2) the pre-feed bait drop 13 days prior to the toxic bait drop. Non-toxic
incidence of sublethal poisoning, (3) nest success, (4) chick 0.3% cinnamon-lured cereal pellets (16 mm, 6 g RS5) were
survivorship and (5) survivorship of adult weka before and sown at a rate of 1 kg ha-1 during pre-feed operations. Pellets
after 1080 operations. of the same type containing 0.15% 1080 were dyed green and
sown at 1 kg ha-1 for toxic operations. No baits were sown in
the non-treatment block. The first 1080 operation occurred on
Methods 2 November 2013 and the second operation on 23 November
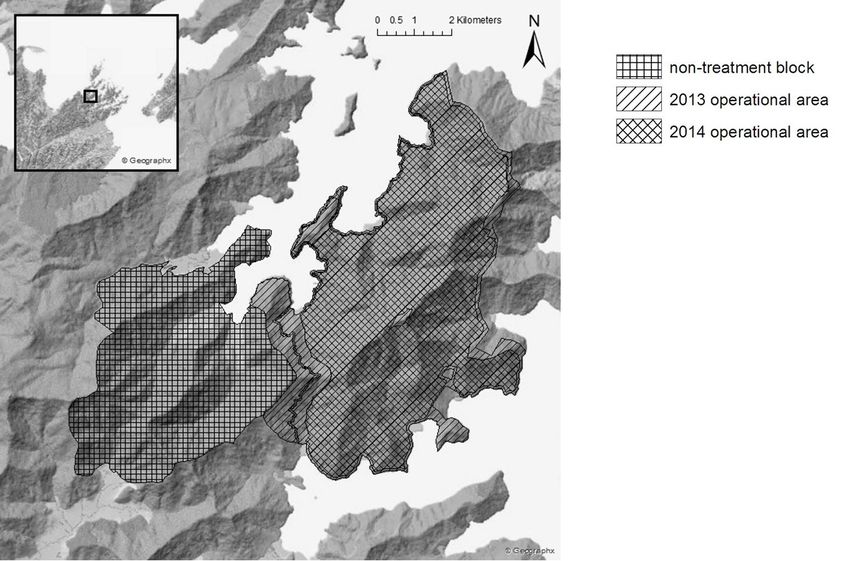
2014. Both operations covered approximately the same area
Study site (4300 ha and 3939 ha in 2013 and 2014, respectively) (Fig. 1).
The study was conducted in the area around Tennyson Inlet It took approximately 35 days after each poison operation
in the Marlborough Sounds, approximately 45 km northeast for rainfall to exceed 100 mm (CliFlo, National Institute of
of Nelson and 30 km northwest of Picton. The study site was Water of Atmospheric Research Ltd.), after which baits were
divided into a treatment block (approx. 3900 ha) centred considered non-toxic (Bowen et al. 1995).
around Mt. Stanley (41°06ʹ5ʺ S 173°49 ʹ0ʺ E) and an adjacent
non-treatment block (approx. 2500 ha) centred around Opouri Pest abundance
Saddle (41°08ʹ2ʺ S 173°43 ʹ5ʺ E) (Fig. 1). The site features Rat and stoat abundances were assessed using the protocols
coastal mixed podocarp and hard beech (Fuscospora truncata) of Gillies and Williams (2007). Ten tracking tunnel lines were
forest at sea level, which gives way to predominantly red beech set out randomly, although constrained by a minimum distance
(Fuscospora fusca), silver beech (Lophozonia menziesii) and of 500 m, in each of the treatment and non-treatment blocks
mountain beech (Fuscospora solandri) at higher altitudes of and each line contained ten tunnels, spaced at 50 m intervals.
up to 1000 m a.s.l. Rat abundance was measured four times per year (February,
Average annual rainfall for the area is approximately 1750 May, August and November) from November 2010 until August
mm and ambient temperatures range from -4.5° to 28°C, with 2016 using tracking cards lured with peanut butter for one night.
an annual average temperature of 13.5°C (CliFlo, National Stoat abundance was measured on five occasions between
Institute of Water of Atmospheric Research Ltd.). September 2013 and January 2015, by leaving tracking cards
Substantial flowering was observed in all beech species out for three consecutive nights lured with fresh rabbit meat.
in the spring of 2013, followed by very heavy seeding in After January 2015, our stoat index protocol was altered and
Figure 1. Map of the treatment and non-
treatment blocks in Tennyson Inlet.Tinnemans et al.: Impact of 1080 on weka
tracking cards were left out for 14 consecutive nights lured GLMs were run in the statistical program R version 3.4.1 (R
with salted rabbit meat. Stoat abundance was measured on Core Team 2016). A suite of 11 plausible models variously
five more occasions using the altered method, with the last including and excluding possible explanatory covariates for
survey conducted in August 2016. year, sex, block, stoat abundance and 1080 treatment were
compared using AICc (Burnham & Anderson 2002).
Weka capture & identification
A total of 191 adult and juvenile weka were caught between Nest success & chick survivorship
September 2010 and June 2016. Recordings of weka calls were Weka activity was monitored by observers using a Yagi aerial
used to locate and attract birds, and hand nets, cage traps and (Sirtrack™) and Telonics™ TR4 hand-held receiver. Although
hand nooses were used to capture them. weka in the Marlborough Sounds are known to breed year-
Adult weka were fitted with a metal leg band, three colour round (Beauchamp 1987), we intensively monitored the
bands and a radio transmitter attached with a flying-bird harness pairs in this study during the months of spring and summer
(Karl & Clout 1987). Juveniles were fitted with a metal leg (September–January) between January 2011 and January 2016.
band only. Weight and bill length measurements (Beauchamp During the spring and summer monitoring periods, we
1998) were used to identify the sex of adult birds. collected diagnostic outputs (which provided an index of
Several types of transmitters were used during this study. average daily activity) of all females at weekly intervals, in
The latest model (Sirtrack™, version 9.2) had three pulse an attempt to acquire a complete picture of nesting activity.
rates and determined if birds were alive, dead or incubating, Since females incubate during daylight hours, a sharp drop in
as well as a diagnostic output for determining recent activity activity occurred when nesting started. When the diagnostic
and time of death. output indicated a pair was nesting we located the nest and
installed a motion-triggered camera (Ltl Acorn®-5210 series),
Sublethal poisoning which recorded hatch date, number of chicks hatched, predation
Sublethal poisoning from 1080 was first reported by Walker attempts and parental attendance. Once the family left the
(1997), when a weka was confirmed to have been poisoned nest area, 2–3 days after hatching, they were visited weekly
by 1080, showed symptoms and subsequently recovered. The until the pair had either lost all chicks or until the chicks were
diagnostic transmitters used in our study recorded the activity considered independent. Weka chicks are known to stay with
rate from selected individuals directly before and after the 2014 their parents until 55 days old (Beauchamp 1987) so any chick
application of 1080. This data set was used to determine the that could not be located using parental transmitters before 55
days old was assumed to have died.
proportion of birds with such large changes in activity patterns
Factors affecting nest success and chick survivorship
that they may have been adversely affected by the poison.
were investigated with the same methods used to examine
long-term survivorship, except that for chick survivorship
Mortality and long-term survivorship
we accounted for the possibility that survivorship of each
From September 2010 until June 2016 the pulse rate of each chick in the same brood may not have been independent of
bird’s transmitter was checked regularly to determine whether the others using generalised linear mixed models (GLMMs)
birds were alive or dead. Radio-tagged birds that could not be with a random effect for brood. GLMMs were run in R version
located over the course of several weeks were assumed to have 3.4.1 (R Core Team 2016) using the package lme4 version
died. Weka that died without having been in contact with 1080 1.1-15 (Bates et al. 2014). For both nesting success and chick
were located and a cause of death determined where possible. survivorship we explored the possibility that survival might
Radio-tagged weka that died within 35 days of the vary with nest or chick age and days since the beginning of
poison operations in the treatment block were collected and the field season (timing) by incorporating linear, second order
sent to the Institute of Veterinary, Animal and Biomedical and third order polynomial relationships between age, timing
Sciences at Massey University in Palmerston North for and nesting success or chick survivorship.
autopsy. Muscle tissue samples from these same birds were To explore the relationship between nest success and
sent to Manaaki Whenua - Landcare Research in Lincoln, 1080 operations we assessed via model selection 11 GLMs
Canterbury, to be assayed for the presence of 1080 using Gas to determine whether our data supported a treatment effect
Liquid Chromatography. The likelihood of direct poisoning after the 2013 operation or a year after the 2014 operation in
was assumed to be negligible after 35 days post-operation, 2015. For 2013, we measured nest success in the same season
when rainfall had exceeded 100 mm. The risk period for before and after the 1080 operation and thus had a BACI design
secondary poisoning was considered to be similar, judging (Stewart-Oaten et al. 1986). We compared models with and
from calculations made with regard to deer and possum carcass without an interaction effect between site and before/after to
monitoring (McIntosh et al. 1959, 1966; Meenken & Booth determine whether the data supported a treatment effect in
1997; Ross & McCoskery 2012). These studies suggest that 2013. We could not carry out the same sort of BACI analysis
beyond a carcass age of 25 days, a weka would need to consume in 2014 because we found no nests in our non-treatment
considerably more than its daily food intake of possum/deer block after the 1080 operation that year. Instead we simply
stomach to show symptoms of 1080 poisoning. compared models with separate terms for before and after the
Direct mortality figures were calculated as a point estimate 1080 drop in 2014 with models where before and after had
with 95% confidence intervals (CI). The Clopper-Pearson been combined. For 2015, we had no before/after measures in
Exact Binomial method (Clopper & Pearson 1934) was used the same year, so we compared nest success in the treatment
for calculating confidence intervals. and non-treatment blocks.
Factors affecting long-term adult weka survivorship To explore the relationship between chick survivorship and
were examined using generalised linear models (GLMs) with 1080 operations we compared a suite of GLMMs to determine
binomial errors and complementary log-log link functions whether our data supported a treatment effect after the 1080
using methods from Rotella et al. (2004) and Bolker (2014). operations in 2013 and 2014 or a year later in 2015. For 2013New Zealand Journal of Ecology, Vol. 43, No. 1, 2019 and 2014, we measured chick survivorship in the same season rat indices dropped from low (
Tinnemans et al.: Impact of 1080 on weka

Table 1. Mortality of weka monitored in treatment and non-treatment blocks during the 2013 and 2014 aerial 1080 operations
in Tennyson Inlet.
__________________________________________________________________________________________________________________________________________________________________

Year Block                                                   Number of weka Risk period Number of dead                                1080 concentration in
		                                                           monitored			                                                             tissue (µg g-1)
__________________________________________________________________________________________________________________________________________________________________

2013                                         Treatment       26                   35 days            1                                1.23
2013                                         Non-treatment   21                   N/A                0                                N/A
2014                                         Treatment       32                   35 days            0                                N/A
2014                                         Non-treatment   18                   N/A                2                                N/A
__________________________________________________________________________________________________________________________________________________________________

                               1
                                                                                                                                 Figure 4. Normalized average
                                                                                                                                 activity levels of weka in the
                                                                                                                                 treatment and non-treatment
                                                                                                                                 blocks. The 1080 operation
                             0.5
                                                                                                                                 occurred on the 23rd of November
                                                                                                                                 2014.

                               0
normalized aveage activity

                             -0.5                                                                                     non-treatment
                                                                                                                      treat

                              -1

                             -1.5

                              -2
                                    16/11/2014                       23/11/2014                          30/11/2014

accuracy associated with GPS guided delivery of 1080 baits,                                 that only the male weka found dead was killed by 1080 baits
it is assumed that 1080 pellets would have been present within                              and therefore the mortality rate of weka monitored for both
the home range of each weka in the treatment block. Three                                   aerial 1080 operations combined was 1.8% (0.04–9.24% CI).
weka were found dead in the treatment block soon after the                                       Of the 39 birds in the non-treatment block, two died
1080 operations and their times of death were determined                                    during the same 35-day post-operation period. Their cause
from their transmitters.                                                                    of death could not be determined. Both these birds were
      One adult male weka (1250 g) died the day after the                                   found approximately 4.5 km from the edge of the treatment
aerial 1080 operation in 2013 and was found to have 1.23                                    block. The death rate of the monitored birds not exposed to
µg g-1 of 1080 in its muscle tissue. It was almost certainly                                1080 baits was higher but not significantly higher than those
killed by 1080. One adult female weka (745 g) died 4 days                                   exposed to 1080 baits.
after the 2014 aerial 1080 operation and was found to have
traces of 1080 (0.004 µg g-1) in its muscle tissue. However,                                Sublethal poisoning
the NOEL (no observed effect level) of 1080 in gavaged weka                                 There was a significant difference in the activity of our study
has previously been reported as 4.5–6.75 µg g-1 (McIntosh et                                birds after the 1080 operation in the treatment block compared
al. 1966) and it seems unlikely that the level of 1080 found                                with the non-treatment block (Fisher’s exact test P = 0.018).
in the muscle tissue of this bird was sufficient to kill it. There                          In the 3 days following the 1080 operation, the average
was no visible sign of dyed bait remnants in its gut. The bird                              daily activity of weka with diagnostic transmitters dropped
had some bruising, indicating that it had been grabbed before                               by 31.2% ± 4.6% (standard error of the mean) (N = 10) and
death and it was found down a long-drop toilet near a public hut                            8.0% ± 4.3% (N = 6) in the treatment and non-treatment
together with another weka. The transmitter of the second weka                              block respectively. All individuals in the treatment block had
found in the long-drop toilet (soon after the 2014 operation)                               a pronounced drop in activity during the 3 days following the
revealed that it had died several weeks before the aerial 1080                              poison operation compared to 7 days immediately prior to the
operation. We think both birds found in the toilet had been                                 operation, but seemed to revert to normal daily activity levels
killed by humans though one had consumed a small amount                                     within approximately 7 days (see Fig. 4).
of 1080 before it was killed. Both weka were excluded from
our estimates of mortality caused by 1080. We have assumed
New Zealand Journal of Ecology, Vol. 43, No. 1, 2019
Long-term survivorship Nest success
We monitored the long-term survivorship of 157 radio-tagged We monitored 93 weka nests, 11 of which failed. Two failures
adult weka. Model selection for long-term survivorship were caused by the death of one of the parents, two by infertility,
identified four highly ranked models with similar AICc values. one by lack of parental attendance and one by predation by
All four models had terms for stoat plague and 1080 treatment another weka. The cause of the remaining five nest failures
and differed only in their inclusion of sex and the interaction could not be determined, but we had no evidence of any nest
between stoat plague and 1080 treatment as explanatory terms failing due to interference by introduced mammals.
(Table 2). We conclude that the stoat plague substantially The inclusion of linear terms for nest age and timing in the
reduced adult survival in 2015, but that 1080 baiting eliminated models improved the GLMs and these terms were included in
the effect of the stoat plague in the treatment block (Fig. 5). all the models exploring the effect of 1080 operations (Table 3).
We are uncertain whether the survival of males and females Although nesting success was higher after the 1080
differs, and whether 1080 was more effective at increasing adult operations in 2013 and 2014, and lower in the treatment block
weka survivorship during stoat plagues, than at other times. in 2015 than it was in the non-treatment block (Fig. 6), models
Estimated annual survival of weka during the first 5 without these effects better fitted the data than did models
years of our study when stoats were rare was 63% (55–70% that included them (Table 3). AICc ranked a simple model
CI) similar to the 62.5% observed by Beauchamp (1987) in with only time and age effects much higher than any of the
nearby Double Cove, Marlborough Sounds. In 2015, when other plausible models (Table 3). This analysis provides no
stoat numbers were high in our non-treatment block, estimated evidence that nesting success was affected either positively
annual survival of adult weka was only 12% (4–24% CI). In or negatively by predators or their control.
contrast, estimated annual survival in the treatment block in
2015 was similar to, or better than, that during the first 5 years Chick survivorship
of the study: 71% (55–82% CI). Between January 2011 and January 2016, we monitored
234 weka chicks from 102 broods, equally split between
the treatment and non-treatment blocks. Seventy chicks
Table 2. AICc for 11 candidate GLMs of the relationship disappeared before they were 55 days old and were assumed to
between adult survivorship, year, sex, block, stoat plagues have died. Before chicks grew adult feathers (at approximately
and 1080 treatment. 35 days of age) mortality rates were relatively high with a daily
____________________________________________________________________________
death rate of 1.15%, dropping to 0.34% at ages over 35 days.
K AICc ΔAICc These death rates equate to a survival probability of 66.6% for
____________________________________________________________________________
plague × treat 4 947.88 0.00 the period between hatching and 35 days and 93.4% for chicks
plague + treat 3 948.13 0.25 between the age of 36 days and independence, set at 55 days.
sex + plague × treat 5 948.14 0.25 During the stoat irruption in 2015, chick survival was 12%
sex + plague + treat 4 948.48 0.60 in the untreated block and 80% in the treated block.
sex + year × block 13 956.18 8.29 The inclusion of a quadratic relationship with chick age and
year × block 12 956.25 8.36 a third order polynomial relationship with timing substantially
treat 2 973.86 25.97 improved the GLMMs and these terms were included in all
sex + treat 3 974.22 26.33 the models exploring the effect of 1080 operations.
plague 2 975.57 27.68
sex + plague 3 976.28 28.41
The best models of the relationship between chick survival
null 1 981.51 33.63 and treatments have strong support for treatment effects in
____________________________________________________________________________ 2013 and 2015, and lesser support for a 2014 treatment effect
75
Annual survival (%)
50 treatment
no 1080
1080
25
0
no stoat plague stoat plague
Figure 5. Estimated annual survivorship of adult weka (± 95% CI) in stoat and non-stoat-plague years with and without 1080 treatment.Tinnemans et al.: Impact of 1080 on weka
Table 3. AICc for 11 candidate GLMs of the relationship between nest success, year, block, and treatment effects in 2013,
2014 and 2015. All models include linear effects for nest age and timing.
__________________________________________________________________________________________________________________________________________________________________
K AICc ΔAICc
__________________________________________________________________________________________________________________________________________________________________
Null 3 110.68 0.00
block 4 112.64 1.96
year 8 117.60 6.92
year + block 9 119.62 8.94
year + block + treat2013 10 120.32 9.64
year + block + treat2014 10 121.51 10.82
year + block + treat2015 10 121.52 10.84
year + block + treat2013 + treat2014 11 122.13 11.45
year + block + treat2013 + treat2015 11 122.35 11.67
year + block + treat2014 + treat2015 11 123.42 12.74
year + block + treat2013 + treat2014 + treat2015 12 124.17 13.49
__________________________________________________________________________________________________________________________________________________________________
Figure 6. Estimated nest
100
success of weka (±95% CI)
in the treatment and non-
treatment blocks. Data are
shown for each year, with
2013 and 2014 subdivided
75
into before and after the 1080
operations. No nests were
nesting success (%)
monitored in the treatment
block in 2010 and 2011. No
confidence intervals are shown
50 non−treatment
treatment when nest success is 100%.
25
0
10
1
12
re
r
re
er
15
fte
1
efo
efo
aft
20
20
20
20
a
b
4b
13
14
13
20
20
1
20
20
(Table 4). In 2015, nearly a year after the last 1080 operation, Our study suggests high rat abundance does not directly
chick survivorship was substantially lower in the non-treatment affect weka survivorship, but there may be means by which
block than in the treatment block (Fig. 7). In 2013, chick high rat abundance could affect nest success (see ‘other
survivorship in the treatment block dropped sharply after population impacts’). Rodent abundance has an indirect
the 1080 operation, while in 2014 chick survivorship in the effect on weka survivorship, because when rodents are
treatment block increased relative to the non-treatment block. abundant they constitute a large part of stoats’ diets (King et
al. 1996; Murphy et al. 1998) and stoat numbers increase. As a
consequence of sustained high rat numbers in the non-treatment,
Discussion stoat abundance peaked in the summer of 2014/2015. Stoat
abundance remained high for over a year after the 2014/2015
Pest indices peak, after which the first signs of decline became evident,
In 2013, rat numbers were reduced to undetectable levels coinciding with a drop in rodent abundance.
after the 1080 operation, but following the 2014 beech mast,
rat numbers rose to 94% tracking rate in the treatment block. Direct mortality and sublethal poisoning
The 1080 operation in 2014 achieved only a moderate rat kill Our result suggests sublethal poisoning of weka is ubiquitous
which might be a consequence of the very high rat abundance during a 1080 operation. Of the 32 adult birds monitored for
before the 1080 operation. With very high rat densities and low mortality in the 2014 operation, 66% (21) were also monitored
poison sowing rates (1 kg ha-1) we speculate that there may not the previous year and were likely to have been sublethally
have been enough 1080 bait, or that bait was not sufficiently poisoned during the 2013 operation. These birds might have
evenly distributed, for all rats to come in contact with it. biased our estimate of mortality because they may have learnedNew Zealand Journal of Ecology, Vol. 43, No. 1, 2019
Table 4. AICc values for eight candidate GLMMs of the relationship between chick survivorship, block, year and treatment
effects in 2013, 2014 and 2015. All models included a second order polynomial term for chick age and a third order
polynomial term for timing.
__________________________________________________________________________________________________________________________________________________________________
K AICc ΔAICc
_______________________________________________________________________________________________________________________________________________________________________________________________________________________________________
block+year+treat13+treat15 17 459.30 0.00
block+year+treat13 16 460.90 1.60
block+year+treat13+treat14+treat15 18 461.23 1.93
block+year+treat13+treat14 17 462.91 3.61
block+year+treat15 16 465.14 5.84
block+year+treat14+treat15 17 466.60 7.29
block+year 15 469.76 10.45
block+year+treat14 16 471.47 12.16
__________________________________________________________________________________________________________________________________________________________________
Figure 7. Estimated weka
100 chick survival from hatching
to independence (±95% CI) in
the treatment and non-treatment
blocks. Data are shown for
75 each year, with 2013 and 2014
subdivided into before and after the
chick survival (%)
1080 operations. No chicks were
monitored in the treatment block
in 2010. No confidence intervals
50 non-treatment
are shown when chick survival
treatment
was 100%.
25
0
10
11
12
15
e
e
er
er
for
for
20
20
20
20
aft
aft
be
be
13
14
13
14
20
20
20
20
to avoid the 1080 pellets. However, seven of the ten birds eat 1080 pellets (Spurr 1993; Hartley et al. 2000). In our study
monitored for sublethal poisoning in 2014 were known to area, the average adult male weight was 1138 g (N = 76) and
have been alive during the previous 1080 operation, yet they adult female weight was 784 g (N = 66). Therefore, their low
clearly had not learned to avoid 1080 pellets as they all showed mortality is surprising. Walker (1997) offered three possible
signs of sublethal poisoning during their second exposure to explanations for the low mortality rates of weka during 1080
1080. Therefore, we conclude that we can reasonably treat operations:
mortality rates from both poison operations as independent. 1. Weka can detect 1080, dislike the smell and ignore the
Combining our study with another, the pooled mortality pellets.
rate from monitoring 90 birds across four 1080 operations is 2. Weka only peck at pellets, receive a sublethal dose, and
3.3% (0.7–9.4% CI). These data combine our mortality data subsequently avoid pellets.
(1.8%, 0.04–9.2% CI) with that gathered by van Klink (2013; 3. The LD50 for weka is higher than existing information
6.2%, 0.8–20.1% CI) during two 1080 operations using similar suggests.
protocols. However, the operations described by van Klink The speed with which weka show symptoms of 1080
used 12 g pellets and a sowing rate of 2 kg ha-1 toxic pellets. poisoning has not been studied, but studies on other bird species
During the 1080 operation in 2014, all 10 birds monitored suggest that the latency period could be between 1 to 18 hours
for sublethal poisoning had a sharp drop in activity soon after (McIntosh et al. 1966; McIlroy 1984; Ataria et al. 2000). It is
the 1080 was sowed, followed by rapid recovery. It seems possible that some physiological effects might be noticed by
that most weka that eat 1080 baits are sublethally poisoned. birds before symptoms occur, a notion that has been explored
Weka have an estimated LD50 of 8.1 mg kg-1 (McIntosh in mice (Fisher et al. 2009). Fisher et al. (2009) suggest that a
et al. 1966), meaning a single 6 g 0.15% w/w 1080 pellet water-soluble, rapidly absorbed and metabolised poison such
contains sufficient poison to kill 50% of weka weighing as 1080 could have subtle aversive effects on mice in minutes,
1.1 kg. Weka are generally regarded as neophilic and clearly rather than hours. However, since weka activity, as measuredTinnemans et al.: Impact of 1080 on weka
by transmitters, dropped dramatically after 1080 exposure, we had a negative effect on chick survival, perhaps because
have compelling evidence that weka with transmitters ate a some chicks died either when they were fed poison by their
sublethal amount of 1080. We hypothesise that they neither parents, or when their parents became ill for a short time after
avoided the pellets nor detected the 1080 after only a small eating 1080. After the 2014 operations there may have been a
asymptomatic dose. Assuming the LD50 of 1080 for weka similar impact, but it was overshadowed by the positive effect
estimated by McIntosh et al (1966) is approximately correct, of killing stoats. In 2015 no aerial 1080 baiting occurred,
then weka must either have pecked at the baits and become and in the non-treatment block chick survivorship was low,
ill before consuming a lethal dose, or they must have eaten a probably because the chicks were eaten by stoats which were
whole bait and regurgitated it before they absorbed a lethal dose. at a high density. In the treatment block stoat numbers were
still suppressed following the 1080 drop a year before, and
Long-term survivorship chick survivorship was high.
Weka survivorship was improved by the 1080 application
in 2014, but not in 2013. We speculate that the difference is Other population impacts
related to stoat abundance as indexed by tracking rates. In 2013 We may have overestimated nesting success because we were
there were relatively few stoats, weka survival was high and unable to detect nest failures that occurred during laying. Most
the poisoning of a few stoats by 1080 made little difference. of the nests we monitored were found when the diagnostic
In contrast, after the 2014 operations stoats were abundant transmitters indicated that the female was incubating and using
and weka survival was low, except in our treatment block this method we were unable to find nests before incubation
where the poisoning of stoats with 1080 caused a substantial started. The only nest we found during laying was found by
decrease in stoat abundance and a substantial increase in weka chance. A camera showed that the female on this nest spent
survivorship. approximately 50% of her time attending the nest during 2 days
Although we know that at least one weka was killed by between the laying of the first and fourth eggs. Subsequent
1080 in 2013, our statistical analysis did not support the notion parental attendance rose from 90% over the following 2 days
that 1080 operations had an adverse effect on the long-term to 100% for the remainder of the incubation period. The low
survivorship of weka. It seems that although weka can be killed nest attendance during laying means nests are more vulnerable
by 1080, the low mortality is undetectable when measured on to predation during laying than they are during incubation, yet
an annual timescale. any failures during laying would be undetected.
Previous studies suggest that at national or regional Only a few published studies report on the long-term
scales, habitat loss and drought are major contributing factors impact of sublethal poisoning with 1080 and most of these are
to a reduction in weka populations (Beauchamp 1987, 1997; concerned with the effect of long-term dosing on developmental
Beauchamp et al. 1998). No habitat was lost during our study and reproductive toxicology in mammals (ERMA 2007).
and the difference in weka survival between the treatment and The effects of a single sublethal dose of 1080 in birds, as
non-treatment blocks excludes drought as an explanation for might occur after a 1080 operation, has only been studied
the decline we observed in our non-treatment block. In our once (Ataria et al. 2000). This study showed that although
study, stoat predation is the most likely explanation for the 1080 residues were quickly excreted in live mallards (Anas
reduction in weka we observed. platyrhynchos), histopathological abnormalities sometimes
occurred, particularly in heart and skeletal muscle tissue.
Nest success and chick survivorship Single dose studies on sheep (Ovis aries) also showed effects
Statistical analysis of nest success data did not support the on heart, brain and lung tissue, but were without clinical
notion that 1080 affected nest success after either the 2013 or significance (O’Connor et al. 1999; Gooneratne et al. 2008).
2014 1080 operations. During this study, automatic cameras Weka might also suffer tissue damage from a sublethal dose
recorded a variety of mammals including mice, rats, possums, of 1080, although how this would affect their long-term
stoats and cats investigating weka nests, but none of these nests health is unknown. The adult survival rate of weka that we
failed. The only observed predation was caused by another recorded before the first 1080 operation suggests a median
weka. Predation of weka nests by introduced mammals (perhaps life-expectancy of approximately 1.6 years. Weka are relatively
excluding dogs Canis familiaris) seems to be rare. Perhaps short-lived and any ‘long-term’ effect on their health would
because weka are relatively large and aggressive birds they have to occur within 1–2 years for it to have any impact on
are able to protect their nests from most predators. Since weka their population dynamics. Weka survival in the treatment block
nests are rarely preyed upon by mammalian predators there in the 2 years following the first 1080 operation was higher
is little scope for an improvement in nest success following than in the non-treatment block. 1080 had had no detectable
1080 bait application. ‘long-term’ effect on the population at the end of our study
A sublethally poisoned adult weka could conceivably by which time more than half the birds that were exposed to
neglect its nesting duties, but the three pairs of weka that were 1080 in 2013 had already died from other causes.
incubating at the time of the 2013 and 2014 1080 operations
continued incubating successfully. 1080 did not adversely affect The net effect of 1080 on weka
nest success in our study. Our analysis indicated that chick Weka may readily eat 1080 pellets, but for an unknown reason
survival was probably negatively affected by 1080 operation the mortality rate from 1080 poisoning is low and undetectable
in 2013 and positively affected by the 2014 operation. During when compared with other causes of weka mortality over a
the period when stoats were abundant in 2015, a year after the whole year. We could detect no effect of 1080 on nest success,
last 1080 operation, there was a substantial decrease in chick chick or adult survival in the years of the 1080 operations,
survival in the non-treatment block, which did not occur in but the treatment appears to have prevented a substantial
the treatment block. These results suggest that during 2013 decrease in chick and adult survivorship in the 12 months
when there were no predator plagues, the 1080 operation after the 1080 operation in 2014, which coincided with a stoatNew Zealand Journal of Ecology, Vol. 43, No. 1, 2019
irruption. Adult survival was 71% in the block treated with 1080 Bay, Bay of Islands. Notornis 45: 31–43.
compared to 12% in the untreated block. Chick survival was Bolker B 2014. Logistic regression, accounting for differences
12% in the untreated block and 80% in the treated block. The in exposure, updated 30 September 2014: https://rpubs.
improvement in adult survival associated with 1080 is clearly com/bbolker/logregexp
enough on its own to compensate for the small mortality, and Bowen LH, Morgan DR, Eason CT 1995. Persistence of
the increase in chick survival means that the benefit to weka sodium monofluoroacetate (1080) in baits under simulated
is even greater. It is important to note that we detected an rainfall. New Zealand Journal of Agricultural Research
improvement in adult and chick survivorship in the treatment 38: 529–531.
block only after the second 1080 operation, not the first. We Bramley GN 1996. A small predator removal experiment to
conclude that it is only when stoats are abundant that 1080 protect North Island weka (Gallirallus australis greyi)
use has the potential to benefit weka through reduced stoat and the case for single-subject approaches in determining
predation: at times when stoats are not abundant they have agents of decline. New Zealand Journal of Ecology 20:
relatively little impact on weka. 37–43.
Although we monitored weka through two aerial 1080 Burnham KP, Anderson DR 2002. Model selection and
operations, the circumstances of the two operations were very multimodel inference: a practical information-theoretic
different. The second operation was after a beech mast when approach. New York, Springer. 515 p.
rodent and stoat numbers had risen substantially, while there Clopper CJ, Pearson ES 1934. The use of confidence or fiducial
was no such rise in predator numbers at the time of the first limits illustrated in the case of the binomial. Biometrika
operation. The best available evidence suggests that 1080 26: 404–413.
operations that are timed to pre-empt stoat irruptions will Eason CT, Frampton CM, Henderson R, Thomas MD, Morgan
benefit weka populations, while those that are not timed to DR 1993. Sodium monofluoroacetate and alternative toxins
pre-empt stoat irruptions will have a small, even negligible, for possum control. New Zealand Journal of Zoology 20:
negative impact on weka populations. 329–334.
Eason CT, Morgan DR, Fisher PM, Hopkins B, Cowan P 2006.
Reflections on improvements in the use of vertebrate
Acknowledgements pesticides in New Zealand: 1996–2006. Proceedings of
the Vertebrate Pest Conference. Pp. 406–412.
We like to thank Department of Conservation rangers Phillip Elliott G, Kemp J 2016. Large-scale pest control in New Zealand
Clerke and Frank Rosie, as well as other member of the beech forests. Ecological Management & Restoration
Picton DOC office who oversaw both 1080 operations. We 17: 200–209.
also like to thank all contractors who assisted with field work, ERMA 2007. Evaluation and review report: reassessment of
especially Mitchell Bartlett, Vanessa Smith and Robyn Blyth. 1080 (HRE05002). Environmental Risk Management
We are also indebted to the whole of the Tennyson Bay Inlet Authority. Pp. 293–345.
community, especially John and Pam Harvey, Peter and Fisher PM, Airey A, Brown S 2009. Effect of pre-feeding
Jenny Archer, Linda Booth and other Duncan Bay residents. and sodium fluoroacetate (1080) concentration on bait
We would also like to thank John Wilks (WildTech) for his acceptance by house mice. Wildlife Research 36: 627–636.
interest in developing a better diagnostic transmitter and Gillies CA, Pierce RJ 1999. Secondary poisoning of mammalian
Jenny Long, Clare Veltman, Susan Timmins, Clayson Howell predators during possum and rodent control operations
and two anonymous referees for their helpful comments on at Trounson Kauri Park, Northland, New Zealand. New
earlier drafts. This project was conducted in accordance with Zealand Journal of Ecology 23: 183–192.
the Department of Conservation’s Animal Ethics Procedures. Gillies CA, Williams D 2007. Using tracking tunnels to
No Wildlife Acts permits were required. monitor rodents and mustelids. Unpublished report to the
Department of Conservation.
Gooneratne SR, Eason CT, Milne L, Arthur DG, Cook C,
References Wickstrom M 2008. Acute and long-term effects of
exposure to sodium monofluoroacetate (1080) in sheep.
Ataria JM, Wickstrom M, Arthur D, Eason CT 2000. Onderstepoort Journal of Veterinary Research 75: 127–139.
Biochemical and histopathological changes induced by Hartley L, Waas J, O’Connor C, Matthews L 2000. Colour
sodium monofluoroacetate (1080) in mallard ducks. New preferences and coloured bait consumption by weka
Zealand Plant Protection 53: 293–298. (Gallirallus australis), an endemic New Zealand rail.
Bates D, Mächler M, Bolker B, Walker S 2014. Fitting linear Biological Conservation 93: 255–263.
mixed-effects models using lme4. Journal of Statistical Innes JG, Barker G 1999. Ecological consequences of toxin
Software 67: 1–48. use for mammalian pest control in New Zealand—an
Beauchamp AJ 1987. The social structure of the weka overview. New Zealand Journal of Ecology 23: 111–127.
(Gallirallus australis) at Double Cove, Marlborough Innes JG, Warburton B, Williams D, Speed H, Bradfield P
Sounds. Notornis 34: 317–325. 1995. Large-scale poisoning of ship rats (Rattus rattus)
Beauchamp AJ 1997. The decline of the North Island weka in indigenous forests of the North Island, New Zealand.
(Gallirallus australis greyi) in the East Cape and Opotiki New Zealand Journal of Ecology 19: 5–17.
Regions, North Island, New Zealand. Notornis 44: 27–36. Karl BJ, Clout MN 1987. An improved radio transmitter
Beauchamp AJ 1998. The ageing of weka (Gallirallus australis) harness with a weak link to prevent snagging (Nuevo
using measurements, soft parts, plumage and wing spurs. arnés para colocar radiotransmisores en aves). Journal
Notornis 45: 167–176. of Field Ornithology 58: 73–77.
Beauchamp AJ, Van Berkum B, Closs MJ 1998. The decline of King CM 1983. The relationships between beech (Nothofagus
North Island weka (Gallirallus australis greyi) at Parekura Sp.) seedfall and populations of mice (Mus musculus), andTinnemans et al.: Impact of 1080 on weka
the demographic and dietary responses of stoats (Mustela Ross J, McCoskery H 2012. Deer carcass breakdown
erminea), in three New Zealand forests. Journal of Animal monitoring. Unpublished report to the Animal Health
Ecology 52: 141–166. Board, Wellington, New Zealand.
King CM, Flux M, Innes JG, Fitzgerald BM 1996. Population Rotella JJ, Dinsmore SJ, Shaffer TL 2004. Modeling nest–
biology of small mammals in Pureora Forest Park: 1. survival data: a comparison of recently developed methods
Carnivores (Mustela erminea, M. furo, M. nivalis, and that can be implemented in MARK and SAS. Animal
Felis catus). New Zealand Journal of Ecology 20: 241–251. Biodiversity and Conservation 27: 187–205.
Livingstone PG 1994. The use of 1080 in New Zealand. Schadewinkel RB, Senior AM, Wilson DJ, Jamieson IG 2014.
Proceedings of the Science Workshop on 1080. 178 p. Effects on South Island robins (Petroica australis) from
McIlroy JC 1984. The sensitivity of Australian animals to pest control using aerially applied 1080 poison. New
1080 poison. Vii. Native and introduced birds. Wildlife Zealand Journal of Ecology 38: 315–321.
Research 11: 373–385. Spurr EB 1979. A theoretical assessment of the ability of bird
McIntosh IG, Staples ELJ, Morris LG 1959. The toxicity of species to recover from an imposed reduction in numbers,
muscle, liver, and heart of deer poisoned with sodium with particular reference to 1080 poisoning. New Zealand
monofluoroacetate (1080). New Zealand Journal of Journal of Ecology 2: 46–63.
Science 2: 371–378. Spurr EB 1993. Feeding by captive rare birds on baits used
McIntosh IG, Bell J, Poole WSH, Staples ELJ 1966. The in poisoning operations for control of brushtail possums.
toxicity of sodium monofluoroacetate (1080) to the North New Zealand Journal of Ecology 17: 13–18.
Island weka (Gallirallus australis greyi). New Zealand Spurr EB, Powlesland RG 1997. Impacts of aerial application of
Journal of Science 9: 125–128. 1080 on non-target native fauna. Science for Conservation
Meenken D, Booth LH 1997. The risk to dogs of poisoning 62. Wellington, Department of Conservation. 31 p.
from sodium monofluoroacetate (1080) residues in Stewart-Oaten A, Murdoch WW, Parker KR 1986.
possum (Trichosurus vulpecula). New Zealand Journal Environmental impact assessment: “pseudoreplication”
of Agricultural Research 40: 573–576. in time? Ecology 67: 929–940.
Miller CJ, Anderson S 1992. Impacts of aerial 1080 poisoning TSRP 2009. Weka (Gallirallus australis) recovery plan.
on the birds of Rangitoto Island, Hauraki Gulf, New Threatened Species Recovery Plan 29. Wellington,
Zealand. New Zealand Journal of Ecology 16: 103–107. Department of Conservation. 94 p.
Murphy EC, Clapperton BK, Bradfield PMF, Speed HJ 1998. van Klink PA 2008. Effect of aerial application of 1080 carrot
Effects of rat-poisoning operations on abundance and baits for possum control on radio-tagged western weka
diet of mustelids in New Zealand podocarp forests. New (Gallirallus australis australis). Unpublished report to
Zealand Journal of Zoology 25: 315–328. the Animal Health Board.
Murphy EC, Robbins L, Young JB, Dowding JE 1999. van Klink PA 2013. Effect of aerial application of 1080 cereal
Secondary poisoning of stoats after an aerial 1080 poison baits for possum control on western weka (Gallirallus
operation in Pureora Forest, New Zealand. New Zealand australis australis). Unpublished report to the Department
Journal of Ecology 23: 175–182. of Conservation.
O’Connor CE, Milne LM, Arthur DG, Ruscoe WA, Wickstrom van Klink PA, Tansell AJS 2003. Western weka (Gallirallus
M 1999. Toxicity effects of 1080 on pregnant ewes. australis australis) monitored before and after an aerial
Proceeding of the New Zealand Society of Animal application of 1080 baits in the Copland Valley, Westland
Production 59: 250–253. National Park. DOC Science Internal Papers 108.
Powlesland RG, Knegtmans JW, Marshall ISJ 1999. Costs and Wellington, Department of Conservation. 12 p.
benefits of aerial 1080 possum control operations using Veltman CJ, Westbrooke IM 2011. Forest bird mortality and
carrot baits to North Island robins (Petroica australis baiting practices in New Zealand aerial 1080 operations
longipes), Pureora Forest Park. New Zealand Journal of from 1986 to 2009. New Zealand Journal of Ecology
Ecology 23: 149–159. 35: 21–29.
Powlesland RG, Knegtmans JW, Styche A 2000. Mortality Veltman CJ, Westbrooke IM, Powlesland RG, Greene TC 2014.
of North Island tomtits (Petroica macrocephala toitoi) A principles-based decision tree for future investigations
caused by aerial 1080 possum control operations, 1997–98, of native New Zealand birds during aerial 1080 operations.
Pureora Forest Park. New Zealand Journal of Ecology New Zealand Journal of Ecology 38: 103–109.
24: 161–168. Walker K 1997. Effect of aerial distribution of 1080 for possum
R Core Team 2016. R: a language and environment for statistical control on weka, great spotted kiwi, morepork and fernbird.
computing. Version 3.4.1. Vienna, Austria, R Foundation Ecological Management 5: 29–37.
for Statistical Computing. www.R-project.org
Editorial board member: Jamie Wood
Received 14 May 2018; accepted 23 August 2018You can also read