Sustainability Strategy 2015 - SMJFL
←
→
Page content transcription
If your browser does not render page correctly, please read the page content below
STRATEGIC PLAN 2012 – 2015
                                     Building A New Tradition

Sustainability Strategy 2015                                Updated December 2013. To be reviewed March 2015.

October 2015

Encourage, foster, develop and promote participation in
football in the region
(SMJFL Statement of Purpose No. 4)

                                                It’s about the kids
Bayside 2020 Community Plan

     Working together to
     make a better Bayside

The South Metro Junior Football League thanks the following funding partners:

                                                     1
SMJFL Sustainability Strategy 2015

About this document
      The SMJFL Sustainability Strategy 2015 provides an overview of the key findings of a
      detailed analysis of the projected growth of the South Metro Junior Football League. The
      report also contains a series of recommendations that when implemented will further
      strengthen junior football participation levels in the region, and the football pathway from
      Auskick to junior football and then to senior football.

Acknowledgements
      The input and assistance from the following people and groups for the preparation of the
      SMJFL Sustainability Strategy 2015 is acknowledged.
      •     SMJFL Board
      •     SMJFL General Manager
      •     SMJFL Football Operations Manager
      •     SMJFL Member Club representatives who attended forums and/or provided feedback
            on draft versions of the report
      •     Infrastructure & Planning Manager, AFL Victoria
      •     Region Development Manager – Southern, AFL Victoria
      •     Community Football & Engagement Manager, AFL Victoria
      •     Auskick centre representatives (Southern & Central Region) who attended forums
      •     Sport and recreation staff from the Cities of Port Phillip, Stonnington, Glen Eira,
            Monash, Bayside and Kingston
      •     Representatives from the Victorian Amateur Football Association and the Southern
            Football Netball League.

Simon Leisure Consulting Pty Ltd
ABN 38 314 852 941
Office 1, 655 Nepean Highway, Brighton East, Victoria 3187
M 0458 957 824
E richard@simonleisure.com
www.simonleisure.com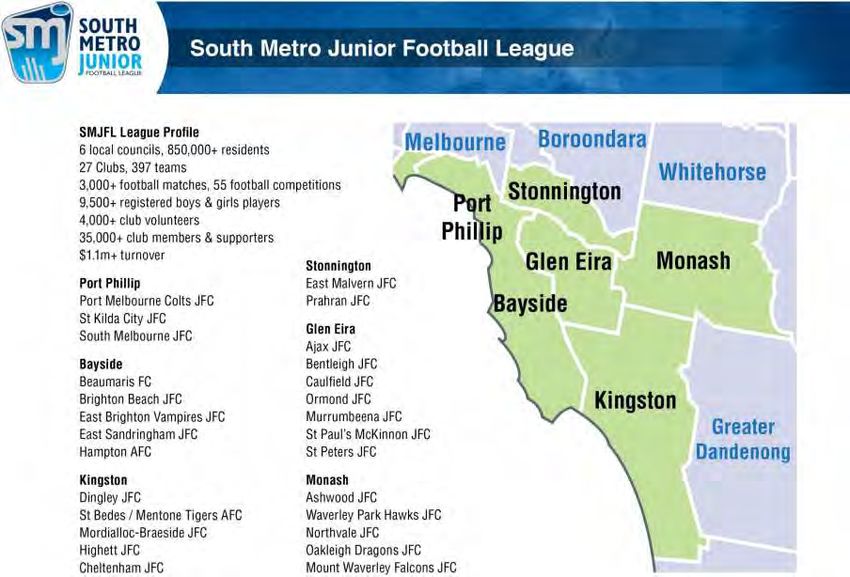
SMJFL Sustainability Strategy 2015

                                                                                                                          STRATEGIC PLAN 2012 – 2015
                                                                                                                           Building A New Tradition

                                                                                                                                                  Updated December 2013. To be reviewed March 2015.

                                          TABLE OF CONTENTS

1. SMJFL SUSTAINABLITY STRATEGY – EXECUTIVE SUMMARY ..................... 1
  1.1. Study Background ........................................................................................................ 1
  1.2. Key Findings ................................................................................................................. 1
  1.3. Recommendations ........................................................................................................ 4
2. INTRODUCTION ................................................................................................. 11
3. CONTEXT ............................................................................................................ 12
4. KEY ISSUES/ DRIVERS FOR THE STRATEGY ................................................ 14
  4.1.    Demographic Considerations ..................................................................................... 14
  4.2.    Trends of Participation in the SMJFL .......................................................................... 16
  4.3.    Trends of Participation in Auskick ............................................................................... 19
  4.4.    Trends of Participation in Other Sports ....................................................................... 20
5. FRAMEWORK FOR PLAYER RETENTION ....................................................... 22
  5.1. Implementation of the Framework Model ................................................................... 24
6. OTHER CONSIDERATIONS ............................................................................... 28
  6.1.    Top-Age Category ...................................................................................................... 28
  6.2.    Pathway Alignments ................................................................................................... 28
  6.3.    SMJFL Governance .................................................................................................... 29
  6.4.    Football Participation Recruitment .............................................................................. 30
  6.5.    Suggested Operational Changes for Selected Clubs ................................................. 31
  6.6.    Strategy Review .......................................................................................................... 32

Appendix 1 – Study Terms of Reference
Appendix 2 – Consultation Undertaken During the Preparation of the Sustainability Strategy
Appendix 3 – Results of the Cheltenham / Highett U14 Player Survey
Appendix 4 – Profile of SMJFL Clubs 2015
Appendix 5 – Possible Club Alignment Scenarios

Final Report.docx                                                                                                                         Page ii
SMJFL Sustainability Strategy 2015

                                                                                         STRATEGIC PLAN 2012 – 2015
                                                                                          Building A New Tradition

1.       SMJFL SUSTAINABLITY STRATEGY – EXECUTIVE SUMMARY
                                                                                                                 Updated December 2013. To be reviewed March 2015.

1.1.     Study Background
         The South Metro Junior Football League (SMJFL) comprises 27 clubs, and covers a
         geographic region that incorporates six local government areas in the southeast of
         Melbourne.
         In the past 10 years, the SMJFL has experienced significant growth in the total number
         of teams (164 additional teams since 2005). In addition, the SMJFL in recent times
         has encouraged composite teams to be formed between clubs, with the outcome in
         many cases being that players are retained longer in football with the effect that the
         number of teams dropping out in the older age groups is reducing. The Board and the
         Member Clubs agree that organic growth in team numbers and growth emanating from
         an improved retention of players should continue to be encouraged, however, growth
         also needs to be managed and facilitated to ensure it is sustainable.
         As a result, the SMJFL Member Clubs and the Board resolved in 2014 to prepare a
         Growth Strategy, which was subsequently re-named the SMJFL Sustainability Strategy
         2015, to better reflect the key outcomes of the research and the recommendations and
         directions of the study. A Terms of Reference for the study was developed and
         identified two key objectives for the Strategy: firstly, that a detailed analysis of the
         projected growth of the SMJFL be carried out; and secondly, that an assessment of the
         appropriateness of the SMJFL’s current model of delivery to accommodate projected
         growth be reviewed.
         The scope of the Strategy excluded a review of operational tasks administered by the
         SMJFL, such as umpiring, grading, and representative football. It also excluded game
         development activities and initiatives that are the key responsibility of AFL Victoria,
         including female football participation, multicultural communities’ football participation,
         and football pathway progression to TAC clubs.

1.2.     Key Findings
         Extensive research and stakeholder consultation was carried out during the study. The
         key findings are listed below, and these are reported in detail from Section 3 of this
         report.
         Context
         •    The Sustainability Strategy was prepared with consideration of the strategic
              directions of the SMJFL’s Strategic Plan 2015-2018 and AFL Victoria’s Strategic
              Plan 2015, particularly Objective 1 of the Participation Pillar …..
                     Develop and support appropriate pathways for all segments from AFL
                     Auskick to open age football that maximises participation.

         Demographic Change
         •    There is currently 122,000 people aged 5-19 years across the SMJFL region, and
              by 2031 this number will increase by 10,577 people. However, the growth to 2031
              will not be uniform across the region:
              −     Over one third of all growth of 5-19 year olds will occur in Monash (4,200).
              −     There will only be minimal growth of 5-19 year olds occur in Bayside (531) and
                    Stonnington (480).
         •    In 2014, there was approximately one SMJFL team per 309 children who were
              aged 5-19 years. Using this ratio of provision, the number of projected new teams
              to 2021 is 18 teams, and to 2031 is 35 teams. It can be concluded that a key

Final Report.docx                                                                                       Page 1
SMJFL Sustainability Strategy 2015

                                                                                                  STRATEGIC PLAN 2012 – 2015
                                                                                                   Building A New Tradition

              influence to the future growth of teams will be the retention of bottom-aged players                        Updated December 2013. To be reviewed March 2015.

              – organic growth of teams through population increase will be marginal.
         •    Cultural diversity of an LGA is an important indicator of the likely interest in and
              demand for football in an area.
              −     The proportion of residents in Port Phillip, Stonnington, Glen Eira and Kingston
                    who were Australian born in 2011 ranges between 60%-65%, which is
                    consistent with the Greater Melbourne average of 63.3%.
              −     70.8% of all Bayside residents are Australian born, whilst the proportion of
                    residents who are Australian born in Monash is significantly lower at 51.1%
                    (dominant cultures are China, India and Sri Lanka).

         Football Participation Trends                  450$
                                                                                               389$                399$
                                                                                       377$
         •    In the past six seasons there has         400$
                                                                       347$
                                                                               366$
                                                        350$
              been 26% growth in the number of                 317$
                                                        300$
              teams in the SMJFL (see right).
                                                        250$
         •    Girls-only football teams were            200$

              introduced in 2011, and the number        150$

              of teams has grown from 11 in the         100$

              first season to 23 in 2015, however,       50$

              growth has stabilised since 2012,           0$
                                                               2010$   2011$   2012$   2013$   2014$              2015$
              when there were 22 teams.
         •    The overall growth of teams has been generally evenly distributed through all age
              groups.
         •    Bayside has the highest ratio of players to population (1 team per 185 children),
              followed by Glen Eira (1: 255) and Port Phillip (1: 287).
         •    A key issue for the SMJFL is the progressive attrition of teams as age groups get
              older. In 2015, the 20 U17 teams converts to a 55% retention rate of the total
              number of teams that commenced as U10s seven years prior (36 teams). In 2010,
              there were 15 U17 teams, being a retention rate of 62% of the 24 teams that
              commenced in 2003.
         •    The largest and most consistent drop-off in age groups occurs during the transition
              from U12s to U13s, and from U15s to U16s.
         •    Survey research conducted by the SMJFL targeting players who drop out of
              football, identified that a key reason they did not play football was their club’s
              inability to field a team in their age group.
         •    Another issue that is found to influence players’ decision to continue in junior
              football is their level of enjoyment. Research suggests that footballers playing in a
              team in a division that is not commensurate with the player’s ability will significantly
              influence their level of enjoyment, and leads to some players dropping out of
              football or seeking transfers to other clubs with teams in a division deemed more
              aligned with their ability or aspirations.
         •    Research shows that larger clubs are more likely to field Division 1 teams than
              smaller clubs. In 2015, all clubs (15 clubs) with more than 13 teams had at least
              one Division 1 team, whilst only four of the 12 clubs with 12 or less teams had a
              Division 1 team. The impact of this is that smaller clubs are likely to continue to
              lose better skilled players to larger clubs that are able to field multiple teams in
              different divisions, or lose footballers from the SMJFL completely.

Final Report.docx                                                                                                Page 2
SMJFL Sustainability Strategy 2015

                                                                                         STRATEGIC PLAN 2012 – 2015
                                                                                          Building A New Tradition

         •    Club representatives consulted during the study recognise and acknowledge the                      Updated December 2013. To be reviewed March 2015.

              benefits of clubs having multiple teams per age group to facilitate the formation of
              teams and their subsequent placement in divisions that will better align with each
              player’s ability.
         •    Total participation in Auskick within the SMJFL region increased by 18% in the
              period 2011 to 2014. Auskick growth data confirms that there is an ongoing
              opportunity for the SMJFL and its Member Clubs to continue to grow participation
              in football by ensuring strong transition arrangements and pathways exist to junior
              football.

         Other Sports as Threats to Football Participation
         •    Survey research conducted by the SMJFL targeting players who drop out of
              football found that of all responses that cited “want to concentrate on another sport”
              as a reason for not returning to the SMJFL, basketball and soccer collectively
              contributed to 60% of the responses.
         •    Within the SMJFL region, the most significant increase in participation of the four
              sports of football, basketball, netball and soccer for the past few years has
              occurred in basketball (34% increase 2010 – 2014), followed by netball (27%
              increase 2009 – 2013), soccer (19% increase 2011 – 2015) and football (14%
              increase 2011 – 2014). (It is important to note that football had nearly twice as
              many participants for all sports during this period).
         •    Soccer is considered the biggest threat as all junior soccer matches (U12s and
              over) are played on Sundays, thereby directly clashing with the SMJFL competition
              structure. Most netball and basketball under age competitions are played on
              Saturdays, so the threat from these sports is not as great.
         •    Soccer’s popularity has grown considerably in Kingston (58%), Monash and
              Stonnington (both 33%) in the past five years, but was stable in Bayside and Glen
              Eira, although the governing body (Football Federation Victoria) cited the lack of
              soccer pitches as the constraint in these two LGAs, not declining interest.

         Current Existence of Football Pathways
         •    Some alignments currently exist between the Auskick centres, junior clubs and
              senior football clubs that are located within the SMJFL region.
         •    Currently, there are 30 Auskick centres, 27 SMJFL clubs and 52 senior football
              clubs based at grounds within the SMJFL region. The current number and
              distribution of senior football clubs within the SMJFL region exceeds the optimum
              number and distribution of junior clubs.

Final Report.docx                                                                                       Page 3
SMJFL Sustainability Strategy 2015

                                                                                                   STRATEGIC PLAN 2012 – 2015
                                                                                                    Building A New Tradition

1.3.     Recommendations                                                                                                   Updated December 2013. To be reviewed March 2015.

         The recommendations contained in the SMJFL Sustainability Strategy 2015 are
         summarised below, and in some instances a short rationale is provided. A more
         extensive discussion and background for the recommendations is included within the
         body of the Strategy report.
         All recommendations have been classified into one the following three categories,
         being the main organisations to which the recommendations are primarily directed or
         concern.
             •      South Metro Junior Football League
             •      Member Clubs
             •      Partner Organisations

         South Metro Junior Football League (Board/ Administration)
         1. It is recommended that in considering any application for admission of a new
            Member Club to the SMJFL pursuant to Rule 3.18 of the Statement of Purposes &
            Rules (pending any amendment to that Rule) that the SMJFL Board take into
            account:
                    a. the matters set out in this report (as reviewed from time to time in
                       accordance with Section 6.6);
                    b. the capacity of the proposed new club to achieve the aspirational framework
                       set out in Recommendation 4;
                    c. the extent to which the entry of the new club impacts on the capacity of a
                       Member Club to achieve and maintain the aspirational framework set out in
                       recommendation 4
                 The acceptance of existing junior clubs affiliated with other leagues, but based at reserves
                 within the area bound by the six LGAs of the SMJFL region, involves different
                 considerations. An existing junior club will most likely draw a majority of their players from
                 areas within the SMJFL region not currently being fully serviced by an existing SMJFL
                 club(s).

         2. It is recommended that the SMJFL Statement of Purpose No. 4 be amended to
            read, “Encourage, foster, develop and promote participation [and pathways] in
            football in the region.”
                 This recommendation is consistent with the importance that the SMJFL Board places on
                 pathways to foster football participation in the region.

         3. It is recommended that the SMJFL amend its Rules to give the Board the authority
            to approve new Member Clubs, however, before commencing this process it should
            firstly develop criteria for accepting new Member Clubs into the SMJFL.

Final Report.docx                                                                                                 Page 4
SMJFL Sustainability Strategy 2015

                                                                                                STRATEGIC PLAN 2012 – 2015
                                                                                                 Building A New Tradition

         SMJFL Member Clubs                                                                                             Updated December 2013. To be reviewed March 2015.

         4. It is recommended that all clubs affiliated with the SMJFL be required to
            demonstrate the football pathway from U8s to U17s for all players in their club,
            whether through capacity and capability within their club’s framework and
            resources, or whether by composite teams formed through clustering and alliances
            with other clubs.
              This recommendation supports a key goal of the SMJFL that all clubs field an U16 and
              anU17 team. However, the SMJFL understands and acknowledges that clubs may achieve
              this in different ways, either from within, or by forming composite teams with other clubs.

         5. It is recommended that the club framework described in the table below be adopted
            as the aspirational number of minimum teams required by each club, depending on
            the municipality in which the club is located.

                                                                             Port Phillip
                                     Kingston
                    Age                                   Glen Eira            Bayside
                                     Monash
                                                                             Stonnington
                    U8                   2                     2                    3
                    U9                   2                     3                    3
                    U10                  2                     3                    3
                    U11                  2                     2                    3
                    U12                  2                     2                    3
                    U13                  2                     2                    2
                    U14                  2                     2                    2
                    U15                  1                     2                    2
                    U16                  1                     1                    1
                    U17                  1                     1                    1
                    Total               17                    20                   23

         6. It is recommended that composite teams be formed between clubs, where clubs
            have insufficient numbers for a team to be fielded.
               This recommendation has the objective of a team(s) being formed from incomplete teams
               from 2-3 clubs that have insufficient numbers to field a full team.

         7. It is recommended that composite teams be formed between clubs, where clubs
            believe that the range of ability between the players in a team is so great that there
            will be a high probability that most players will not enjoy their football experience for
            the season, no matter what division the team is allocated.
               This recommendation has the aim to better align a player’s skill level with an appropriate
               division following a process whereby two or more clubs pool their players from the same
               age group to form teams of like or similar ability. The resultant teams are then entered into
               divisions commensurate with the overall skill and ability levels of the composite teams.
               This practice will typically result in a higher division team and a lower division team being
               formed, with each team comprising of a composite of players from each of the participating
               clubs. As well as having the outcome of better aligning the ability of players with an
               appropriate division, composite teams also enable players to remain at their origin club and
               potentially reduce player movements from lower graded teams (clubs) to higher graded
               teams (clubs). This outcome will then flow through to achieving improved club equalisation
               in relation to the comparative number of teams in higher divisions and lower divisions.

Final Report.docx                                                                                              Page 5
SMJFL Sustainability Strategy 2015

                                                                                                  STRATEGIC PLAN 2012 – 2015
                                                                                                     Building A New Tradition

         8. It is recommended that the formation of composite teams should generally be                                     Updated December 2013. To be reviewed March 2015.

            restricted to the age groups between U13 and U17, inclusive.
               This recommendation recognises that the composition of teams in the U8 to U12 age
               groups are highly likely to be based on friendships and/or schools, and to attempt to break
               up children and parents in these teams will more likely result in a less than satisfactory
               football experience for these participants. This recommendation also recognises that the
               range in talent, ability and/or size of players is not as wide as for older age groups. It also
               reinforces the responsibility that clubs have to maximise efforts to ensure that the number
               of teams in their lower age groups are healthy, and thereby improve the likelihood that the
               club remains sustainable. This aim for clubs to grow their bottom-age base will also assist
               to maximise the opportunity for the club to field teams in the post-primary age groups in the
               future.

         9. It is recommended that each SMJFL club develop alliances with other SMJFL
            Member Clubs to facilitate efficiencies for the process to form composite teams.
            Whilst each club should consider its own preferred alliances, some possible club
            alliance scenarios are outlined in the table below.

                Club                          Preferred Club(s) for Alliances
                Ajax                          St Kilda City, Ormond
                Ashwood                       Mount Waverley
                Beaumaris                     St Bedes/ Mentone, East Sandringham
                Bentleigh                     St Paul’s McKinnon, St Peters
                Brighton Beach                Hampton, East Brighton Vampires
                Caulfield                     Murrumbeena, Ormond
                Cheltenham                    Highett, St Bedes/ Mentone, Dingley
                Dingley                       Mordialloc-Braeside, Cheltenham
                East Brighton Vampires        St Kilda City, Brighton Beach, Hampton
                East Malvern                  Prahran, Murrumbeena
                East Sandringham              Hampton, Beaumaris, Highett
                Hampton                       Bri Beach, East Sandringham, East Bri Vampires
                Highett                       Cheltenham, East Sandringham
                Mordialloc-Braeside           Dingley, St Bedes/ Mentone
                Mount Waverley                Ashwood
                Murrumbeena                   Oakleigh, Caulfield, East Malvern
                Northvale                     Waverley Park
                Oakleigh                      St Peters, Murrumbeena
                Ormond                        Ajax, Caulfield
                Port Melbourne                South Melbourne Districts
                Prahran                       East Malvern, St Kilda City, South Melb Districts
                South Melbourne Districts     Port Melbourne, St Kilda City, Prahran
                St Bedes/ Mentone             Beaumaris, Mordialloc-Braeside, Cheltenham
                St Kilda City                 Ajax, East Bri Vampires, Sth Melb Districts, Prahran
                St Paul’s McKinnon            Bentleigh, St Peters
                St Peters                     St Paul’s McKinnon, Bentleigh, Oakleigh
                Waverley Park                 Northvale
               It is acknowledged that presently the Statement of Purpose and Rules of the Ajax JFC may
               preclude the club from forming composite teams.

Final Report.docx                                                                                                  Page 6
SMJFL Sustainability Strategy 2015
STRATEGIC PLAN 2012 – 2015
Building A New Tradition
10. It is recommended that all clubs be required to document the strategic alliances Updated December 2013. To be reviewed March 2015.
that they have with clubs, and how the pathway for a player will likely progress
when composite teams with aligned clubs are required to be formed.
Such a document will outline the factors that may trigger the requirement for a composite
team, the preferred clubs with which the composite team will be formed, and an outline of
the probable operational arrangements that will come into effect.
11. It is recommended that all clubs will have such a document completed and publicly
available to their members by the commencement of the 2017 SMJFL football
season.
Final Report.docx Page 7SMJFL Sustainability Strategy 2015
Partners
STRATEGIC PLAN 2012 – 2015
Building A New Tradition
12. It is recommended that each SMJFL club develop alignments with Auskick centres so as to facilitate the progression of players from
Updated December 2013. To be reviewed March 2015.
Auskick to junior football, and develop relationships with senior clubs so as to identify potential opportunities for players to progress to
senior football. Whilst each junior club should develop their own preferred alignments and relationships, some possible alignment
scenarios are outlined in the table below.
SMJFL&Club Main&Feeder&Primary&Schools Auskick&Centre VAFA&Club SFNL&Club Other&Leagues&Club
Ajax&JFC Not(Applicable,(as(the(player(pool(is(drawn(from( Ajax&JFC Ajax&JFC
Princes(Park players(of(a(specific(cultural(background Princes(Park Gary(Smorgan(Oval((Albert(Park) A A
Ashwood&JFC Ashwood Ashwood&FC
Parkhill(PS,(Essex(Heights(PS,(Holy(Family(School
Essex(Heights(Reserve Essex(Heights(Reserve A Essex(Heights(Reserve A
Beaumaris
Beaumaris(PS,(Beamauris(North(PS,(Black(Rock(PS,( Banksia(Reserve
Beaumaris&FC Beaumaris&FC Black&Rock&FC
Cheltenham(East(PS,(St(joseph's(PS, A
Banksia(Reserve Black&Rock/&Beaumaris&Nth Banksia(Reserve Donald(MacDonald(Reserve
Stella(Maris(PS,(Mentone(Grammar(
MacDonald(Reserve(
Bentleigh&JFC Bentleigh Glen&Eira&Saints&FC Bentleigh&FNC
Tucker(Road(Bentleigh(PS,(Bentleigh(West(PS
King(George(VI(Reserve King(George(VI(Reserve Packer(Park Bentleigh(Reserve A
Brighton&Beach&JFC Brighton(Beach(PS,(Brighton(PS,(St(Joan(of(Arc( Brighton Old&Brighton&Grammarians&FC Moorabbin&Kangaroos&FC
Brighton(Beach(Oval School Whyte(Street(Reserve Brighton(Beach(Oval Moorabbin(West(Reserve H
Caulfield
Caulfield&JFC Carnegie(PS,(St(Anthony's(School,(Ripponlea(PS,( Koornang(Park Caulfield&JFC
A A
Koornang(Park McKinnon(PS Glen&Eira&Saints Koornang(Park
Packer(Park
Cheltenham&JFC Cheltenham(PS,(Kingston(Heath(PS,(Le(Page(PS, Cheltenham&Panthers Cheltenham&FC
Le(Page(Park Our(Lady(of(Assumption( Le(Page(Park A Jack(Barker(Oval A
Dingley&JFC Dingley Dingley&FNC
Dingley(PS,(Kingswood(PS,(St(Mark's(PS
Souter(Reserve Souter(Reserve A Souter(Reserve A
Elsternwick
Brighton(PS,(Bentleigh(West(PS,(Elsternwick(PS,( Elsternwick(Park
East&Brighton&Vampires&JFC Old&Brighton&Grammarians&FC East&Brighton&&FC
Gardenvale(PS,(St(Joan(of(Arc(School,(St(Finbars( A
Hurlingham(Park East&Brighton Brighton(Beach(Oval Hurlingham(Park
PS,(Brighton(Grammar(
Hurlingham(Park(
East&Malvern&JFC Malvern(PS,(Lloyd(Street(PS,(St(Mary's(PS, Malvern&Districts East&Malvern&FC
DW(Lucas(Oval St(Roch's(PS,(Caulfield(Grammar,(St(Kevins(College DW(Lucas(Oval A DW(Lucas(Oval
East&Sandringham&JFC Sandringham(PS,(Sandringham(East(PS, East&Sandringham Hampton&Rovers&FC Hampton&Hammers&FC
Chisholm(Reserve Sacred(Heart(PS,(Haileybury(College Chisholm(Reserve Boss(James(Reserve Peterson(Street(Reserve A
Hampton&Rovers&FC Hampton Hampton&Rovers&FC
Hampton(PS,(St(Mary's(PS,(St(Leonard's(College
Boss(James(Reserve Castlefield(Reserve Boss(James(Reserve A A
Highett&FC Highett Highett&FC
Southmoor(PS,(St(Catherine's(PS
Highett(Reserve Highett(Reserve A Highett(Reserve A
Parkdale(PS,(Parktone(PS,(Mentone(Park(PS,(
Mordialloc&Braeside&JFC Aspendale(Gardens(PS,(St(John(Vianney's(PS, Parkdale Parkdale&FC
Walter(Galt(Reserve St(Brigid's(PS Walter(Galt(Reserve Walter(Galt(Reserve A A
Mount&Waverley
Mount&Waverley&JFC Pinewood(Reserve Oakleigh&District&FC
AmsleighPark(PS,(Pinewood(PS,(Holy(Family(PS A A
Pinewood(Reserve Oakleigh&Districts Princes(Highway(Reserve
Princes(Highway(Reserve
Final Report.docx Page 8SMJFL Sustainability Strategy 2015
STRATEGIC PLAN 2012 – 2015
SMJFL&Club Main&Feeder&Primary&Schools Auskick&Centre VAFA&Club SFNL&Club Other&Leagues&Club Building A New Tradition
Murrumbeena&JFC Murrumbeena Murrumbeena&FC
Updated December 2013. To be reviewed March 2015.
Murrumbeena)PS,)Hughesdale)PS,)St)Patrick's)PS
Murrumbeena)Park Murrumbeena)Park 8 Murrumbeena)Park 8
Northvale&JFC Mazenod&OCFC
St)John)Vianney's)PS @
Wellington)Reserve Central)Reserve& 8 8
Oakleigh&JFC Oakleigh)South)PS, Oakleigh Oakleigh&AFC
Scammell)Reserve Christ)Our)Holy)Redeemer)School Oakleigh)South)PS Scammell)Reserve 8 8
Ormond&JFC Ormond)PS,)Caulfield)South)PS,)McKinnon)PS, Ormond Ormond&AFC
EE)Gunn)Reserve& Glen)Huntly)PS,)St)Joseph's)PS,)St)Kevins)PS EE)Gunn)Reserve& EE)Gunn)Reserve& 8 8
Port&Melbourne&Colts&JFC Port)Melbourne)PS,)Galilee)Regional)Catholic)PS,) Port&Melbourne&Colts Port&Melbourne&Colts&FC
JL)Murphy)Reserve Albert)Park)PS,)Middle)Park)PS,)Wesley)College JL)Murphy)Reserve 8 8 JL)Murphy)Reserve
Prahran&JFC Armadale)PS,)Our)Lady)of)Lourdes)PS, Stonnington&/&Old&Xavs Prahran&Assumption&FC
Toorak)Park Melbourne)Grammar Toorak)Park Toorak)Park 8 8
South&Melbourne&Districts&JFC Albert)Park)PS,)Middle)Park)PS,)St)Kilda)Park)PS,) South&Melbourne South&Melbourne&Districts&FC
Albert)Oval)11 Wesley)College,)St)Michael's)Grammar Albert)Oval)11 Albert)Oval)11 8 8
St&Bedes&/&Mentone&AFC Mentone St&Bedes&/&Mentone&AFC
Mentone)PS,)St)Patrick's)Parish)PS 8 8
Mentone)Reserve Mentone)Reserve Mentone)Reserve
St&Kilda&City&JFC Elwood)PS,)St)Kilda)PS,)Ripponlea)PS, Elsternwick Elsternwick&AFC St&Kilda&City&FC
Peanut)Farm)&)Elwood)Park Elsternwick)PS,)St)Columba's)PS Elsternwick)Park Elsternwick)Park Peanut)Farm 8
St&Paul's&McKinnon&JFC St&Paul's&Valkstone&PS& St&Paul's&FC
Valkstone)PS,)McKinnon)PS,)St)Paul's)PS
McKinnon)Reserve McKinnon)Reserve 8 McKinnon)Reserve 8
St&Peters St&Paul's&FC
St&Peters&JFC Centenary)Park Ormond&AFC McKinnon)Reserve
St)Peter's)PS,)Coatesville)PS,)South)Oakleigh)PS 8
Centenary)Park Coatesville EE)Gunn)Reserve) Bentleigh&FNC
Coatesville)PS Bentleigh)Reserve
Waverley&Park&Hawks
Waverley)Park)Stadium
Waverley&Park&JFC Jells)Park)PS,)St)Justin's)PS,)St)Leonard's)PS, St&Justin's&Wheelers&Hill Mazenod&OCFC Mulgrave&FC
8
Columbia)Park Good)Shepherd)Parish)School Columbia)Park Central)Reserve& Mulgrave)Reserve
Mazenod&St&Leonards
Central)Reserve
Senior&Clubs&within&the&SMJFL®ion&with&no&existing& Albert)Park)FC Mordialloc)FNC Waverley)Blues
or&proposed&alignment Caulfield)Grammarians)FC Heatherton)FC Glen)Waverley)Hawks
Chadstone)AFC Southern)Dragons)FC (2)
Collegians)FC Mount)Waverley)FNC
De)La)Salle)FC (4)
Melbourne)High)School)OBFC
Monash)Blues)FC
Monash)Gryphons)AFC
Old)Geelong)FC
Old)Haileyburians')AFC
Old)Melburnians)FC
Old)Mentonians)FC
Old)Xaverians)FC
Powerhouse)AFC
St)Kevin's)Old)Boys)FC
(15)
Final Report.docx Page 9SMJFL Sustainability Strategy 2015
STRATEGIC PLAN 2012 – 2015
Building A New Tradition
13. It is recommended that additional resources be allocated to the SMJFL by AFL Vic, Updated December 2013. To be reviewed March 2015.
or by other funding sources, for the specific purpose of delivering junior football
recruitment activities and services within the SMJFL region.
Final Report.docx Page 10SMJFL Sustainability Strategy 2015
STRATEGIC PLAN 2012 – 2015
Building A New Tradition
2. INTRODUCTION Updated December 2013. To be reviewed March 2015.
Australian Football continues to experience unprecedented growth and record
numbers of participants in Victoria. In 2014, more than 290,000 people participated in
some form of organised football activity, which was an increase of 8.7% on the
previous year’s levels of participation1.
Grassroots junior football continues to be a key driver in stimulating the record levels of
interest and participation in football. The South Metro Junior Football League (SMJFL)
is one of the largest junior football organisations in Victoria. It currently accommodates
more than 9,500 participants, including mixed gender footballers and umpires. The
players make up 399 teams
SMJFL STRATEGIC PLANacross
2015 – 2018 52 different divisions that service age groups
ranging from Under 8s to Under 17s, including three girls-only divisions in the age
groups Under 12s, 15s and 18s.
The SMJFL comprises 27 clubs, and covers a Figure 1 – Region Serviced by the SMJFL
geographic region that incorporates six local
government areas in the southeast of Melbourne
(see Figure 1). In the past five years, the SMJFL
has experienced significant growth, and whilst this
growth is encouraged and embraced by the
SMJFL Board and its affiliate clubs, all however
recognise that such growth needs to be managed
and controlled. To this end, a resolution from
Member Clubs was carried at the 2014 SMJFL
Annual General Meeting requiring the Board to
prepare a Growth Strategy for the SMJFL (later
re-named Sustainability Strategy).
Underpinning the resolution was the desire of
clubs that a detailed analysis of the projected
growth of the SMJFL be carried out, as well as an
assessment of the appropriateness of the
SMJFL’s current model of delivery to accommodate projected growth.
The SMJFL Board prepared a Terms of Reference in March 2015, and subsequently
appointed Simon Leisure Consulting, a sports and recreation planning firm, to assist it
with the development of the Sustainability Strategy. (See Appendix 1 for the study’s
Terms of Reference). The study has involved a combination of research tasks,
analysis of data, and consultation with the following stakeholders (see Appendix 2 for
the consultation program):
• SMJFL Board and staff.
• SMJFL clubs.
• AFL Victoria, including the Regional Development Manager - Southern.
• Sports and recreation staff from the Cities of Port Phillip, Stonnington, Glen
Eira, Monash, Bayside and Kingston.
• Victorian Amateur Football Association.
• Southern Football Netball League.
• Representatives from the Auskick centres located in the SMJFL region.
• Parks Victoria (in relation to clubs based at Albert Park).
The report provides an overview of the key findings of the study, and a series of
recommendations to further strengthen junior football participation levels in the region.
1
Source: AFL Victoria Infographic 2014.
Final Report.docx Page 11SMJFL Sustainability Strategy 2015
STRATEGIC PLAN 2012 – 2015
Building A New Tradition
3. CONTEXT Updated December 2013. To be reviewed March 2015.
AFL Victoria is the peak organisation for the planning and development of Australian
Football in Victoria. It has overseen significant growth in football participation in the
past 10 years, which now sees record numbers of boys, girls, men and women
involved.
In 2014, total participation in football (298,998 people) increased by 8.7% compared to
2013, and comprised of:
• 145,136 club footballers (increase of 2.3% on 2013).
• 48,010 Auskickers (increase of 1.1%).
• 30,000 female footballers (increase of 41%).
• 1,106 clubs.
• 5,826 teams.
Participation in the game has never been
healthier.
AFL Victoria’s Vision is …….. GIC PL
AN SU
MMAR
Y
STRATE
To be the most accessible sport for all Victorians2
x{
Ê6 ÊÎä
au Ê ÀÌ
.com. *>À>`i
]Ê >ÀÌ
aflvic Ê,Þ>Ê iÊ6
ÊÎää£
www. Ê*>À]Ê
>ÌiÊÎ
ÎÎÇÊ i
LÕÀ
"
ESS: : *"Ê{
ADDR DRESS
L AD
POSTA
9ÊÓ ä£x
/ Ê1
*,
And it’s Mission ……..
Increase opportunities to participate in Australian Football
Nurture and promote participation and talent pathways
Strengthen the community connection to Australian Football
Seven Strategic Objectives have been adopted to guide the work of AFL Victoria, with
each grouped into three Development Pillars.
Pillar #1 Pillar #2 Pillar #3
Community Best Talent Great Infrastructure
Foundation
1. Participation 5. Talent & Second Tier 6. Facilities
2. Community 7. People & Culture
3. Engagement
4. Fans
The SMJFL Sustainability Strategy was prepared predominantly with consideration of
the strategic context of supporting AFL Victoria’s Community Foundation Pillar, and the
Key Strategic Objective 1: Participation …..
Develop and support appropriate pathways for all segments from AFL Auskick to
open age football that maximises participation.
2
Source: AFL Victoria’s Strategic Plan 2015.
Final Report.docx Page 12SMJFL Sustainability Strategy 2015
STRATEGIC PLAN 2012 – 2015
Building A New Tradition
The SMJFL’s Strategic Plan 2015-2018 also informs the Sustainability Strategy. The Updated December 2013. To be reviewed March 2015.
following three Pillars underpin the Plan:
Pillar – Governance
To ensure that our decision making is
independent, professional and accountable for
the betterment of our stakeholders, for short to
long term interests
Pillar – Football 2015 – 2018
IC PLAN
STRATEG s
t the Kid
It’s abou
Maintain quality football competitions, pathways .
and environments that are safe and fun and
uary 2016
wed Febr
. To be revie
March 2015
Updated
which promote health and inclusiveness for all
Pillar – Stakeholders
Building and elevating the SMJFL brand in the community
The SMJFL Sustainability Strategy directly responds to three of the eight Objectives
from Pillar – Football:
1. Maintain and grow an effective competition structure with focus on quality,
evenness, friendliness, inclusiveness and competitiveness
4. Build and promote effective pathways from Auskick through to Junior
competitions to Seniors with the objective of retaining all participants in football
8. SMJFL Growth Strategy (now the Sustainability Strategy)
Final Report.docx Page 13SMJFL Sustainability Strategy 2015
STRATEGIC PLAN 2012 – 2015
Building A New Tradition
4. KEY ISSUES/ DRIVERS FOR THE STRATEGY Updated December 2013. To be reviewed March 2015.
The preparation of the Sustainability Strategy was informed by a number of issues and
drivers impacting football participation across the region covered by the SMJFL:
• Demographic considerations.
• Trends of participation in the SMJFL.
• Trends of participation in Auskick.
• Trends of participation in other sports.
4.1. Demographic Considerations
Understanding the current and projected population profile of the region covered by the
SMJFL is a key to identifying trends in the demand for football, and also where
opportunities might exist to increase football participation.
Table 1 shows the estimated 2014 population for the six local government areas
(LGAs) covered by the SMJFL, and also the projected population growth in each LGA
and then as a region.
3
Table 1 – Projected Population for SMJFL Region
No. of 5 to 19 year olds Difference
2014 2021 2031 2014-2021 2014-2031
Region 121,947 127,220 132,524 5,273 10,577
Port Phillip 9,468 10,219 11,078 751 1,610
Stonnington 14,005 14,025 14,485 20 480
Glen Eira 24,003 24,855 25,481 852 1,478
Monash 30,526 32,531 34,726 2,005 4,200
Bayside 18,730 18,846 19,261 116 531
Kingston 25,215 26,744 27,493 1,529 2,278
The age cohort of 5-19 year olds corresponds with the age range of SMJFL
participants. Table 1 shows that the total projected net increase of 5-19 year olds
across the region to 2031 will be 10,577, however, the growth will not be uniform
across the region:
• Over one third of the projected growth of 5-19 year olds will occur in Monash,
however, only a quarter of all 5-19 year olds in the region reside in Monash.
Whilst only part of the Monash LGA lies within the SMJFL region, it is significant
that there is high growth of 5-19 year olds projected in the suburbs that are
within the region (Oakleigh, Clayton, Glen Waverley).
• There is only a minimal increase in the number of 5-19 year olds projected for
Bayside and Stonnington.
• Just on half the projected growth of 5-19 year olds to 2031 throughout the
region will occur by 2021, or in the next 6 years, and nearly two thirds is
projected to occur in Kingston and Monash, however, not all of the areas of
these LGAs fall within the SMJFL region.
3
Source: Profile id.
Final Report.docx Page 14SMJFL Sustainability Strategy 2015
STRATEGIC PLAN 2012 – 2015
Building A New Tradition
The cultural diversity of an LGA is an important indicator of the likely interest in and Updated December 2013. To be reviewed March 2015.
demand for football in an area. ABS data shows that children born in non-mainly
English speaking countries are less likely to participate in sport than Australian born
children (40.4% compared to 61.1%4). In relation to the cultural diversity of the six
LGAs, Profile id data identifies the following characteristics:
• The proportion of all residents in Port Phillip, Stonnington, Glen Eira and
Kingston who were Australian born in 2011 ranges between 60%-65%, which is
consistent with the Greater Melbourne average of 63.3%.
• 70.8% of all Bayside residents are Australian born.
• For Monash, the proportion of residents who are Australian born is significantly
lower than the other five LGAs within the SMJFL region at 51.1%. Of note,
there was a 3.2% reduction of the proportion of Australian born people residing
in Monash between 2006 and 2011. During the same period, the proportion of
people born in China, India and Sri Lanka increased from a combined
proportion of 10.8% to 15.8%.
Implications for Football Participation in the SMJFL Region
1. The number of potential new junior footballers in the SMJFL region will increase
by nearly 11,000 children by 2031.
2. Whilst the largest potential increase in demand will be in Monash, actual
demand is likely to be somewhat offset by the increased cultural diversity of this
LGA.
3. In 2014, there was approximately one SMJFL team per 309 children who were
aged 5-19 years. Using this ratio of provision, the number of projected new
teams to 2021 is 18 teams, and to 2031 is 35 teams.
Bayside has the highest ratio of players to population (1 team per 185 children),
followed by Glen Eira (1: 255) and Port Phillip (1: 287). The ratios for
Stonnington, Monash and Kingston are lower, however, this will be partly
explained by the fact that these three LGAs have sections of their municipalities
covered by other junior football leagues.
The key influence to future growth of teams will be the retention of bottom-aged
players – organic growth of teams through population increase will be marginal.
4
Source: Children's Participation in Cultural and Leisure Activities, Australia, ABS (2012).
Final Report.docx Page 15SMJFL Sustainability Strategy 2015
STRATEGIC PLAN 2012 – 2015
Building A New Tradition
4.2. Trends of Participation in the SMJFL Updated December 2013. To be reviewed March 2015.
In the past six seasons there has been Figure 2 – SMJFL Teams 2010-2015
substantial growth in the number of
teams in the SMJFL.
450$
Figure 2 shows that the overall number 400$ 366$ 377$ 389$ 399$
of teams has increased by 26%. 350$ 317$
347$
Girls-only football teams were 300$
introduced in 2011, and the number of 250$
200$
teams has grown from 11 in the first
150$
season to 23 in 2015, however, growth
100$
has stabilised since 2012, when there
50$
were 22 teams.
0$
2010$ 2011$ 2012$ 2013$ 2014$ 2015$
See Appendix 4 for the profile of teams
per club for 2015.
The overall growth of teams has been generally evenly distributed through all age
groups (see Figure 3). In 2014, an U8 category was introduced, and this has had the
effect of reducing the total number of U9 teams in 2014 and 2015, when compared to
previous seasons.
Figure 3 – SMJFL Teams by Age Groups (2010-2015)
No.$Of$Teams$(2010$0$2015)$
90"
80"
70"
60"
50"
40"
30"
20"
10"
0"
U8" U9" U10" U11" U12" U13" U14" U15" U16" U17"
2010" 2011" 2012" 2013" 2014" 2015"
A key issue for the SMJFL is the progressive attrition of teams, as age groups get
older.
One of the main impacts from the loss of any team Three most popular reasons cited by U13-15
is the loss of players to football. Whilst some players who stopped playing SMJFL football:
players and their parents ultimately decide that 1. School studies (27.5%)
‘football is not for them’ or other commitments in 2. School football (27.5%)
their lives take priority (such as school studies or 3. Club could not field a team (18%)
school football), for other players the inability of Source: SMJFL survey conducted in 2013 of players
their club to field a team inevitably results in them who did not return to SMJFL football
being lost to football.
Final Report.docx Page 16SMJFL Sustainability Strategy 2015
STRATEGIC PLAN 2012 – 2015
Building A New Tradition
Table 2 below tracks the retention of teams from U10 to U17 for the period since 2003. Updated December 2013. To be reviewed March 2015.
It shows the following retention rates:
• 2015 U12 retention from U10s = 80%
• 2015 U13 retention from U10s = 74%
• 2015 U14 retention from U10s = 69%
• 2015 U15 retention from U10s = 67%
• 2015 U16 retention from U10s = 57%
• 2015 U17 retention from U10s = 55%
Table 2 – Retention of SMJFL Teams From U10 to U17
U10 U11 U12 U13 U14 U15 U16 U17
2015 52 49 42 38 34 30 21 20
2014 50 51 44 39 37 27 26 13
2013 53 48 46 37 30 30 19 13
2012 51 51 44 33 33 25 20 13
2011 49 47 40 35 33 26 18 14
2010 45 40 41 36 30 24 18 15
2009 37 45 40 31 26 23 19 12
2008 36 36 28 25 22 20 12 16
2007 36 31 28 24 23 22 16 20
2006 33 30 26 28 21 22 18 16
2005 27 26 28 22 25 23 14 20
2004 24 26 23 26 21 17 15 18
2003 24 25 28 24 17 22 14 15
In addition, the retention rates of teams in all age groups in 2010 were assessed by
tracking back to each age group’s origin U10 year. In 2010, the retention rate of:
• the U12s was 114%.
• the U13s was 100%.
• the U14s was 91%.
• the U15s was 89%.
• the U16s was 75%.
• the U17s was 62%.
In both scenarios, the largest and most consistent drop-off in age groups occurred
between the U12s and U13s, and between the U15s and U16s.
Another issue that anecdotally influences the levels of enjoyment of players and the
retention rate of players is the standard of football of the division in which a team is
placed. For clubs with only one team, the range of abilities amongst the players will
typically be large, so for players with better developed skills than their team mates,
they will likely not enjoy playing in a Division 3 or Division 4 competition, even though
on balance the lower division is the right standard for the combined talent of the team.
In this scenario, clubs risk losing better skilled players and high achievers to other
clubs that have a Division 1 team.
And vice versa, a player of lessor ability in a Division 1 team of skilled players, will
likely experience low levels of enjoyment, involvement and sense of contribution to the
team’s performance. In this scenario, clubs risk losing this player also, but equally as
important football risks losing this player to the sport altogether.
Final Report.docx Page 17SMJFL Sustainability Strategy 2015
STRATEGIC PLAN 2012 – 2015
Building A New Tradition
Table 3 compares the size of clubs to the frequency of the number of Division 1 teams. Updated December 2013. To be reviewed March 2015.
The table shows that larger clubs have a significantly improved chance of fielding
Division 1 teams compared to smaller clubs. In fact, all clubs with more than 13 teams
(15 clubs) have at least one Division 1 team, whilst only four of the 12 clubs with 12 or
less teams have a Division 1 team (includes the composite Division 1 team that Highett
and Cheltenham have formed).
Table 3 – Division 1 Teams Compared to Club Size (2015, SMJFL)
Total Div 1 Total
CLUB U11 U12 U13 U14 U15 U16 U17
Teams Teams
East Sandringham 1 1 1 1 1 1 6 20
Mordialloc Braeside 1 1 1 1 1 5 22
Beaumaris 1 1 1 1 4 24
East Brighton Vampires 1 1 1 1 4 25
Prahran 1 1 1 1 4 17
Cheltenham 1 0.5 1 2.5 13
East Malvern 1 1 1 3 29
Ormond 1 1 1 3 17
St Kilda City 1 1 1 3 15
Ajax 1 1 2 18
Brighton Beach 1 1 2 9
Murrumbeena 1 1 2 15
Sth Melbourne Districts 1 1 2 16
Waverley Park 1 1 2 15
Hampton 1 1 12
St Bedes / Mentone 1 1 15
St Peters 1 1 16
St Paul's McKinnon 1 1 11
Highett 0.5 0.5 7
Ashwood 0 4
Bentleigh 0 10
Caulfield 0 12
Dingley 0 12
Mount Waverley 0 2
Northvale 0 3
Oakleigh 0 12
Port Melbourne 0 5
Whilst this statistic should be somewhat expected, the impact for the smaller clubs is
that they are likely to continue to lose better skilled players to the larger clubs that are
able to field multiple teams in different divisions, or lose the players to the SMJFL
completely. One means to counter this recurring scenario for smaller clubs is to
consider what Cheltenham and Highett did in 2015 – form two composite teams of
different standards from the available playing pool of U14s from both clubs. This was a
good example of how pooling the playing stock from two single club teams in the same
age group can result in a higher division team being formed and a lower division team.
The result was that both clubs were able to place most boys into the appropriate
division for their respective levels of ability. The SMJFL surveyed all players who
participated in these composite teams, and the results confirm higher levels of
satisfaction by the players with their football experience and an increased likelihood
that players will continue to ‘stay in the game’ irrespective of their ability. A full review
of the survey results are contained in Appendix 3, with some key findings being:
• 97% of respondents (31 players) thought the merging of the teams was good.
• 45% of respondents would have either not played football in 2015 or would have
moved to another club, if the two clubs didn't merge the two teams.
• 100% of respondents intend playing SMJFL football in 2016.
Final Report.docx Page 18SMJFL Sustainability Strategy 2015
STRATEGIC PLAN 2012 – 2015
Building A New Tradition
• 100% of respondents recommend the clubs continue with the composite teams Updated December 2013. To be reviewed March 2015.
in 2016.
As well as having the outcome of better aligning the ability of players with the
appropriate division, composite teams also enable players to remain at their origin club
and potentially reduce player movements from lower graded teams (clubs) to higher
graded teams (clubs). This outcome will then flow through to achieving greater club
equalisation in relation to the comparative number of teams in higher divisions and
lower divisions.
Club representatives consulted during this study also recognised and acknowledged
the benefits of having multiple teams (see below).
Selection of club responses regarding the benefit of multiple teams per age group …..
“Different abilities can be better catered for” (St Paul’s McKinnon JFC)
“Greater opportunities for development.” (Mordialloc Braeside JFC)
“Able to offer players a choice of teams and mix groups.” (Ormond JFC)
“If done correctly a club can have an "A" and "B" team which will ensure you have older age groups”.
(Northvale JFC)
“Protects against drop off and allow for a better spread of players of differing abilities and development”
(Murrumbeena JFC
Source: SMJFL club survey conducted in 2015
4.3. Trends of Participation in Auskick
Total participation in Auskick within the Figure 3 – Auskick Participation in the SMJFL Region
SMJFL region increased by 18% in the
period 2011 to 2014. 6000%
5562% 5629%
Whilst the total number of participants 5500%
decreased in 2015, this is explained by 5135%
4961%
5000%
the introduction of the U8s age group in 4781%
the SMJFL. 4500%
4000%
3500%
3000%
2011% 2012% 2013% 2014% 2015%
Of note is that the intake of Kinda (5 years) and Prep (6
years) children in Auskick in the SMJFL region has never Year Kinda Prep
been as high as has been recorded in 2015. 2013 165 790
2014 296 1,248
2015 697 1,459
Collectively, this Auskick data confirms that there is an ongoing
opportunity for the SMJFL and its affiliate clubs to grow
participation in football.
Final Report.docx Page 19SMJFL Sustainability Strategy 2015
STRATEGIC PLAN 2012 – 2015
Building A New Tradition
4.4. Trends of Participation in Other Sports Updated December 2013. To be reviewed March 2015.
There has been growth in soccer, basketball and netball participation in the past 5 – 6
years throughout the SMJFL region. These three sports are noteworthy as they are
the most popular sports that provide direct competition to football participation. The
survey conducted in May-June 2015 of SMJFL players who did not return in 2015 to
play football, found that of all responses that cited “want to concentrate on another
sport” as a reason for not returning to the SMJFL, basketball and soccer collectively
contributed to 60% of the responses.
Soccer is considered the biggest threat as all competition matches (U12s and over) are
played on Sundays, whilst for netball and basketball most under age competitions are
played on Saturdays.
Tables 4 – 6 show a comparison of junior participation data (under 18 years) for each
of these sports by LGA. For comparative purposes, the SMJFL football participation
levels have also been included (Table 7). The data shows that the most significant
increase in participation of the four sports has occurred in basketball (41% increase
2010 – 2014), followed by netball (27% increase 2009 – 2013), soccer (19% increase
2011 – 2015) and football (14% increase 2011 – 2014).
Throughout the different reporting periods, football consistently had nearly twice as
many participants as the closest sport (basketball).
Of the six LGAs, Port Phillip has experienced the two largest increases of any sport in
any LGA: soccer growth of 132% and netball growth of 169% (although both from
comparatively low bases). Similar to Port Phillip, soccer popularity has grown
considerably in Kingston (58%), Monash and Stonnington (both 33%), but was stable
in Bayside and Glen Eira. (FFV’s MyFootballClub Manager cited the lack of soccer
pitches as the constraint in these two LGAs, not declining interest).
Football recorded the highest increase of all of the sports in Stonnington, whilst it
recorded no growth or a decline in Port Phillip and Monash.
5
Table 4 – Participation in Junior Soccer in the SMJFL Region (2011-2015)
LGA 2011 2015 Change % Change
Region 7,063 8,383 1,320 19%
Port Phillip 295 684 389 132%
Stonnington 155 206 51 33%
Glen Eira 1,599 1,580 -19 -1%
Monash 1,513 2,009 496 33%
Bayside 2,805 2,801 -4 0%
Kingston 696 1,103 407 58%
5
Source: Football Federation Victoria’s MyFootballClub Manager (2015).
Final Report.docx Page 20SMJFL Sustainability Strategy 2015
STRATEGIC PLAN 2012 – 2015
Building A New Tradition
6
Table 5 – Participation in Junior Basketball in the SMJFL Region (2010-2014) Updated December 2013. To be reviewed March 2015.
LGA 2010 2014 Change % Change
Region 7,092 9,966 2, 874 41%
Port Phillip 448 420 -28 -6%
Stonnington 182 189 7 4%
Glen Eira 1,505 2,569 1,064 71%
Monash 1,582 2,233 651 41%
Bayside 2,835 3,430 595 21%
Kingston 540 1,125 585 108%
7
Table 6 – Participation in Junior Netball in the SMJFL Region (2009-2013)
LGA 2009 2013 Change % Change
Region 6,777 8,587 1,810 27%
Port Phillip 122 328 206 169%
Stonnington 981 1,168 187 19%
Glen Eira 1,152 1,637 485 42%
Monash 1,561 1,711 150 10%
Bayside 1,416 1,882 466 33%
Kingston 1,545 1,861 316 20%
8
Table 7 – Participation in Junior Football in the SMJFL Region (2011-2014)
LGA 2011 2014 Change % Change
Region 13,818 15,756 1,938 14%
Port Phillip 1,454 1,284 -170 -9%
Stonnington 1,289 1,874 585 46%
Glen Eira 2,944 3,827 883 30%
Monash 1,928 1,940 12 0.1%
Bayside 3,573 3,920 347 10%
Kingston 2,630 2,911 281 11%
6
Source: Basketball Victoria’s Manager – Facilities & Government Relations (2015) and Kingston City Council.
7
Source: Netball Victoria’s Facilities & Development Manager (2015).
8
Source: 2011 Metropolitan Leagues, Clubs and Teams Census and AFL Vic’s Region Development Manager – Southern.
Final Report.docx Page 21SMJFL Sustainability Strategy 2015
STRATEGIC PLAN 2012 – 2015
Building A New Tradition
5. FRAMEWORK FOR PLAYER RETENTION Updated December 2013. To be reviewed March 2015.
The recommended framework to improve the capability of clubs to field teams in the
U16 and U17 competitions is outlined in the following table. Importantly, it recognises
that there are different environments across the region in which clubs operate, which
influences the retention of players.
Factors that can influence the retention of players, and which might be different
between the six LGAs within the SMJFL region include:
1. The location of private schools, some of which require boys to play school
football sometimes at the exclusion of club football. In other instances, the
physical toll on boys having to play on both Saturday (for their school) and
Sunday (for their club) precipitates a decision by some players to opt out of
football.
2. The cultural diversity of an LGA.
3. The popularity of other sports within an LGA, particularly soccer.
It is proposed that the ‘ideal’ number of teams for a club based in Kingston and
Monash is 17, in Glen Eira is 20, and in Port Phillip, Bayside and Stonnington is 23.
Port Phillip
Kingston
Age Glen Eira Bayside
Monash
Stonnington
U8 2 2 3
U9 2 3 3
U10 2 3 3
U11 2 2 3
U12 2 2 3
U13 2 2 2
U14 2 2 2
U15 1 2 2
U16 1 1 1
U17 1 1 1
Total 17 20 23
The overarching goal of the SMJFL is for all clubs to field an U16 and an U17 team.
However, the SMJFL understands and acknowledges that clubs may achieve this in
different ways, including by having a total number of teams less than the aspirational
number of teams outlined in the above table, or by forming composite teams with other
clubs. The outcome of the overarching goal is that more players will be retained in
football for longer, and the means by which clubs support this goal will ultimately be
different between all clubs.
Final Report.docx Page 22You can also read