ENERGY MANAGEMENT STRATEGY 2019 2022
←
→
Page content transcription
If your browser does not render page correctly, please read the page content below
ENERGY
MANAGEMENT
STRATEGY
2019 - 2022
2   ENERGY MANAGEMENT STRATEGY 2019-2022

    CONTENTS

    Executive summary				                                                3
    Acronyms & technical terms				                                       4
    1        Introduction				 5
    1.1      Purpose of this strategy				                                5
    1.2      Scope				 5
    1.3      Approach				 5
    2        Situation analysis				                                      7
    2.1      Our strategic context				                                   7
    2.2      Our current situation				                                   12
    3        Strategic framework for energy management				               17
    3.1      The four drivers of Gippsland Water’s energy costs		        17
             Driver A: Volume of energy supplied from the NEM		          17
             Driver B: Price paid for energy from the NEM		              18
             Driver C: Price paid for energy from renewable generation   20
             Driver D: Revenue received for energy supplied to the NEM 20
    4        Strategic options				21
    4.1      Overview				21
    4.2      Recommended initiatives				23
    4.3      An evolving strategy – beyond 2022				                      30
    4.4      Strategic alignment				30
    4.5      Implementation				31
    4.6      Reporting				32
    5        Annex F: Document control				                               33
3      ENERGY MANAGEMENT STRATEGY 2019-2022

                                                                                          Executive
                                                                                          summary

    Our energy is a critical strategic concern for               other operating costs and there has been limited
    Gippsland Water and the water sector more broadly.           perceived business need for investment in energy
    Centralised water and wastewater service delivery are        management. Despite some progress in recent years,
    energy intensive activities. An affordable and reliable      our overall approach to energy management remains
    supply of energy is essential for the economic and           underdeveloped. Without a concerted approach, we
    environmental sustainability of our business as well as      remain exposed to several risks, including increased
    for continuity of service delivery to our customers.         tariffs resulting from rising energy costs that cannot be
                                                                 absorbed by our business, as well as potential service
    The cost of energy has increased significantly in recent     interruptions as energy supply becomes less reliable in
    years as the energy market in Australia undergoes            periods of critically high demand.
    significant changes, driving higher energy prices and
    greater volatility. Last year changes in the energy retail   If we are to achieve sustainability and maintain
    and network charges increased our annual energy              continuity in the future, our business must position
    budget by thirty-five percent, and the total cost of         itself strategically to avoid market risks and exploit
    energy for our business currently equals almost five         opportunities to reduce costs and generate additional
    percent of total operational expenditure. Further,           sources of revenue. A considered, evidence-based
    energy consumption is also our most significant source       approach to energy management can potentially
    of carbon emissions.                                         reduce energy costs by up to fifty percent while also
                                                                 bolstering capacity to guarantee energy supply and
    Our energy requirements are likely to increase in the        service continuity. This Strategy identifies the key
    future. Key external drivers of energy consumption           drivers of our energy costs, assesses and prioritises
    in the years ahead include population growth in              the mechanisms likely to yield the greatest influence
    Gippsland, which is projected to grow by around              on those drivers, and recommends initiatives designed
    twenty-six percent over the next twenty years.               to activate those mechanisms.
    Further, a potential decline in rainfall throughout the
    region as a consequence of climate change may force          In order to reduce the cost of energy, we must adopt
    adoption of new and more energy intensive water              an integrated whole-of-business approach to energy
    sources for some of our systems.                             management. Accordingly, this Strategy recommends
                                                                 six initiatives that form part of a holistic and integrated
    To meet these challenges, we must change our                 approach to influencing the drivers of energy costs in
    approach to energy management. Historically, we              our business:
    have enjoyed low energy costs in comparison to
4     ENERGY MANAGEMENT STRATEGY 2019-2022

    Executive summary continued

                                                                                                       1

    1. Build our capacity to capture and analyse energy
       data;
    2. Build our capacity for demand response to the
       energy market;
    3. Synchronise our diesel generation to improve
       business continuity and demand response;
    4. Pursue energy efficient equipment renewals and
       replacements;
    5. Invest in renewable energy generation;
    6. Adopt an integrated energy management & assets
       policy framework;
    These initiatives are recommended to be executed in a
    staged manner between 2019 and 2022 in accordance
    with the Implementation Plan, with a review of
    strategic outcomes and strategy update scheduled to
    occur toward the end of that period.

    Acronyms and technical terms
    ACCU		                                                  kW
    Australian Carbon Credit Unit                           Kilowatt
    AEMO		                                                  kWh
    Australian Energy Market Operator                       Kilowatt Hour
    DELWP                                                   MW
    Department of Environment, Land, Water and Planning     Megawatt
    ELT		                                                   MWh
    Executive Leadership Team                               Megawatt Hour
    EOS                                                     NEM
    Energy Optimisation Specialist                          National Electricity Market
    GW		                                                    STC
    Gippsland Water                                         Small-Scale Technology Certificate
    IWN		                                                   VEEC
    Intelligent Water Network                               Victorian Energy Efficiency Certificates
5       ENERGY MANAGEMENT STRATEGY 2019-2022

                                                                                                                    1
                                                                                             Introduction

                                                                   •     Support climate change mitigation through
    1.1       PURPOSE OF THIS STRATEGY                                   reducing energy use and providing a strategic
                                                                         approach to renewable energy generation and
    The intent of this Energy Management Strategy                        implementation; and
    (hereafter ‘this Strategy’) is to provide information and      •     Identifying risks to reliability of energy supply
    analysis to support our Executive Leadership Team to                 and provide resilience for business continuity and
    make well-informed strategic decisions about reducing                service delivery.
    the costs of energy consumption.
    Energy is a critical strategic concern for the water           1.2       SCOPE
    sector, underpinning the most fundamental aspects
    of water and wastewater services in terms of both              This Strategy will identify the most effective ways
    economic and environmental sustainability, as well as          we can manage and control our cost of energy with
    continuity of service delivery of an essential service         emphasis on those initiatives with best likelihood of
    to the community and industry. The energy market in            significant impact.
    Australia is undergoing significant changes, and that          Additionally, this Strategy will support our climate
    change is driving higher energy prices and greater             change mitigation and adaption strategy insofar as it
    volatility. If we are to achieve sustainability and maintain   identifies and implements initiatives that efficiently and
    continuity, our business must position itself strategically    effectively reduce its carbon footprint.
    to avoid market risks and exploit opportunities to
    reduce costs and generate revenue.                             1.3       APPROACH
    Accordingly, this Strategy will:
                                                                   This strategy was developed in collaboration with
    •     Assess the key strategic drivers of our cost of          internal leadership and subject matter experts, external
          energy;                                                  water authorities and energy industry representatives,
    •     Identify strategic options for energy cost reduction     by completing a comprehensive review of a wide range
          and risk mitigation, including opportunities for         of energy initiatives to identify those initiatives that
          efficiency, options for investment in energy             were most likely to help gain control over its cost of
          generation, and potential new capability                 energy over the next three years.
          development opportunities; and
    •     Provide financial and non-financial impact analysis
          associated with each strategic option.
6      ENERGY MANAGEMENT STRATEGY 2019-2022

    Introduction continued

                                                                                                                         1

     Figure 1: Diagram of strategic process

     Gippsland Water will continually build and maintain this current strategy as it continues to assess the
     performance of identified current strategic initiatives, and explore any new and emerging initiatives. Its
     expected Gippsland Water’s approach to energy management will continually evolve as it assesses the
     effectiveness of implemented initiatives, learns and adapts its approach to incorporate these learnings as
    We will continually build and maintain this current         evolve as it assesses the effectiveness of implemented
     it continues to explore emerging energy management approaches in the years ahead.
    strategy as we continue to assess the performance           initiatives, learns and adapts its approach to
    of identified current strategic initiatives, and explore    incorporate these learnings as we continue to explore
    any new and emerging initiatives. It’s expected our         emerging energy management approaches in the years
    approach to energy management will continually              ahead.
7       ENERGY MANAGEMENT STRATEGY 2019-2022

                                                                                                                                             2
                                                                                                                Situational
                                                                                                                analysis

    2.1 OUR STRATEGIC CONTEXT                                                   service delivery providers. For our business, energy
                                                                                represented an average of five percent of total
    2.1.1 Background                                                            operational expenditure over the last eight years and is
                                                                                following an overall upward trajectory.
    The introduction of climate change policy and
    the retirement of large coal generation without                             Similarly, given their high use of conventional sources
    replacement, has had direct impact on the energy                            of electricity, the delivery of water and wastewater
    market in Australia. The inconsistent policies of state                     services are also a significant source of carbon
    and federal governments has restricted the influence                        emissions. Our energy-related carbon emissions
    of market mechanisms and contributed to less reliable                       comprise around seventy-four percent of our overall
    energies supplies.                                                          emissions output.
    Energy is a strategic issue of critical significance for the                For these reasons, energy represents a critical strategic
    water sector. Affordable, reliable and abundant energy                      concern for the water sector, underpinning the
    is a fundamental necessity for the delivery of water and                    most fundamental aspects of water and wastewater
    wastewater services.                                                        services in terms of both economic and environmental
                                                                                sustainability, as well as continuity of service delivery.
    Water and energy are reciprocally linked resources.
    Energy needs require water, often in large quantities,                      2.1.2 Energy consumption in the water
    for mining, fuel production, hydropower, and power                          sector today
    plant cooling, and energy is needed for the pumping,
    treatment, and distribution of water and for collection,                    In recent years, the amount of energy consumed by
    treatment, and discharge of wastewater. The water                           the water sector globally was almost equivalent to the
    sector is a major consumer of energy at the global                          entire energy demand of Australia. About sixty percent
    scale with recent estimates indicating total energy                         of that energy was consumed in the form of electricity,
    consumption from all sources by the water sector                            corresponding to a global demand of around 820
    worldwide was around 120 million tonnes of oil                              terawatt-hours (TWh), or four percent of total global
    equivalent (Mtoe). A majority of this energy was                            electricity consumption. Within Victoria, the water
    in the form of electricity, corresponding to four                           sector is among the top twenty highest electricity
    percent of total global electricity consumption1.                           consuming businesses2.
    The interdependency of these resources underpins
                                                                                The Victorian water sector is responsible for
    economic growth, society and the well-being of our
                                                                                the largest proportion of government emissions,
    communities.
                                                                                contributing twenty-four percent of the state’s total
    Due to energy-intensive processes in the water                              emissions3. The high consumption of energy within
    sector, energy remains among the highest operational                        the water sector is due to the energy-intensive nature
    expenditure items for water and wastewater                                  of water and wastewater service delivery. Energy is

    1. International Energy Agency, ‘Water-Energy Nexus’ in World Energy Outlook 2016
    2.Victorian Water Industry Association, Water-Energy Nexus – Electricity Issues in the Victorian Water Sector, September 2011.
    3.Victorian Department of Environment, Land, Water and Planning, Climate Change, https://www.water.vic.gov.au/water-industry-and-customers/your-
    water-suppliers-performance/climate-change, 2019.
8       ENERGY MANAGEMENT STRATEGY 2019-2022

    Background continued

                                                                                                                                         2
                                                                                                                                         1
    Figure 2: Energy requirements throughout the water and wastewater process

    required in each step of the process in delivering these                     2.1.3 The future of energy consumption
    services (see Figure 2). At the global level, the most                       in the water sector
    energy intensive processes in the water sector include
    the extraction and transportation of groundwater and                         Global electricity consumption in the water sector is
    surface water (forty percent), followed by wastewater                        projected to nearly double between now and 2040.
    collection and treatment (twenty-five percent). In                           The IEA’s World Energy Outlook shows a general
    developed countries, the largest share of water-                             trend toward increased energy intensity of the water
    related electricity consumption is used for wastewater                       sector. While the reasons for this trend differ by
    treatment (forty-two percent)4.                                              country, the most universal drivers are increased
                                                                                 population which drives high growth in domestic and
    The level of energy consumption of each process                              industrial water withdrawals, increased amounts of
    within water and wastewater system is a function                             wastewater being treated to higher standards, and an
    of several variables including geographic locations of                       increased reliance on non-traditional water sources
    assets, topography, quality of raw product and required                      that require greater energy inputs.
    level of treatment.

    4. International Energy Agency, ‘Water-Energy Nexus’ in World Energy Outlook 2016
9       ENERGY MANAGEMENT STRATEGY 2019-2022

    Background continued

                                                                                                                                                            2
                                                                                                                                                            1
    In Australia, use of electricity across the water sector                    of Environment, Land, Water and Planning (DELWP),
    is growing rapidly due to diversification of the water                      Vic Water and eighteen Victorian water corporations.
    supply options to meet water security challenges                            The IWN seeks new technologies and approaches to
    driven by drought, population growth and declining                          help meet common challenges across the Victorian
    long-term average inflows. These new water sources                          water industry and also assists in coordinating carbon
    and associated treatment requirements provide a                             emission reduction efforts across the sector.
    greater level of long-term water security, but are
    typically more energy intensive compared to traditional                     Currently, the IWN’s primary focus for development
    gravity-fed sources from protected catchments5.                             of energy management initiatives within the sector
                                                                                includes pumped hydro, floating solar, battery storage,
    Regulatory changes are also placing upward pressure                         wastewater treatment aeration and large scale
    on energy intensity of water processes. The Victorian                       renewable energy generation. It is expected that by
    water sector is renowned for its world standard                             combining resources across the sector will deliver
    water and wastewater services, and this is partly the                       greater benefits that may be otherwise achieved by
    result of a stringent regulatory framework for water                        a single water authority acting alone. As such, we
    and wastewater treatment. However, implementation                           continue to participate in the IWN to ensure shared
    and maintenance of these standards to ensure water                          learnings as the Victorian water sector develops its
    supplies are fit for purpose require significant energy                     knowledge of energy management, while also pursuing
    inputs6.                                                                    initiatives that will deliver the greatest benefit to our
                                                                                own customers.
    More locally, a key external driver of energy
    consumption will be population growth in Gippsland,                         There also exists a myriad of upgrade programs
    which is projected to grow by around twenty-six                             and certificate schemes that are designed to help
    percent over the next twenty years, and the number of                       consumers reduce their energy usage and greenhouse
    households (i.e. potential new domestic connections)                        gas emissions, as well as additional schemes to aid the
    expected to grow by nearly thirty percent, increasing                       production of renewable energy.
    pressure on both water and wastewater systems7. At
    the same time, a potential decline in rainfall throughout                   The Clean Energy Regulator issues units called
    the region as a consequence of climate change may                           Australian Carbon Credit Units (ACCUs) representing
    exacerbate increased energy requirements for our                            one tonne of carbon dioxide equivalent (tCO2-e)
    business as new water sources are sought, particularly                      stored or avoided by a project. Eligible activities are
    within our Tarago, Latrobe, and Thompson-Macalister                         undertaken as ‘eligible offsets projects’. There are a
    water systems8.                                                             number of requirements that must be satisfied before
                                                                                a project can be declared an ‘eligible offsets project’,
    2.1.4 The energy-water policy context                                       and there are ongoing requirements in undertaking an
    in Victoria                                                                 eligible offsets project9. Additionally, under the Small-
                                                                                Scale Renewable Energy Scheme, eligible small-scale
    Energy management is a new strategic focus for the                          renewable energy systems are entitled to a number
    water industry in Victoria. As large consumers of                           of small-scale technology certificates. One Small-Scale
    electricity, the sector has become increasingly aware                       Technology Certificate (STC) is equal to one megawatt
    of its exposure to higher costs and are seeking to take                     hour of eligible renewable electricity either generated
    collective action where possible. The Intelligent Water                     or displaced by the system10. Also, an accredited power
    Network (IWN) is a partnership between Department                           station may create large-scale generation certificates

    5. Victorian Water Industry Association, Water-Energy Nexus – Electricity Issues in the Victorian Water Sector, September 2011.
    6. Victorian Water Industry Association, Water-Energy Nexus – Electricity Issues in the Victorian Water Sector, September 2011.
    7. DELWP,Victoria in Future 2016: Population and household projects to 2051.
    8. Gippsland Water, 2017 Urban Water Strategy.5. Victorian Water Industry Association, Water-Energy Nexus – Electricity Issues in the Victorian Water
    Sector, September 2011.
    9. Australian Government Clean Energy Regulator, http://www.cleanenergyregulator.gov.au/OSR/ANREU/types-of-emissions-units/australian-carbon-credit-
    units, 2019
    10. Australian Government Clean Energy Regulator, http://www.cleanenergyregulator.gov.au/RET/Scheme-participants-and-industry/Agents-and-installers/
    Small-scale-technology-certificates, 2019.
10      ENERGY MANAGEMENT STRATEGY 2019-2022

     Background continued

     Figure 3:The electricity supply chain in Australia14   1
                                                            2
11 ENERGY MANAGEMENT STRATEGY 2019-2022
Background continued
1
2
(LGCs) for eligible electricity generated by the power Other NEM participants in the electricity supply
station’s the power station’s renewable energy sources. chain include network distribution companies that
One LGC can be created per megawatt hour (MWh) manage distribution networks for the distribution of
of eligible electricity generated by a power station11. electricity, and market customers such as retailers who
buy electricity at the spot price and sell to its own
Through the Essential Services Commission, the consumers, or consumers that buy electricity at the
Victorian Energy Upgrades Program helps Victorians spot price directly from the market (see Figure 3).
reduce their energy bills and greenhouse gas emissions
by providing access to discounted energy efficient As a consumer, it is important for our business to
product and services.Victorian Energy Efficiency have a thorough understanding of the key functions
Certificates (VEECs) are electronic certificates provided by any retailer because the retailer provides
created under the program when certain energy the fundamental interface to the NEM. The retailer is
efficiency activities are undertaken in residential or responsible for aggregating the various charges that
non-residential premises. Each certificate represents must be paid by the consumer that reflect the range
one tonne of greenhouse gas emissions reduction of costs associated with electricity consumption,
(CO2-e)12. including the operations of the NEM, electricity
transmission, metering and obligations from legislated
We must continue to leverage these schemes to renewable energy supply targets. It is the fundamental
ensure all initiatives receive the highest level of responsibility of the retailer to ensure its customer
support, and continue to be mindful of the value has adequate supply available to suit its demands at any
of certificates and their impact on expected future time.
revenues.
The most significant risk to the retailer is that the
2.1.5 The energy market amount of energy required by its customer may
The National Electricity Market (NEM), has been the exceed the demand as predicted by the retailer, or that
wholesale market for the supply of electricity for the price of that energy exceeds the retailer’s own
Queensland, New South Wales, ACT,Victoria, South forecasts. Consequently, the retailer includes safety
Australia and Tasmania since late 1998. The Australian margins in their cost which are reflective on its level of
Energy Market Operator (AEMO) is responsible for certainty for the future energy needs of its customer.
the management of the NEM, ensuring that electricity 2.1.6 Trends in energy management in
demands are met with the lowest cost supplies. AEMO
operates a spot market where energy generators
the water sector
bid at market intervals for specific quantity of energy Water utilities around the world have responded to
supply for each state region. AEMO then selects the the challenges of increasing energy intensity in a range
lowest bids to meet the expected demand at each of ways. Importantly, many have recognised that a
time and despatches that required generation. These rise in water demand does not necessarily have to be
market spot prices may fluctuate between -$1,000 accompanied by an equal rise in energy demand or
and $14,200 per MWh and additional price caps are energy costs.
utilised to ensure the average spot price over a seven
day period does not exceed approximately $600 per Some of the more common approaches adopted
MWh13. around the world to improve energy management
include the integration of energy and water
11. Australian Government Clean Energy Regulator, http://www.cleanenergyregulator.gov.au/RET/Scheme-participants-and-industry/Power-stations/Large-
scale-generation-certificates, 2019.
12. Essential Services Commission,Victorian Energy Upgrades Program, https://www.esc.vic.gov.au/victorian-energy-upgrades-program/about-victorian-
energy-upgrades-program/victorian-energy-efficiency-certificates-veecs, 2019
13. Michael Williams, Power Profits – A comprehensive 9-step framework for reducing electricity costs and boosting profits, 2018.
14. Australian Energy Market Operator (AEMO), https://www.aemo.com.au/About-AEMO/About-the-industry, 2019.12 ENERGY MANAGEMENT STRATEGY 2019-2022
Background continued
2
1
policymaking, optimisation of processes and in delivering savings by verifying the most efficient
infrastructure for efficiency, improvement in network charges for individual sites. These network
monitoring and analysis capabilities, utilisation of charges that are billed by the local network
energy embedded in wastewater, boosting on-site distribution company are also set to increase by
generation capacity, shifting to less energy intensive approximately 3-6% over the 2018-2020 period. These
water sources, and water saving initiatives to augment changes have increased our annual energy budget by
demand. approximately 35% for the 2018/19 financial period to
approximately of $4.7M.
However, there are also significant barriers to
improving energy management in the water sector. Energy invoices are received monthly in accordance
Some widely acknowledged barriers include risk with our current retail agreement, and are comprised
aversion within the water sector, prohibitive cost of of several changes including:
generation initiatives and the impact of customer
tariffs, increased regulatory and compliance standards, • metering charges, which are fixed
difficulty in deploying energy management controls • market operator charges and environment
to frontline operators, and the difficulty in replicating schemes, based on total consumption
successful initiatives across facilities that vary widely in • network charges, that are driven by time of use,
their system and plant specifications. capacity and demand
• retail charges, based on time of use
2.2 OUR CURRENT SITUATION Network charges are complex and applied individually
to each separate market meter. In addition to peak
2.2.1 Gippsland Water’s current network tariffs, capacity and demand tariffs are also
approach to energy management applied that are reflective of supplying an individual
sites maximum demand at any one time, and having
Like most industries in Australia, we enjoyed low
further capacity to supply that demand during critically
energy costs in comparison to other operating costs.
high peak usage times.
While all aspects of service delivery are heavily
dependent on the consumption of energy, the relatively Energy generation
low cost of that energy has meant there has been
limited perceived business need for investment in Currently we operate two main renewable energy
developing a thorough understanding and managing generators, a mini-hydro and a biogas generator, that
energy usage. In recent years, we have recognised the generate electricity and LGCs behind the Gippsland
need for a deliberate and coordinated approach to Water factory meter. An additional one megawatt of
energy management and have begun to develop our behind-the-meter photo-voltaic solar systems are
capabilities. currently in the delivery stages in the current and
previous financial years which will generate additional
Supply and contracts LGCs.
While historically we have executed large and small Energy efficiency initiatives
market retail contracts that have been very successful
in maintaining low retail charges, the current retail We have been an early adopter of variable speed drive
agreements that became effective in July 2018, saw the technology and have built up a large network of assets
peak and off-peak retail charges increase from 4.3489 that can be operated at various flows and pressures.
cents per KWh (c/kWh) and 2.6551 c/kWh to 10.6052 This technology has been successfully leveraged across
c/kWh and 7.5736 c/kWh respectively. numerous assets to ensure systems are run efficiently
while maintaining performance specifications. The
The current retail contract includes invoice modelling process of analysing and optimising these systems has
and verification services that have been instrumental13 ENERGY MANAGEMENT STRATEGY 2019-2022
Background continued
2
1
proven labour intensive with no purpose-built tools Infrastructure planning
readily available for support.
Currently energy efficiency is only partially embedded
Load shedding events into the asset design and procurement process. The
impacts of energy consumption of plants and assets are
The current response to electricity network events considered amongst other considerations, but aren’t a
such as load shedding and demand response in our strong focus of current asset management strategies.
business is currently limited to a handful of sites. While
the response at these sites is well automated, there 2.2.2 Gippsland Water’s energy
remains significant effort for the management and management performance
coordination of this approach and there is much scope
for a more seamless response across a much larger Energy costs
number of assets.
For our business, energy represented an average of
Energy Optimisation Specialist role five percent of total operational expenditure over
the last eight years and is following an overall upward
We have been proactive with the appointment trajectory with a significant step increase occurring
of an Energy Optimisation Specialist with the key in 2018/19. Figure 4 shows a sharp increase in energy
role of developing this strategy and supporting the costs in 2018/19 as the new retail agreement came
adoption of energy initiatives with support from the into effect reflective of market price increases from
rest of the business. Coordination and management carbon policy and retirement of generation capacity.
of strategic energy initiatives is vital to delivering The large amount of future renewable generation
strategic outcomes and ensuring the business remains projects reaching completion over the following years
sustainable within an increasingly volatile energy will provide some relief to electricity prices. It is
market. expected that prices will continue to rise further into
the future.
Figure 4: Gippsland Water’s energy costs and forecast budget*
*Total operational costs excludes depreciation & impairment, internally generated
expenses, taxes, and interest on loans. Energy costs excludes diesel fuel costs.14 ENERGY MANAGEMENT STRATEGY 2019-2022
Background continued
2
1
Figure 5: Gippsland Water’s energy costs and forecast budget
The budgeting and forecasting of energy usage needs 2.2.3 Current residual risks
to be accurately baselined against projected growth
and expected impacts on future service delivery. These Increased tariffs
forecasts can also be more effectively coordinated With energy such a fundamental input for our services,
with system plans to reflect any future impacts of asset and that cost of energy rising significantly, there is a
creation, renewals and replacements. clear risk that these costs cannot be absorbed and may
Energy consumption need to be passed onto its consumers. We must build
our ability to avoid higher energy prices, but we must
We operate approximately 400 separately metered also do so without compromising the quantity and
sites, with 83% of our total usage being consumed by quality of our services.
our top 30 sites.
Interrupted service
The patterns of energy consumption across these
sites varies significantly. Generally, it can be expected While market mechanisms such as very high spot
that sites performing similar functions, such as water prices and demand tariffs attempt to limit consumption
and waste treatment, may observe similar patterns of at times of critically high demand. The recent necessity
consumption. However, there is great variance in the of load shedding to stabilise the electricity grid, has
configuration, types of technology being utilised as well demonstrated that energy supply at such critically high
as the overall utilisation capacity of the sites such that demand times is becoming less reliable. Continued
the each of the larger sites energy consumption must service delivery will require the augmented supply
be analysed individually. of energy from alternate behind-the-meter energy15 ENERGY MANAGEMENT STRATEGY 2019-2022
Background continued
2
1
sources such as diesel generators and renewables like
hydro and biogas generators as well as photovoltaic
systems. The adoption of such alternative energy
systems also represents an opportunity to generate
revenue by supplying any remaining energy back into
the energy market.
Opportunities for energy generation
We must continue to be mindful of the current
and projected value of any incentive or generation
schemes we may be leveraging to support energy
reduction initiatives, and fully comprehend the financial
sensitivities these additional markets may cause.
Future policy changes
There currently exist two major standards for the
treatment of water and waste in Victoria with which
we must comply. These are the Safe Water Drinking
Act (SWDA) and the State Environment Planning
Policies (SEPP). It must be considered that any changes
to these standards would have a direct effect on
energy consumption either positive or negative.
Missed efficiency opportunities
We have constructed a strong foundation for
development of energy efficiency initiatives, and
with this strategy in its early stages, there exists
significant opportunities for further development and
implementation. Businesses must innovate in how they
manage their energy requirements or their profitability
will suffer. A good energy strategy can reduce energy
costs by as much as 50% compared with traditional
thinking15.
15. Michael Williams, Power Profits – A comprehensive 9-step framework for reducing electricity costs and boosting profits, 2018.16 ENERGY MANAGEMENT STRATEGY 2019-2022
2
1
“an analysis of the
primary drivers of
energy costs and
the most viable
levers of control”
15. Michael Williams, Power Profits – A comprehensive 9-step framework for reducing electricity costs and boosting profits, 2018.17 ENERGY MANAGEMENT STRATEGY 2019-2022
3
Strategic
framework
for energy
management
This Strategy is primarily concerned with the goal of the most viable levers of control and most promising
reducing the energy costs incurred by us as a result areas for our strategic focus.
of its energy consumption so as to ensure business
sustainability and continuity of service in the long term. DRIVER A:VOLUME OF ENERGY SUPPLIED
Accordingly, this section will provide an analysis of the FROM THE NEM
primary drivers of those costs and identify the most The volume of energy supplied to our business is
viable levers of control that will help it advance toward closely correlated with the demand for our services
that goal. This assessment will provide the strategic and the quality of those services. Treated water
framework for the specific initiatives recommended in systems must continue to supply clean and safe
Section 4. drinking water and wastewater treatment systems
must continue to process waste in alignment with
3.1 THE FOUR DRIVERS OF customer demands and expectations as well as
compliance standards. As the demand or requirements
GIPPSLAND WATER’S ENERGY for those services increases, energy consumption also
COSTS increases.
Four primary drivers were identified as determining While level of demand and treatment standards
the overall cost of energy for our business. These remain largely beyond our control, the energy required
drivers are: to deliver those services can be reduced, primarily
through augmentation and improved efficiency of the
1. Volume of energy supplied from the NEM;
processes and infrastructure systems used to deliver
2. Price paid for energy supplied from the NEM; those services. To this end, could potentially reduce
3. Price paid for energy supplied from renewable the overall energy requirements of our systems by
generation; and improving our ability to accurately measure, monitor
and report on energy usage in relation to the various
4. Revenue received for energy supplied to the NEM.
aspects of service delivery and identify opportunities
These drivers each comprise a broader set of to improve efficiency, including through process
interdependent variables that together shape the cost improvement, the augmentation and management of
of our energy. plant and infrastructure systems.
Each variable differs its impact on the overall cost of Where deemed financially sustainable, continued
energy, and also in the extent of the control we have investment in behind-the-meter renewable
over each variable. Table 1 provides an assessment of technologies also enables the generation of our own
these variables, with those of moderate to high impact electricity, thereby reducing our overall requirement
and a moderate to high level of control representing for grid energy sourced through the NEM.
16. Gippsland Water’s Asset Planning team has already initiated investigations to identify opportunities to reduce suspected non-revenue water in our
systems. These efforts will contribute to improving energy efficiency, although fall outside the scope of this Strategy.18 ENERGY MANAGEMENT STRATEGY 2019-2022
Strategic framework continued
Figure 6: Causal model of key drivers of the cost of energy and viable levers of strategic control. 3
1
DRIVER B: PRICE PAID FOR ENERGY Building capacity for demand response – the ability
SUPPLIED FROM THE NEM to reduce our requirement for grid energy for brief
periods – would enable our business to avoid periods
As per section 2.1.5, energy retailers typically build of higher cost in the NEM, thereby influencing our risk
margins into contracted tariffs in order to mitigate profile from the perspective of energy retailers, and in
the risk of incurring costs associated with customer turn the overall price paid for energy supplied through
demand or wholesale energy prices exceeding the the NEM. Building this capacity includes configuring
retailer’s forecasts. To that end, the price pays for daily operations to utilise system capacities to avoid
energy supplied from the NEM is at least partly market tariffs imposed throughout the day, as well
influenced by our own ability to remain within as responding to market mechanisms to limit energy
forecasted demand and reduce our retail customer consumption during critical peak demand periods
risk profile. through the curtailment of load and the use of backup
generators to greatly reduce the exposure to very high
market price events.19 ENERGY MANAGEMENT STRATEGY 2019-2022
Table 1: Assessment of viable levers of control for energy management
3
1
Level of Viable
Impact on
Driver Variable potential lever of
driver
control control
Capacity to improve energy efficiency
High High
of operational processes
A.
Volume of Capacity for non-grid/renewable
High High
energy supplied energy generation
from the NEM
Capacity to improve energy efficiency
Moderate Moderate
of plant and infrastructure
Volume of non-revenue water Moderate Moderate
Quality of raw water Moderate Low -
Level of treatment of water and
wastewater required to meet customer High Negligible -
expectations & regulations
Overall volume of customer demand for
High Negligible -
water and wastewater services
Capacity for demand response High High
B.
Price paid for
Cost of network & retail charges High Low -
energy supplied
from the NEM
Cost of environmental charges Moderate Low -
Capacity to improve energy efficiency of
High High
operational processes
Market peak & off-peak tariffs High Moderate
Capacity for non-grid/renewable
Moderate High
C. energy generation
Price paid for
Optimisation of decision-making for
energy supplied design and procurement of energy Moderate High
from renewable generation assets
generation
Market cost of renewable energy
High Negligible
generation assets
D. Capacity for non-grid energy generation High High
Revenue received
for energy
supplied to
the NEM Market feed-in tariff High Low -20 ENERGY MANAGEMENT STRATEGY 2019-2022
Strategic framework continued
3
1
DRIVER C: PRICE PAID FOR ENERGY
SUPPLIED FROM RENEWABLE
GENERATION
Renewable energy generation has proven very effective
in providing an alternative energy supply and reducing
energy supplied from the NEM as well as effectively
reducing carbon emissions. In alignment with Driver
A, building scalable capacity for behind-the-metre
renewable energy generation is an important lever of
control to ensure that renewable energy investment
remains cost-effective. In addition, ensuring the
application of a robust decision-making framework
is applied when scoping, designing and procuring
renewable energy generation technologies will help
ensure that the only initiatives to proceed include
those which demonstrate a competitive price per
kilowatt hour in comparison to grid energy, thereby
contributing to lowering the overall cost of energy to
our business.
DRIVER D: REVENUE RECEIVED FOR
ENERGY SUPPLIED TO THE NEM
Any increase in our capacity to generate electricity
presents the opportunity to feed energy back into
the grid and acquire new source of revenue, offsetting
some of our overall energy costs.
Accordingly, regardless of the means of generation
our business should exploit its generation capacity
to secure the best price for any energy supplied back
into the market. The timely dispatch of generation at
times of critically high demand will be greatly beneficial
to the local electricity network infrastructure and we
must be conscious of fully leveraging our generation
assets for additional revenue.
However, although we can increase our generation
capacity, we cannot control market feed-in tariff prices.
Therefore, we should be conscious of the future
forecasts for energy supplies and remain careful not
to over-invest in generation systems that may deliver
limited benefit into a saturated market.21 ENERGY MANAGEMENT STRATEGY 2019-2022
4
Strategic
options
4.1 OVERVIEW
In order to reduce the cost of energy, we must adopt Accordingly, this Strategy identified six recommended
an integrated whole-of-business approach to energy initiatives that form part of a holistic and integrated
management. This approach must be strategic insofar approach to influencing the drivers of energy costs
as it responds directly to the underlying drivers of in our business (see Table 2). The following section
energy cost and prioritises resources toward affecting describes the purpose of each initiative and its
controllable variables likely to yield the highest impact. expected benefits with respect to the goals of this
Strategy.
“this Strategy identifies six
initiatives that form part of a
holistic and integrated approach
to influencing the drivers of
energy costs’”22 ENERGY MANAGEMENT STRATEGY 2019-2022
Strategic options continued
Table 2: Overview of initiatives by driver/lever of control 4
1
Initiatives
6. Energy & assets policy framework
4. Energy efficient renewals
3. Diesel synchronisation
5. Renewable generation
2. Demand response
Driver Lever of control
1. Data & Analysis
Capacity to improve energy efficiency
A. of operational processes
Volume of
energy supplied
from the NEM Capacity for non-grid energy generation
Capacity to improve energy efficiency of
plant and infrastructure
B.
Price paid for Capacity for demand response
energy supplied
from the NEM
C. Capacity for renewable energy generation
Price paid for
energy supplied
from renewable Optimisation of decision-making for
design and procurement of energy
generation generation assets
D.
Revenue received
for energy Capacity for non-grid energy generation
supplied to
the NEM23 ENERGY MANAGEMENT STRATEGY 2019-2022
Strategic options continued
4
1
4.2 RECOMMENDED INITIATIVES
Initiative 1: Build our capacity to capture opportunities to improve the energy efficiency of
and analyse energy data plant and processes.
Purpose Operational data should be effectively integrated
with energy usage data, to provide key
To develop the tools and capabilities enabling performance indicators that provide accurate
a thorough understanding of our energy use and timely information. The key performance
at the site level and build capacity to identify indicators for this strategy will be:
opportunities to improve the energy efficiency of
our processes, plant and infrastructure systems. • Cost of Energy Consumption and Treated
These tools and capabilities will be vital to drive Volume ($ per kL)
a culture of energy awareness that generates and • Cost of Energy Consumption and Energy
supports changes to energy usage throughout Consumption ($ per kWh)
the whole organisation. It is this development • Additionally, other operational key indicators
of knowledge and the culture of change that will be adopted for assessing cost saving and
underpins all of our initiatives. efficiency initiatives, including:
Description • Treated Volume and Energy Consumption (kL
per kW)
The development of data tools, dashboards and
reporting is critical to supporting decision makers • Peak Energy Consumption and Off-Peak
with accurate and reliable information so that Treated Volume (kL to kL)
they can make well-informed, timely decisions. • Peak Energy Consumption and Off-Peak
As our business builds our understanding of Energy Consumption (kW to kW)
the energy market and costs of energy use • Instantaneous Energy Usage (kW to kVA)
in relation to service delivery, we will be able
• Instantaneous Treated Flow (kL)
react appropriately to market volatility and
reduce operating costs as well as identify new • Market forecasts and supply capacity
Scope
Deliverable Timeframe Expected outcome
Dashboard and Efficiency Tool Tools that support decision making as well
2019/20
Development as verification and management of initiatives
Key Performance Indications Reporting that captures the performance of
2019/20 larger sites that incorporates baselines data
and Reporting for Larger Sites
and relevant information of performance
Smart Meter Integration The availability of real-time data for
2019/20
for Larger Sites operational response24 ENERGY MANAGEMENT STRATEGY 2019-2022
Strategic options continued
4
1
The compilation and publication of such for the cost of consumption during peak times, is
information will be fundamental to supporting approximately double that of consumption at off-peak
the knowledge of energy consumption and times (see Figure 7).
driving down the cost of energy. This further Periods of critically high demand and insufficient
supports a culture of energy awareness, which baseload supply cause market prices to peak sharply
is fundamentally important to drive change and for long periods as the market pricing mechanism
achieve reduction goals as required by corporate attempts to limit demand. Such extreme market prices
plans and enterprise agreements. are becoming increasingly more common over summer
periods when demand is elevated (see Figure 8).
Initiative 2: Build our capacity for
We must build our ability to decrease our energy
demand response to the energy market
consumption at peak times and limit our exposure
Purpose to extreme price events. Such a response will include
limiting service delivery by reducing plant flows and
To develop the capacity to respond rapidly and leveraging storage capacity where available.
appropriately to market pricing events so as to
reduce our customer risk profile and reduce the Inversely, the oversupply of baseload power at times
cost of sourcing energy from the NEM. This will of insufficient demand are causing prices to crash to
include developing the ability to store or defer energy negative levels as the market attempts to stimulate
requirements water and waste systems to avoid higher energy consumption (see Figure 9).
cost periods. We must be able to exploit these very low price
events by increasing our energy consumption during
Description
such times, by increasing plant flows and filling storages
Our business must build our ability to react to capacity.
appropriately to the energy market by limiting our
The ability to respond quickly and appropriately to
exposure risks and exploiting opportunities. Changes
network and retail pricing events will not only reduce
in the NEM are producing higher costs and causing
the current costs of energy consumption, but will
greater volatility, and there is a clear expectation that
also benefit the negotiation of future retail contracts.
network and retail charges are expected to continue
Additionally, combining this response with current
to rise into the future.
commercially available demand response schemes
Ignoring metering, market operator and environmental that reward size and reliability, will also provide
charges, the combined retail and network charges opportunities to create revenue from both critically
high and low market pricing events.
Scope
Deliverable Timeframe Expected outcome
Trial of tariff avoidance control The successful trial of control software that
2019/20 successfully reduces the operation of a site/
software
system at peak retail and network rates
Trial of demand response for The successful trial of a control strategy that can
2019/20 minimise the power consumption of a system of
water or waste system
assets in response to a peak demand event25 ENERGY MANAGEMENT STRATEGY 2019-2022
Strategic options continued
4
1
Figure 7: NSP56 Tariff – retail and network charges
Figure 8: AEMO aggregated price and demand (24/01/2019)
Figure 9: AEMO aggregated price and demand (02/02/2019)26 ENERGY MANAGEMENT STRATEGY 2019-2022
Strategic options continued
4
1
Initiative 3: Synchronise our diesel to allow for excess energy to be supplied into the
electricity grid. This excess energy may then be added
generation to improve business to any demand response program, increasing both the
continuity and demand response size and reliability of our overall ability to react to the
energy market.
Purpose
To help build our capacity for demand response to
influence the cost of energy from the NEM, while also
improving our ability to leverage generation capacity
during times of critically high demand to improve the
price of supplying electricity back into the NEM.
Description
The increasing frequency of load shedding events
to help stabilise the electricity grid, is already having
an impact on our ability to supply our own services
at times of critically high peak demand. Without the
supply of energy from the grid, treatments plants
and pump station must rely on storage capacity to
ensure service in maintained. Sites without sufficient
storage and sites with critical treatment processes
must then rely on diesel generators for continuous
supply of energy and continuity of service. These diesel “improving our ability
generators may be embedded into the electricity to leverage generation
grid, to not only ensure seamless synchronisation, but capacity”
Scope
Deliverable Timeframe Expected outcome
GWF and Longford Embedded Proven capability to despatch embedded diesel
2019/20 generation with no impact to normal service
Diesel Generation Trial
delivery
Business Need Identification for Viable list of sites that require backup diesel
sites that require backup diesel generation to ensure business continuity that can
2019/20
be included into embedded generation demand
generation – demand response response27 ENERGY MANAGEMENT STRATEGY 2019-2022
Strategic options continued
4
1
Initiative 4: Pursue energy
efficient equipment renewals and “to improve the energy
replacements efficiency of equipment and
Purpose processes”
To improve the energy efficiency of equipment and
processes so as to reduce the volume of energy that
is supplied through both the NEM and any renewable
sources.
Description
Our business operates a diverse range of electrical
equipment in the various treatment and pumping
processes utilised throughout our own supply network.
By identifying and understanding plant and equipment
consumption in relation to service delivery, we will
be able to look for alternatives that effectively reduce
our overall energy consumption and greenhouse gas
emissions.
The well-managed renewal and replacement of
electrical loads, such as lighting, pumps and blowers,
will give our business the ability to leverage several
incentive schemes that increase the attractiveness of
such upgrade initiatives. These programs may also be
accessed for further incentives that operate existing
equipment more efficiently.
Scope
Deliverable Timeframe Expected outcome
LED lighting upgrades in The successful replacement of LED lighting that
2019/20
remaining offices and depots qualifies for certificate generation
Trial system efficiency The successful implementation of an energy
2019/20 efficiency modification that qualifies for certificate
improvement
generation28 ENERGY MANAGEMENT STRATEGY 2019-2022
Strategic options continued
4
1
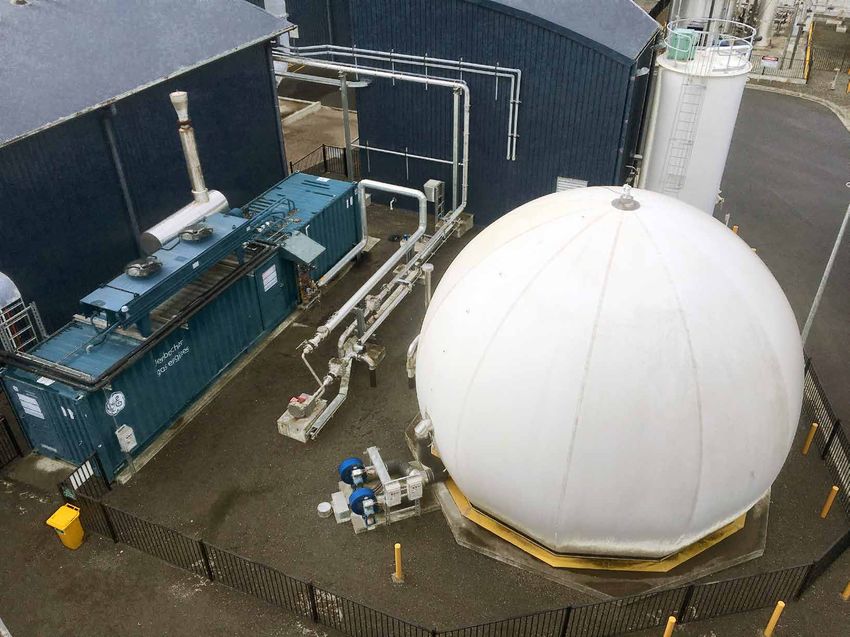
Initiative 5: Invest in renewable
energy generation
Purpose
“to cost effectively generate
To build our capacity to cost-effectively generate larger volumes of behind-the-
larger volumes of behind-the-meter energy in order to
reduce the volume of energy that must otherwise be
meter energy”
supplied from the NEM, while also reducing our carbon
footprint.
Description
Our business has a strong history of successfully
utilising renewable energy sources such as the 300kW
hydroelectric generator at Pine Gully, that supplies
energy via a private high voltage transmission line to
the Gippsland Water Factory. Such renewable energy
sources have a proven impact on lowering overall
energy consumption as well as decreasing carbon
emissions.
Currently, we are in the process of deploying
approximately one megawatt of photovoltaic solar
generation across numerous sites, and are investigating
additional hydroelectric generator projects as part of
its support to the Victorian Governments emissions
reduction strategy. We must continue to pursue
additional cost effective opportunities for renewable
generation in support of our climate strategy and goal
to lower our overall cost of energy consumption.
Scope
Deliverable Timeframe Expected outcome
Deployment of 1.0 MW of PV Delivery of behind-the-meter generation that
2019-21
Solar systems delivers certificates
*Deployment of 70kW mini Delivery of behind-the-meter generation that
2019-21
hydro at Traralgon WTP delivers certificates29 ENERGY MANAGEMENT STRATEGY 2019-2022
Strategic options continued
4
1
Initiative 6: Adopt an integrated
energy management & assets “guide decision-making
policy framework activity across the business”
Purpose
To formulate and implement a policy framework
that will guide any decision-making activity across
the business that is reasonably expected to have
implications for energy use or energy-related costs.
Description
Consideration for impacts on energy consumption is
not yet embedded uniformly across our asset design,
procurement, maintenance and operations processes.
Through the development and integration of a set
of evidence-based decision-making principles into
all decisions where a potential impact on energy
consumption exists, it is expected we will further
maximise our ability to locate and realise opportunities
for energy efficiency, be it in operational process
or in plant and infrastructure design. Further, these
principles will also be designed to govern decision-
making around the design and procurement of energy
generation assets, ensuring their long-term financial
and environmental sustainability, i.e. that they produce
a net saving in real terms in both the short and long
term.
Scope
Deliverable Timeframe Expected outcome
Create and manage register of energy initiatives
Policy framework for energy with assumptions that are well tested and
2019/22 sensitivities that are well understood. Continue
management decision-making
to look to peer groups such as IWN and DELWP
for guidance and support.30 ENERGY MANAGEMENT STRATEGY 2019-2022
Strategic options continued
4
1
4.3 AN EVOLVING STRATEGY – • Investigate options to influence customer
behaviours to improve adoption of waste and
BEYOND 2022 water saving (and therefore energy saving)
The above initiatives are recommended to be executed measures, or the adoption of water/wastewater
in a staged manner between 2019 and 2022 in service usage patterns that take advantage of off-
accordance with the Implementation Plan in Section peak energy tariffs.
4.5. Given the rapid dynamics of the energy industry
it is recommended that this strategy be reviewed 4.4 STRATEGIC ALIGNMENT
annually. Further, a comprehensive review of strategic These recommendations are strongly aligned with our
outcomes resulting from the above initiatives will be strategic agenda. In particular, the development of this
undertaken in 2022 to prepare for the development of Strategy has been driven by a Strategic Action in the
the second iteration of this Strategy. 2017-22 Strategic Priorities to ‘develop and deliver
In weighing strategic options for this Strategy, an energy management strategy’ that contributes to
some initiatives considered were assessed as more achieving ‘a greater than two percent reduction in
appropriate for inclusion in the second generation electrical energy consumption’ by EOFY 2021/22.
of our Energy Management Strategy, scheduled This Strategy also provides the primary means through
for delivery in 2022. Accordingly, depending on which we will progress toward our strategic objective
the outcomes of subsequent strategic reviews and of ‘investing in energy reduction and generation
the evolving maturity of our energy management initiatives to reduce costs’, as per the 2019-24 Strategic
capabilities, it is proposed that the 2022 strategy Priorities.
consider the inclusion of the following initiatives:
Through a focus on reducing grid energy consumption
• Quantify and reduce our embodied energy and increasing capacity for renewable energy
consumption, i.e. identify where our business is generation, this Strategy is also expected to support
indirectly incurring the cost of energy due to the our carbon pledge.
consumption of energy intensive goods or services
where alternatives may be available; Finally, with an emphasis on careful investment in
• If our ultimate goal is to reduce costs associated energy management, this Strategy also aims to help
with energy, one very lateral way of doing that mitigate the priority strategic risks, namely to avoid
is reduce our dependency on energy-intensive ‘inappropriate investment that does not leverage
products and services; opportunities’.
• Adoption of a carbon and cost-neutral asset
planning and procurement that simultaneously
manages the requirement for new or renewed
infrastructure with a requirement to offset the
emissions and cost-of-energy impacts of that
infrastructure through renewables or offset
acquisition;
• Evaluation of decentralised or other alternative
water and wastewater system network
configurations for both system reliability and
energy efficiency compared with the status quo
network, with a view to determining opportunities
for substantive network restructuring in the
medium to long term where viable;You can also read