Effect Based Trigger Values for Mixtures of Chemicals in Surface Water Detected with In Vitro Bioassays
←
→
Page content transcription
If your browser does not render page correctly, please read the page content below
Environmental Toxicology and Chemistry—Volume 40, Number 2—pp. 487–499, 2021
Received: 8 October 2020    |   Revised: 4 November 2020    |   Accepted: 23 November 2020                                                        487

    Environmental Toxicology

Effect‐Based Trigger Values for Mixtures of Chemicals in Surface
Water Detected with In Vitro Bioassays
Beate I. Eschera,b,* and Peta A. Nealec
a
  Helmholtz Centre for Environmental Research–UFZ, Leipzig, Germany
b
  Center for Applied Geoscience, Eberhard Karls University of Tübingen, Tübingen, Germany
c
  Australian Rivers Institute, School of Environment and Science, Griffith University, Southport, Queensland, Australia

    Abstract: Effect‐based trigger (EBT) values for in vitro bioassays are important for surface water quality monitoring because
    they define the threshold between acceptable and poor water quality. They have been derived for highly specific bioassays,
    such as hormone‐receptor activation in reporter gene bioassays, by reading across from existing chemical guideline values.
    This read‐across method is not easily applicable to bioassays indicative of adaptive stress responses, which are triggered by
    many different chemicals, and activation of nuclear receptors for xenobiotic metabolism, to which many chemicals bind with
    rather low specificity. We propose an alternative approach to define the EBT from the distribution of specificity ratios of all
    active chemicals. The specificity ratio is the ratio between the predicted baseline toxicity of a chemical in a given bioassay
    and its measured specific endpoint. Unlike many previous read‐across methods to derive EBTs, the proposed method
    accounts for mixture effects and includes all chemicals, not only high‐potency chemicals. The EBTs were derived from a
    cytotoxicity EBT that was defined as equivalent to 1% of cytotoxicity in a native surface water sample. The cytotoxicity EBT
    was scaled by the median of the log‐normal distribution of specificity ratios to derive the EBT for effects specific for each
    bioassay. We illustrate the new approach using the example of the AREc32 assay, indicative of the oxidative stress response,
    and 2 nuclear receptor assays targeting the peroxisome proliferator–activated receptor gamma and the arylhydrocarbon
    receptor. The EBTs were less conservative than previously proposed but were able to differentiate untreated and in-
    sufficiently treated wastewater from wastewater treatment plant effluent with secondary or tertiary treatment and surface
    water. Environ Toxicol Chem 2021;40:487–499. © 2020 The Authors. Environmental Toxicology and Chemistry published by
    Wiley Periodicals LLC on behalf of SETAC.

    Keywords: Cytotoxicity; Specific mode of action; Environmental quality standard; Water quality; Reporter gene assay; Water
    pollution

INTRODUCTION                                                                           not acceptable. As a result, effect‐based trigger (EBT) values
                                                                                       have been proposed to help differentiate between an accept-
   Many in vitro bioassays, particularly mammalian reporter
                                                                                       able and an unacceptable bioassay response in a water sample.
gene assays, are increasingly sensitive and can detect effects in
                                                                                       The current approach used for chemical water quality mon-
relatively clean waters, such as drinking water and recycled
                                                                                       itoring is to compare detected chemical concentrations from
water, after enrichment with solid‐phase extraction (SPE; e.g.,
                                                                                       targeted chemical analysis to chemical guideline values. How-
Jia et al. 2015; Conley et al. 2017; Neale et al. 2020b). How-
                                                                                       ever, chemical guidelines cannot possibly capture all chemicals
ever, just because an effect is detected does not necessarily
                                                                                       potentially present in water and do not account for the mixture
mean that the water is toxic and the chemical water quality is
                                                                                       effects that can occur between the many chemicals present.
                                                                                       This emphasizes the need for effect‐based monitoring and
This article contains online‐only Supplemental Data.                                   consequently the definition of EBTs.
This is an open access article under the terms of the Creative Commons                     A number of different approaches have been applied to
Attribution‐NonCommercial License, which permits use, distribution and
reproduction in any medium, provided the original work is properly cited and is        derive EBTs for both drinking water and surface water. The
not used for commercial purposes.                                                      simplest approach involves directly translating a chemical
* Address correspondence to beate.escher@ufz.de                                        guideline value to a bioanalytical equivalent concentration
Published online 30 November 2020 in Wiley Online Library
(wileyonlinelibrary.com).                                                              (BEQ) using the bioassay's reference compound (Leusch
DOI: 10.1002/etc.4944                                                                  et al. 2014; Kunz et al. 2015). This implies that the reference

wileyonlinelibrary.com/ETC                                                                                                         © 2020 The Authors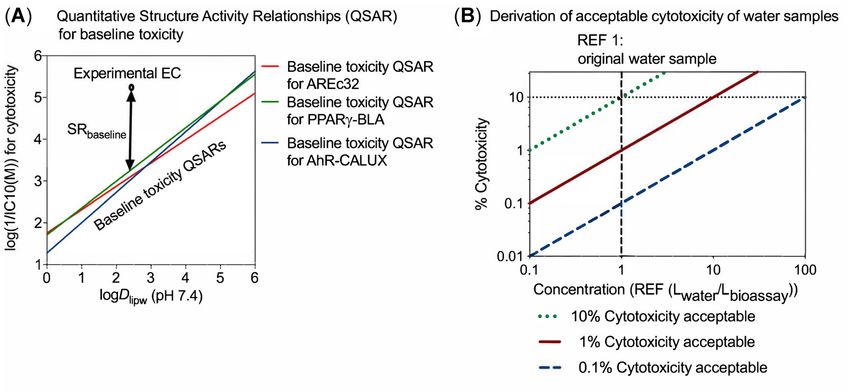
488                                                             Environmental Toxicology and Chemistry, 2021;40:487–499—B. I. Escher and P.A. Neale

compound is representative of all chemicals inducing a specific          but also mined the Tox21 database for developing the EBTs
effect in the assay. This is not necessarily the case, and there-       and for estimating what fraction of chemicals is expected to
fore, a number of studies have determined the in vitro effect at        be active in a whole‐water sample. Finally, we applied the
the guideline concentration using the different potencies of the        new mixture EBT to several case studies on wastewater and
bioactive chemicals and accounted for mixture effects using a           surface water and evaluated if the EBT can differentiate
read‐across approach (Escher et al. 2013, 2015, 2018b). An              between these water types and how they compare to
additional approach specific for drinking water has been pro-            previously proposed EBTs for these bioassays.
posed that converts the concentrations of reference com-
pounds considered safe in vivo to concentrations that can be
detected using in vitro assays using differences in the tox-            THEORY: DERIVATION OF MIXTURE
icokinetics of different compounds to correct the EBT (Brand            EBTs FOR CYTOTOXICITY AND MODES
et al. 2013). Brion et al. (2019) derived EBTs for estrogenicity by     OF ACTION WITH LOW SPECIFICITY
comparing the effects detected in vitro to effects detected
in vivo. In addition, other studies have derived EBTs for surface       What is a safe level of cytotoxicity in cell‐based
water using a combination of approaches, including converting           bioassays?
from in vivo toxicity data and field investigations, often fol-              Baseline toxicants, which act nonspecifically according to
lowing multiple lines of evidence in a more qualitative manner          narcosis (McCarty et al. 2013), have very similar internal effect
(van der Oost et al. 2017; de Baat et al. 2020), or using dis-          concentrations, more specifically critical membrane concen-
tributions of a large set of water samples (Besselink et al. 2017).     trations, with 69 mmol kglip–1 (95% CI 49–89 mmol kglip–1) for
    Previous methods to derive EBTs have relied on a very lim-          10% cytotoxicity derived for 7 different reporter gene cell lines
ited number of experimental effect data of single chemicals. This       that were based on 5 different cell types including MCF7,
was successful for bioassays indicative of highly specific modes         HepG2, H4IIe, HEK293H, and HEK293T (Escher et al. 2019).
of action such as estrogenicity or inhibition of photosynthesis,        Because critical membrane concentrations were uniform across
where a small number of highly active chemicals dominate the            cell types, the quantitative structure–activity relationships
mixture effects in water samples. In contrast, this method has          (QSARs) for baseline toxicity were very similar for diverse cell
limitations for cytotoxicity and bioassays indicative of modes of       lines (Escher et al. 2019). Figure 1A depicts the empirical
action where many chemicals are active but with lower potency,          baseline toxicity QSARs for the 3 cell lines investigated. Small
such as oxidative stress response mediated by the nuclear er-           differences between the empirical baseline toxicity QSARs of
ythroid 2‐related factor 2 (Nrf2)–antioxidant response element          different cell lines stemmed from experimental variability and
(ARE) pathway and activation of the peroxisome proliferator–            the setup of the assay, mainly differences in medium compo-
activated receptor gamma (PPARγ) or the arylhydrocarbon re-             sition, leading to small differences in the bioavailability of
ceptor (AhR). Direct read‐across from guideline values was not          the chemicals (Escher et al. 2019). Given the similarity in
possible for low‐potency chemicals, and a mixture factor had to         baseline toxicity between cell lines, we can define one EBT for
be invoked to derive the EBT for bioassays that respond to many         cytotoxicity for all cell lines.
but low‐potency chemicals (Escher et al. 2018b).                            Similar to how safe effect levels are derived for aquatic or-
    However, these biological endpoints are very important:             ganisms, we first have to decide on an effect level that is con-
wide screening of water samples with multiplexed assays that            sidered safe for cells and then translate this effect level to an
included more than 60 nuclear receptors and transcription               EBT‐IC10 for cytotoxicity. Cytotoxicity of 1% cannot be differ-
factors (Escher et al. 2014; Blackwell et al. 2019) have indicated      entiated from the control and can be considered a safe level of
that Nrf2, AhR, the pregnane X receptor (PXR), PPARγ, and               effect. For aquatic organisms, the lower 5th percentile of species
some hormone receptors are activated most prominently by                sensitivity distributions of no‐observed‐effect concentrations
many types of water samples.                                            (NOECs) is typically used to derive environmental quality
    We propose an alternative approach that defines safe levels          standards for single chemicals (Posthuma et al. 2002). Consid-
for overall cytotoxicity as the point of departure. We illustrate       ering the variability of controls, effect level variability of NOECs,
the new method using 3 reporter gene assays often used for              and sensitivity differences between aquatic organisms and cells,
water quality assessment: AREc32 for the activation of oxida-           it seems reasonable to accept 1% cytotoxicity as a safe level.
tive stress response, PPARγ‐BLA for binding to PPARγ, and                   How the acceptable cytotoxicity level of 1% is translated
AhR‐CALUX for activation of AhR. From a general EBT 10%                 into an IC10 for cytotoxicity is illustrated in Figure 1B. At low
inhibitory concentration (IC10) for cytotoxicity, we derived the        effect levels (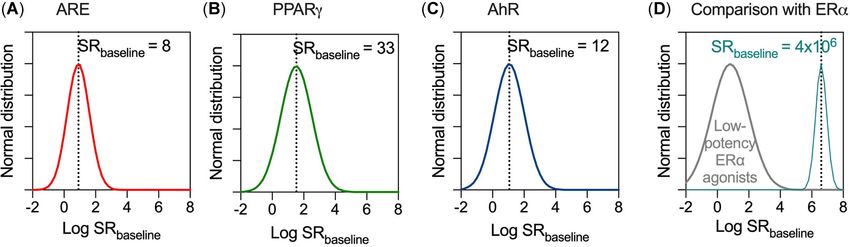
Effect‐based triggers for mixtures—Environmental Toxicology and Chemistry, 2021;40:487–499 489
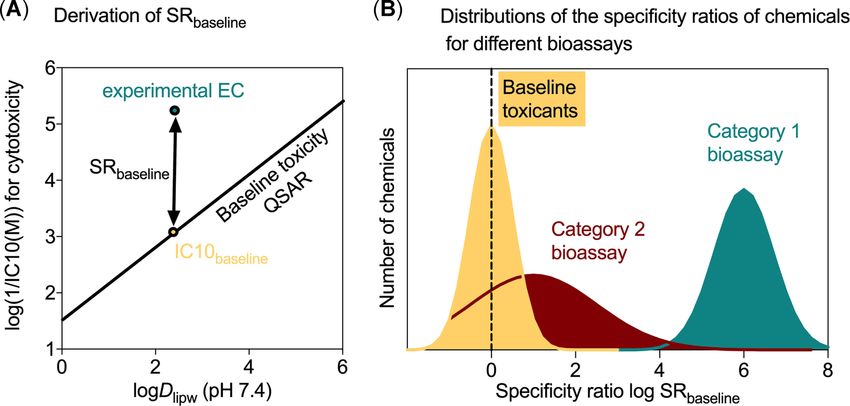
FIGURE 1: (A) Quantitative structure–activity relationships for baseline toxicity (Escher et al. 2019) of the 3 reporter gene assays considered:
AREc32 for the activation of oxidative stress response, PPARγ‐BLA for binding to the peroxisome proliferator–activated receptor gamma, and AhR‐
CALUX for activation of the arylhydrocarbon receptor. (B) Conceptual considerations for the derivation of the effect‐based trigger for cytotoxicity
from linear concentration–response curves (note that they are plotted on a double logarithmic scale for visualization only). AhR = arylhydrocarbon
receptor; EC = effect concentration; Dlipw = lipid–water distribution constant; IC10 = 10% inhibition concentration; PPARγ = peroxisome
proliferator–activated receptor gamma; QSAR = quantitative structure–activity relationship; REF = relative enrichment factor of a water sample in the
bioassay (a REF of 1 means that the concentrations of the extracted chemicals are the same as in the original water sample); SR = specificity ratio.
cytotoxicity at an REF of 1 (red line in Figure 1B), then the much of this specific effect may a mixture trigger before it
acceptable IC10 for cytotoxicity would be an REF of 10. becomes a problem for the organism. A measure of the degree
If we only accept 0.1% of cytotoxicity (blue dashed line in of specificity of a chemical is the so‐called baseline specificity
Figure 1B), then the acceptable IC10 for cytotoxicity would be ratio (SRbaseline; Escher et al. 2020b), which describes how much
an REF of 100. more potent a chemical is in reporter gene activation (i.e., its
We suggest accepting 1% of cytotoxicity in any original water specific mode of action) in comparison to the baseline cyto-
sample; that is, the anchor for the accepted baseline toxicity of toxicity QSAR of the same cell line (Figure 2A). The SRbaseline
chemical mixtures extracted from water would correspond an (Equation 1; Escher et al. 2020b) is defined as the ratio of
EBT‐IC10 of REF 10. Even if the cytotoxicity was caused by predicted baseline toxicity (IC10baseline) to the effect concen-
chemicals with specific modes of action, we can use the same tration for a specific endpoint (EC10; effect concentration
cytotoxicity threshold because it does not matter if the effect is causing 10% of maximum activation) or ECIR1.5 (effect con-
caused by a large molar amount of baseline toxicants or a centration causing an induction ratio [IR] of 1.5–50%
smaller molar amount of specifically acting chemicals. over control of IR1).
IC10baseline IC10baseline
SRbaseline = or SRbaseline = (1)
EC10 ECIR1.5
What is a safe level for chemicals with specific
modes of action? An SRbaseline ≤ 1 is not specific, 1 ≤ SRbaseline < 10 can be
Ideally, we would need to anchor each effect of an in vitro considered moderately specific (with high uncertainty),
assay applied in water quality assessment to the relevant ad- 10 ≤ SRbaseline < 100 is specific, and 100 ≤ SRbaseline is highly
verse outcome pathways (AOPs). More than 200 AOPs have specific (Escher et al. 2020b). It is also possible to define the
been developed in the last decade (Leist et al. 2017) since the specificity ratio against the measured IC10 in a given bioassay
concept was proposed (Ankley et al. 2010), but their applic- (SRcytotoxicity; Escher et al. 2020b). We are not using SRcytotoxicity
ability for risk assessment remains limited because of their in the present study because the cytotoxicity might also be
chemical‐agnostic feature, limited quantitative aspects, and triggered by a specific mode of action. The SRcytotoxicity value is
lack of multiple networks of AOPs (Perkins et al. 2015). Fur- therefore rather an indicator of selectivity (i.e., a combination
thermore, we want to be protective for any aquatic organism by multiplication of SRbaseline and the toxic ratio, which is the
and protect human health in case surface water is used for ratio of IC10baseline to the experimental IC10).
occupational or recreational purposes or drinking water ab- Bioassays can be classified into 2 categories that are
straction, but AOPs are typically specific for certain organisms. distinctly different from baseline toxicity. Baseline toxicants
If we use the cytotoxicity EBT‐IC10 as a point of departure, are expected to show a fairly tight log‐normal distribution
then the question for a given reporter gene assay remains how approximately specificity ratio = 1 (Figure 2B); that is, the
many chemicals elicit specific effects in this assay and how effect concentrations are expected to be close to the IC10
wileyonlinelibrary.com/ETC © 2020 The Authors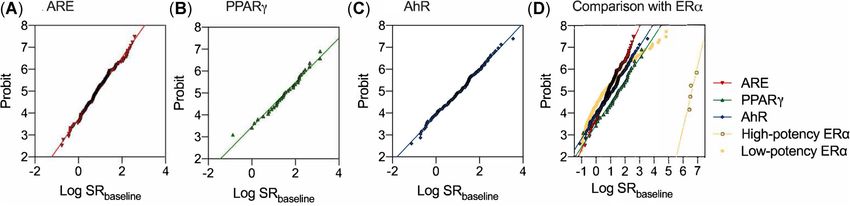
490                                                                    Environmental Toxicology and Chemistry, 2021;40:487–499—B. I. Escher and P.A. Neale

FIGURE 2: (A) Conceptual figure describing the derivation of the baseline specificity ratio (SRbaseline; Equation 1) from experimental effect con-
centrations and the inhibitory concentration causing 10% reduction in cell viability that was predicted from the quantitative structure–activity
relationship for baseline toxicity. (B) Conceptual figure of distributions of specificity ratios log SRbaseline for highly specific bioassays (category 1) and
those that respond to many different chemicals (category 2) compared to distributions of log SRbaseline of baseline toxicants. EC = effect concen-
tration; Dlipw = lipid–water distribution constant; IC10 = 10% inhibition concentration; QSAR = quantitative structure–activity relationship.

(or no effects can be detected because cytotoxicity masks                       artifact of the cytotoxicity burst (Judson et al. 2016; Fay
the effect).                                                                    et al. 2018).
   Bioassays that are mainly triggered by highly specific                            If all chemicals were baseline toxicants in a given assay, we
chemicals have been classified as category 1 bioassays in a                      could directly apply the cytotoxicity EBT‐IC10. For category
previous study that proposed EBTs (Escher et al. 2018b). These                  1 bioassays, existing EBTs that were read across from envi-
category 1 bioassays target highly specific, mainly receptor‐                    ronmental quality standards (EQSs; Escher 2018b) remain valid
mediated effects such as binding to hormone receptors. We                       because it is typically just a very small number of high‐potency
proposed to define category 2 bioassays as those assays cov-                     chemicals triggering the specific effect.
ering effect endpoints that are triggered by many more and                          For category 2 bioassays, low‐potency effect data were fil-
more diverse chemicals that exhibit specific effects but with                    tered out in the previous proposal for EBT derivation (Escher
lower degree of specificity. Category 2 bioassays include oxi-                   et al. 2018b). Read‐across from EQS was only possible for the
dative stress response and reporter gene assays with more                       most potent chemicals in these category 2 bioassays, and we
promiscuous nuclear receptor, such as AhR and PPARγ (Escher                     had to invoke a mixture factor to acknowledge that many more
et al. 2018b).                                                                  chemicals with lower potency were active in these bioassays. As
   In the earlier study on EBTs (Escher et al. 2018b), there were               discussed previously (Escher et al. 2018b), this approach is not
no clear criteria defined on how to differentiate category 1 from                very useful and is subject to major uncertainty. The resulting
category 2 bioassays. With the definition of the specificity ratios               EBTs for category 2 bioassays were considered preliminary,
in Escher et al. (2020b), we have a quantitative measure for the                although they have been applied in several case studies and
categorization. The highly specific category 1 bioassays re-                     slight improvements have been made by using a larger ex-
spond to chemicals that have a relatively narrow distribution at                perimental single‐chemical database (Neale et al. 2020a) or by
high SRbaseline (Figure 2B), and the responsive chemicals have                  harmonizing (de Baat et al. 2020) with the Smart Integrated
been termed “defined mixtures” (Escher et al. 2018b). Their                      Monitoring (SIMONI) approach (van der Oost et al. 2017).
SRbaseline values are typically ≥100, often up to 106 (Escher                       We propose an approach for these category 2 bioassays
et al. 2020b). Category 2 bioassays respond to many more                        that uses the effect data for all chemicals and their distributions
chemicals that have lower SRbaseline values that typically show a               of SRbaseline to not only better differentiate between the dif-
wider distribution (Figure 2B). Many of the chemicals activating                ferent bioassay categories but also use these distributions to
category 2 bioassays are presumably not known and hence are                     derive the EBT. First, it is important to check if the SRbaseline
“undefined mixtures.” Of course, there can be transitions be-                    values are indeed log‐normally distributed. We will show in the
tween category 1 and 2 bioassays if those have bimodal or                       Results and Discussion section how this can be practically ac-
multimodal distributions of high‐ and low‐potency ligands.                      complished and how to diagnose bioassays with high‐ and
Hence, we could also look at Figure 2B with different eyes—it                   low‐potency chemicals by breaking them up into several
could refer to one bioassay, in which some chemicals act highly                 distributions.
specifically, whereas others show low potency and some are                           We then suggest using the 50th percentile of the log‐
merely baseline toxicants whose measured specific effect is an                   normal distribution, which is effectively the median, to derive

© 2020 The Authors                                                                                                            wileyonlinelibrary.com/ETC
Effect‐based triggers for mixtures—Environmental Toxicology and Chemistry, 2021;40:487–499                                                             491

the EBT‐ECIR1.5 for adaptive stress responses and the                            the liposome–water partition constants (Klipw) as the descriptor
EBT‐EC10 for receptor‐mediated effects (Equation 2):                             of hydrophobicity. For acids and bases as well as multiprotic
                                                                                 chemicals, the speciation has to be considered. The fraction of
                                         IC10baseline    REF 10
      EBT‐ECIR1.5 or EBT‐EC10 =                       =                 (2)      the neutral and ionized species was calculated with the
                                          SRbaseline    SRbaseline
                                                                                 Henderson‐Hasselbalch equation from the acidity constant
    The median is used with the rationale that this is an in-                    pKa, which was estimated with ACD/Percepta pKa using the
tegration over all SRbaseline values provided that they follow a                 GALAS algorithm (ACD/Labs, 2015 release [Build 2726]).
standard log‐normal distribution, which will be checked and                      The ionization‐corrected liposome–water distribution ratios
discussed. Also, the division by the SRbaseline basically means                  (log Dlipw; pH 7.4) were calculated from experimental Klipw
that, on average, the mixture of chemicals in any sample with a                  values of the neutral species, Klipw(neutral), and the charged
very high number of chemicals responds at a lower REF than                       species, Klipw(ionized), with Equation 4.
baseline toxicity. Given that all these considerations rely on
linear concentration–response curves at low effect levels, one                               log D lipw = fneutral × log K lipw (neutral) + fionized
can expect that a sample that does not exceed the EBT‐EC for                                              × log Klipw (ionized)                        (4)
specific effect does not exceed 1% of effect.
    As for the cytotoxicity EBT‐IC10, these EBT‐ECIR1.5 and                         Experimental Klipw data (Betageri and Rogers 1987; Avdeef
EBT‐EC10 values are given in units of REFs of the water sample;                  et al. 1998; Escher et al. 2000, 2017; Kwon et al. 2006; Endo et al.
but for comparison with the previously proposed EBT‐BEQ values,                  2011; Bittermann et al. 2014; Henneberger et al. 2019a, 2019b;
they can also be related to reference compounds (Equation 3).                    Klüver et al. 2019; Ebert et al. 2020) were given preference in
                                                                                 Supplemental Data, Table S1. If no experimental data were
                 ECIR1.5reference compound        EC10reference compound         available, a log KOW‐based QSAR (Endo et al. 2011) was used to
 EBT‐BEQ =                                   or                                  predict the log Klipw(neutral), and it was assumed that Klipw(ionized)
                       EBT‐ECIR1.5                     EBT‐EC10
                                                                        (3)      was 10 times lower than Klipw(neutral; Bittermann et al. 2014) as
                                                                                 detailed previously (Escher et al. 2020b).
MATERIALS AND METHODS
Cell lines                                                                       Baseline toxicity QSARs
    The AREc32 reporter gene cell line, which was derived from                       The IC10baseline values were predicted with baseline toxicity
MCF7 cells (Wang et al. 2006); PPARγ‐BLA, derived from                           QSARs developed recently for the 3 cell lines (Escher
HEK293H cells; and AhR‐CALUX (H4L7.5c2), based on H4IIe                          et al. 2019). The QSARs are depicted in Figure 1B and are very
cells (Brennan et al. 2015) were frequently used in the past for                 similar for all 3 cell lines, in accordance with the concept of
water quality assessment and corresponding reporter gene assays:                 critical membrane concentrations. These baseline toxicity
TOX21_ARE_BLA_Agonist_viability/TOX21_ARE_BLA_Agonist_                           QSARs were initially derived for neutral species and a range of
ratio, TOX21_PPARg_BLA_Antagonist_viability/TOX21_PPARg_                         1 < log Klipw < 5 (Escher et al. 2019), but we extended them to
BLA_Agonist_ratio, and TOX21_AhR_LUC_Agonist_viability/                          ionizable chemicals by replacing the log Klipw with the log Dlipw
TOX21_AhR_LUC_Agonist are included in the Tox21 database,                        (pH 7.4) and applied them in a range from 0.6 < log Dlipw
which is accessible via the CompTox Chemicals Dashboard (US                      (pH 7.4) < 5.4 in a previous experimental study (Escher
Environmental Protection Agency 2020).                                           et al. 2020b). In the present study, we extrapolated the QSARs
                                                                                 another 0.6 log units on both ends of hydrophobicity and ap-
                                                                                 plied them to 0 < log Dlipw (pH 7.4) < 6. Seventy‐seven chem-
Chemicals and their physicochemical properties                                   icals (11%) had a log Dlipw (pH 7.4) < 0, and 24 chemicals (3%)
    There were 689 environmentally relevant chemicals included                   had a log Dlipw (pH 7.4) > 6 and were therefore excluded from
in the derivation of EBTs for the 3 bioassays (Supplemental Data,                the analysis, leaving 588 chemicals for analysis of the specificity
Table S1). They were a subset of chemicals detected in surface                   ratio, of which 75 chemicals fell into the extrapolated range of
water, including chemicals identified by Busch et al. (2016) as                   0 < log Dlipw (pH 7.4) < 1 and 22 chemicals into the ex-
major European river pollutants (Malaj et al. 2014) and/or de-                   trapolated range of 5 < log Dlipw (pH 7.4) < 6. The log Dlipw (pH
tected in recent case studies in surface waters across Europe                    7.4) and the predicted IC10baseline are listed in Supplemental
(König et al. 2017; Neale et al. 2017b, 2020a). Only chemicals for               Data, Table S1.
which we had in‐house measurements in one or more of the
3 reporter gene assays or data were available through the Tox21
database were included.                                                          Experimental cytotoxicity and activity data
    We collated physicochemical properties for the 689 chem-                     of single chemicals
icals (Supplemental Data, Table S1). The octanol–water parti-                       The IC10s and effect concentrations ECIR1.5 in AREc32 or
tion constants (log KOW) of the neutral species were retrieved                   EC10 in PPARγ‐BLA or AhR‐CALUX were previously measured
from the CompTox Chemicals Dashboard, with preference                            in our laboratory (Neale et al. 2017a; Escher et al. 2019;
given to experimental data from PhysPropNCCT, followed by                        Huchthausen et al. 2020; Neale et al. 2020a) for 121 chemicals in
predictions with OPERA (Mansouri et al. 2018). The QSARs use                     AREc32, 52 chemicals in PPARγ‐BLA, and 89 chemicals in

wileyonlinelibrary.com/ETC                                                                                                              © 2020 The Authors
492 Environmental Toxicology and Chemistry, 2021;40:487–499—B. I. Escher and P.A. Neale
AhR‐CALUX (H4L7.5c2) and are listed in Supplemental Data, water samples of the iceberg modeling case studies (Supple-
Table S1. In Supplemental Data, Table S1, 55 data points mental Data, Tables S2 and S3). From “#detected cytotoxic
(20 chemicals in AREc32, 12 chemicals in PPARγ‐BLA, and chemicals” we can extrapolate the total number of cytotoxic
23 chemicals in AhR‐CALUX) were newly measured according to chemicals with Equation 5 and the extrapolated total number
methods described in Neale et al. (2020a). All Tox21 entries for of bioactive chemicals with Equation 6.
these assays have recently been reevaluated (Escher et al. 2020b)
with a linear concentration–effect model (Escher et al. 2018a), Extrapolated total number of cytotoxic chemicals
and EC10 values for 522 chemicals in TOX21_ARE_BLA,
= #detected cytotoxic chemicals /(TUchem / TUbio ) (5)
614 chemicals in TOX21_PPARg_BLA_Agonist_ratio, and 574
chemicals in TOX21_AhR_LUC_Agonist were also included in Extrapolated total number of bioactive chemicals
Supplemental Data, Table S1, marked with the source “Tox21”;
= #detected bioactive chemicals /(BEQ chem /BEQbio) (6)
but these EC10 values were previously reevaluated from
publicly available concentration–response data with a linear
concentration–effect model (Escher et al. 2020b). The cell lines RESULTS AND DISCUSSION
AREc32 and AhR‐CALUX are not identical to the Tox21 assays
TOX21_ARE_BLA and TOX21_AhR_LUC_Agonist but are suffi- Estimated number of cytotoxic and bioactive
ciently similar to apply them as one data set (Neale et al. 2020a); chemicals
PPARγ‐BLA is identical to TOX21_PPARg_BLA_Agonist_ratio. In the case study on 128 highly diverse surface water sam-
Overall 25% of all chemicals were active in ARE (30% in ples collected during rain events (Neale et al. 2020a), cyto-
AREc32, 24% in TOX21_ARE_BLA_Agonist), 5.6% in PPARγ‐ toxicity data were available and included for 99 water samples
BLA, and 20% in AhR (26% in AhR‐CALUX and 18% in of AREc32, 117 samples of PPARγ, and 113 samples of AhR
TOX21_AhR_LUC_Agonist). (Supplemental Data, Table S2). The fraction of cytotoxicity
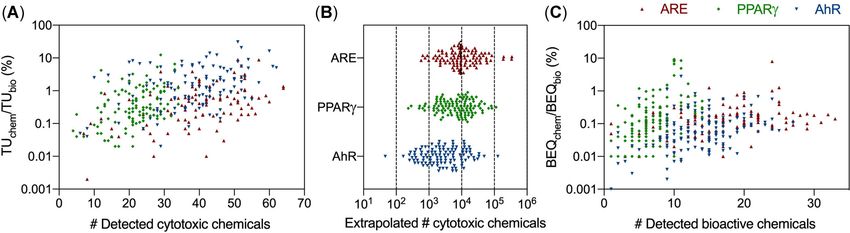
explained by the detected chemicals (TUchem/TUbio) was low,
despite up to 64 cytotoxic chemicals being detected, and in-
Iceberg modeling of mixture effects in water creased only slightly with increasing number of detected
samples chemicals (Supplemental Data, Table S2; Figure 3A). The ex-
Iceberg modeling compares the mixture effects predicted trapolated numbers of cytotoxic chemicals (Equation 5) varied
from the concentrations of detected chemicals and effect data of widely (Supplemental Data, Table S2) and were log‐normally
the detected chemicals with the measured effects (Escher distributed (Figure 3B; D'Agostino & Pearson test, p =
et al. 2020c). In the present study, we reused data from iceberg 0.41–0.98). The log‐normal distributions were significantly dif-
modeling of a highly diverse set of surface water quality data ferent between the 3 cell lines (one‐way analysis of variance,
(tables S7–S9 in Neale et al. [2020a], summarized in Supple- p < 0.0001), with AhR having a slightly lower range of mean ±
mental Data, Table S2) and data from wastewater‐treatment standard error (SE) with 6944 ± 1316 (95% CI 4336–9552) than
plants (WWTPs; Table S9 in Neale et al. [2020c], summarized in ARE with 25 770 ± 5456 (95% CI 14 925–36 616) and PPARγ
Supplemental Data, Table S3), where more than 600 chemicals with 13 086 ± 1615 (95% CI 9887–16 286). The mean ± SE ex-
were analyzed with the same analytical method, and all bioassay trapolated number of cytotoxic chemicals in all assays was
data were measured with AREc32, PPARγ‐BLA, and AhR‐CALUX 14 793 ± 1843 (95% CI 11 169–18 418), which means that we
after SPE. The number of analyzed chemicals was smaller in can expect roughly 15 000 cytotoxic chemicals in a water
those 2 case studies than in Supplemental Data, Table S1, and sample that act together in a concentration‐additive manner
hence a smaller number of chemicals had been considered in (Escher et al. 2020a). Because all chemicals are cytotoxic, albeit
the iceberg modeling (Neale et al. 2020a, 2020c). with different potencies, we can use that number in principle as
For cytotoxicity, the ratio of the toxic units (TU = 1/IC10) an approximation of the number of chemicals present in a
predicted from quantified chemicals (TUchem) to experimental complex mixture in a water sample. Of course, any complex
toxic units (TUbio) served as a measure of the fraction of total mixture contains high and low concentrations of thousands of
cytotoxicity explained (Neale et al. 2020a). For activation of the chemicals (Escher et al. 2020c). Furthermore, the main as-
reporter genes, the ratio of BEQs (BEQchem/BEQbio), predicted sumption underlying this extrapolation is that the analyzed
from the detected chemicals' concentrations and their effect chemicals are a representative subsample of the entire chem-
potency (BEQchem) and measured in the bioassays (BEQbio = ical universe so that extrapolation to all chemicals is possible.
ECref/ECsample, when EC can be ECIR1.5 or EC10), served Another assumption is that the effect potency of the included
as a measure of the fraction of effect explained (Neale chemicals is representative of all chemicals. This is likely not
et al. 2020a). true because we have chemicals on the target list of chemical
analysis, from which we know that they are problematic and
known water pollutants. Nevertheless, this analysis can tell us
Estimated number of cytotoxic and bioactive that there must be many more chemicals active in the complex
chemicals in water samples mixtures extracted from water than the ones we can quantify.
We know the number of detected chemicals that were cy- Increasing the numbers of chemicals analyzed will not solve the
totoxic or active and used to predict TUchem and BEQchem in the problem; we need to complement chemical analysis with
© 2020 The Authors wileyonlinelibrary.com/ETC
Effect‐based triggers for mixtures—Environmental Toxicology and Chemistry, 2021;40:487–499                                                          493

FIGURE 3: (A) Relationship between number of detected cytotoxic chemicals and fraction of toxic units (TUs) explained by the detected chemicals
(TUchem/TUbio) in 128 surface water samples (Neale et al. 2020a). (B) Extrapolated number of cytotoxic chemicals in surface water (Equation 5).
(C) Relationship between number of detected bioactive chemicals and fraction of bioanalytical equivalent concentrations explained by the detected
chemicals in 128 surface water samples (Neale et al. 2020a) and 20 samples from wastewater‐treatment plants (Neale et al. 2020c). All data are in
Supplemental Data, Tables S2 and S3. AhR = arylhydrocarbon receptor; ARE = antioxidant response element; BEQ = bioanalytical equivalent
concentration; PPARγ = peroxisome proliferator–activated receptor gamma.

bioassays for apical endpoints such as cytotoxicity. This un-                    not enrich more than REF 4 in that study, so we cannot tell
derpins the need to develop EBTs that account for the mixture                    if some of the effluents were meeting the EBT‐IC10. Both
effects and not only rely on a few highly potent chemicals.                      water types, surface and WWTP waters, were enriched by
    Activity data were available from 128 surface water                          SPE, which also removed inorganic contaminants and matrix
samples (Neale et al. 2020a) and 20 samples from WWTPs                           components. The good discrimination between surface water
(Neale et al. 2020c) with activity detected in 120 water                         and untreated wastewater and the fact that only a small
samples in AREc32, 140 samples in PPARγ, and 142 samples                         fraction of surface waters exceeded the trigger is a con-
in AhR (Supplemental Data, Tables S2 and S3). Fewer                              firmation that the choice of the protection level of
chemicals were active in these specific endpoints, and there                      1% was appropriate.
appeared to be an even weaker correlation between the                                It is interesting to note that van der Oost et al. (2017) pro-
number of detected bioactive chemicals and the fraction of                       posed an EC50 of REF 20 for nonspecific effects toward cells
BEQ explained by the detected chemicals (BEQchem/BEQbio;                         (Cytotox CALUX), bacteria, and zooplankton, which is very
Figure 3C), with most of BEQchem/BEQbio ranging from 0.01
to 1%. The low fraction of effect explained by the detected
chemicals means that there are many more bioactive
chemicals that have not been identified but need to be
accounted for because they contribute to the mixture effect
elicited by extracts from water samples. Because, despite
efforts to detect hundreds of chemicals and assess their
bioactivity individually, no substantial fraction of effect can
be explained by the detected chemicals, it is imperative that
we develop trigger values for mixture effects and not for
groups or individual chemicals.

What is a safe level for cytotoxicity in water
samples?
   When applying the proposed EBT‐IC10 of REF 10 to the
cytotoxicity data set (IC10 = 1/TUbio in Supplemental Data,
Table S2) of water samples collected during rainfall in small
                                                                                 FIGURE 4: (A) Distribution of inhibitory concentration causing 10%
agricultural streams (Neale et al. 2020a), we can see in                         reduction in cell viability (IC10) in water samples collected during
Figure 4 that only 2 of 72 samples in AhR, only 4 of 73                          rainfall in small agricultural streams; (Neale et al. 2020a) and (B) in
samples in PPARγ, and 7 of 62 samples in AREc32 exceeded                         wastewater‐treatment plant influent (color) and effluent (gray; Neale
                                                                                 et al. 2020c). In both figures, the dotted lines correspond to the pro-
the threshold (i.e., had IC10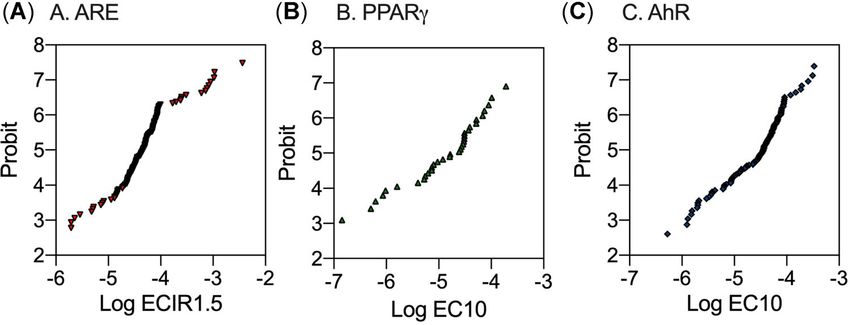
494                                                                   Environmental Toxicology and Chemistry, 2021;40:487–499—B. I. Escher and P.A. Neale

similar to the proposed threshold for cells considering also the               bioassays are category 1 bioassays, where previously proposed
differences between the 10% and 50% effect levels.                             EBTs remain valid (Escher et al. 2018b).
                                                                                  The AhR also has ligands of very high specificity, such as
                                                                               dioxin and dioxin‐like chemicals; but these high‐potency AhR
                                                                               ligands are very hydrophobic and do not occur in the aqueous
Are the SRbaseline values log‐normally
                                                                               phase but are bound to suspended particulate matter and
distributed?                                                                   sediments. Therefore, they are not relevant for the derivation of
    As shown in Supplemental Data, Table S1, for ARE, 166 of                   EBTs for surface water. If the approach was used to derive EBTs
689 chemicals were active, 497 chemicals were inactive, and for                for sediments, though, one would need to consider dioxin‐like
26 chemicals we did not have data for this pathway. For PPARγ,                 chemicals.
only 38 chemicals were active, 640 were inactive, and 11 data                     The question may arise as to why we are not working with
points were missing, whereas for AhR 133 chemicals were ac-                    effect concentrations themselves but with the SRbaseline. Effect
tive, 553 were inactive, and 3 data points were missing.                       concentrations have both a toxicokinetic and a toxicodynamic
    The IC10baseline (Supplemental Data, Table S1) were pre-                   component, whereas the SRbaseline reflects toxicodynamics
dicted for all chemicals in the range of 0 < log Dlipw (pH 7.4) < 6,           only. Hence, the distributions of ECIR1.5 and EC10 values of
leaving 152 (ARE), 34 (PPARγ), and 125 (AhR) chemicals for the                 the chemicals listed in Supplemental Data, Table S1 are not
SRbaseline (Supplemental Data, Table S1) analysis.                             log‐normal (Figure 6) and cannot be used to derive EBTs.
    We plotted the log SRbaseline against the rank, expressed in
probit units (Figure 5): ARE (Figure 5A), PPARγ (Figure 5B), and
AhR (Figure 5C) showed remarkably good log‐normal dis-
tributions with highly linear probit plots. Only very low and very             Derivation of mixture EBTs
high probit values deviated slightly from the linear regression.                   The log‐normal distributions of SRbaseline projected with the
When the log SRbaseline values of all 3 bioassays were super-                  regression parameters from the probit analysis are plotted in
imposed, they showed remarkably little difference (Figure 5D).                 Figure 7. The 50th percentiles of the distributions are high-
    For comparison, we also plotted the distribution of a cat-                 lighted with dotted lines and correspond to SRbaseline values of
egory 1 bioassay, using the reporter gene assay for estro-                     8 for ARE (Figure 7A), 33 for PPARγ (Figure 7B), and 12 for AhR
genicity ERα‐BLA as an illustrative example. Although the                      (Figure 7C). With these 50th percentiles we are in the region of
distribution of single‐chemical effect data from Tox21                         moderately specific (1 ≤ SRbaseline < 10), but although un-
(Supplemental Data, Table S4; data from Escher et al. [2020b],                 certainty of this region is high for single chemicals, the dis-
low‐potency estrogens) measured in ERα‐BLA overlapped with                     tribution of large numbers of data points provides some
these distributions at low log SRbaseline, there were 4 highly                 robustness of the SRbaseline and reflects the fact that many
potent estrogenic chemicals with SRbaseline > 1 million that                   chemicals are active but with moderate specificity.
largely deviated from the probit regressions of the low‐potency                    Although ARE, PPARγ, and AhR showed unimodal dis-
chemicals (Figure 5D). These are 17‐α‐ethinylestradiol, 17‐α‐                  tributions, ERα‐BLA had 2 distinct distributions with a maximum
estradiol, 17‐β‐estradiol, and estriol (Supplemental Data,                     at SRbaseline of 6.6 for low‐potency ERα agonists and another
Table S4; data from Hashmi et al. [2018]). These high‐potency                  maximum at SRbaseline of 4 × 10⁶ for high‐potency ERα agonists
estrogens dominate the mixture effects in environmental                        (Figure 7D). This visualization confirms the analysis that ERα is a
waters together with the lower‐potency estrone (Kase                           category 1 bioassay.
et al. 2018; Könemann et al. 2018) even if xenoestrogens such                      The EBT‐ECIR1.5 for oxidative stress response can be de-
as bisphenol A and butylparaben are present at much higher                     rived from the 50th percentile of the log‐normal distribution of
concentrations because of the much lower potency of the                        SRbaseline of 8, which can be converted with Equation 2 to a
xenoestrogens. This analysis confirms that estrogenicity                        mixture EBT‐ECIR1.5 of REF 1.2. This AREc32 EBT‐ECIR1.5 is

FIGURE 5: Probit plots of logarithms of specificity ratios (Supplemental Data, Table S1) for (A) ARE (slope = 1.4, intercept = 3.7, r 2 = 0.9928), (B)
PPARγ (slope = 1.0, intercept = 3.5, r 2 = 0.9778), (C) AhR (slope = 1.1, intercept = 3.9, r 2 = 0.9952), and (D) overlay of all 3 probit plots (A–C) and
comparison with ERα (Supplemental Data, Table S4). AhR = arylhydrocarbon receptor; ARE = antioxidant response element; ERα, estrogen receptor
alpha; PPARγ = peroxisome proliferator–activated receptor gamma; SR = specificity ratio.

© 2020 The Authors                                                                                                          wileyonlinelibrary.com/ETC
Effect‐based triggers for mixtures—Environmental Toxicology and Chemistry, 2021;40:487–499 495
FIGURE 6: Probit plots of logarithms of effect concentrations from Supplemental Data, Table S1 for (A) ARE, (B) PPARγ, and (C) AhR. AhR =
arylhydrocarbon receptor; ARE = antioxidant response element; EC10 = 10% effect concentration; ECIR1.5 = effect concentration causing an
induction ratio IR of 1.5; PPARγ = peroxisome proliferator–activated receptor gamma.
remarkably similar to the initial EBT‐ECIR1.5 of 3 derived in although only 5.6% of the 678 chemicals with bioassay data were
2013 (Escher et al. 2013). The corresponding EBT‐dichlorvos‐ active (in contrast to 25% for ARE and 19% for AhR).
EQ is 1.4 mgdichlorvos/L, which is 10 times higher than the pre- The mixture EBT‐EC10 for AhR is REF 0.9, which corre-
viously proposed EBT‐dichlorvos‐EQ of 156 µgdichlorvos/L that sponds to an EBT‐B[a]P‐EQ of 250 ngB[a]P/L. This value is
had applied a mixture factor of 1000 (Escher et al. 2018b). In 40 times higher than the previously proposed EBT‐B[a]P‐EQ of
hindsight, a mixture factor of 10 000 would have been more 6.4 ngB[a]P/L, which had applied a mixture factor of 100 (Escher
appropriate and led to the same EBT‐dichlorvos‐EQ as the et al. 2018b), but is similar to the SIMONI EBT‐B[a]P‐EQ of
specificity ratio‐distribution method. 150 ngB[a]P/L for the PAH‐CALUX, which was defined as twice
The EBT‐EC10 for PPARγ is now REF 0.3, which corresponds the background B[a]P‐EQ (van der Oost et al. 2017).
to an EBT‐rosiglitazone‐EQ of 1.2 µgrosiglitazone/L. This is While the mixture factors in the previous derivation were
33 times higher than the previously derived EBT‐rosiglitazone‐EQ derived only from expert knowledge and considerations of
of 36 ngrosiglitazone/L (Escher et al. 2018b) and the revised value of numbers of chemicals acting together, the new derivation is
19 ngrosiglitazone/L (Neale et al. 2020a), which had assumed that based on large numbers of chemicals, does not filter out any
PPARγ is a high‐potency endpoint and that no mixture factor had entries, and is the same approach for all category 2 bioassays.
been considered. At the time, there was limited experimental
data for the PPARγ assay available, but more recent iceberg
modeling experience (Neale et al. 2020a) has shown that the
fraction of effect explained by known chemicals was often496 Environmental Toxicology and Chemistry, 2021;40:487–499—B. I. Escher and P.A. Neale
FIGURE 8: Application of the new effect‐based triggers (EBTs) in field studies (circles [Neale et al. 2020a] and squares and diamonds [Neale et al.
2020c]) and previous data collections (gray symbols [Escher et al. 2018b]). Red dashed lines indicate new EBT bioanalytical equivalent concentration
(BEQ), black dotted lines indicate previously proposed EBT‐BEQ with the read‐across method (Escher et al. 2018b). AhR = arylhydrocarbon
receptor; ARE = antioxidant response element; EQ = equivalent; PPARγ = peroxisome proliferator–activated receptor gamma; WWTP = wastewater‐
treatment plant.
et al. 2020c) and revisited the case studies from the pre- with the read‐across method (Escher et al. 2018b), which are
vious EBT paper (appendix B in Escher et al. [2018b]). With marked as dotted lines in Figure 8.
the new EBT‐dichlorvos‐EQ of 1.4 mgdichlorvos/L, most of the
surface water samples did not exceed the trigger for
oxidative stress response (Figure 8A). In addition, the CONCLUSION
EBT‐dichlorvos‐EQ differentiated well between wastewater The present study closed the last conceptual gap in our
and surface water and often even differentiated well be- derivation strategy of EBTs (Escher et al. 2018b). It was rec-
tween untreated wastewater and WWTP effluent. The one ognized earlier that the different bioassay categories reacting
exceedance of WWTP effluent was after an initial membrane to highly specific but “rare” active chemicals (category 1 bio-
filtration step that was directly followed by further treatment. assays) and those reacting to a much larger range of more
The 4 surface water samples that now exceed the EBT‐ diverse chemicals of lower potency (category 2 bioassays)
dichlorvos‐EQ were collected from sites impacted or likely could not be treated in the same way. For category 2 bioassays,
impacted by industrial and municipal WWTP effluent. Of a mixture factor was implemented, which was scientifically
course, we cannot use exceedance for a certain water type justified but still subject to assumptions.
as a criterion for whether an EBT is valid or not, but this In the present study, we proposed an independent approach
comparison shows us that water that we expect to be of that starts from scratch, that is, from acceptable cytotoxicity of
poorer quality is exceeding the EBT‐dichlorvos‐EQ. The new 1%, not by reading across from chemical guideline values but by
EBT‐dichlorvos‐EQ is probably more realistic than the EBT of rooting the derivation in acceptable cell toxicity for all cells and
156 µgdichlorvos/L derived in 2018 using the method for high‐ beings. The concept of baseline toxicity also has drawbacks in
potency chemicals and a mixture factor (Escher et al. 2018b), case of very hydrophilic and/or reactive chemicals because they
which yielded much lower EBT and consequently a high are not associated with critical membrane concentrations. Nev-
frequency of EBT exceedances (Neale et al. 2020a). ertheless, the concept of baseline toxicity still appears suffi-
The same holds for PPARγ, where the EBT‐rosiglitazone‐EQ ciently robust to serve as a basis, on top of which specific effects
differentiated well between treated and untreated wastewater, can be defined. By using the specificity ratio as a measure of the
with 2 wastewater samples exceeding the EBT (Figure 8B). Both degree of specificity of effect, we do not have a mixed param-
were from WWTPs that applied primary treatment only (P1 and eter, as is the case for the effect concentrations, which are a
P2 in Neale et al. [2020c]). All surface water samples had ac- composite of toxicokinetics and toxicodynamics. Basically, with
ceptable water quality, with exception of 2 that were from the the new approach we are disentangling toxicokinetics (indirectly
Danube River at Novi Sad, in areas impacted by wastewater described by the baseline toxicity QSAR) from toxicodynamics
(König et al. 2017). (represented by the SRbaseline). One weakness is that metabolism
For AhR (Figure 8C), one of the primary treated effluent is not accounted for or is merely integrated in the toxicodynamic
exceeded the EBT (339 ngB[a]P/L, P1 in Neale et al. [2020c]), parameter of SRbaseline. Generally, in vitro reporter gene assays
whereas the other effluent from primary treatment was below. are considered not to be metabolically active; but, as has been
Seven of the surface water samples taken during rain events recently demonstrated, one of the cell lines applied in the
exceeded the EBT, which can be rationalized by road runoff present study, AREc32, expresses Cyp1A1 after induction with
and potentially river water impacted by WWTPs (Neale B[a]p (Fischer et al. 2020).
et al. 2020a). The excellent log‐normal distributions of SRbaseline in all
Overall the new EBTs differentiated much better between 3 investigated reporter gene assays serve as important under-
wastewater and surface water than the EBT‐BEQ values derived pinning of the concept. This is why we can use the 50th percentile
© 2020 The Authors wileyonlinelibrary.com/ETCEffect‐based triggers for mixtures—Environmental Toxicology and Chemistry, 2021;40:487–499 497
or median of the distribution to translate the cytotoxicity EBT to Data Availability Statement—All literature data used for the
EBTs for specific modes of action. The outlined method would, modeling are compiled and referenced in Supplemental Data,
of course, be applicable to any category 2 bioassay, including Table S1.
other reporter gene constructs targeting the same endpoints as
those applied in the present study or other receptors (e.g., PXR).
However, we would need a large number of single‐chemical REFERENCES
data for construction of the SRbaseline distributions, which pres-
Ankley GT, Bennett RS, Erickson RJ, Hoff DJ, Hornung MW, Johnson RD,
ently are not available. It remains to be explored if genotoxicity Mount DR, Nichols JW, Russom CL, Schmieder PK, Serrrano JA, Tietge
assays also fall into category 2 bioassays and if EBTs for geno- JE, Villeneuve DL. 2010. Adverse outcome pathways: A conceptual
toxicity could also be developed, which is clearly a gap at framework to support ecotoxicology research and risk assessment.
Environ Toxicol Chem 29:730–741.
present. Only van der Oost et al. (2017) have derived geno- Avdeef A, Box KJ, Comer JEA, Hibbert C, Tam KY. 1998. pH‐metric logP 10.
toxicity EBTs for Ames, umuC, and p53 CALUX with EBTs de- Determination of liposomal membrane–water partition coefficients of
rived for nonspecific endpoints reduced by an assessment factor ionizable drugs. Pharm Res 15:209–215.
of 10. This is actually very similar to the proposed approach with Besselink H, Brouwer B, van der Burg B. 2017. Validation and regulatory
acceptance of bio‐based approaches to assure feedstock, water &
the assessment factor of 10 replaced by the specificity ratio. The product quality in a bio‐based economy. Ind Crops Prod 106:138–145.
distributions of SRbaseline might also have some utility to better Betageri GV, Rogers JA. 1987. Thermodynamics of partitioning of beta‐
filter appropriate chemicals for the read‐across approach of blockers in the normal‐octanol‐buffer and liposome systems. Int J Pharm
36:165–173.
category 1 bioassays, as was evidenced by the bimodal dis-
Bittermann K, Spycher S, Endo S, Pohler L, Huniar U, Goss K‐U, Klamt A.
tributions of estrogenic chemicals in the ERα‐BLA assay. 2014. Prediction of phospholipid–water partition coefficients of ionic
Application of the new EBT in existing case studies organic chemicals using the mechanistic model COSMOmic. J Phys
Chem B 118:14833–14842.
confirmed that they differentiate unambiguously between poor
Blackwell BR, Ankley GT, Bradley PM, Houck KA, Makarov SS, Medvedev
and acceptable water quality. The present derivation had fo- AV, Swintek J, Villeneuve DL. 2019. Potential toxicity of complex mix-
cused on surface water. However, with the baseline toxicity tures in surface waters from a nationwide survey of United States
concept applicable to human cell lines, it can easily be ex- streams: Identifying in vitro bioactivities and causative chemicals.
Environ Sci Technol 53:973–983.
tended to drinking water. Existing EBTs for category 1 bio-
Brand W, de Jongh CM, van der Linden SC, Mennes W, Puijker LM, van
assays are already mostly in a similar range for surface water Leeuwen CJ, van Wezel AP, Schriks M, Heringa MB. 2013. Trigger values
and drinking water; hence, we could apply the proposed EBTs for investigation of hormonal activity in drinking water and its sources
using CALUX bioassays. Environt Int 55:109–118.
for surface water also to drinking water. Alternatively, one
Brennan JC, He G, Tsutsumi T, Zhao J, Wirth E, Fulton MH, Denison MS.
could also consider an additional uncertainty factor, which 2015. Development of species‐specific Ah receptor‐responsive third
would effectively be equivalent to accepting only 0.1% of generation CALUX cell lines with enhanced responsiveness and im-
proved detection limits. Environ Sci Technol 49:11903–11912.
baseline toxicity for drinking water; but the specificity ratio
Brion F, De Gussem V, Buchinger S, Hollert H, Carere M, Porcher JM, Piccini
factor would not change (unless there are substantial numbers B, Feray C, Dulio V, Konemann S, Simon E, Werner I, Kase R, Ait‐Aissa S.
of new single‐chemical data) because it is bioassay‐specific and 2019. Monitoring estrogenic activities of waste and surface waters using
not protection target‐specific. a novel in vivo zebrafish embryonic (EASZY) assay: Comparison with
in vitro cell‐based assays and determination of effect‐based trigger
values. Environ Int 130:104896.
Supplemental Data—The Supplemental Data are available on Busch W, Schmidt S, Kühne R, Schulze T, Krauss M, Altenburger R. 2016.
the Wiley Online Library at https://doi.org/10.1002/etc.4944. Micro‐pollutants in European rivers: A mode of action survey to support
the development of effect‐based tools for water monitoring. Environ
Toxicol Chem 35:1887–1899.
Acknowledgment—We thank the Global Water Research Conley JM, Evans N, Mash H, Rosenblum L, Schenck K, Glassmeyer S,
Coalition for supporting the present study within the framework Furlong ET, Kolpin DW, Wilson VS. 2017. Comparison of in vitro estro-
genic activity and estrogen concentrations in source and treated waters
of the project “Effect Based Monitoring in Water Safety from 25 US drinking water treatment plants. Sci Total Environ
Planning,” which was jointly funded by the Public Utilities Board, 579:1610–1617.
Stowa‐Foundation for Applied Water Research, Water Research de Baat ML, Van der Oost R, Van der Lee GH, Wieringa N, Hamers T,
Australia, Water Research Commission, Water Services Associ- Verdonschot PFM, De Voogt P, Kraak MHS. 2020. Advancements in
effect‐based surface water quality assessment. Water Res 183:116017.
ation of Australia, KWR–Water, SUEZ, Veolia–Research and In- Ebert A, Allendorf F, Berger U, Goss KU, Ulrich N. 2020. Membrane/water
novation, Griffith University, and the Helmholtz Centre for partitioning and permeabilities of perfluoroalkyl acids and four of their
Environmental Research. We thank S. Ait‐Assa, C. Arnal, F. alternatives and the effects on toxicokinetic behavior. Environ Sci
Technol 54:5051–5061.
Brion, S. Buchinger, M. Dechesne, T. Hamers, L. Henneberger,
Endo S, Escher BI, Goss KU. 2011. Capacities of membrane lipids to ac-
K. Hilscherova, R. Kase, F. Leusch, G. Meheut, L. Niu, E. Simon, cumulate neutral organic chemicals. Environ Sci Technol 45:5912–5921.
and R. van der Oost for helpful discussions and for reviewing the Escher B, Baumer A, Bittermann K, Henneberger L, König M, Kühnert C, Klüver
manuscript. This article is dedicated to Lucy, who felt she could N. 2017. General baseline toxicity QSAR for non‐polar, polar
and ionisable chemicals and their mixtures in the bioluminescence inhibition
not wait to be born before it was submitted. Open Access assay with Alliivibrio fischeri. Environ Sci Process Impact 19:414–428.
funding enabled and organized by ProjektDEAL. Escher B, Glauch L, Konig M, Mayer P, Schlichting R. 2019. Baseline toxicity
and volatility cutoff in reporter gene assays used for high‐throughput
screening. Chem Res Toxicol 32:1646–1655.
Disclaimer—All authors have no conflict of interest to declare.
Escher B, Neale PA, Villeneuve D. 2018a. The advantages of linear
The views expressed in the present review are solely those of concentration–response curves for in vitro bioassays with environmental
the authors. samples. Environ Toxicol Chem 37:2273–2280.
wileyonlinelibrary.com/ETC © 2020 The Authors498 Environmental Toxicology and Chemistry, 2021;40:487–499—B. I. Escher and P.A. Neale
Escher BI, Ait‐Aissa S, Behnisch PA, Brack W, Brion F, Brouwer A, Buchinger Klüver N, Bittermann K, Escher BI. 2019. QSAR for baseline toxicity and
S, Crawford SE, Du Pasquier D, Hamers T, Hettwer K, Hilscherova K, classification of specific modes of action of ionizable chemicals in the
Hollert H, Kase R, Kienle C, Tindall AJ, Tuerk J, van der Oost R, zebrafish embryo toxicity test. Aquat Toxicol 207:110–119.
Vermeirssen E, Neale PA. 2018b. Effect‐based trigger values for in vitro Könemann S, Kase R, Simon E, Swart K, Buchinger S, Schlüssener M, Hollert
and in vivo bioassays performed on surface water extracts supporting H, Escher BI, Werner I, Ait‐Assa S, Vermeirssen E, Dulio V, Valsecchi S,
the environmental quality standards (EQS) of the European Water Polesello S, Behnisch P, Javurkova B, Perceval O, di Paolo C, Olbrich D,
Framework Directive. Sci Total Environ 628–629:748–765. Sychrova E, Schlichting R, Leborgne L, Clara M, Scheffknecht C,
Escher BI, Allinson M, Altenburger R, Bain P, Balaguer P, Busch W, Crago J, Marneffe Y, Chalon C, Tusil P, Soldan P, von Danwitz B, Schwaiger J, San
Humpage A, Denslow ND, Dopp E, Hilscherova K, Kumar A, Grimaldi M, Martin Becares MI, Bersani F, Hilscherova K, Reifferscheid G, Ternes T,
Jayasinghe BS, Jarosova B, Jia A, Makarov S, Maruya KA, Medvedev A, Carere M. 2018. Effect‐based and chemical analytical methods to
Mehinto AC, Mendez JE, Poulsen A, Prochazka E, Richard J, Schifferli A, monitor estrogens under the European Water Framework Directive.
Schlenk D, Scholz S, Shiraishi F, Snyder S, Su G, Tang J, van der Burg B, Trends Analyt Chem 102:225–235.
van der Linden S, Werner I, Westerheide SD, Wong CKC, Yang M,
König M, Escher BI, Neale PA, Krauss M, Hilscherová K, Novák J,
Yeung B, Zhang X, Leusch FDL. 2014. Benchmarking organic micro-
Teodorović I, Schulze T, Seidensticker S, Kamal Hashmi MA, Ahlheim J,
pollutants in wastewater, recycled water and drinking water with in vitro
Brack W. 2017. Impact of untreated wastewater on a major European
bioassays. Environ Sci Technol 48:1940–1956.
river evaluated with a combination of in vitro bioassays and chemical
Escher BI, Braun G, Zarfl C. 2020a. Exploring the concepts of concentration analysis. Environ Pollut 220:1220–1230.
addition and independent action using a linear low‐effect mixture
Kunz PY, Kienle C, Carere M, Homazava N, Kase R. 2015. In vitro bioassays
model. Environ Toxicol Chem 39:2552–2559.
to screen for endocrine active pharmaceuticals in surface and waste
Escher BI, Henneberger L, Schlichting R, Fischer FC. 2020b. Cytotoxicity waters. J Pharm Biomed Anal 106:107–115.
burst or baseline toxicity? Differentiating specific from nonspecific
Kwon JH, Liljestrand HM, Katz LE. 2006. Partitioning of moderately hydro-
effects in reporter gene assays. Environ Health Perspect 128:077007.
phobic endocrine disruptors between water and synthetic membrane
Escher BI, Neale PA, Leusch FDL. 2015. Effect‐based trigger values for vesicles. Environ Toxicol Chem 25:1984–1992.
in vitro bioassays: Reading across from existing water quality guideline
Leist M, Ghallab A, Graepel R, Marchan R, Hassan R, Bennekou SH, Limonciel
values. Water Res 81:137–148.
A, Vinken M, Schildknecht S, Waldmann T, Danen E, van Ravenzwaay B,
Escher BI, Schwarzenbach RP, Westall JC. 2000. Evaluation of Kamp H, Gardner I, Godoy P, Bois FY, Braeuning A, Reif R, Oesch F,
liposome–water partitioning of organic acids and bases. 1. Drasdo D, Hohme S, Schwarz M, Hartung T, Braunbeck T, Beltman J,
Development of a sorption model. Environ Sci Technol 34:3954–3961. Vrieling H, Sanz F, Forsby A, Gadaleta D, Fisher C, Kelm J, Fluri D, Ecker
Escher BI, Stapleton HM, Schymanski EL. 2020c. Tracking complex mixtures G, Zdrazil B, Terron A, Jennings P, van der Burg B, Dooley S, Meijer AH,
of chemicals in our changing environment. Science 367:388–392. Willighagen E, Martens M, Evelo C, Mombelli E, Taboureau O, Mantovani
A, Hardy B, Koch B, Escher S, van Thriel C, Cadenas C, Kroese D, van de
Escher BI, van Daele C, Dutt M, Tang JYM, Altenburger R. 2013. Most Water B, Hengstler JG. 2017. Adverse outcome pathways: Opportunities,
oxidative stress response in water samples comes from unknown limitations and open questions. Arch Toxicol 91:3477–3505.
chemicals: The need for effect‐based water quality trigger values.
Environ Sci Technol 47:7002–7011. Leusch FDL, Khan SJ, Gagnon MM, Quayle P, Trinh T, Coleman H, Rawson C,
Chapman HF, Blair P, Nice H, Reitsema T. 2014. Assessment of waste-
Fay KA, Villeneuve DL, Swintek J, Edwards SW, Nelms MD, Blackwell BR, water and recycled water quality: A comparison of lines of evidence from
Ankley GT. 2018. Differentiating pathway‐specific from nonspecific ef- in vitro, in vivo and chemical analyses. Water Res 50:420–431.
fects in high‐throughput toxicity data: A foundation for prioritizing ad-
verse outcome pathway development. Toxicol Sci 163:500–515. Malaj E, von der Ohe PC, Grote M, Kuehne R, Mondy CP, Usseglio‐Polatera
P, Brack W, Schaefer RB. 2014. Organic chemicals jeopardize the health
Fischer FC, Abele C, Henneberger L, Klüver N, König M, Mühlenbrink M, of freshwater ecosystems on the continental scale. Proc Natl Acad Sci
Schlichting R, Escher BI. 2020. Cellular metabolism in high‐throughput USA 111:9549–9554.
in vitro reporter gene assays and implications for the quantitative
in vitro–in vivo extrapolation. Chem Res Toxicol 33:1770–1779. Mansouri K, Grulke CM, Judson RS, Williams AJ. 2018. OPERA models
for predicting physicochemical properties and environmental fate
Hashmi MAK, Escher BI, Krauss M, Teodorovic I, Brack W. 2018. endpoints. J Cheminform 10:10.
Effect‐directed analysis (EDA) of Danube River water sample receiving
untreated municipal wastewater from Novi Sad, Serbia. Sci Total Environ McCarty LS, Arnot JA, Mackay D. 2013. Evaluation of critical body residue
624:1072–1081. data for acute narcosis in aquatic organisms. Environ Toxicol Chem
32:2301–2314.
Henneberger L, Mühlenbrink M, Fischer FC, Escher BI. 2019a. C18‐coated
solid‐phase microextraction fibers for the quantification of partitioning Neale PA, Altenburger R, Ait‐Aissa S, Brion F, Busch W, de Aragão
of organic acids to proteins, lipids, and cells. Chem Res Toxicol 32: Umbuzeiro G, Denison MS, Du Pasquier D, Hilscherova K, Hollert H,
168–178. Morales DA, Novac J, Schlichting R, Seiler T‐B, Serra H, Shao Y, Tindall
AJ, Tollefsen KE, Williams TD, Escher BI. 2017a. Development of a
Henneberger L, Muhlenbrink M, Konig M, Schlichting R, Fischer FC, Escher
bioanalytical test battery for water quality monitoring: Fingerprinting
BI. 2019b. Quantification of freely dissolved effect concentrations in in
identified micropollutants and their contribution to effects in surface
vitro cell‐based bioassays. Arch Toxicol 93:2295–2305.
water. Water Res 123:734–750.
Huchthausen J, Muhlenbrink M, Konig M, Escher BI, Henneberger L. 2020.
Experimental exposure assessment of ionizable organic chemicals in in Neale PA, Braun G, Brack W, Carmona E, Gunold R, König M, Krauss M,
vitro cell‐based bioassays. Chem Res Toxicol 33:1845–1854. Liebmann L, Liess M, Link M, Schäfer RB, Schlichting R, Schreiner VC,
Schulze T, Vormeier P, Weisner O, Escher BI. 2020a. Assessing the
Jia A, Escher BI, Leusch FDL, Tang JYM, Prochazka E, Dong B, Snyder EM, mixture effects in in vitro bioassays of chemicals occurring in small ag-
Snyder SA. 2015. In vitro bioassays to evaluate complex chemical mix- ricultural streams during rain events. Environ Sci Technol 54:8280–8290.
tures in recycled water. Water Res 80:1–11.
Neale PA, Feliers C, Glauch L, König M, Lecarpentier C, Schlichting R, Thibert
Judson R, Houck K, Martin M, Richard AM, Knudsen TB, Shah I, Little S, S, Escher BI. 2020b. Application of in vitro bioassays for water quality
Wambaugh J, Setzer RW, Kothya P, Phuong J, Filer D, Smith D, Reif D, monitoring in three drinking water treatment plants using different
Rotroff D, Kleinstreuer N, Sipes N, Xia MH, Huang RL, Crofton K, treatment processes including biological treatment, nanofiltration and
Thomas RS. 2016. Analysis of the effects of cell stress and cytotoxicity on ozonation coupled with disinfection. Environ Sci (Camb) 6:2444–2453.
in vitro assay activity across a diverse chemical and assay space. Toxicol
Sci 152:323–339. Neale PA, Munz NA, Ait‐Aissa S, Altenburger R, Brion F, Busch W, Escher BI,
Hilscherova K, Kienle C, Novak J, Seiler T‐B, Shao Y, Stamm C,
Kase R, Javurkova B, Simon E, Swart K, Buchinger S, Konemann S, Escher Hollender J. 2017b. Integrating chemical analysis and bioanalysis to
BI, Carere M, Dulio V, Ait‐Aissa S, Hollert H, Valsecchi S, Polesello S, evaluate the contribution of wastewater effluent on the micropollutant
Behnisch P, di Paolo C, Olbrich D, Sychrova E, Gundlach M, burden in small streams. Sci Total Environ 576:785–795.
Schlichting R, Leborgne L, Clara M, Scheffknecht C, Marneffe Y,
Chalon C, Tusil P, Soldan P, von Danwitz B, Schwaiger J, Palao AM, Neale PA, O'Brien JW, Glauch L, König M, Krauss M, Mueller JF, Tscharke
Bersani F, Perceval O, Kienle C, Vermeirssen E, Hilscherova K, B, Escher BI. 2020c. Wastewater treatment efficacy evaluated with in
Reifferscheid G, Werner I. 2018. Screening and risk management vitro bioassays. Water Res X 9:100072.
solutions for steroidal estrogens in surface and wastewater. Trends Perkins EJ, Antczak P, Burgoon L, Falciani F, Garcia‐Reyero N, Gutsell S,
Analyt Chem 102:343–358. Hodges G, Kienzler A, Knapen D, McBride M, Willett C. 2015. Adverse
© 2020 The Authors wileyonlinelibrary.com/ETCYou can also read