New Trends for Antimalarial Drugs: Synergism between Antineoplastics and Antimalarials on Breast Cancer Cells - MDPI
←
→
Page content transcription
If your browser does not render page correctly, please read the page content below
biomolecules

Article
New Trends for Antimalarial Drugs: Synergism
between Antineoplastics and Antimalarials on Breast
Cancer Cells
Diana Duarte 1,2        and Nuno Vale 1,3, *
 1   OncoPharma Research Group, Center for Health Technology and Services Research (CINTESIS),
     Rua Plácido da Costa, 4200-450 Porto, Portugal; dianaduarte29@gmail.com
 2   Faculty of Pharmacy, University of Porto, Rua Jorge Viterbo Ferreira, 228, 4050-313 Porto, Portugal
 3   Faculty of Medicine, University of Porto, Al. Hernâni Monteiro, 4200-319 Porto, Portugal
 *   Correspondence: nunovale@med.up.pt; Tel.: +351-225-513-622

 Received: 19 November 2020; Accepted: 29 November 2020; Published: 1 December 2020

 Abstract: Chemotherapy plays a key role in breast cancer therapy, but drug resistance and
 unwanted side effects make the treatment less effective. We propose a new combination model
 that combines antineoplastic drugs and antimalarials for breast cancer therapy. Cytotoxic effects of
 two antineoplastic agents alone and in combination with several antimalarials on MCF-7 tumor cell
 line was evaluated. Different concentrations in a fixed ratio were added to the cultured cells and
 incubated for 48 h. Cell viability was evaluated using MTT and SRB assays. Synergism was evaluated
 using the Chou-Talalay method. The results indicate doxorubicin (DOX) and paclitaxel (PTX)
 alone at concentrations of their IC50 and higher are cell growth inhibitors. Mefloquine, artesunate,
 and chloroquine at concentrations of their IC50 demonstrate anti-cancer activity. In combination,
 almost all antimalarials demonstrate higher ability than DOX and PTX alone to decrease cell viability
 at concentrations of IC50 and lower than their IC50 . The combination of chloroquine, artesunate and
 mefloquine with DOX and PTX was synergic (CI < 1). The combination of DOX and mefloquine after
 48 h incubation demonstrated the highest cytotoxicity against MCF-7 cells, and the combination of DOX
 and artesunate was the most synergic. These results suggest antimalarials could act synergistically
 with DOX/PTX for breast cancer therapy.

 Keywords: breast cancer; drug synergism; antineoplastic drugs; drug repurposing; antimalarial drugs;
 combination therapy

1. Introduction
     Breast cancer is the most commonly diagnosed type of cancer in women and represents the
second leading cause of death by cancer in women worldwide [1]. The main subtypes of breast cancer
are estrogen receptor positive/progesterone receptor positive (ER+/PR+), HER-2 positive (HER2+),
and triple negative (ER−, PR−, HER2−) [2]. It is estimated that 75% of all patients have tumors
expressing the estrogen and/or progesterone receptors [3]. Surgical removal and chemotherapy
plays a key role in breast cancer therapy, being responsible for the long-term survival of patients [4].
However, chemotherapy often has its effectiveness decreased due to the ability of tumor cells to offer
intrinsic or acquired resistance to these therapeutic agents, making the treatment less effective [5].
Other problems related to chemotherapy involve side reactions, making cancer treatment less pleasant,
and narrowing the therapeutic window of antineoplastics [6]. It is, therefore, very important to develop
new methodologies and protocols to ensure the long-term survival and good life quality of these
patients by increasing the therapeutic efficacy of these treatments, while reducing the doses and toxicity.

Biomolecules 2020, 10, 1623; doi:10.3390/biom10121623                         www.mdpi.com/journal/biomolecules
Biomolecules 2020, 10, 1623                                                                          2 of 20

Doxorubicin (DOX) is an antineoplastic belonging to the anthracycline class that is widely used in
breast cancer [7]. Its mechanism of action is based on the intercalation with DNA, which leads to the
cleavage of DNA by the enzyme topoisomerase II (TOP2) and consequently the cell cycle stops in the
G2/M phase, resulting in cell death [8]. In addition, studies suggest that the interconversion of DOX by
cells to a semiquinone metabolite, leads to the formation of ROS that interfere with lipid peroxidation
and cause damage to DNA and cell membranes [8]. Doxorubicin is usually given in combination
with other chemotherapy medicines and used as adjuvant, neo-adjuvant, and to treat advanced-stage
breast cancer. However, the use of this drug in therapy is conditioned by its cardiotoxicity as well as
by the resistance of the tumor cells, leading to a decrease in its effectiveness [9]. Paclitaxel (PTX) is
another antineoplastic used in the treatment of advanced stage breast cancers and is a natural diterpene
alkaloid, isolated from the Taxus brevifolia tree [10]. In addition to its use in breast cancer, PTX is also
employed in the therapy of other types of cancers, such as ovary, lung, etc. [11]. The main target of
PTX is β-tubulin, a protein responsible for stabilizing the microtubule polymers. When binding to
β-tubulin, PTX prevents its breakdown and cells are blocked in phases G0/G1 and G2/M, which leads to
tumor cells death [12]. Several studies suggest that PTX can lead to increased expression of the FOXO1
gene, which may be involved in the inhibition of androgen receptors [13]. PTX also causes an increase
in IL-10, an anti-inflammatory cytokine, as well as an increase in the production of ROS, by increasing
the activity of NADPH oxidase [14]. The solvents used to solubilize this drug make PTX difficult
to tolerate while being given and patients usually need to pre-medications to minimize reactions to
the solvents. Furthermore, it causes together severe side effects such as low white blood cell count,
susceptibility to infections, allergic reactions, hair loss, vomiting, and diarrhea, among others [15].
       Several strategies, such as targeted therapies and controlled drug delivery, have been emerging.
Targeted therapies are rational strategies based on the overexpression of specific molecular targets
in tumor cells [16]. The controlled drug delivery allows the effective transport of several therapeutic
agents to the sites of action, allowing drugs to be concentrated in the desired location and
reducing the administered dose [17]. More recently, drug combination has gained interest in
the treatment of many advanced malignancies and involves drug cocktails of two or more drugs.
These combinations are chosen due to their non-overlapping resistance mechanisms [18] and the drug
interaction (synergy/antagonism) phenotype [19]. Different drugs in combination act on different
metabolic pathways that can contribute to carcinogenesis, turning the treatment more effective than
monotherapy [20–23]. The effect of the combined drugs can be even greater if the resulting effect is
higher than the addition of their effects alone, i.e., if the two drugs are synergic. This strategy aims to
decrease the required dose to achieve a therapeutic effect and consequently reduce systemic toxicity [24].
It is therefore important to define how the drugs are combined, such as the molar ratio of each drug in
the combination and precision is needed in translating these synergistic drug combinations into clinical
practice [25]. The combination of two antineoplastic agents, such as DOX and cisplatin, has shown
synergistic effect in phase III clinical trials; however this combination exhibited severe side-effects and
drug resistance in clinical practice [26,27]. Combination regimens for breast cancer have also been
evaluated in the clinic but toxicity has limited their application [28].
       In this work, we developed a new therapeutic strategy for breast cancer, based on the combination
of an antineoplastic agent and several repurposed drugs. Drug repurposing is a rapid methodology that
has already been used in clinic and allows to identify new uses for drugs that are already commercialized
in addition to its original medical indication [29]. This strategy is advantageous over the development
of new drugs, as it presents less risk of failure, since the pharmacokinetic and toxicological profiles
of the drug are already known, and reduces development time and consequently represents less
investment for pharmaceutical companies [30]. This strategy is also useful in the discovery of new
therapeutic targets and metabolic pathways [31]. Antimalarial drugs have been shown to be potentially
useful in the treatment of cancer [32–35]. The consideration of such drugs as possible anticancer
agents relies on their ability to interfere with important oncogenic pathways, such as Wnt/β-catenin,
STAT3, and NF-kB along with the emerging role of mitochondria in mediating the anti-tumor effects of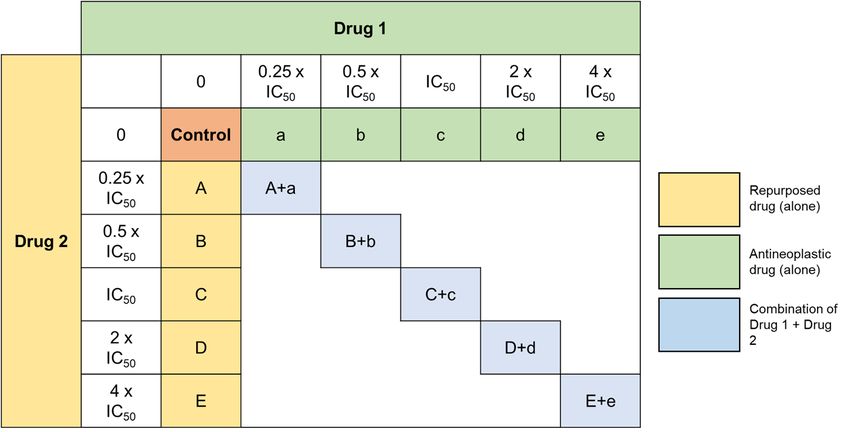
Biomolecules 2020, 10, 1623                                                                              3 of 20

antimalarials [36]. Among them, chloroquine, primaquine, and mefloquine particularly have been
investigated in the treatment of numerous types of cancers, both alone and in combination with
chemotherapy [37–39]. Our group selected several antimalarials and structurally grouped them into
two main groups: Quinolinic-related derivatives (1–7, Scheme 1) and non-quinolinic-related derivatives
(8–11, Scheme 1) and combined them with two antineoplastic drugs commonly used in breast cancer
chemotherapy: DOX and PTX.
      Mefloquine (1, Scheme 1) is a quinolinic analog commonly used in combination with artemisine
in the treatment of malaria. Its mechanism of action is the inhibition of parasite protein synthesis by
binding to the Pf80S subunit of the cytoplasmic ribosome of Plasmodium falciparum [40]. In cancer,
mefloquine is believed to be involved in the modulation of the pathway induced by AMPK via ROS
production, as well as in lysosomal disruption [41]. Mefloquine also presents antitumor effect and
has already been tested on tumor cell lines of the breast [42], prostate [41], etc. In hormone receptor
positive T47D and negative MDA-MB-231 breast cancer cell lines, mefloquine inhibited autophagy,
triggered endoplasmic reticulum stress, and caused cell death [42].
      Tafenoquine (2, Scheme 1) is an 8-aminoquinoline derivative that was recently approved (2018) for
the treatment of malaria caused by the parasite Plasmodium vivax. This drug is a primaquine analogue
and, although its mechanism remains unknown, it is thought that its pharmacological activity is due to
the metabolization catalyzed by the CYP450 complex, namely by CYP2D6 [43].
      Chloroquine (3, Scheme 1) is a 4-aminoquinoline approved for the treatment of malarial
infections and later for the treatment of discoid and systemic lupus erythematosus and rheumatoid
arthritis. Chloroquine has been extensively studied both in vitro and in vivo in various cancer types,
as monotherapy and combination therapy [44]. The mechanisms of action of chloroquine against
the malarial Plasmodium parasite are well known [45]. Several hypotheses have been proposed on
how chloroquine exerts its anti-cancer effect, but some preclinical studies state that it influences the
TLR9/nuclear factor kappa B (NF-κB) signaling pathway, the CXCL12/CXCR4 signaling pathway
and the p53 pathway. Additionally, chloroquine might affect the autophagic flux at a late stage as
it inhibits the fusion of the autophagosomes with the lysosomes and subsequent degradation of the
autolysosome [44]. Several pre-clinical studies also support the use of chloroquine in anti-cancer
therapy, mainly combined with conventional chemotherapeutic drugs, such as 5-fluorouracil [46,47].
Chloroquine has also been studied in different cancer cell types, such as lung [48], breast [49,50],
and colon [51], resulting in anti-cancer effects. Indeed, more than 30 clinical studies are currently
evaluating the activity of this antimalarial drug combined with various standard treatments in different
types of cancer. The idea behind this strategy is that chloroquine can increase tumor cells sensibilization
and therefore potentiate the therapeutic activity of chemotherapeutic drugs [44].
      6-Methoxy-8-nitroquinoline (4, Scheme 1) was included in this study because it is also a quinoline
derivative structurally very similar with the previous ones. No anticancer properties are reported for
this drug in the literature.
      Pyronaridine (5, Scheme 1) is a quinoline-related drug that inhibits the formation of β-hematin
and promotes the lysis of blood cells. Its mechanism of action as an anti-malaria agent is based on
the inhibition of the DNA polymerase II of the parasite P. falciparum through the formation of a stable
complex with the DNA. In breast tumor cells, this drug exhibits cytotoxicity through the induction of
apoptosis, by interfering with the progression of the cell cycle [52].
      Primaquine (6, Scheme 1) is a substituted quinoline used in the treatment of malaria, mainly administrated
in combination with chloroquine. This drug is effective against all four malarial species that infect
humans [53,54]. Its mechanism of action is not well understood but it is thought to interfere with the
mitochondria of the parasite, by generating reactive oxygen species or by interfering with the electron
transport [55]. In a study published by Kim et al., primaquine, in combination with mefloquine,
has also demonstrate ability to sensitize drug-resistant KBV20C cancer cells by increasing P-glycoprotein
inhibition [39].
Biomolecules 2020, 10, 1623 4 of 20
Sitamaquine (7, Scheme 1), also known as WR6026, is an 8-aminoquinoline with excellent efficacy
against parasites and currently undergoing phase 2b clinical trials for the treatment of visceral
leishmaniasis [56,57]. Its mechanism of action involves inhibition of the respiratory chain complex II
in parasites’ mitochondria, by triggering oxidative reactive species formation, ultimately leading to
Leishmania parasites’ apoptosis [58].
Cycloguanil (8, Scheme 1) is the active metabolite of proguanil, a prophylactic antimalarial
drug. Proguanil is often administered together with chloroquine and atovaquone in the treatment of
resistant malaria. Cycloguanil inhibits the enzyme dihydrofolate reductase in Plasmodium falciparum
and Plasmodium vivax, which is involved in the reproduction of the parasites [59].
Atovaquone (9, Scheme 1) is an antimalarial drug approved for clinical used by FDA in 2000.
It is used for the prevention of malaria and in the treatment of pneumocystis pneumonia and/or
toxoplasmosis in immune-compromised patients [60,61]. Atovaquone can be administered alone or in
combination with Proguanil. Atovaquone is a quinone that targets the Co-enzyme Q10-dependence of
mitochondrial complex III from Plasmodium falciparum, acting as a competitive inhibitor of co-enzyme
Q10 [62]. Several studies demonstrate that atovaquone also has anti-tumoral activity against different
types of cancer cells [63,64], namely breast cancer cells [65]. MCF-7 breast cancer cells treated with
atovaquone demonstrate this drug inhibits oxygen-consumption and metabolically induces aerobic
glycolysis and oxidative stress. Atovaquone can also be potent and selective in mixed populations of
cancer stem cells (CSCs) and non-CSCs [65].
Artesunate (10, Scheme 1) is a derivative of artemisinin, which is also indicated in the treatment
of malaria. This drug has a cytotoxic effect in different types of cells [66] and, specifically in gastric
cancer, its effect is associated with a decrease in the expression of COX-2 [67]. In triple negative breast
cells, studies have shown a decrease in cell proliferation through the blocking of cell cycle in G2/M
(ROS-dependent) and in G1 (ROS-independent) [68]. In addition, the same study suggests this drug is
capable of inhibiting angiogenesis, reducing invasion and metastasis as well as altering lysosomal
mechanisms [68].
Lumefantrine (11, Scheme 1) is a synthetic amino alcohol fluorene derivative, related to
mefloquine [69]. It is an antimalarial agent used in the treatment of acute uncomplicated malaria.
Usually, it is administered in combination with artemether for improved efficacy. This combination
acts against the erythrocytic stages of the malaria parasite [70]. It can also be used to treat infections
caused by Plasmodium falciparum and unidentified Plasmodium species, including those acquired
in chloroquine-resistant. The exact mechanism of action of lumefantrine remains unknown but
available data suggest that this drug inhibits the formation of β-hematin and inhibits nucleic acid and
protein synthesis [70].
In this work, we hypothesized that antimalarials could synergistically act with DOX and PTX in
breast cancer treatment. Here, we propose a new combination model that consists of the combination
of an antineoplastic and a repurposed drug. The main goal is to have a safe starting point, such as an
antineoplastic drug, whose antitumor activity is guaranteed in tumor cells. The combination with
the repurposed drug, which has an acceptable toxicological profile, aims to improve the activity of
the reference drug, and simultaneously reduce its therapeutic dose. Since the toxicological profile of
these drugs is already known, once their anti-cancer activity is better understood, the use of these
drugs can be implemented clinically. Here, we demonstrate that the combination of DOX/PTX and
some antimalarials such as artesunate, chloroquine, and mefloquine induces a greater anti-tumor effect
compared to each drug alone in MCF-7 breast cancer cell line. These results should be confirmed
in vivo and may be significant clinically. These data may lead to new therapeutic strategies for breast
cancer therapy.Biomolecules 2020, 10, 1623 5 of 20
Biomolecules 2020, 10, x FOR PEER REVIEW 5 of 22
NH
H OH
N O
H2N
F
N O
F
F
F
N
O
F
F
1 F F
F
2
OH
Cl N
-
O O N N
N+
N
NH
NH
O N O
N
4
3 Cl N
5
N
H2N NH
NH
N
N
O
O
6 7
H2 N
N
Cl N NH2
Cl
N
8 O
Cl
OH
O
Cl Cl
O O
O
O
O OH
OH O N
O
9 10 11
Scheme 1. Chemical structures of the antimalarial drugs used in combination with antineoplastic in
this work. Several compounds share a heterocyclic aromatic organic motif called quinoline (in red).
Scheme 1. Chemical structures of the antimalarial drugs used in combination with antineoplastic in
Tafenoquine (1), mefloquine (2), chloroquine (3), 6-methoxy-nitroquinoline (4), pyronaridine (5),
this work. Several compounds share a heterocyclic aromatic organic motif called quinoline (in red).
primaquine (6), sitamaquine (7), cycloguanil (8), atovaquone (9), artesunate (10), and lumefantrine (11).
Tafenoquine (1), mefloquine (2), chloroquine (3), 6-methoxy-nitroquinoline (4), pyronaridine (5),
primaquine (6), sitamaquine (7), cycloguanil (8), atovaquone (9), artesunate (10), and lumefantrine
2. Materials and Methods
(11).
2.1. Materials
2. Materials and Methods
Dulbecco’s modified Eagle’s medium (DMEM), fetal bovine serum (FBS), and penicillin-streptomycin
2.1. Materials
solution were purchased from Millipore Sigma (Merck KGaA, Darmstadt, Germany). Other cell
Dulbecco’s
culture reagents modified
were Eagle’s from
purchased medium
Gibco(DMEM), fetalFisher
(Thermo bovineScientific,
serum (FBS), Inc,and penicillin-MA, USA).
Waltham,
streptomycin solution were purchased from Millipore Sigma (Merck KGaA, Darmstadt, Germany).
Doxorubicin (cat. no. 15007), artesunate (cat. no. 11817), and cycloguanil (cat. no. 16861) were obtained
Other cell culture reagents were purchased from Gibco (Thermo Fisher Scientific, Inc, Waltham, MA,
from Cayman Chemical (Ann Arbor, Michigan, USA). Paclitaxel (taxol® ; cat. no. 1097) and atovaquone
(cat. no. 6358) was obtained from Tocris Bioscience (Bristol, UK). Pyronaridine (cat. no. P0049),
tafenoquine (cat. no. SML0396), chloroquine (cat. no. C6628), lumefantrine (cat. no. L5420),
primaquine (cat. no. 160393), sitamaquine (cat. no. SML1542), 6-methoxy-nitroquinoline
(cat. no. 206571), Thiazolyl Blue Tetrazolium Bromide (MTT, cat. no. M5655) and sulforhodamine
B (SRB, cat. no. S1402) were obtained from Sigma-Aldrich (Merck KGaA, Darmstadt, Germany).
Mefloquine (cat. no. sc-211784) was purchased from Santa Cruz Biotechnology (Dallas, Texas, USA).Biomolecules 2020, 10, 1623 6 of 20
2.2. Cell Line and Cell Culture
Human breast cancer MCF-7 cell line was obtained from the American Type Culture Collection
(ATCC; Virginia, USA) and maintained according to ATCC’s recommendations at 37 ◦ C and 5% CO2 in
DMEM medium supplemented with 10% fetal bovine serum, 100 U/mL penicillin G, and 100 µg/mL
streptomycin. Cells were maintained in the logarithmic growth phase at all the times. The media was
renewed every 2 days, trypsinized with 0.25% trypsin-EDTA, and subcultured in the same media.
MCF-7 cells (10,000 cells/well) were seeded in 48-well plates and allowed to adhere overnight prior
drug exposure. After that, the cell culture media were replaced with drug-containing media. Cells were
exposed to drugs for 48 h, followed by SRB and MTT assays to evaluate single and combination drug
treatments in the cell viability of these cells.
2.3. Drug Treatment
The half maximal inhibitory concentration (IC50 ) value was first determined for each drug
alone in MCF-cells. DOX concentrations ranged from 0.01 to 10 µM for the single-drug treatment.
PTX concentrations ranged from 0.1 to 500 nM. Other drug concentrations ranged from 1 to 100 µM for
the single-drug treatment. Combination studies were performed by combining DOX or PTX (Drug 1)
with the repurposed drugs (Drug 2). Only drugs that present the most promising pharmacological
profile such as artesunate, pyronaridine, tafenoquine, mefloquine, chloroquine, and cycloguanil were
tested in combination with PTX and DOX. Both Drug 1 and Drug 2 concentrations were variable and
the combination effects of equipotent concentrations (fixed ratio) of the IC50 values for each drug
were evaluated.
2.4. Cell Viability Assay
To determine the effects of DOX, PTX, artesunate, pyronaridine, tafenoquine, mefloquine, atovaquone,
chloroquine, cycloguanil, lumefantrine, primaquine, sitamaquine, and 6-methoxy-8-nitroquinoline on the
viability of MCF-7 cells, MTT and SRB assays were used. For the MTT protocol, after drug treatment,
the cell medium was removed, and 200 µL/well of MTT solution (0.5 mg/mL in PBS) was added.
Cells were incubated for 3 h, protected from light. After this period, the MTT solution was removed,
and DMSO (200 µL/well) was added to solubilize the formazan crystals. Absorbance was measured at
570 nm in an automated microplate reader (Sinergy HT, Biotek Instruments Inc., Winooski, VT, USA).
For SRB assay, after treatments, the cultured cells were fixed with ice-cold 10% trichloroacetic acid
for 30 min and stained with 0.4% SRB for 1h at room temperature. Excess dye was removed by
rinsing several times with tap water. Protein-bound dye was dissolved with 400 µL 10 mM Tris base
solution for the determination of absorbance with a microplate reader with a filter wavelength of
540 nm (Sinergy HT, Biotek Instruments Inc., Winooski, VT, USA). The IC50 of therapeutic drug was
determined as each drug concentration showing 50% cell growth inhibition as compared with control.
All conditions were performed in three times independently, in triplicate.
2.5. Data Analysis
GraphPad Prism 8 (GraphPad Software Inc., San Diego, CA, USA) was used to produce
concentration–response curves by nonlinear regression analysis. The viability of cells treated with
each drug was normalized to the viability of control cells and cell viability fractions were plotted vs.
drug concentrations in the logarithmic scale.
2.6. Analysis of Drug Interactions
To quantify drug interaction between DOX/PTX and antimalarial drugs, the Combination Index
(CI) was estimated by the unified theory, introduced by Chou and Talalay [71] using CompuSyn
software (ComboSyn, Inc., New York, NY, USA). We used the mutually exclusive model, based on the
assumption that drugs act through entirely different mechanisms [72]. The two drugs were combinedBiomolecules 2020, 10, x FOR PEER REVIEW 7 of 22
each drug was normalized to the viability of control cells and cell viability fractions were plotted vs.
drug concentrations in the logarithmic scale.
Biomolecules 2020, 10, 1623 7 of 20
2.6. Analysis of Drug Interactions
To quantify drug interaction between DOX/PTX and antimalarial drugs, the Combination Index
in a fixed(CI)
ratio of doses that correspond to 0.25, 0.5, 1, 2, and 4 times that of the individual IC50 s. CI was
was estimated by the unified theory, introduced by Chou and Talalay [71] using CompuSyn
plotted on y-axis as a function
software (ComboSyn, ofNew
Inc., effect level
York, NY,(Fa) on the
USA). x-axisthetomutually
We used assess drug synergism
exclusive between
model, based on drug
combinations. The CI isthat
the assumption a quantitative representation
drugs act through of pharmacological
entirely different mechanisms [72]. interactions. CI < were
The two drugs 1 indicates
synergism, CI = 1in
combined a fixed ratio
indicates of dosesinteraction,
additive that correspond
andtoCI > 10.5,
0.25, 1, 2, and antagonism.
indicates 4 times that of the individual were
Experiments
conducted IC50in
s. triplicate
CI was plotted
(n =on3)y-axis
withas3 areplications
function of effect leveldrug
at each (Fa) on the x-axis to assess drug synergism
concentration.
between drug combinations. The CI is a quantitative representation of pharmacological interactions.
CI < 1Analysis
2.7. Statistical indicates synergism, CI = 1 indicates additive interaction, and CI > 1 indicates antagonism.
Experiments were conducted in triplicate (n = 3) with 3 replications at each drug concentration.
The results are presented as mean ± SEM for n experiments performed. All data were assayed in
2.7. Statisticalexperiences,
three independent Analysis in triplicate. Statistical comparisons between control and treatment
groups, at the Thesame
resultstime point, were
are presented performed
as mean ± SEM for nwith Student’s
experiments t test and
performed. one-way
All data ANOVA
were assayed in test.
Statisticalthree independent
significance wasexperiences,
accepted inat triplicate. < 0.05. comparisons between control and treatment
p values Statistical
groups, at the same time point, were performed with Student’s t test and one-way ANOVA test.
Statistical significance was accepted at p values < 0.05.
3. Results
3.1. Effect3.ofResults
DOX and PTX as Single Agents on MCF-7 Cellular Viability
3.1. Effect of the
We analyzed DOX and PTX aspotential
cytotoxic Single Agents on MCF-7
of two Cellular Viability
established antineoplastic agents, namely PTX and
DOX in a human breast the
We analyzed cancer cell potential
cytotoxic line MCF7 (noninvasive
of two human breast
established antineoplastic cancer
agents, namelycellPTX
line,
andPR and
DOX in a human breast cancer cell line MCF7 (noninvasive human breast cancer
ER-positive). To evaluate the effects of DOX and PTX alone on MCF-7 cells, the cells were treated with cell line, PR and ER-
DOX alone positive).
(rangeTo evaluate
1–10 µM) the
andeffects of DOX(range
PTX alone and PTX alone on
0.1–500 nM)MCF-7
for 48cells,
h inthe cells were
MCF-7 cells.treated with
The percentage
DOX alone (range 1–10 µM) and PTX alone (range 0.1–500 nM) for 48 h in MCF-7 cells. The percentage
of cell survival was assessed by MTT assay and the percentage of cellular protein content was measured
of cell survival was assessed by MTT assay and the percentage of cellular protein content was
by SRB assay.
measuredTheby MTT
SRB assay is based
assay. The MTT assayon the measurement
is based of mitochondrial
on the measurement activity,
of mitochondrial whilewhile
activity, the SRB is
based ontheprotein synthesis. The results of MTT and SRB tests agree with DOX activity
SRB is based on protein synthesis. The results of MTT and SRB tests agree with DOX activity and and are given in
Figure 1A,B, respectively.
are given in FigureOur results
1A,B, reveal aOur
respectively. significant activity
results reveal of this drug
a significant at concentrations
activity of this drug at above
concentrations
0.1 µM. The above 0.1
cells displayed µM. The
strong cells displayed
response to the strong response
cytotoxic to the
effect cytotoxic
of DOX, effect
with of DOX,
1 µM withalmost
killing
1 µM
50% of cells. killing almost 50% of cells.
Effects
Figure 1.Figure 1. of doxorubicin
Effects (DOX)
of doxorubicin on on
(DOX) (A)(A)cell
cellviability
viability and (B)cellular
and (B) cellular protein
protein content.
content. Cells were
Cells were
cultured cultured
in the presence of increasing
in the presence concentrations
of increasing concentrationsof of DOX. After4848
DOX. After h MTT
h MTT andand
SRB SRB
assaysassays
were were
performed to measured
performed cellular cellular
to measured viabilityviability
as wellasaswellprotein content.content.
as protein ValuesValues
are expressed in percentage
are expressed in
percentage
and represent means and represent
± SEM. Eachmeans ± SEM. Each
experiment was experiment
done threewas done
times (n = 3); ** statistically
three times independently
independently (n =
3); ** statistically significant vs. control at p < 0.01. **** statistically significant vs. control at p < 0.0001.
significant vs. control at p < 0.01. **** statistically significant vs. control at p < 0.0001.
PTX is an antineoplastic drug also used in breast cancer but has a totally different chemical
structure from DOX and a different mechanism of action. While DOX is an anthracycline based on
intercalation with DNA, PTX acts at the level of microtubules, with direct consequences on the cell
cycle. The results concerning the PTX activity are given in Figure 2A,B for MTT and SBR assays,
respectively, and demonstrate a great response of this drug for concentrations above 1 nM, with 10 nM
causing the reduction of almost 50% of the cells. This response is more pronounced in the SRB assay,
with a significant response from 1 nM. Together, these results support the anti-cancer activity of these
two antineoplastic drugs in the treatment of breast cancer, namely in estrogen-receptor positive breast
cancer and justify their use in the combinations proposed in this study.intercalation with DNA, PTX acts at the level of microtubules, with direct consequences on the cell
assay, with a significant response from 1 nM. Together, these results support the anti-cancer activity
cycle. The results concerning the PTX activity are given in Figure 2A,B for MTT and SBR assays,
of theserespectively,
two antineoplastic drugsa in
and demonstrate theresponse
great treatment ofdrug
of this breast cancer, namely
for concentrations abovein1 estrogen-receptor
nM, with 10
positive nM
breast cancer
causing and justify
the reduction their use
of almost 50%inofthe
the combinations proposed
cells. This response is more in this study.
pronounced in the SRB
assay, with a significant response from 1 nM. Together, these results support the anti-cancer activity
Biomoleculesof2020,
these10,two
1623antineoplastic drugs in the treatment of breast cancer, namely in estrogen-receptor 8 of 20
positive breast cancer and justify their use in the combinations proposed in this study.
Figure 2. Effects of paclitaxel (PTX) on (A) cell viability and (B) cellular protein content. Cells were
Effects
Figure 2.Figure 2. of paclitaxel
Effects (PTX)
of paclitaxel on (A)
(PTX) cellcell
on (A) viability
viability and (B)cellular
and (B) cellular protein
protein content.
content. Cells Cells
were were
cultured in the presence of increasing concentrations of PTX. After 48 h MTT and SRB assays were
cultured cultured
in the presence of increasing
in the presence concentrations
of increasing concentrations of of PTX. After4848
PTX. After h MTT
h MTT andandSRB SRB
assays assays
were were
performed to measured cellular viability as well as proteincontent.
content. Values are expressed in
performed to measured
performed cellular cellular
to measured viabilityviability
as wellasaswellprotein content. ValuesValues
as protein are expressed in percentage
are expressed in
percentage and represent means ± SEM. Each experiment was done three times independently (n = 3)
percentage
and represent means and
± represent
SEM. Each means ± SEM. Each
experiment wasexperiment
done three was doneindependently
times (n = 3) ***(n
three times independently = 3)
statistically
*** statistically
significant significant vs. control at p < 0.001. **** statistically significant vs. control at p <
*** statistically significant vs. control at p < 0.001. **** statistically significant vs. control at p < 0.0001.
vs. control at p < 0.001. **** statistically significant vs. control at p < 0.0001. 0.0001.
3.2. Effect3.2.
3.2. Effect of Effect of Antimalarial
of Antimalarial
Antimalarial Quinolinic
Quinolinic
Quinolinic Derivates
Derivates
Derivates asas
as SingleAgents
Single
Single Agents on
Agents onMCF-7
on MCF-7
MCF-7 Cellular Viability
Cellular
Cellular Viability
Viability
We next analyzed the cytotoxic potential of several antimalarial drugs, namely mefloquine,
We next
We next analyzed
analyzed thethe cytotoxic
cytotoxic potential
potential of of several
several antimalarial
antimalarial drugs,
drugs, namely
namely mefloquine,
mefloquine,
tafenoquine, 6-methoxy-nitroquinoline, pyronaridine, chloroquine, primaquine, and sitamaquine in
tafenoquine,
tafenoquine, 6-methoxy-nitroquinoline,
6-methoxy-nitroquinoline, pyronaridine,
pyronaridine, chloroquine,
chloroquine, primaquine,
primaquine, and
and
a human breast cancer cell line MCF-7. As chloroquine anti-cancer activity has been evaluated several sitamaquine
sitamaquine in
in
aahuman
humantimes breast
breast cancer
cancer cell
cell line
line MCF-7.
MCF-7. As chloroquine
chloroquine anti-cancer
anti-cancer activity
activity has
has been
been evaluated
evaluated
in breast cancer cells, and its IC50 is well defined in the literature, the chloroquine cytotoxic several
several
times in
times ineffect
breast
breast wascancer cells, and
only evaluated
cancer cells, and itsIC
byits
MTT ICassay is well
50 is
50 wellfor
and defined in the
a range in
defined of the literature,
literature,
concentrations the chloroquine
between
the chloroquine
16 and 256 µM, cytotoxic
cytotoxic
effectwas
effect wasi.e.,only
tested
only for concentrations
evaluated
evaluated by MTT
by MTTaround
assayitsand
assay IC50for
and value
for described
aa range
range of in the literature (64between
of concentrations
concentrations µM) [50] 16
between (Figure
and3). 256 µM,
i.e.,tested
i.e., testedfor forconcentrations
concentrationsaroundarounditsitsICIC5050 value
value described
described in in the
the literature
literature (64
(64 µM)
µM) [50]
[50] (Figure
(Figure3).
3).
(% of control)
Cell viability
(% of control)
Cell viability
Figure 3. Effect of chloroquine in the cell viability of MCF-7 cells. Cells were cultured in the presence
of increasing concentrations of chloroquine. After 48 h, MTT assay was performed to measured
Figure 3. Effect of chloroquine in the cell viability of MCF-7 cells. Cells were cultured in the presence
cellular viability. Values are expressed in percentage and represent means ± SEM. Each experiment
of increasing concentrations of chloroquine. After 48 h, MTT assay was performed to measured cellular
was done three times independently (n = 3); **** statistically significant vs. control at p < 0.0001.
viability. Values are expressed in percentage and represent means ± SEM. Each experiment was done
Figure 3. Effect of chloroquine in the cell viability of MCF-7 cells. Cells were cultured in the presence
three times independently (n = 3); **** statistically significant vs. control at p < 0.0001.
of increasing concentrations of chloroquine. After 48 h, MTT assay was performed to measured
cellular
The viability.
cells were Values
then are expressed
treated within increasing
percentage and represent means
concentrations of± SEM.
each Each experimentdrug
antimalarial
was done three times independently (n = 3); **** statistically significant vs. control at p < 0.0001.
(mefloquine, tafenoquine, 6-methoxy-nitroquinoline, pyronaridine, primaquine. and sitamaquine),
starting from 1 µM to 100 µM to evaluate cell viability and cellular protein content after 48 h treatment,
by MTT and SRB assays, respectively. These antimalarial drugs were grouped and chosen because
they share a common structural feature: A quinolinic ring (1–7, Scheme 1). Based on the MTT assay,
cytotoxic effects of mefloquine (Figure 4A) were significant even in concentrations of 1 µM, with higher
concentrations causing a reduction of more than 50% of the cells (Figure 4A). SRB results show
a significant decrease in protein content inside these cells (Figure 4B). Both MTT and SRB assays for
tafenoquine treatment demonstrate a strong cytotoxic effect of this antimalarial drug in MCF-7 cells
for all concentrations tested above 10 µM (Figure 4C,D). Pyronaridine treatment also significantly
decreased cell viability, from 1 µM to 100 µM, with a pronounced effect for all concentrations above
10 µM (Figure 4E). SRB results are not significative but demonstrate the same tendency as MTT resultsBiomolecules 2020, 10, 1623 9 of 20
(Figure 4F). MCF-7 cells treated with primaquine at doses up to 10 µM for 48 h, had little effect on cell
viability and cellular protein content (Figure 4G,H). Above 50 µM, this drug caused a reduction of
more than 50% of cell viability and protein synthesis. All concentrations showed a strong effect in
the cell viability of MCF-7 cells, with more than 50% of the cells not viable. MTT and SRB assays for
6-methoxy-nitroquinoline and sitamaquine demonstrate a lack of efficacy of these antimalarial drugs
on the reduction of2020,
Biomolecules cell10,viability
x FOR PEERand protein content (Figure S1).
REVIEW 10 of 22
Figure 4. Effects
Figure of someofantimalarial
4. Effects quinolinic
some antimalarial quinolinicderivates
derivates ononMCF-7
MCF-7 cells.
cells. (A) Effect
(A) Effect of mefloquine
of mefloquine in in
cell viabilitycell
andviability and (B) protein
(B) protein content.
content. (C) (C) Effect
Effect ofoftafenoquine
tafenoquine inin cellcell
viability and (D)
viability and protein
(D) content.
protein content.
(E) Effect of(E)pyronaridine
Effect of pyronaridine in cell viability and (F) protein content. (G) Effect of primaquine in cell
in cell viability and (F) protein content. (G) Effect of primaquine in cell
viability and (H) protein content. Cells were cultured in the presence of increasing concentrations of
viability and (H) protein content. Cells were cultured in the presence of increasing concentrations of
each drug. After 48 h MTT and SRB assays were performed to measured cellular viability as well as
each drug. protein
After 48 h MTT
content. andare
Values SRB assaysinwere
expressed performed
percentage to measured
and represent cellular
means ± SEM. Eachviability
experimentas well as
protein content.
was doneValuesthreeare expressed
times in percentage
independently (n = 3); * and represent
statistically meansvs.±control
significant SEM. Eachat pBiomolecules 2020, 10, x FOR PEER REVIEW 11 of 22
Biomolecules 2020, 10, 1623 10 of 20
3.3. Effect of Antimalarial Non-quinolinic Derivates as Single Agents on MCF-7 Cellular Viability
3.3. Effect
We ofalso
Antimalarial
evaluatedNon-Quinolinic
the cytotoxicDerivates
potentialas of
Single Agents
several on MCF-7 Cellular
antimalarial Viability derivates,
non-quinolinic
namely
We alsoartesunate, lumefantrine,
evaluated the cytotoxiccycloguanil
potentialandof atovaquone. The cellsnon-quinolinic
several antimalarial were treated asderivates,
previous
described.
namely Based onlumefantrine,
artesunate, MTT and SRBcycloguanil
results, cytotoxic (Figure 5A) and
and atovaquone. The protein synthesis
cells were treatedeffects (Figure
as previous
5B) of cycloguanil were significant for concentrations above 10 µM, but the effect
described. Based on MTT and SRB results, cytotoxic (Figure 5A) and protein synthesis effects (Figure 5B) was less
of cycloguanil were significant for concentrations above 10 µM, but the effect was less pronounceda
pronounced than the previous family of antimalarial drugs. Artesunate treatment demonstrated
higher
than the reduction in cell of
previous family viability (Figure
antimalarial 5C), in
drugs. concentrations
Artesunate above
treatment 10 µM, to aahigher
demonstrated higherextent than
reduction
cycloguanil, with a reduction of more than 50% of cell viability in concentrations
in cell viability (Figure 5C), in concentrations above 10 µM, to a higher extent than cycloguanil, of 50 µM or more.
SRBaresults
with for of
reduction artesunate
more thantreatment are
50% of cell similarintoconcentrations
viability those obtained of by the or
50 µM MTT assay
more. SRB(Figure
results 5D).
for
Neither atovaquone
artesunate treatment arenor lumefantrine
similar demonstrate
to those obtained by thegood
MTTefficacy against
assay (Figure MCF-7
5D). Neithercells, both in MTT
atovaquone nor
and SRB assays
lumefantrine (Figure S2).
demonstrate good efficacy against MCF-7 cells, both in MTT and SRB assays (Figure S2).
Figure 5. Effects of some antimalarial non-quinolinic derivates on MCF-7 cells. (A) Effect of cycloguanil
Figure 5. Effects of some antimalarial non-quinolinic derivates on MCF-7 cells. (A) Effect of
in cell viability and (B) protein content. (C) Effect of artesunate in cell viability and (D) protein content.
cycloguanil in cell viability and (B) protein content. (C) Effect of artesunate in cell viability and (D)
Cells were cultured in the presence of increasing concentrations of each drug. After 48 h MTT and SRB
protein content. Cells were cultured in the presence of increasing concentrations of each drug. After
assays were performed to measured cellular viability as well as protein content. Values are expressed
48 h MTT and SRB assays were performed to measured cellular viability as well as protein content.
in percentage and represent means ± SEM. Each experiment was done three times independently
Values are expressed in percentage and represent means ± SEM. Each experiment was done three
(n = 3); * statistically significant vs. control at p < 0.05. ** statistically significant vs. control at p < 0.01.
times independently (n = 3); * statistically significant vs. control at p < 0.05. ** statistically significant
*** statistically significant vs. control at p < 0.001. **** statistically significant vs. control at p < 0.0001.
vs. control at p < 0.01. *** statistically significant vs. control at p < 0.001. **** statistically significant vs.
controlonatthe
Based p < 0.0001.
results obtained in the MTT assay, we estimated the IC for both DOX and PTX in
50
MCF-7 cells. The dose-response graph estimates the IC50 for DOX and PTX to be about 0.2 µM and
Based on the results obtained in the MTT assay, we estimated the IC50 for both DOX and PTX in
3 nM, respectively (Figure S3). Given the high antitumor activity of these drugs at very low doses,
MCF-7 cells. The dose-response graph estimates the IC50 for DOX and PTX to be about 0.2 µM and 3
these antineoplastics were considered good candidates for the combination with antimalarial drugs.
nM, respectively (Figure S3). Given the high antitumor activity of these drugs at very low doses, these
After finding the most promising antimalarial drugs, based on the previous MTT and SRB
antineoplastics were considered good candidates for the combination with antimalarial drugs.
results, we evaluated the IC50 for each drug to further use in combination with DOX and PTX. At this
After finding the most promising antimalarial drugs, based on the previous MTT and SRB
stage, the most promising antimalarials were mefloquine, tafenoquine, primaquine, pyronaridine,
results, we evaluated the IC50 for each drug to further use in combination with DOX and PTX. At this
chloroquine, artesunate, and cycloguanil. The first five are antimalarial quinolinic derivates and the
stage, the most promising antimalarials were mefloquine, tafenoquine, primaquine, pyronaridine,
last two are non-quinolinic derivatives. MTT-based dose-response curves are shown in Figure S4.
chloroquine, artesunate, and cycloguanil. The first five are antimalarial quinolinic derivates and the
Treatment with pyronaridine for 48 h resulted in the higher reduction of viable cells, with an IC50
last two are non-quinolinic derivatives. MTT-based dose-response curves are shown in Figure S4.
of about 1.5 µM. Mefloquine, pyronaridine, and tafenoquine presented an IC50 lesser than 10 µM,
Treatment with pyronaridine for 48 h resulted in the higher reduction of viable cells, with an IC50 of
with an IC50 around 1 µM, 1.5 µM, and 3 µM, respectively. Artesunate showed less cytotoxic activity
about 1.5 µM. Mefloquine, pyronaridine, and tafenoquine presented an IC50 lesser than 10 µM, withBiomolecules 2020, 10, x FOR PEER REVIEW 12 of 22
an IC50 around
Biomolecules 1 1623
2020, 10, µM,
1.5 µM, and 3 µM, respectively. Artesunate showed less cytotoxic activity 11 than
of 20
tafenoquine, with an IC50 around 12 µM. Both cycloguanil and primaquine presented less ability than
other antimalarial drugs to decrease cell viability of MCF-7 cells, which resulted in higher IC50.
than tafenoquine,
Cycloguanil with an IC50IC
and primaquine around
50 were12 µM. Both
around 20 µMcycloguanil
and 30 µM, and primaquineInpresented
respectively. general, thelessselected
ability
than
antimalarials showed great activity in reducing the cell viability of breast cancer cells, with veryIC
other antimalarial drugs to decrease cell viability of MCF-7 cells, which resulted in higher 50 .
low
Cycloguanil and primaquine
IC50. These results demonstrateIC50antimalarial
were arounddrugs
20 µMare and 30 µM,
good respectively.
candidates for useIn in
general, the selected
combination with
antimalarials showed great activity in reducing the cell viability of breast cancer
PTX and DOX. Table 1 summarizes the IC50 of all drugs used in the further combinations. cells, with very low
IC50 . These results demonstrate antimalarial drugs are good candidates for use in combination with
PTX and DOX.
Table Table 1 summarizes
1. Cytotoxicity of DOX/PTX the ICsome
and 50 of all drugs used
antimalarials in in the further
MCF-7 combinations.
breast cancer cells. IC50 values
are given as mean.
Table 1. Cytotoxicity of DOX/PTX and some antimalarials in MCF-7 breast cancer cells. IC50 values are
given as mean. Drug IC50/µM
DOX 0.1699 ± 0.0924
Drug PTX 0.003 ± IC 50 /µM
0.0001
DOX
Mefloquine 0.1699
1.241 ± 0.0924
± 0.064
PTX
Tafenoquine ±
2.595 ± 0.0600.0001
0.003
Mefloquine 1.241 ± 0.064
Primaquine 29.90 ± 0.02
Tafenoquine 2.595 ± 0.060
Pyronaridine
Primaquine 1.388 29.90
± 0.216
± 0.02
Artesunate
Pyronaridine 11.601.388
± 0.04
± 0.216
Artesunate
Cycloguanil 20.3011.60
± 0.08± 0.04
Cycloguanil 20.30 ± 0.08
3.4. Effect of Various Combinations of DOX and Different Antimalarials in MCF-7 Cells
3.4. Effect of Various Combinations of DOX and Different Antimalarials in MCF-7 Cells
After finding the best candidates for repurposing in breast cancer therapy and their
After finding
corresponding the
IC50 best
, we candidates
designed for repurposing
a model of combination in breast cancerby
consisting therapy and their corresponding
one antineoplastic drug, DOX
IC
and , we designed a model of combination consisting by one antineoplastic
50 each antimalarial drug. MCF-7 cells were treated with the two drugs alone and combined drug, DOX and each
in a
antimalarial
fixed ratio, in drug. MCF-7 cells were
the concentrations treated
of 0.25 × ICwith
50, 0.5the
× ICtwo drugs
50, IC 50, 2 alone
× IC50,and
andcombined
4 × IC50 asin a fixed ratio,
represented in
in the concentrations
Figure 6. We evaluated × IC
of 0.25the 50 , 0.5 × IC50 ,of
combinations IC50 , 2 × +ICArtesunate,
DOX 50 , and 4 × ICDOX50 as represented
+ Mefloquine,in Figure
DOX 6.+
We evaluated DOX
Tafenoquine, the combinations
+ Pyronaridine, of and
DOXDOX + Artesunate,
+ cycloguanil DOX by + Mefloquine,
MTT assay. As DOX + Tafenoquine,
chloroquine has been
DOX
widely + tested
Pyronaridine,
in severalandcell
DOX + cycloguanil
lines, by MTTthe
we also included assay. As chloroquine
combination of DOX has+ been widely tested
chloroquine in this
in several cell lines, we also included the
study, with the IC50 based on the literature [50]. combination of DOX + chloroquine in this study, with the
IC50 based on the literature [50].
Figure 6.6. Representation
Figure Representation of of the
the design
design of of the
thecombination
combinationexperiences.
experiences. DrugDrug 11 corresponds
corresponds toto the
the
antineoplastic
antineoplastic agent agent and and Drug
Drug 22 corresponds
corresponds to to antimalarial
antimalarial drugs.
drugs. Cells
Cells were
were treated
treated with
with Drug
Drug 11
and
and Drug
Drug 22 alone and in combination combination in inaafixed
fixedration
rationfor
for48
48h,h,ininthe
theconcentrations
concentrationsofof 0.25
0.25 × 50
× IC IC 50 ,
, 0.5
0.5
× IC×50IC
, IC
50 ,
50 IC
, 2 ×
50 , 2
IC ×
50 , IC
and
50 ,4and
× IC 4 ×
50 . IC 50 .
When
When tested
tested alone,
alone, and
and in
in line
line with
with the
the previous
previous results,
results, mefloquine
mefloquine and
and chloroquine
chloroquine treatment
treatment
resulted
resulted in higher cytotoxic activity, with significant decrease of cell viability, mainly
in higher cytotoxic activity, with significant decrease of cell viability, mainly for
for the
the
concentrations of IC and half of their IC
concentrations of IC5050and half of their IC50, 50 with better results than DOX alone. When tested tested
, with better results than DOX alone. When for 2 ×
for 2 × IC50 , almost all drugs displayed great anti-cancer activity, with the exception of cycloguanilBiomolecules 2020, 10, x FOR PEER REVIEW 13 of 22
Biomolecules 2020, 10, 1623 12 of 20
IC50, almost all drugs displayed great anti-cancer activity, with the exception of cycloguanil (Figure
(FigureWhen
7A). combined
7A). When with with
combined DOXDOX and and
comparing to DOX
comparing to DOXalone, almost
alone, almostallall
combinations
combinationsresulted
resultedin
inenhanced
enhancedanti-cancer
anti-cancereffects,
effects, with
with DOXDOX ++ mefloquine
mefloquine and and DOX
DOX ++ chloroquine
chloroquine being
beingthethemost
most
promising combinations for the concentration of IC , which is in line with the results
promising combinations for the concentration of IC50 , which is in line with the results for each drug
50 for each drug
alone. Combinations of DOX + artesunate and DOX + pyronaridine also resulted
alone. Combinations of DOX + artesunate and DOX + pyronaridine also resulted in less viable MCF-7 in less viable MCF-
7 cells
cells than than DOX but
DOX alone, alone,
to a but
lessertoextent
a lesser
than extent than combinations
the previous the previous(Figure
combinations (Figure 7B).
7B). Combination of
Combination of DOX + artesunate, DOX + pyronaridine, and DOX + chloroquine
DOX + artesunate, DOX + pyronaridine, and DOX + chloroquine in concentrations below the IC50 of in concentrations
below
each drugtheresulted
IC50 of each drug resulted
in significant in significant
decreases decreases
of cell viability of cell viability
compared compared to DOX alone.
to DOX alone.
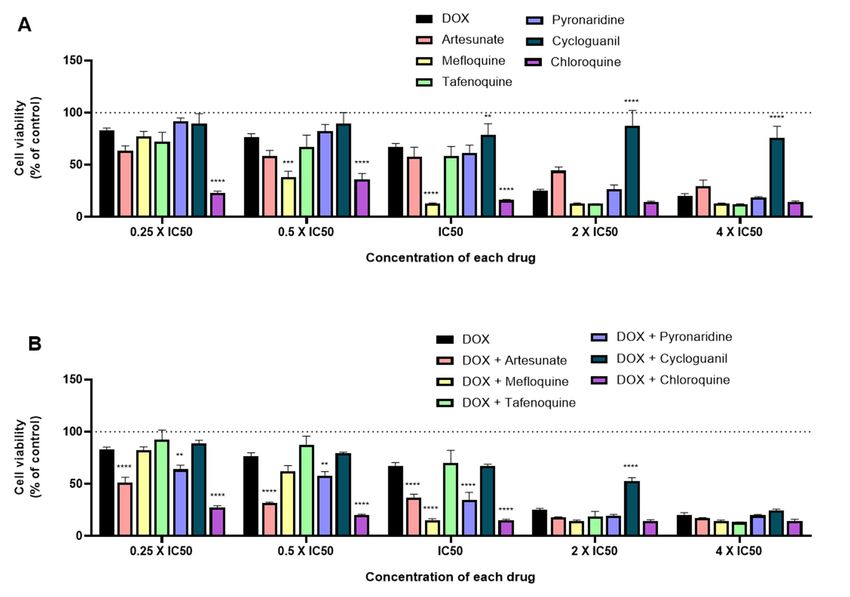
Figure 7. Growth inhibition of MCF-7 cells after 48 h of single drug (A) and combination therapy
(B) exposure. Cells were exposed to concentrations of each drug of 0.25, 0.5, 1, 2, and 4 times their IC50
Figure 7. Growth inhibition of MCF-7 cells after 48 h of single drug (A) and combination therapy (B)
and cell viability was evaluated by MTT assay. The drugs in combination were co-administered at the
exposure. Cells were exposed to concentrations of each drug of 0.25, 0.5, 1, 2, and 4 times their IC50
same time. Values are expressed in percentage in relation to DOX activity and represent means ± SEM.
and cell viability was evaluated by MTT assay. The drugs in combination were co-administered at the
Each experiment was done three times independently (n = 3); ** statistically significant vs. control at
same time. Values are expressed in percentage in relation to DOX activity and represent means ± SEM.
p < 0.01. *** statistically significant vs. control at p < 0.001. **** statistically significant vs. control at
Each experiment was done three times independently (n = 3); ** statistically significant vs. control at
p < 0.0001.
p < 0.01. *** statistically significant vs. control at p < 0.001. **** statistically significant vs. control at p <
3.5. Effect of Various Combinations of PTX and Different Antimalarials in MCF-7 Cells
0.0001.
To evaluate the influence of the antineoplastic agent, we evaluated the same antimalarial drugs
3.5. Effect of Various Combinations of PTX and Different Antimalarials in MCF-7 Cells
with PTX. Drugs were also tested in MCF-7 cells both alone and combined in the concentrations of
0.25 × IC To50evaluate
, 0.5 × ICthe influence of the antineoplastic agent, we evaluated the same antimalarial drugs
50 , IC50 , 2 × IC50 , and 4 × IC50 for 48 h. Cell viability was measured by the MTT assay.
with PTX. to
Comparing Drugs
DOX, were
PTXalso tested in MCF-7
demonstrated a highercells both alone
efficacy and combined
in decreasing in the concentrations
cell viability, which resultedof
0.25 × IC
in a lower IC50 of around 3 nM, comparing to 0.1 µM for DOX (Figure 8A). Although the
50 , 0.5 × IC 50 , IC50 , 2 × IC 50 , and 4 × IC50 for 48 h. Cell viability was measured by MTT
it has assay.
a lower
Comparing to DOX, PTX demonstrated a higher efficacy in decreasing cell viability,
IC50 , when tested alone for all concentrations, this drug does not affect MCF-7 cell viability to a larger which resulted
in a lower
extent than DOX.IC50 ofWhen
around 3 nM, comparing
compared to 0.1 µM
to PTX activity, for DOX
mainly (Figure
for higher 8A).(2
doses Although
× IC50 and it has
4 ×aIClower
50 ),
IC , when tested alone for all concentrations, this drug does not affect MCF-7
almost all antimalarial drugs demonstrate significant anti-cancer activity, with mefloquine, tafenoquine,
50 cell viability to a larger
extent
and than DOX.
chloroquine When
having thecompared
best profiles to PTX activity,
for further mainly for(Figure
combination higher8B).
doses (2 × IC
Indeed, 50 and
when 4 × IC50),
combined
almost
with PTX all antimalarial
in higher doses (2drugs × IC50 demonstrate
and 4 × IC50 ), significant anti-cancer
all antimalarials resultedactivity, with mefloquine,
in a significant reduction
oftafenoquine,
viable cells,and withchloroquine
the exception having the best profiles
of cycloguanil. for further
For lower doses,combination
the combinations(Figureof8B).
PTXIndeed,
with
when combined
artesunate, with and
mefloquine, PTXcycloguanil
in higher doses are the(2most
× ICpromising
50 and 4 ×ones.
IC50),Comparing
all antimalarials resulted
antimalarial in a
drugs
combinations with DOX and PTX, the last ones seem to be most effective for breast cancer therapy. the
significant reduction of viable cells, with the exception of cycloguanil. For lower doses,
combinations of PTX with artesunate, mefloquine, and cycloguanil are the most promising ones.Biomolecules 2020, 10, x FOR PEER REVIEW 14 of 22
Comparing antimalarial drugs combinations with DOX and PTX, the last ones seem to be most
Biomolecules 2020, 10, 1623 13 of 20
effective for breast cancer therapy.
8. Growth
FigureFigure inhibition
8. Growth of of
inhibition MCF-7
MCF-7cells
cells after
after 4848hhofofsingle
singledrugdrug(A) (A)
and and combination
combination therapytherapy
(B)
(B) exposure.
exposure. Cells were
Cells wereexposed
exposedto toconcentrations
concentrations of ofeach
eachdrug
drugofof0.25,
0.25,0.5,
0.5,
1, 1,
2, 2,
andand 4 times
4 times theirtheir
IC50IC50
and cell viability
and was evaluated
cell viability was evaluatedby MTT
by MTT assay. The
assay. Thedrugs
drugsin in combination
combination were wereco-administered
co-administered at the
at the
same time. Values
same time. are expressed
Values in percentage
are expressed in percentage ininrelation
relationtoto PTX activityand
PTX activity andrepresent
represent means
means ± SEM.
± SEM.
Each experiment
Each experiment was wasdone done three
three times
times independently (n
independently (n =
= 3);
3);* *statistically
statisticallysignificant
significantvs. control at p at
vs. control
p < 0.05.
< 0.05.
** ** statisticallysignificant
statistically significant vs.
vs.control at pat
control p < ***
< 0.01. statistically
0.01. significant
*** statistically vs. control at
significant vs.pYou can also read