Ephrin A4 ephrin receptor A10 signaling promotes cell migration and spheroid formation by upregulating NANOG expression in oral squamous cell ...
←
→
Page content transcription
If your browser does not render page correctly, please read the page content below
www.nature.com/scientificreports

                OPEN             Ephrin A4‑ephrin receptor
                                 A10 signaling promotes cell
                                 migration and spheroid formation
                                 by upregulating NANOG expression
                                 in oral squamous cell carcinoma
                                 cells
                                 Yu‑Lin Chen1, Yi‑Chen Yen1, Chuan‑Wei Jang1, Ssu‑Han Wang1, Hsin‑Ting Huang1,
                                 Chung‑Hsing Chen2,3, Jenn‑Ren Hsiao4, Jang‑Yang Chang1 & Ya‑Wen Chen1,5*

                                 Ephrin type-A receptor 10 (EPHA10) has been implicated as a potential target for breast and prostate
                                 cancer therapy. However, its involvement in oral squamous cell carcinoma (OSCC) remains unclear. We
                                 demonstrated that EPHA10 supports in vivo tumor growth and lymphatic metastasis of OSCC cells.
                                 OSCC cell migration, epithelial mesenchymal transition (EMT), and sphere formation were found to
                                 be regulated by EPHA10, and EPHA10 was found to drive expression of some EMT- and stemness-
                                 associated transcription factors. Among EPHA10 ligands, exogenous ephrin A4 (EFNA4) induced
                                 the most OSCC cell migration and sphere formation, as well as up-regulation of SNAIL, NANOG, and
                                 OCT4. These effects were abolished by extracellular signal-regulated kinase (ERK) inhibition and
                                 NANOG knockdown. Also, EPHA10 was required for EFNA4-induced cell migration, sphere formation,
                                 and expression of NANOG and OCT4 mRNA. Our microarray dataset revealed that EFNA4 mRNA
                                 expression was associated with expression of NANOG and OCT4 mRNA, and OSCC patients showing
                                 high co-expression of EFNA4 with NANOG or OCT4 mRNA demonstrated poor recurrence-free
                                 survival rates. Targeting forward signaling of the EFNA4-EPHA10 axis may be a promising therapeutic
                                 approach for oral malignancies, and the combination of EFNA4 mRNA and downstream gene
                                 expression may be a useful prognostic biomarker for OSCC.

                                 Abbreviations
                                 CFSE	Carboxyfluorescein succinimidyl ester
                                 CSCs	Cancer stem-like cells
                                 EFNA3	Ephrin A3
                                 EFNA4	Ephrin A4
                                 EFNA5	Ephrin A5
                                 EMT	Epithelial–mesenchymal transition
                                 EPHA2	Ephrin type-A receptor 2
                                 EPHA10	Ephrin type-A receptor 10
                                 ERK	Extracellular signal-regulated kinase
                                 FACS	Fluorescence activated cell sorting
                                 IHC	Immunohistochemistry
                                 HNSCC	Head and neck squamous cell carcinoma

                                 1
                                  National Institute of Cancer Research, National Health Research Institutes, 35 Keyan Road, Zhunan Town, Miaoli
                                 County 35053, Taiwan. 2Institute of Population Health Sciences, National Health Research Institutes, Miaoli,
                                 Taiwan. 3Taiwan Bioinformatics Core, National Health Research Institutes, Miaoli, Taiwan. 4Department of
                                 Otolaryngology, National Cheng Kung University Hospital, College of Medicine, National Cheng Kung University,
                                 Tainan, Taiwan. 5Ph.D. Program for Aging, Graduate Institute of Biomedical Sciences, China Medical University,
                                 Taichung, Taiwan. *email: ywc@nhri.org.tw

Scientific Reports |   (2021) 11:644                | https://doi.org/10.1038/s41598-020-80060-3                                              1

                                                                                                                                         Vol.:(0123456789)
www.nature.com/scientificreports/
H&E Hematoxylin and eosin
OCT4 Octamer-binding transcription factor 4
OSCC Oral squamous cell carcinoma
PI Propidium iodide
qRT-PCR Quantitative reverse transcription-polymerase chain reaction
Head and neck squamous cell carcinoma (HNSCC) includes a group of tumors arising in the oral cavity, oro-
pharynx, and larynx. Oral squamous cell carcinoma (OSCC), a subset of HNSCC, accounts for over 90% of all
malignancies in the oral cavity. Most deaths from OSCC involve local recurrence at the primary site and regional
recurrence at sites of peripheral lymph node m etastasis1,2. The overall 5-year survival rate of OSCC patients
remains low. Understanding the pathophysiology of oral tumorigenesis is important for identifying effective
therapeutic targets.
Epithelial–mesenchymal transition (EMT) is a process in which cells lose their epithelial-specific character-
istics, including cell polarity and cellular adhesion, and acquire migratory and invasive c apabilities3,4. Although
EMT is essential to normal development, EMT in tumors is associated with increased aggressiveness and poor
prognosis, emphasizing EMT as a mechanistic role for tumor progression and metastasis4,5. Decreased E-cadherin
and increased vimentin/N-cadherin expression are conventional EMT markers6,7. Additionally, the transcription
factors Snail, Slug, Twist and zinc finger E-box-binding homeobox 1/2 (ZEB1/2) have been shown to modify
EMT by reducing epithelial marker expression4. Cancer stem-like cells (CSCs) are converted from non-CSCs by
activation of EMT p rogramming8,9. CSCs are a group of highly tumorigenic cells that can self-renew and differ-
entiate into heterogenous progeny. CSCs have been identified in an array of solid and hematological cancer types.
Transcription factors such as Kruppel-like factor 4 (KLF4), sex determining region Y-box 2 (SOX2), octamer-
binding transcription factor 4 (OCT4), and NANOG are required for maintenance of stemness in C SCs10. CSCs
play significant roles in tumor metastasis and recurrence, which are common causes of the high morbidity of
oral cancer11. However, little is known about the regulatory mechanisms of EMT and CSCs in OSCC.
The ephrin (Eph) receptor and its ligands, ephrins, regulate development and tissue homeostasis. Ephrins
are attached to the cell membrane by either a glycosylphosphatidylinositol anchor (A-type) or by a membrane-
spanning protein domain (B-type). Their receptors are also divided into A and B classes based on gene sequence
similarity and the binding of ephrin A or B ligands. Ephrin-Eph receptor binding leads to bidirectional signaling
via transcellular interaction12–14. In contrast, cis-interactions between molecules on the same cell attenuate Eph
receptor signaling, possibly by inhibiting the formation of Eph receptor clusters14,15. Eph receptor “forward”
signaling depends on the tyrosine kinase domain, which is responsible for autophosphorylation, phosphorylation
of other proteins, and associations with various effector p roteins16. The Eph receptor and ephrins are also able to
mediate cell signaling in the absence of Eph receptor kinase activity. Ephrin type-A receptor 10 (EPHA10) and
ephrin B receptor 6 have critical functions under normal and pathological conditions, but lack the amino acid
residues required for kinase a ctivity16. “Reverse” signaling in ephrin-expressing cells has been explored less than
Eph receptor forward signaling. There is a scarcity of knowledge of the function and mechanisms that medi-
ate ephrin type A signaling, specifically, as members of this subclass of molecules lack a cytoplasmic signaling
domain13. The biological functions induced by Eph receptor activation are diverse and cell-type specific. They
regulate a variety of physiological and developmental processes, and have been implicated in both anti- and
pro-tumorigenic activities in different cancer t ypes12,17,18.
Eph receptors are associated with the development of mesenchymal-like characteristics and inhibition of
epithelial-like phenotypes19. Recently, EPHA10 was shown to be overexpressed in breast cancer tissues, and the
levels of EPHA10 mRNA and protein were significantly correlated with lymph node metastasis, cancer stage,
and tumor p rogression20,21. Targeting EPHA10 by anti-EPHA10 monoclonal antibodies significantly suppressed
tumor growth in xenograft mouse models of triple-negative breast c ancers22. However, the underlying mecha-
nisms of EPHA10-mediated tumorigenesis, EMT, and CSC induction in OSCC remain unclear. Therefore, we
investigated the role of EPHA10 in regulating tumor growth and lymph node metastasis of OSCC cells and
demonstrated that forward signaling mediated by the EFNA4-EPHA10 axis modulates cell migration and sphere
formation, as well as up-regulation of the transcription factors NANOG and OCT4 via ERK activation. Addition-
ally, EFNA4 mRNA expression was positively correlated with that of NANOG or OCT4, and high co-expression
of EFNA4 with NANOG or OCT4 was associated with poor recurrence-free survival in OSCC patients.
Results
EPHA10 knockdown reduced tumorigenesis and lymph node metastasis of OSCC cells. To
assess EPHA10 expression in different cancer types, we searched for data on EPHA10 expression in datasets
from the Oncomine database23. We surveyed 4 datasets from breast, esophageal, and lung cancers and found sig-
nificantly higher expression of EPHA10 in cancer versus normal tissue. In contrast, 7 datasets showed markedly
lower EPHA10 expression in colorectal, brain, and central nervous system cancers compared to site-matched
normal tissue (Fig. 1A). However, EPHA10 expression was not significantly different when comparing data from
cancer and normal tissue in available HNSCC datasets. To investigate EPHA10 protein expression, we examined
OSCC cells, a subset of HNSCC, and found variable levels of EPHA10 protein, ranging from 0.69- to 2.12-fold,
in the dysplastic oral keratinocyte (DOK) and OSCC cell lines compared with human oral keratinocytes (HOKs;
Fig. 1B). We also found slightly higher expression of EPHA10 in LN1-1 cells, an OSCC cell line (in vivo OEC-M1
cell derivation) with high activities of tumor growth and lymphatic metastasis24, compared to parental OEC-M1
cells (Fig. 1B).
To evaluate the effects of EPHA10 on OSCC tumor growth and lymphatic metastasis, we ablated EPHA10
expression in LN1-1 cells using lentiviral shRNA. We confirmed EPHA10 knockdown in LN1-1 cells by
Scientific Reports | (2021) 11:644 | https://doi.org/10.1038/s41598-020-80060-3 2
Vol:.(1234567890)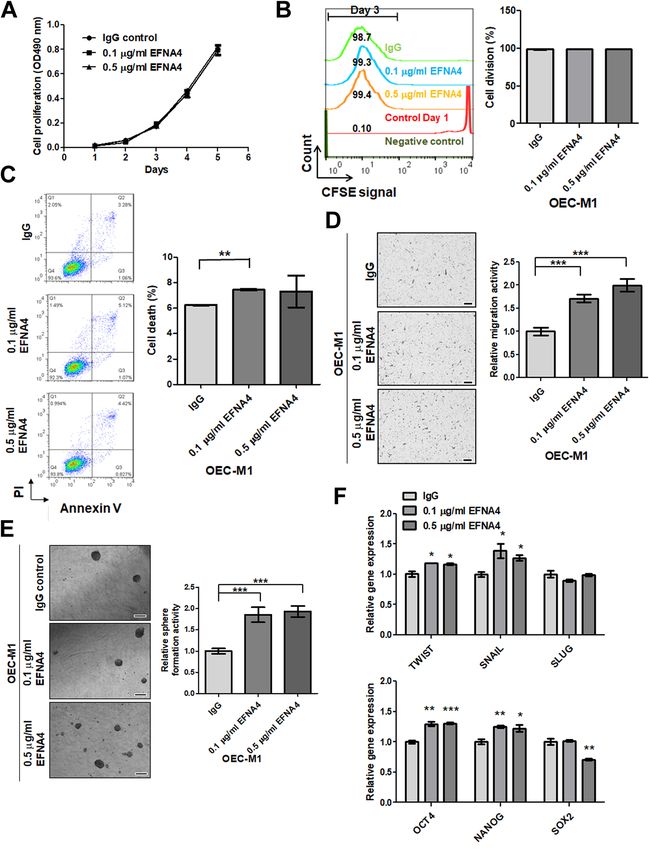
www.nature.com/scientificreports/

                                 Figure 1.  EPHA10 is required for tumorigenesis and metastasis of OSCC cells. (A) Expression of EPHA10 in
                                 20 types of cancer versus corresponding normal tissues using the Oncomine database with the threshold of
                                 fold change ≥ 2, p ≤ 10–4, and gene rank ≥ top 10%. Red and blue, respectively, indicate the numbers of datasets
                                 with statistically significant increases and decreases in EPHA10 gene expression. (B) EPHA10 expression in
                                 human oral keratinocytes (HOK), immortalized dysplastic oral keratinocytes (DOK), and 7 OSCC cell lines
                                 was examined by western blotting. Protein levels were normalized to an internal control (α-tubulin). Relative
                                 ratios were determined by dividing the EPHA10 protein level in each cell type by that in HOK cells. (C)
                                 EPHA10 protein levels in LN1-1 cells expressing EPHA10-specific shRNA and vector control (pLKO-GFP)
                                 were determined by western blot. Protein levels were normalized to α-tubulin. Relative ratios were determined
                                 by dividing the EPHA10 protein level in each expression variant by that in the pLKO-GFP vector-expressing
                                 cells. (D) EPHA10 protein levels in LN1-1 cells expressing pLKO-GFP (green line), sh3 (dark green line), and
                                 sh5 (pink line) were determined by fluorescence activated cell sorting (FACS). Relative EPHA10 expression was
                                 determined by dividing the fluorescent intensity in each expression variant by that in the pLKO-GFP vector-
                                 expressing cells. (E) Tumor weights and volumes in mice orthotopically injected with LN1-1 pLKO-GFP (n = 9)
                                 or EPHA10 sh3 cells (n = 8). (F) Ki-67 expression by immunohistochemistry (IHC) in LN1-1 pLKO-GFP
                                 (n = 9) and EPHA10 sh3 tumors (n = 7). Left: Representative fields of IHC stained sections. Scale bars, 20 μm.
                                 Right: The percentages of Ki-67-positive cells per field were calculated for each group. Error bars represent SE;
                                 *p < 0.05; ***p < 0.001.

Scientific Reports |   (2021) 11:644 |                https://doi.org/10.1038/s41598-020-80060-3                                                 3

                                                                                                                                            Vol.:(0123456789)
www.nature.com/scientificreports/
Groups Tumors/no of mice Tumorigenesis (%) Metastasis/no of mice Metastasis (%)
LN1-1 pLKO-GFP 9/9 100 6/9 67
LN1-1 EPHA10 sh3 8/8 100 0/8 0
Table 1. Tumor formation and spontaneous lymph node metastases in mice injected with oral squamous cell
carcinoma (OSCC) cells expressing EPHA10 shRNA or the vector control.
immunoblot and flow cytometry (Fig. 1C,D). We performed oral cavity inoculation of immunodeficient nude
mice with EPHA10 knockdown and control cells. Tumors developed in all animals regardless of EPHA10 level
(Table 1). The average tumor weight was 0.2278 ± 0.03017 g (n = 9) and 0.0475 ± 0.01191 g (n = 8) in mice receiving
control cells and EPHA10 knockdown LN1-1 cells, respectively (Fig. 1E). Similarly, EPHA10 knockdown led to
significantly lower tumor volume compared to controls (Figs. 1E, S1A). There were consistently, fewer Ki-67-pos-
itive cells in EPHA10 sh3 orthotopic tumors (16.63 ± 2.247%, n = 7) compared to controls (27.46 ± 3.597%, n = 9;
Fig. 1F). Additionally, 67% (n = 9) of the animals injected with control cells developed lymph node metastases
compared to none of the EPHA10 sh3 injected animals (0%, n = 8), as assessed by examination of H&E-stained
cervical lymph nodes for evidence of tumor formation (Fig. S1B, Table 1). Quantification of LYVE-1-positive
areas demonstrated reduced intratumoral lymphatics in tumors of mice injected with EPHA10 sh3 (0.9656 ± 0.139
vessels/field per specimen, n = 8) compared to those injected with parental LN1-1 cells (2.225 ± 0.454 vessels/
field per specimen, n = 9; Fig. S1C). These results indicate that EPHA10 is important for OSCC tumor growth
and lymph node metastasis.
Manipulation of EPHA10 levels altered OSCC cell properties. Knockdown of EPHA10 in LN1-1
cells showed no difference in cell proliferation compared with cells expressing the vector control (Fig. S1D). In
contrast, knockdown of EPHA10 diminished the migration potential of LN1-1 cells, as indicated via transwell
assay, compared to corresponding controls (Fig. S1E). LN1-1 cells expressing EPHA10 sh5 were used to confirm
the inhibitory effects of EPHA10 knockdown on cell migration (Fig. 2A). Phase contrast microscopy revealed
obvious morphological differences in EPHA10 knockdown versus control cells; EPHA10 knockdown cells had
a predominately polygonal shape, while the control cells showed fibroblastic morphology (Fig. 2B). In addition,
immunoblot analysis showed that EPHA10 knockdown led to differential expression of epithelial proteins, such
as α-catenin, E-cadherin, and β-catenin, as well as the mesenchymal protein vimentin (Fig. 2C). Sphere forma-
tion is an efficient way to assess the properties of CSCs in vitro25, and cells with EPHA10 knockdown showed
reduced sphere formation compared to controls (Fig. 2D). Likewise, mRNA expression of EMT- and stemness-
associated transcription factors, including TWIST, SLUG, SNAIL, OCT4, and NANOG, was diminished in
EPHA10 knockdown cells (Fig. 2E). These results suggest that EPHA10 knockdown alters OSCC cell proper-
ties, such as EMT, migration, and capacity for sphere formation, as well as expression of EMT- and stemness-
associated transcription factors.
Additionally, OEC-M1 cells with low EPHA10 expression were infected with a retroviral vector encod-
ing human EPHA10 (PB-EPHA10 cells) or an empty vector (PB cells), and ectopic EPHA10 expression was
confirmed by immunoblot (Fig. S2A). Ectopic expression of EPHA10 did not affect OEC-M1 cell growth, divi-
sion, death (Fig. S2B–D), or E-cadherin expression; however, vimentin expression was reduced (Fig. S2A).
Unexpectedly, ectopic EPHA10 expression was associated with diminished cell migration and sphere formation
(Fig. S2E,F). Furthermore, ectopic EPHA10 expression significantly decreased the expression of SNAIL, SLUG,
OCT4, and NANOG mRNA. Our data demonstrated that EPHA10 knockdown and ectopic EPHA10 expression
results in a similar phenotype in OSCC cells.
EFNA4 promoted cell migration, spheroid formation, and induction of EMT‑ and
stemness‑related transcription factors. The most high-affinity ligands for EPHA10 are ephrin-A3
(EFNA3), A4 (EFNA4), and A5 (EFNA5)26. We examined the expression of EFNA3, EFNA4, and EFNA5 in
OEC-M1 and LN1-1 cells via the GSE62326 dataset and found that EFNA3 and EFNA5 expression was unde-
tectable in both cell types. Lower EFNA4 mRNA and protein expression was found in OEC-M1 cells compared
to LN1-1 cells using microarray analysis and western blotting, respectively (Fig. S3A), therefore OEC-M1 cells
were used to investigate the effects of EPHA10 ligands on cellular functions. When exogenous EPHA10 ligands
capable of binding to the receptors and labelled with IgG-Fc tags were added to cultured cells, neither EFNA3-Fc
nor EFNA5-Fc affected OEC-M1 cell migration (Fig. S3B,C). Exogenous EFNA3-Fc enhanced tumorsphere size
distribution, while exogenous EFNA3-Fc and EFNA5-Fc had no effects on sphere formation activity compared
to controls (Fig. S3D,E). Our data suggest that exogenous EFNA3 and EFNA5 have no marked effects on migra-
tion or sphere-forming activities of OEC-M1 cells.
Exogenous EFNA4-Fc did not have a significant effect on cell growth or division (Fig. 3A,B), but there was a
small effect on cell death in OEC-M1 cells treated with low dose EFNA4 (Fig. 3C). Exogenous EFNA4 enhanced
OEC-M1 cell migration in a dose-dependent manner (Fig. 3D), an effect that was also observed with other OSCC
cells, including SAS and TW2.6 (Fig. S4A). Exogenous EFNA4-Fc significantly increased sphere-forming activ-
ity in OEC-M1 cells (Fig. 3E), and qRT-PCR analysis showed that the expression of TWIST, SNAIL, OCT4, and
NANOG mRNA was significantly elevated after addition of EFNA4-Fc to OEC-M1 cells (Fig. 3F).
Scientific Reports | (2021) 11:644 | https://doi.org/10.1038/s41598-020-80060-3 4
Vol:.(1234567890)www.nature.com/scientificreports/
Figure 2. EPHA10 influences cell migration, epithelial–mesenchymal transition, tumorsphere formation and
gene expression in LN1-1 cells. (A) Left: Representative images of migrated cells. Scale bars, 100 μm. Right:
Relative migration activity of the EPHA10 knockdown cells was calculated by normalizing the mean number
of migrated cells per field (EPHA10 sh3 and sh5, n = 10) to that of the control cells (pLKO-GFP, n = 10). (B)
Morphology of LN1-1 pLKO-GFP, EPHA10 sh3, and EPHA10 sh5 cells. Scale bars, 20 μm. (C) Immunoblot
analysis of α-catenin, β-catenin, vimentin, and E-cadherin proteins in LN1-1 cells with EPHA10 knockdown
(EPHA10 sh1–5) and the control vector (pLKO-GFP). Protein levels were normalized to α-tubulin. Relative
ratios were determined by dividing the level of the protein of interest in each expression variant by that in
the pLKO-GFP vector-expressing cells. (D) Left: Representative images of tumorspheres in LN1-1 pLKO-
GFP, EPHA10 sh3, and EPHA10 sh5 cells. Scale bars, 100 μm. Right: Relative sphere formation activity was
determined by normalizing the mean number of spheres per field for the EPHA10 sh3 and sh5 cells (n = 2) to
that of the pLKO-GFP cells (n = 2). (E) The levels of TWIST, SNAIL, SLUG, OCT4, NANOG, and SOX2 mRNA
in LN1-1 pLKO-GFP, EPHA10 sh3, and EPHA10 sh5 cells were determined by qRT-PCR. The amplifications
were first normalized to β-actin (internal control). For each gene, the relative expression in LN1-1 EPHA10 sh3
and EPHA10 sh5 cells (n = 3) was normalized to that in the LN1-1 pLKO-GFP cells (n = 3). Bars represent SE;
*p < 0.05; **p < 0.01; ***p < 0.001.
ERK inhibition abolished EFNA4‑induced cellular functions. To further characterize EFNA4-
induced forward signaling, we treated OEC-M1 cells with EFNA4-Fc, and the levels of phosphorylated forms of
focal adhesion kinase (FAK), protein kinase B (PKB/AKT), and extracellular signal-regulated kinase (ERK), as
well as non-phospho-β-catenin and integrin-linked kinase (ILK) were assayed at different time points by western
blotting (Figs. S5, 4A). EFNA4-Fc induced activation/phosphorylation of only ERK in OEC-M1 cells (Fig. 4A).
The blockage of ERK activation by PD98059, an inhibitor of mitogen-activated protein kinase (MAPK) kinase,
inhibited EFNA4-induced cell migration (Fig. 4B), spheroid formation (Fig. 4C), and expression of SNAIL,
OCT4, and NANOG mRNA (Fig. 4D). Confirmation of the effects of PD98059 on EFNA4-induced NANOG
expression is shown in Fig. 4E. Our results indicated that exogenous EFNA4-induced functional changes were
dependent on MAPK/ERK activation. To verify the role of NANOG in EFNA4-induced migration and sphere
formation, NANOG expression in OEC-M1 cells was abolished using lentiviral shRNA and confirmed by qRT-
Scientific Reports | (2021) 11:644 | https://doi.org/10.1038/s41598-020-80060-3 5
Vol.:(0123456789)www.nature.com/scientificreports/
Figure 3. Exogenous EFNA4-Fc enhanced cell migration and sphere formation of OEC-M1 cells. (A) Representative growth
curves of OEC-M1 cells treated with 0.1 or 0.5 μg/ml EFNA4-Fc (n = 4) or 0.5 μg/ml IgG control (n = 4) based on MTS assay
data. (B) Left: Representative CFSE cell division assay data from OEC-M1 cells treated with 0.1 or 0.5 μg/ml EFNA4-Fc
(n = 2) or 0.5 μg/ml IgG control (n = 2). The interval bar indicates cell division signal on day 3. Right: The percentage of the
cell population within the interval bar limits. (C) Left: Representative cell death analysis via PI/Annexin V double staining
of OEC-M1 cells treated with 0.1 or 0.5 μg/ml EFNA4-Fc (n = 2) or 0.5 μg/ml IgG control (n = 2). Right: The percentage of
cell death, including quadrants Q1, Q2, and Q3. (D) Left: Representative images of migrated cells. Scale bars, 100 μm. Right:
Relative migration activity was determined by normalizing the mean number of migrated cells per field of EFNA4-Fc treated
cells (n = 10) to that of the IgG-treated cells (n = 10). (E) Left: Representative images of tumorspheres. Scale bars, 100 μm.
Right: Sphere formation in OEC-M1 cells treated with 0.1 or 0.5 μg/ml EFNA4-Fc or 0.5 μg/ml IgG control in sphere culture.
Relative sphere formation activity in EFNA4-treated cells (n = 2) was determined by normalizing the mean number of spheres
per well to that of the IgG-treated cells (n = 2). (F) Relative levels of TWIST, SNAIL, SLUG, OCT4, NANOG, and SOX2 mRNA
in OEC-M1 cells treated with 0.1 or 0.5 μg/ml EFNA4-Fc or 0.5 μg/ml IgG as determined by qRT-PCR. The amplifications
were first normalized to β-actin (internal control). The relative mRNA expression in EFNA4-treated OEC-M1 cells (n = 3) was
then normalized to that in IgG-treated cells (n = 3). Bars represent SE. *p < 0.05; **p < 0.01; ***p < 0.001.
Scientific Reports | (2021) 11:644 | https://doi.org/10.1038/s41598-020-80060-3 6
Vol:.(1234567890)www.nature.com/scientificreports/
PCR (Fig. 4F). NANOG knockdown suppressed EFNA4-induced cell migration in OEC-M1 cells (Fig. 4G). Sim-
ilarly, EFNA4-induced sphere formation was inhibited in OEC-M1 cells with NANOG knockdown (Fig. 4H).
These data suggest that NANOG is required for EFNA4-induced cell migration and sphere formation.
EPHA10 was required for EFNA4‑induced cell migration and sphere formation. EFNA4 prefer-
entially binds to EPHA2 and E PHA1026. To determine whether EPHA2 was required for EFNA4-induced phe-
notypes, OEC-M1 cells stably transduced with EPHA2 shRNA or a control vector were established. The reduced
levels of EPHA2 protein in the knockdown cells (EPHA2 sh4 and sh5) were verified by immunoblot (Fig. 5A).
EPHA2 knockdown OEC-M1 cells were treated with EFNA4-Fc and analyzed for cell migration and sphere for-
mation. EPHA2 knockdown suppressed EFNA4-induced cell migration in OEC-M1 cells (Fig. 5B). In contrast,
EFNA4-induced sphere formation was not disrupted in OEC-M1 cells with EPHA2 knockdown, suggesting that
EPHA2 is not required for EFNA4-induced sphere formation (Fig. 5C). These data suggest that EFNA4-induced
cell migration involves signaling by EPHA2.
OEC-M1 cells with EPHA10 knockdown, confirmed by immunoblot assay (Fig. 5D), were stimulated with
EFNA4-Fc and examined for cell migration and sphere formation. EFNA4-induced cell migration and sphere
formation were inhibited by EPHA10 knockdown (Fig. 5E,F). Similarly, EFNA4-induced migration and sphere
formation was disrupted by EPHA10 knockdown in TW2.6 cells (Fig. S4C,D). These data implicate EPHA10
as a critical factor for EFNA4-enhanced cell migration and sphere formation in OSCC cells. We also found that
EFNA4-induced upregulation of NANOG and OCT4 mRNA was diminished by EPHA10 knockdown in OEC-
M1 cells, although this effect was not observed for SNAIL mRNA (Fig. 5G). These data indicate that the forward
signaling of EFNA4-EPHA10 axis modulates cellular phenotypes, such as migration, sphere formation, and
expression of NANOG and OCT4 mRNA.
Co‑expression of EFNA4 with NANOG and OCT4 in OSCCs. To investigate the clinical significance
of EFNA4 in OSCC, we analyzed EFNA4 expression in publicly available cDNA microarray datasets (Table S1).
Two datasets from the Oncomine database demonstrated significant increases in EFNA4 mRNA in OSCC com-
pared to normal tissues (p < 0.0001 and p < 0.05; Fig. 6A, a and b, respectively)27,28. Expression of EFNA4 mRNA
was also significantly increased in 40 OSCC specimens compared to nontumor controls (p < 0.0001; Fig. 6A, c)29.
EFNA4 mRNA expression was significantly higher in grade 2 OSCC than in grade 1 tumors (p < 0.05, Fig. 6A,
d)30, and EFNA4 mRNA was significantly increased in OSCC with angiolymphatic invasion compared to tissue
without invasion (p < 0.01, Fig. 6A, e)29. We assessed EFNA4 protein level in both tumor tissue and correspond-
ing noncancerous epithelia in OSCC samples by immunohistochemical staining (IHC; Fig. 6B). High EFNA4
expression (intensity grade 2 or 3) was observed in 72.2% (13/18) of tumors, compared with only 11.8% of
noncancerous tissues showing high EFNA4 expression (p < 0.001, Fig. 6C). Moreover, 75% of OSCC specimens
demonstrated higher EFNA4 expression in tumor regions than in noncancerous regions (Fig. 6C).
To examine the relationships between EFNA4-EPHA10 signaling and expression of NANOG and OCT4
mRNA, we further investigated the cDNA expression dataset GSE37991 (gene expression profiling of OSCC)
based on its complete clinical information29. We found that the expression of EFNA4, NANOG, and OCT4,
but not EPHA10, mRNA was significantly increased in OSCC tissues compared to adjacent nontumor samples
(Fig. 6D). Also, tumor/nontumor (T/N) ratios of EFNA4, NANOG, OCT4, and EPHA10 mRNA expression had
averages of 1.39, 1.25, 2.37, and 1.03, respectively. Interestingly, a positive correlation existed between EFNA4 and
NANOG mRNA expression in OSCC samples (compared to paired nontumor tissues) using Pearson correlation
(Fig. 6E). Similarly, significant correlations in mRNA expression also occurred between EFNA4 and OCT4 and
between NANOG and OCT4 (Fig. 6E). Furthermore, patients with higher EFNA4/NANOG or EFNA4/OCT4
mRNA expression levels had worse recurrence-free survival compared to patients with lower EFNA4/NANOG
or EFNA4/OCT4 mRNA expression (p = 0.027, Fig. 6F). The clinical data confirmed our in vitro findings that
EFNA4 mRNA expression correlated with expression of NANOG or OCT4 mRNA.
Discussion
EPHA10 is associated with tumor progression and metastasis in breast cancer20, and is a promising therapeutic
target in triple-negative breast cancer and prostate c ancer21,22. Based on the publicly available clinical datasets,
we found that EPHA10 mRNA expression varied among different cancer types (Fig. 1A), indicating that the
effect of EPHA10 was tissue-specific and likely dependent on the milieu of binding partners and related target
gene regulation in a given cell type. Antibodies targeting EPHA10 significantly inhibited tumor growth in breast
cancer xenograft mouse m odels22. However, the underlying mechanisms of EPHA10-mediated tumorigenesis
are undefined. In this study, we first confirmed the essential role of EPHA10 in tumorigenesis and metastasis of
OSCC cells with in vivo models (Figs. 1E,F, S1A,B,C, and Table 1), suggesting that EPHA10 signaling may be a
useful therapeutic target in OSCC.
EPHA10 knockdown suppressed in vivo tumor growth and in vitro sphere formation (Figs. 1E,F, S1A, 2D),
but did not affect cell proliferation (Fig. S1D). This discrepancy may be due to the complexity of spatial distribu-
tion and cell contact in tumor s pheres31, as well as interplay between tumor cells and tumor-associated stromal
cells, suggesting a critical role for EPHA10 in complex cell–cell interactions and the tumor-associated microen-
vironment. Yin et al. found that EphA receptors and co-expressed ephrin-A ligands directly interact in cis via
their binding domains, and that this interaction does not seem to induce intracellular signals, but inhibits the
trans interaction15. Similarly, our data imply that ectopic expression of EPHA10 could dramatically enhance the
possibility of cis interactions with binding ligands, such as EFNA4, and that these interactions could reduce the
relative level of EFNA4 for trans-interaction between EFNA4-EPHA10, thereby inhibiting the EPHA10 forward
signal among cells (Figs. 2, S2).
Scientific Reports | (2021) 11:644 | https://doi.org/10.1038/s41598-020-80060-3 7
Vol.:(0123456789)www.nature.com/scientificreports/
Scientific Reports | (2021) 11:644 | https://doi.org/10.1038/s41598-020-80060-3 8
Vol:.(1234567890)www.nature.com/scientificreports/
◂Figure 4. EFNA4-enhanced cellular functions were inhibited by ERK blockage. (A) Detection of EFNA4-
Fc-stimulated ERK activation in OEC-M1 cells. Upper: Immunoblot assay showing total and phosphorylated
ERK levels in OEC-M1 cells treated with 0.1 μg/ml EFNA4-Fc for 10, 30, 60, 120, and 360 min. Lower: The
phosphorylated ERK level was normalized to that of total ERK. The relative ERK activity was calculated by
dividing the level of normalized phosphorylated ERK in OEC-M1 cells treated with EFNA4-Fc (n = 2) by that
in untreated cells (n = 2). (B) Left: Representative images of migrated cells. Scale bars, 100 μm. Right: Relative
migration activity was determined by normalizing the mean number of migrated cells per field of OEC-M1
cells treated with 10 or 20 μM PD98059 or vehicle upon 0.1 μg/ml EFNA4-Fc stimulation (n = 10) to that of
the IgG-treated cells (n = 10). (C) Left: Representative images of tumorspheres. Scale bars, 200 μm. Right:
Sphere formation in OEC-M1 cells treated with 10 or 20 μM PD98059 or vehicle upon 0.1 μg/ml EFNA4-Fc
stimulation. Relative sphere formation activity in OEC-M1 cells co-treated with EFNA4-Fc and PD98059 (n = 2)
was determined by normalizing the mean number of spheres per well to that of the IgG-treated cells (n = 2).
(D) Gene expression of SNAIL, OCT4, and NANOG in OEC-M1 cells treated with 10 or 20 μM PD98059 or
vehicle upon 0.1 μg/ml EFNA4-Fc stimulation was measured by qRT-PCR. The amplifications were normalized
to β-actin (internal control). Relative gene expression was obtained by dividing the normalized gene expression
in the treated cells (n = 3) by that in the control cells (n = 3). (E) Detection of NANOG expression in OEC-M1
cells treated with EFNA4-Fc or co-treated with EFNA4 and PD98059 by western blot. Data was cropped and
the full-length blot is presented in Supplementary Fig. S6. (F) Relative levels of NANOG mRNA in OEC-M1
cells expressing NANOG-specific shRNA and vector control (pLKO-GFP) were determined by qRT-PCR. The
amplifications were first normalized to β-actin (internal control). The relative mRNA expression in NANOG
knockdown OEC-M1 cells (n = 3) was normalized to that in control cells (n = 3). (G) Representative data
show the relative migration potential of OEC-M1 pLKO-GFP, NANOG sh4, and NANOG sh5 cells treated
with 0.1 μg/ml EFNA4-Fc or 0.1 μg/ml IgG control. Left: Representative images of migrated cells. Scale bars,
100 μm. Right: The relative migration activity was determined by normalizing the mean number of migrated
cells per field of the knockdown cells treated with EFNA4-Fc (n = 10) to that of control cells (n = 10). (H) The
tumorspheres in OEC-M1 pLKO-GFP, NANOG sh4, and NANOG sh5 cells treated with 0.1 μg/ml EFNA4-Fc
or 0.1 μg/ml IgG control were assessed in sphere culture. Upper: Representative images of tumorspheres. Scale
bars, 200 μm. Lower: Relative sphere formation activity was determined by normalizing the mean number of
spheres per well of the knockdown cells treated with EFNA4-Fc (n = 4) to that of the control cells (n = 4). Bars
represent SE. *p < 0.05; **p < 0.01; ***p < 0.001.
EFNA3 is a tumor suppressor of malignant peripheral nerve sheath tumors32, while EFNA5 overexpression
is associated with prostate tumorigenesis33. No significant effects of exogenous EFNA3 or EFNA5 on OSCC cell
migration or spheroid formation were observed in our study (Fig. S3). In datasets of oral cancer gene expression,
EFNA4 is upregulated in OSCC tissues compared with nontumor tissues and is correlated with later stage and
angiolymphatic invasion of OSCC (Fig. 6A). Similarly, EFNA4 expression was elevated in breast cancer, ovarian
cancer, and hepatocellular c arcinoma34, and may play a role in cell fate determination of mammary epithelial
cells35. EFNA4 may be a promising target for identification of tumor-initiating cells in triple-negative breast can-
cer and ovarian c ancer34. EFNA4-mediated bidirectional signaling is not well-characterized and many questions
remain. Originally, our data suggested that EFNA4-Fc, like membrane-bound EFNA4, is involved in regulating
TWIST, SNAIL, NANOG, and OCT4 mRNA expression, as well as inducing cell migration and spheroid forma-
tion in OSCC cells (Fig. 3). Yin et al. illustrated that Stat/Snail signaling modulated the co-expression of OCT4
and NANOG36. We found that EFNA4 induced expression of SNAIL, NANOG, OCT4 mRNA via ERK activation
(Fig. 4), however, Stat3 activation was not addressed in this study. Additionally, our data demonstrated the inhibi-
tory effects of NANOG knockdown on EFNA4-induced cell migration and sphere formation (Fig. 4). Similarly,
Yin et al. reported that co-expression of OCT4 and NANOG induced development of CSC characteristics and
enhanced EMT in hepatocellular carcinoma, and Huang et al. showed that ERK-NANOG signaling promoted
CSC phenotypes and EMT in H NSCC36,37.
Overexpression of EPHA2 is related to malignancy and tumor angiogenesis of tongue squamous cell
carcinoma38. EPHA2 also contributes to human glioma stem cell formation and stemness marker SOX2
expression39. However, the roles of EPHA10 in development of cancer stemness remain unknown. Our data
showed that knockdown of EPHA10, but not EPHA2, influences exogeneous EFNA4-induced spheroid forma-
tion (Fig. 5C,F), while both EFNA4-EPHA2 and EFNA4-EPHA10 forward signaling axes regulate migration
of OSCC cells (Fig. 5B,E). EPHA2 activation and EPHA2 overexpression displayed opposite roles in regulation
of cell migration and invasion; EPHA2 activation by ephrin A1 suppressed chemotactic migration, whereas
overexpression of EPHA2 enhanced migration in a ligand-independent m anner40. EFNA4-EPHA2 signaling
in chronic lymphocytic leukemia cells significantly reduced their adhesion and impaired cell trafficking and
chemotaxis41. Any association between Eph receptor-ligand signaling and migration may depend on tumor
subtype, microenvironmental context, and other parameters. Interestingly, we found that EFNA4-EPHA2 for-
ward signaling affects cell migration but not spheroid formation, indicating a difference in receptor-specific
functions and signaling between EPHA2 and EPHA10. Downstream proteins that interact with kinase-deficient
EPHA10 and the mechanisms involved in EPHA10 phosphorylation require further investigation to clarify the
differences between EPHA10 and EPHA2 signaling16. In OSCC cells, EPHA10 plays a critical role in linking
external stimuli (EFNA4 or other ligands) to the internal signal transduction that leads to cancer cell migration
and spheroid formation. When considering ephrin ligands and their receptors as potential therapeutic targets,
excessive toxicity associated with pan-ephrin receptor inhibition must be considered.
Scientific Reports | (2021) 11:644 | https://doi.org/10.1038/s41598-020-80060-3 9
Vol.:(0123456789)www.nature.com/scientificreports/
Scientific Reports | (2021) 11:644 | https://doi.org/10.1038/s41598-020-80060-3 10
Vol:.(1234567890)www.nature.com/scientificreports/
◂Figure 5. EPHA10 is required for EFNA4-induced cell migration, sphere formation, and expression of
NANOG and OCT4. (A) EPHA2 and (D) EPHA10 levels in OEC-M1 cells expressing EPHA2 or EPHA10
shRNA, respectively, or the corresponding controls (pLKO-GFP) were determined by immunoblot. Protein
levels were normalized to an internal control (α-tubulin). Relative ratios were determined by dividing the level
of the EPHA2 or (D) EPHA10 in each expression variant by that in the pLKO-GFP vector-expressing cells. (B)
Representative data show the relative migration potential of OEC-M1 pLKO-GFP, EPHA2 sh4, and EPHA2
sh5 cells or (E) pLKO-GFP, EPHA10 sh3, and EPHA10 sh5 cells treated with 0.1 μg/ml EFNA4-Fc or 0.1 μg/ml
IgG control. Upper: Representative images of migrated cells. Scale bars, 100 μm. Lower: The relative migration
activity as determined by normalizing the mean number of migrated cells per field of the knockdown cells
treated with EFNA4-Fc (n = 10) to that of control cells (n = 10). (C) The tumorspheres in OEC-M1 pLKO-GFP,
EPHA2 sh4, and EPHA2 sh5 cells or (F) pLKO-GFP, EPHA10 sh3, and EPHA10 sh5 cells treated with 0.1 μg/
ml EFNA4-Fc or 0.1 μg/ml IgG control were assessed in sphere culture. Relative sphere formation activity
was determined by normalizing the mean number of spheres per well of the knockdown cells treated with
EFNA4-Fc (n = 2) to that of the control cells (n = 2). (G) Relative levels of NANOG, OCT4, and SNAIL mRNA
in OEC-M1 pLKO-GFP, EPHA10 sh3, and EPHA10 sh5 cells treated with EFNA4-Fc or IgG were measured by
qRT-PCR and normalized to β-actin (internal control). For each gene, the relative mRNA expression in EFNA4-
Fc-treated EPHA10 shRNA expressing cells (n = 3) was normalized to that of control IgG-treated cells (n = 3).
Bars represent SE; *p < 0.05; **p < 0.01; ***p < 0.001.
As previously shown in other tumor types34, we demonstrated upregulated expression of EFNA4 in OSCC
tissues compared to nontumor tissues (Fig. 6B,C). Interestingly, we found that EFNA4 was expressed in both
tumor cells and tumor-infiltrating immune cells (unpublished data), suggesting that EFNA4 could be expressed
by oral cancer cells and their associated stromal cells. Further investigation is needed to determine whether
contact between tumor cells and infiltrating immune cells contributes to oral tumorigenesis. We provided data
that characterizes EFNA4-EPHA10 forward signaling in OSCC cells using exogenous Eph receptor ligands,
however, characterization of reverse signaling in EFNA4-expressing cells requires additional research. In this
study, we demonstrated correlation of EFNA4, NANOG, and OCT4 mRNA expression in clinical OSCC speci-
mens (Fig. 6E), and showed that the co-expression of EFNA4 with NANOG or OCT4 was associated with poor
prognosis in OSCC patients (Fig. 6F). These data were consistent with the finding that the expression of NANOG
and OCT4 mRNA was enhanced by induction of EFNA4-EPHA10 forward signaling in OSCC cells (Fig. 5G).
Our data did not show correlation of EPHA10 expression with OSCC clinical outcome and differential expres-
sion of EPHA10 in the GSE37991 dataset (Fig. 6D). However, our data indicated inhibition of trans-interaction
by ectopic EPHA10 expression (Fig. S2), suggesting that upregulation of both EPHA10 and EFNA4 in OSCC
tissues increased cis-interactions, and that upregulation of EFNA4 in cancer tissues was enough to induce the
downstream effects of EFNA4-EPHA10 forward signaling.
Collectively, EPHA10 supports tumor growth and lymph node metastasis of OSCC cells in vivo. Signaling by
EPHA10 and its ligand, EFNA4, promotes OSCC cell migration and tumor spheroid formation through induc-
tion of NANOG mRNA expression via ERK activation (Fig. 6G). Finally, our findings are supported by clinical
data showing that patients with high co-expression of EFNA4/NANOG or EFNA4/OCT4 mRNA had worse
recurrence-free a survival than those with low co-expression (Fig. 6F), supporting a significant role for EHPA10
and EFNA4 in OSCC development and progression, as well as the significance of these signaling molecules as
potential therapeutic targets.
Methods
Gene expression data mining. Oncomine (www.oncomine.org), an online web-based cancer database
for RNA and DNA sequences, was used to facilitate data-mining of the expression of gene transcripts in 20 types
of cancer23. Expression of EPHA10 or EFNA4 mRNA in cancer samples was compared with expression in sam-
ples of normal tissue using the Student’s t-test.
Cell lines and reagents. Human oral keratinocytes (HOK) were obtained from ScienCell Research Labo-
ratories (Carlsbad, CA, USA) and grown in an oral keratinocyte medium (OKM) according to the manufac-
turer’s protocols. OSCC cell lines, including the OC3 line established from an OSCC specimen42, the CGHNC9
line established from an oral cancer specimen43, the TW2.6 line established from a buccal carcinoma44, the
OEC-M1 line established from an oral epidermoid c arcinoma45, the SAS line established from a poorly differ-
entiated tongue squamous cell carcinoma46, the DOK line established from a human dysplastic oral mucosa47,
the HSC3 line established from tongue carcinoma with cervical m etastasis48, and the LN1-1 line developed via
in vivo selection from OEC-M1-derived t umor24, were obtained and kept within 20 passages in each experiment,
as previously described24,49. These cells were authenticated using the short tandem repeat assay at the Center for
Genomic Medicine, National Cheng Kung University (Tainan, Taiwan) and Mission Biotech (Taipei, Taiwan).
Ephrin A3 labelled with an IgG Fc tag (EFNA3-Fc), ephrin A4 labelled with an Fc tag (EFNA4-Fc), ephrin A5
labelled with an Fc tag (EFNA5-Fc), and an IgG control were purchased from R&D Systems (Minneapolis, MN,
USA).
Immunoblot assay. Immunoblot assays were conducted as previously d escribed50. The primary antibod-
ies used were anti-EPHA10 (ab75955, Abcam, Cambridge, UK), anti-EFNA4 (MAB369, R&D Systems), anti-
EPHA2 (sc-924, Santa Cruz, Santa Cruz, CA, USA), anti-β-catenin (610253, BD Biosciences, Franklin Lakes,
NJ, USA), anti-E-cadherin (610182, BD Biosciences), anti-α-catenin (610193, BD Biosciences), anti-vimentin
Scientific Reports | (2021) 11:644 | https://doi.org/10.1038/s41598-020-80060-3 11
Vol.:(0123456789)www.nature.com/scientificreports/
Scientific Reports | (2021) 11:644 | https://doi.org/10.1038/s41598-020-80060-3 12
Vol:.(1234567890)www.nature.com/scientificreports/
◂Figure 6. Co-expression of EFNA4 with NANOG and OCT4 mRNA in OSCC. (A) Increased EFNA4 mRNA
expression in OSCC tissues compared to normal oral tissues or nontumor areas via clinical dataset analysis
(a–c). Increased EFNA4 mRNA expression in OSCC of higher tumor grade or angiolymphatic invasion via
clinical dataset analysis (d–e). The relative EFNA4 mRNA expression is represented by log2 median-centered
intensity in datasets a–d. The average tumor/nontumor (T/N) ratio of EFNA4 mRNA is shown in dataset e. (B)
Immunohistochemical analysis of EFNA4 in human OSCC samples. No expression or weak EFNA4 expression
in the nontumor epithelium (left panel) and strong EFNA4 staining in the OSCC areas is visible at 100 × (scale
bar, 200 μm) and 400 × (scale bar, 50 μm) magnifications. (C) Left: Scoring of EFNA4 staining intensity in 17
noncancerous epithelium samples (light grey bars) and 18 tumor samples (dark grey bars). Expression levels
are scored as: 0, none; 1, weak; 2, moderate; 3, strong. Right: Comparison of the EFNA4 staining intensity
between tumor areas (T) and noncancerous epithelium (N) based on each histological section. (D) EFNA4,
NANOG, OCT4, and EPHA10 mRNA expression in OSCC tissues (n = 40) and corresponding nontumor
(NT) tissues (n = 40). Data were obtained from clinical dataset GSE37991. The expression is represented by
log2 median-centered intensity. (E) Correlations between the T/N ratios of EFNA4, EPHA10, NANOG, and
OCT4 mRNA using the GSE37991 dataset and Pearson correlation analysis. Pearson’s correlation coefficient
(r) between two variants is shown in the center of the box at the intersect of each pair (n = 40). (F) Recurrence-
free survival analysis with EFNA4, NANOG, and OCT4 mRNA expression as classification criteria using
dataset GSE37991. Patients were stratified into low (EFNA4low/NANOGlow or EFNA4low/OCT4low, n = 23) and
high (EFNA4high/NANOGhigh or EFNA4high/OCT4high, n = 17) groups using the median expression level of each
mRNA as the cutoff. (G) The role of ephrin A4 (EFNA4)-ephrin receptor A10 (EPHA10) forward signaling
in promoting OSCC tumorigenesis and metastasis. EFNA4 from adjacent tumor cells or stromal cells binds
to EPHA10 on OSCC cells and induces extracellular signal-regulated kinase (ERK) activation. ERK activation
drives progressive effects, including cell migration and spheroid formation, and up-regulation of NANOG
expression. NANOG is required for EFNA4-induced cell migration and sphere formation (indicated as dark
blue dashed arrows). Bars represent SE; *p < 0.05; **p < 0.01.
(MS-129-P0, Thermo Scientific, Waltham, MA, USA), anti-focal adhesion kinase (FAK; sc-557, Santa Cruz),
anti-phosphorylated FAK (611806, BD Biosciences), anti-protein kinase B/AKT (#9272, Cell Signaling, Dan-
vers, MA, USA), anti-phosphorylated AKT (#9271, Cell Signaling), anti-ERK (sc-94, Santa Cruz), anti-phos-
pho-ERK (sc-7383, Santa Cruz), anti-integrin-linked kinase (ILK; GTX101691, GeneTex, Irvine, CA, USA),
anti-non-phospho-β-catenin (#8814, Cell Signaling), anti-Nanog (GTX627421, GeneTex), and anti-α-tubulin
(MS-581-P0, Thermo Scientific). The blots with absence of full-length images were cut prior to hybridization
with antibodies. All original blots are presented in Supplementary Fig. S6. Protein levels were quantified by scan-
ning the blots, measuring the band intensity using ImageJ software (National Institutes of Health, Bethesda, MD,
USA), and normalizing against α-tubulin (internal control). The expression ratio was calculated by dividing the
normalized protein level in experimental cells by that in control cells.
Fluorescence activated cell sorting (FACS). FACS analysis was performed on a cytometer (FACS-
Calibur, BD) and analyzed using FlowJo 7.6 software (FlowJo, Ashland, OR, USA). Cells were stained with
anti-EPHA10 (Abcam, ab75955) and a secondary antibody conjugated with DyLight 488 (611-141-002, ROCK-
LAND, Limerick, PA, USA). The shift in peak fluorescence intensity was measured and the geometric mean of
the population was calculated.
Plasmids. RNAi-mediated knockdown was conducted using a pLKO-based short hairpin RNA (shRNA)
lentiviral vector purchased from the National RNAi Core Facility/Academia Sinica, Taipei, Taiwan. EPHA10
and EPHA2 knockdown clones used: EPHA10 sh1 (TRCN000021384), sh2 (TRCN0000021385), sh3
(TRCN0000021386), sh4 (TRCN0000021387), and sh5 (TRCN00000221388); EPHA2 sh1 (TRCN0000006406),
sh2 (TRCN0000006407), sh3 (TRCN0000006405), sh4 (TRCN0000006403), and sh5 (TRCN00000195734);
NANOG sh4 (TRCN0000420670) and sh5 (TRCN0000420864). A human EPHA10 cDNA plasmid was obtained
from Genescript (OHu08980, Piscataway, NJ, USA) and then inserted in the pBabe-puro vector. Expression con-
structs were stably expressed in target cells as previously described50.
Cell growth. Cell growth curves were developed using the MTS assay as previously described51. Briefly, 103
cells per well were plated in 96-well plates and the Cell-Titer 96 Aqueous Non-radioactive Cell Proliferation
assay was used to measure cell growth (Promega, Madison, WI, USA) for 4–5 days, according to the manufac-
turer’s instructions. Cell proliferation was determined by calculating the mean absorbance at 490 nm using a
96-well plate reader. The experiments were performed at least twice.
Cell division analysis by carboxyfluorescein succinimidyl ester (CFSE). Cells were washed with
Dulbecco’s Phosphate-Buffered Saline (DPBS, ThermoFisher Scientific, Waltham, MA, USA) twice, then stained
with 10 μM CFSE (ThermoFisher Scientific) in DPBS for 10 min. Full culture medium was added to terminate
the reaction, and cells were centrifuged to remove the staining solution. Cells were suspended in culture medium
and seeded into 24-well plates at 2 × 10⁴ cells per well. After incubation for 3 days, the cells were harvested and
analyzed by flow cytometry. The experiments were performed at least twice.
Scientific Reports | (2021) 11:644 | https://doi.org/10.1038/s41598-020-80060-3 13
Vol.:(0123456789)www.nature.com/scientificreports/
Cell death analysis by Annexin V/propidium iodide (PI) assay. The cell death assay was performed
using the Annexin V Apoptosis Detection Kit (BD Biosciences), according to the manufacturer’s instructions.
The samples were stained with fluorescein isothiocyanate (FITC)-conjugated annexin V and PI on ice and ana-
lyzed by flow cytometry within one hour. The experiments were performed at least twice.
Migration assay. Cell migration analyses were conducted using a transwell assay as previously described52.
Relative migration activity was determined by normalizing the mean number of cells that had migrated per field
(n = 10) in the experimental condition to that of control cells. The experiments were performed at least twice.
Orthotopic inoculation in nude mice. The procedures for orthotopic inoculation were previously
escribed24. A total of 5 × 10⁵ cells in 50 μL sterile DPBS was injected into the buccal mucosa of two batches of
d
5–6-week-old male nude mice (BALB/cAnN.Cg-Foxn1nu/CrlNarl; n = 4–5 per batch) and mice were sacrificed
at 28–31 days post-inoculation for the first and second batches, respectively. Tumor size was determined by
measuring the tumor dimensions and calculating volume (mm3) using the formula 1/2 × (length) × (width)2.
The orthotopic tumors were weighted and then processed by the Pathology Core Lab (National Health Research
Institutes, Taiwan).
Immunohistochemical analysis. IHC analysis was conducted as previously d escribed50. The primary
antibodies used were anti-Ki-67 (NCL-Ki67p, Leica Biosystems, Buffalo Grove, IL, USA), anti-LYVE-1 (07-358,
Upstate Biotechnology, Lake Placid, NY, USA) and anti-human EFNA4 (MAB369, 1:50, R&D Systems). Sections
were counterstained with hematoxylin (Sigma-Aldrich, St. Louis, MO, USA). The percentage of positive Ki-67
nuclei was determined using ImmunoRatio software and dividing the total intensity of positive nuclei by that of
all nuclei in the field53. For LYVE-1 staining, the data were expressed as mean number of LYVE-1 positive vessels
per microscopic field in each specimen. To determine EFNA4 expression, formalin-fixed and paraffin-embed-
ded OSCC tissues containing both tumor and adjacent nontumor epithelium were obtained from the Depart-
ment of Pathology at National Cheng Kung University Hospital (HR-97-100 and EC1040406-E). Expression of
EFNA4 in each tissue section was scored as 0, 1, 2, or 3 (0 = negative, 1 = weak, 2 = intermediate, 3 = strong) based
on staining intensity.
Cell morphology. Imaging of actively proliferating cells was achieved using an inverted microscope with a
phase-contrast lens, as previously described50.
Sphere formation. Cells (1 × 10⁴) in DMEM/F12 medium (Sigma-Aldrich) with 20 ng/ml of basic fibroblast
growth factor (bFGF, Abcam), 10 ng/ml of epidermal growth factor (EGF; Thermo Fisher Scientific, Waltham,
MA, USA), and B27 supplement (Thermo Fisher Scientific), were cultured in Corning Costar Ultra-Low Attach-
ment 6-Well Plates (CLS3471, Merck, Darmstadt, Germany) for 14 days. The number and size of tumorspheres
were quantitatively assessed using ImageJ. Relative sphere formation activity was determined by normalizing the
mean number of spheres per well (n = 2) in the experimental condition compared to that of control cells. The
experiments were performed at least twice.
Quantitative reverse transcription‑polymerase chain reaction (qRT‑PCR). The qRT-PCR was
escribed50. The primer sequences used are listed below. TWIST-F: 5′ ACGCTGCCC
performed as previously d
TCG GACAA; TWIST-R: 5′ AGGACCTGGTAGAGGAAGTCGAT; SNAIL-F: 5′ GTCAGATGAGGACAG
TGGGAAAG, SNAIL-R: 5′ CAAGGAAGAGACTGAAGTAGAGGAGAAG; SLUG-F: 5′ AGACCCTGGTTG
CTTCAAGGA; SLUG-R: 5′ GACCTGTCTGCAAATGCTCTGT; OCT4-F: 5′ GAGAACCGAGTGAGAGGC
AAC; OCT4-R: 5′ CTGATCTGCTGCAGTGTGGGT; NANOG-F: 5′ CCAGAACCAGAGAATGAAATCTAA
GA; NANOG-R: 5′ TGAGGCCTTCTGCGTCACA; SOX2-F: 5′ CGTTCATCGACGAGGCTAAGC; SOX2-R: 5′
TCATGAGCGTCTTGGTTTTCC; β-actin-F: 5′ TGGATCAGCAAGCAGGAGTATG; β-actin-R: 5′ GCATTG
CGGTGGACGAT. Each amplification was run in triplicate.
Statistical analysis. Analysis was conducted with GraphPad Prism version 5.01 (GraphPad Software, San
Diego, CA, USA). The AVOVA test and Student’s t-test were used to assess statistical differences between groups.
The paired t-test was used to determine differences in gene expression between tumor samples and adjacent
nontumor samples. The Pearson correlation was used to evaluate the linear relation between two variants. The
log rank test was used to evaluate differences in survival between stratified groups. The R base heatmap function
(R Stats Package, https://www.r-project.org/) was used to generate the gene expression heatmap, which presents
data from 40 OSCC patients via scaled gene expression differences (for tumor/nontumor pairs). The R chart cor-
relation function (R Performance Analytics Package, https://www.rdocumentation.org/packages/Performanc
eAnalytics/versions/2.0.4) was used to calculate the correlation between gene expression patterns and produce
the correlation matrix. For all comparisons, p < 0.05 was considered statistically significant.
Ethics approval and consent to participate. All animal studies followed the guidelines for the Care
and Use of Laboratory Animals of National Health Research Institutes, Taiwan. The protocols were approved by
the Institutional Animal Care and Use Committee of National Health Research Institutes (Protocol No: NHRI-
IACUC-106001-A). Use of tissue sections and oral cancer cells was approved by IRB (EC1040406-E, National
Health Research Institutes). Informed consent was obtained from all subjects or, if subjects were under 18, from
Scientific Reports | (2021) 11:644 | https://doi.org/10.1038/s41598-020-80060-3 14
Vol:.(1234567890)www.nature.com/scientificreports/
a parent and/or legal guardian. All methods were carried out in accordance with relevant guidelines and regula-
tions.
Data availability
The data, generated and/or analyzed, that are included in this article are available from the corresponding author
upon reasonable request.
Received: 12 May 2020; Accepted: 15 December 2020
References
1. Jerjes, W. et al. Clinicopathological parameters, recurrence, locoregional and distant metastasis in 115 T1–T2 oral squamous cell
carcinoma patients. Head Neck Oncol. 2, 9 (2010).
2. Wutzl, A. et al. Mortality and causes of death after multimodality treatment for advanced oral and oropharyngeal cancer. J. Oral
Maxillofac. Surg. 65, 255–260 (2007).
3. Yang, J. & Weinberg, R. A. Epithelial-mesenchymal transition: at the crossroads of development and tumor metastasis. Dev. Cell
14, 818–829 (2008).
4. Thiery, J. P., Acloque, H., Huang, R. Y. & Nieto, M. A. Epithelial-mesenchymal transitions in development and disease. Cell 139,
871–890 (2009).
5. Thiery, J. P. Epithelial-mesenchymal transitions in tumour progression. Nat. Rev. Cancer 2, 442–454 (2002).
6. Yang, J. et al. Twist, a master regulator of morphogenesis, plays an essential role in tumor metastasis. Cell 117, 927–939 (2004).
7. Roussos, E. T. et al. AACR special conference on epithelial-mesenchymal transition and cancer progression and treatment. Cancer
Res. 70, 7360–7364 (2010).
8. Pradella, D., Naro, C., Sette, C. & Ghigna, C. EMT and stemness: flexible processes tuned by alternative splicing in development
and cancer progression. Mol. Cancer 16, 8 (2017).
9. Shibue, T. & Weinberg, R. A. EMT, CSCs, and drug resistance: the mechanistic link and clinical implications. Nat. Rev. Clin. Oncol.
14, 611–629 (2017).
10. Takahashi, K. & Yamanaka, S. A decade of transcription factor-mediated reprogramming to pluripotency. Nat. Rev. Mol. Cell Biol.
17, 183–193 (2016).
11. Zhang, Z., Filho, M. S. & Nor, J. E. The biology of head and neck cancer stem cells. Oral Oncol. 48, 1–9 (2011).
12. Pasquale, E. B. Eph receptors and ephrins in cancer: bidirectional signalling and beyond. Nat. Rev. Cancer 10, 165–180 (2010).
13. Boyd, A. W., Bartlett, P. F. & Lackmann, M. Therapeutic targeting of EPH receptors and their ligands. Nat. Rev. Drug Discov. 13,
39–62 (2014).
14. Lisabeth, E. M., Falivelli, G. & Pasquale, E. B. Eph receptor signaling and ephrins. Cold Spring Harb. Perspect. Biol. 5, a009519
(2013).
15. Yin, Y. et al. EphA receptor tyrosine kinases interact with co-expressed ephrin-A ligands in cis. Neurosci. Res. 48, 285–296 (2004).
16. Truitt, L. & Freywald, A. Dancing with the dead: Eph receptors and their kinase-null partners. Biochem. Cell Biol. 89, 115–129
(2011).
17. Wykosky, J. & Debinski, W. The EphA2 receptor and ephrinA1 ligand in solid tumors: function and therapeutic targeting. Mol.
Cancer Res. 6, 1795–1806 (2008).
18. Hafner, C. et al. Differential gene expression of Eph receptors and ephrins in benign human tissues and cancers. Clin. Chem. 50,
490–499 (2004).
19. Wang, B. Cancer cells exploit the Eph-ephrin system to promote invasion and metastasis: tales of unwitting partners. Sci. Signal
4, pe28 (2011).
20. Nagano, K. et al. Expression of Eph receptor A10 is correlated with lymph node metastasis and stage progression in breast cancer
patients. Cancer Med. 2, 972–977 (2014).
21. Nagano, K. et al. Eph receptor A10 has a potential as a target for a prostate cancer therapy. Biochem. Biophys. Res. Commun. 450,
545–549 (2014).
22. Nagano, K. et al. Ephrin receptor A10 is a promising drug target potentially useful for breast cancers including triple negative
breast cancers. J. Control Release 189, 72–79 (2014).
23. Rhodes, D. R. et al. Oncomine 3.0: genes, pathways, and networks in a collection of 18,000 cancer gene expression profiles. Neoplasia
9, 166–180 (2007).
24. Yen, Y. C. et al. Insulin-like growth factor-independent insulin-like growth factor binding protein 3 promotes cell migration and
lymph node metastasis of oral squamous cell carcinoma cells by requirement of integrin beta1. Oncotarget 8, 41837–41855 (2015).
25. Chen, S. F. et al. Nonadhesive culture system as a model of rapid sphere formation with cancer stem cell properties. PLoS ONE 7,
e31864 (2012).
26. Aasheim, H. C., Patzke, S., Hjorthaug, H. S. & Finne, E. F. Characterization of a novel Eph receptor tyrosine kinase, EphA10,
expressed in testis. Biochim. Biophys. Acta 1723, 1–7 (2005).
27. Estilo, C. L. et al. Oral tongue cancer gene expression profiling: Identification of novel potential prognosticators by oligonucleotide
microarray analysis. BMC Cancer 9, 11 (2009).
28. Ye, H. et al. Transcriptomic dissection of tongue squamous cell carcinoma. BMC Genom. 9, 69 (2008).
29. Lee, C. H. et al. Epigenetic regulation of the X-linked tumour suppressors BEX1 and LDOC1 in oral squamous cell carcinoma. J.
Pathol. 230, 298–309 (2013).
30. Slebos, R. J. et al. Gene expression differences associated with human papillomavirus status in head and neck squamous cell car-
cinoma. Clin. Cancer Res. Off. J. Am. Assoc. Cancer Res. 12, 701–709 (2006).
31. Ishiguro, T. et al. Tumor-derived spheroids: relevance to cancer stem cells and clinical applications. Cancer Sci. 108, 283–289
(2017).
32. Wang, Z., Liu, Z., Liu, B., Liu, G. & Wu, S. Dissecting the roles of Ephrin-A3 in malignant peripheral nerve sheath tumor by
TALENs. Oncol. Rep. 34, 391–398 (2015).
33. Rosenberg, E. E. et al. Expression of cancer-associated genes in prostate tumors. Exp. Oncol. 39, 131–137 (2017).
34. Damelin, M. et al. Anti-EFNA4 calicheamicin conjugates effectively target triple-negative breast and ovarian tumor-initiating cells
to result in sustained tumor regressions. Clin. Cancer Res. Off. J. Am. Assoc. Cancer Res. 21, 4165–4173 (2015).
35. Burleigh, A. et al. A co-culture genome-wide RNAi screen with mammary epithelial cells reveals transmembrane signals required
for growth and differentiation. Breast Cancer Res. BCR 17, 4 (2015).
36. Yin, X. et al. Coexpression of gene Oct4 and Nanog initiates stem cell characteristics in hepatocellular carcinoma and promotes
epithelial-mesenchymal transition through activation of Stat3/Snail signaling. J. Hematol. Oncol. 8, 23 (2015).
37. Huang, C. et al. ERK1/2-Nanog signaling pathway enhances CD44(+) cancer stem-like cell phenotypes and epithelial-to-mesen-
chymal transition in head and neck squamous cell carcinomas. Cell Death Dis. 11, 266 (2020).
Scientific Reports | (2021) 11:644 | https://doi.org/10.1038/s41598-020-80060-3 15
Vol.:(0123456789)You can also read