Transcriptional insights into the CD8+ T cell response to infection and memory T cell formation
←
→
Page content transcription
If your browser does not render page correctly, please read the page content below
resource
Transcriptional insights into the CD8+ T cell
response to infection and memory T cell formation
J Adam Best1, David A Blair2, Jamie Knell1, Edward Yang1, Viveka Mayya2, Andrew Doedens1,
Michael L Dustin2, Ananda W Goldrath1 & The Immunological Genome Project Consortium3
After infection, many factors coordinate the population expansion and differentiation of CD8 + effector and memory T cells. Using
data of unparalleled breadth from the Immunological Genome Project, we analyzed the CD8 + T cell transcriptome throughout
© 2013 Nature America, Inc. All rights reserved.
infection to establish gene-expression signatures and identify putative transcriptional regulators. Notably, we found that the
expression of key gene signatures can be used to predict the memory-precursor potential of CD8 + effector cells. Long-lived
memory CD8+ cells ultimately expressed a small subset of genes shared by natural killer T and gd T cells. Although distinct
inflammatory milieu and T cell precursor frequencies influenced the differentiation of CD8 + effector and memory populations,
core transcriptional signatures were regulated similarly, whether polyclonal or transgenic, and whether responding to bacterial or
viral model pathogens. Our results provide insights into the transcriptional regulation that influence memory formation and CD8 +
T cell immunity.
The Immunological Genome (ImmGen) Project is a partnership are well established as essential regulators of gene expression by
between immunologists and computational biologists with the goal CD8+ T cells during infection, including those encoded by Tbx21,
of carefully and comprehensively defining gene-expression and Tcf7, Eomes, Id2, Id3 and Prdm1, yet it is likely that many additional
regulatory networks in cells of the mouse immune system by highly factors that affect CD8+ T cell differentiation are yet to be described.
standardized methods of sample collection and data preparation1. Such factors are more efficiently identified by unbiased methods such
Here we sought to identify and track the transcriptional programs as transcriptomics.
initiated in CD8+ T cells during the response to in vivo activation CD8+ T cells are known to share certain functional abilities and
by bacterial or viral antigens. CD8+ cytotoxic T cells have important transcription factors with other cells of the immune system; how-
roles in the clearance of intracellular pathogens and tumors. In the ever, the transcriptional relationship between CD8+ T cells and other
uninfected state, a diverse repertoire of resting, naive CD8+ T cells cytolytic lymphocyte populations is not well described. The ImmGen
populate peripheral lymphoid organs. After infection, CD8+ T cells Program offered a unique opportunity to address this question, given
transition from quiescent, poor effector cells to metabolically active, its unmatched inventory of directly comparable transcriptomic data
proliferating cells with cytolytic function and the capacity for rapid for hundreds of different types of cells of the immune system. We
cytokine production. That progression is accompanied by changes in have made a systematic and temporally resolved analysis of transcrip-
gene expression that reflect each stage of differentiation2–5. During tional changes that occur through the antigen-specific responses of
expansion, the innate immune response induced by different patho- CD8+ T cells, from early time points of activation to the analysis of
gens creates infection-specific inflammatory environments that long-term memory cells, in the context of various infection settings.
influence the kinetics of T cell population expansion and the effector From these data, we have identified previously unknown clusters of
differentiation and memory potential of CD8+ T cells6,7. However, coregulated genes and used network-reconstruction analyses of the
the effect of such unique proinflammatory environments on tran- ImmGen Consortium to predict transcriptional activators and repres-
scriptional networks and gene expression by CD8+ T cells is not sors or genes with differences in expression. These analyses allowed
well understood. us to profile CD8+ T cells with differing memory potential and obtain
After pathogen clearance, most CD8+ T cells die, which leaves a insights into the transcriptional processes that govern the differentia-
select few with the ability to form long-term memory and to protect tion of effector and memory cell populations.
the host from reinfection. Each differentiation state—naive, effec-
tor, terminally differentiated effector and memory—is thought to be RESULTS
orchestrated by a network of transcription factors with key down- Temporally regulated expression patterns in CD8 + T cells
stream targets that enable and enforce stage-specific cellular traits. In To establish a molecular profile of pathogen-reactive CD8+ T cells
confirmation of that, certain transcriptional activators or repressors over the course of infection, we transferred congenic naive OT-I T
1Divisionof Biological Sciences, University of California San Diego, La Jolla, California, USA. 2Skirball Institute of Biomolecular Medicine, New York University
School of Medicine, New York, New York, USA. 3A list of members and affiliations appears at the end of the paper. Correspondence should be addressed to
A.W.G. (agoldrath@ucsd.edu).
Received 9 August 2012; accepted 21 December 2012; published online 10 February 2013; doi:10.1038/ni.2536
nature immunology aDVANCE ONLINE PUBLICATION 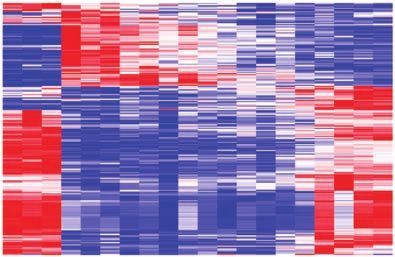
resource
cells (which have transgenic expression of a T cell antigen receptor the cells on days 0.5, 1 and 2 after transfer. This approach included
(TCR) that recognizes a fragment of ovalbumin (OVA; amino acids a greater frequency of precursor cells (1 × 10 6 transferred cells) and
257–264) presented by the major histocompatibility complex mol- allowed the infection to become established so that transferred OT-I
ecule H-2Kb) into C57BL/6J mice, which we then immunized with cells were rapidly recruited into the immune response. The expression
OVA-expressing Listeria monocytogenes (Lm-OVA) as a model patho- of markers associated with activation and differentiation by these cells
gen-associated antigen. We collected splenic CD8+ T cells on days 6, was similar to that of cells transferred at a lower precursor frequency
8, 10, 15, 45 and 100 of infection and sorted the cells to high purity for (5 × 10³ transferred cells), and any differences were consistent with
gene-expression profiling by the ImmGen data-generation and qual- more rapid contraction and differentiation into the memory subset
ity-control pipelines (Supplementary Fig. 1a and Supplementary (Supplementary Fig. 2). We analyzed the transferred OT-I CD8+
Note 1). We transferred the minimum number of OT-I cells that still T cells by flow cytometry for expression of phenotypic markers of
allowed adequate recovery of responding cells for analysis. For col- activation and/or memory. We found that expression CD127, CD62L
lection on days 6 and later, we transferred 5 × 10³ donor cells 1 d and CD27 was downregulated with activation, followed by reexpres-
before immunization, which represented a relatively low precursor sion in memory cells, whereas the expression of CD69 and CD44 was
frequency, albeit higher than the endogenous repertoire of T cells spe- uniformly upregulated, as expected (Supplementary Fig. 1b), which
cific for H2-Kb–OVA peptide8,9. To gain better understanding of the indicated that all of the transferred cells were activated.
changes in gene expression that occur during the earliest stages of the The number of genes with different expression in infection-exposed
response after activation, before the expansion phase, we used the fol- OT-I cells versus naive OT-I cells peaked within 48 h of infection;
lowing alternative approach: we first infected mice with Lm-OVA and, unexpectedly, at later time points, a greater proportion of genes with
1 d later, transferred OT-I CD8+ cells into the mice and then isolated altered expression were downregulated than were upregulated (Fig. 1a),
© 2013 Nature America, Inc. All rights reserved.
a b –3.0 3.0
20 Expression (fold)
Up
15
Genes (×10 )
2
Down
10
5
0
12 24 48 6 8 10 15 45 100 Naive 12 24 48 6 8 10 15 45 100
Time (h) Time (d) Time (h) Time (d)
c Initial cytokine or effector
response: Ctla4, Ifng,
Preparation for cell
division: Myc, Tnf, Id3,
Cell cycle & division:
Myb, Hist1h3a, Cdk1,
Naive and late memory:
Sell, Nsg2, Slfn5, Cnr2
Early effector, late
memory: Ly6a, Rpl,
d
Gzmb, Il2ra, Il2 Egr2, Cd69, Pkm2 Cdc45 Snora
Expression (fold)
I II III IV V
28 577 291 84 225 Time (d) Time (d)
N
12
24
48
6
8
10
15
105
0
N
12
24
48
6
8
10
15
105
0
N
12
24
48
6
8
10
15
105
0
N
12
24
48
6
8
10
15
105
0
N
12
24
48
6
8
10
15
105
0
0
0
N N
4
4
4
4
4
45
45
10
10
15
10
15
10
6
8
6
8
Time (h) Time (d) Time (h) Time (d) Time (h) Time (d) Time (h) Time (d) Time (h) Time (d) Dmrta1 Unc5a
Short-term effector Memory precursor: Naive or late effector or Short-term effector or Late effector or memory: Edaradd Xcl1
and memory: Id2, Bcl2, Tcf7, Il7r, Foxo3 memory: Cxcr6, Klf2, memory: Prdm1, Hif2a Tbx21, Prf1, Bhlhe40, Prss12 Yes1
Zeb2, Klrg1, S1pr5, Klf3, S1pr4, S1pr1 Cd44, Klre1, Il12rb2
Cnrip1 Cdh1
Cxcr3, Cx3cr1, Itgam
Aqp9 Myo3b
Expression (fold)
VI VII VIII IX X
Bcl2 Dock9
–3.0 3.0 Atn1
Expression (fold)
53 123 219 82 92
N
12
24
48
6
8
10
15
105
0
N
12
24
48
6
8
10
15
105
0
N
12
24
48
6
8
10
15
105
0
N
12
24
48
6
8
10
15
105
0
N
12
24
48
6
8
10
15
105
0
4
4
4
4
4
Time (h) Time (d) Time (h) Time (d) Time (h) Time (d) Time (h) Time (d) Time (h) Time (d)
Figure 1 Gene-expression profiles associated with the activation 100
e Glycolysis
Respiratory chain
Genes per GO tag (%)
+
and memory formation of CD8 T cells. (a) Quantification of 80 Fatty-acid metabolism
genes upregulated (Up) or downregulated (Down) in infection-
60
exposed OT-I cells relative to their expression in naive OT-I
cells at various time points during infection (horizontal axis). 40
(b) Hierarchical clustering analysis of OT-I cells sorted at various 20
time points after infection with Lm-OVA, filtered for a change 0
in expression of over twofold anywhere in the data set, a I II III IV V VI VII VIII IX X
coefficient of variation of less than 0.5 and mean expression Cluster
value of over 120. (c) Ten clusters with the most dynamic
expression by K-means clustering analysis, filtered as in b but with a change in expression of over 1.4-fold. Each line represents a single probe;
numbers in bottom right corners indicate number of probes; above plots, genes of interest in each cluster. (d) Heat map (bottom) of the correlation
coefficients of mean gene expression fit to an artificial exemplar (top) of genes upregulated only at day 45 and day 100 of infection (left) or of genes
upregulated only at day 100 (right), showing the top 15% of correlated genes. (e) Quantification of genes in each cluster a given gene ontology (GO) tag
related to metabolism (key), presented relative to all genes with that tag. Data are representative of three experiments with a compilation of two (48 h
and day 100) or three (all other time points) independent samples sorted from pooled spleens (n ≥ 3 per sample).
aDVANCE ONLINE PUBLICATION nature immunology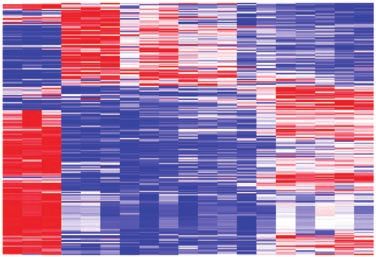
resource
which suggested that the transition to memory required a tem- expression was higher in the memory subset; Bcl2 expression has
pering of gene expression associated with initial activation. To been linked to memory formation and survival, consistent with the
visualize changes in gene expression over the course of the CD8 + emergence of long-lived memory cells from the heterogeneous pool of
T cell response to infection with Lm-OVA, we selected 7,195 genes that effector-memory populations12. That observation enhanced our con-
had a difference in expression of at least twofold in any two samples fidence in the accuracy of our identification of memory-specific and
in the data set from the total of 25,194 genes examined (Fig. 1b and late-memory-specific genes, never before associated with memory
Supplementary Table 1). We next parsed those probes with differ- formation and/or maintenance, to our knowledge. Notably, we identi-
ences in expression into unbiased groups according to kinetic patterns fied Cdh1 as a late-memory-specific gene. Its product, E-cadherin, is a
of expression (by K-means clustering). We further investigated the ten calcium-dependent homophilic adhesion molecule and a ligand of the
clusters with the most dynamic patterns. effector-cell marker KLRG1 (ref. 13) and the integrin CD103 (ref. 14).
To determine the biological processes probably associated with This suggested that the oldest memory cells may be capable of unique
each cluster, we identified groups of genes that shared gene-ontology adhesive interactions and may access distinct microenvironmental
designations (Fig. 1c and Supplementary Table 2). Cluster I included niches. Expression may also serve as a unique surface identifier of
genes with expression that was upregulated 12 h after activation, then late-memory cells.
decreased immediately but remained higher than that in naive cells. As the metabolic regulation of the differentiation of memory T cells
This cluster had the fewest genes and notably included genes encoding is a topic of broad interest, we used gene-ontology annotations to
early effector molecules. Cluster II had the most genes (577); a large examine the expression of genes encoding molecules in specific meta-
proportion encoded RNA-processing molecules or molecules related bolic pathways. Genes encoding glycolysis-related molecules were
to RNA processing, but this cluster also included genes downstream of almost exclusively in cluster II, whereas genes encoding molecules
TCR activation, such as Egr2 and Cd69. As expected, genes in cluster related to the respiratory chain and fatty-acid metabolism were dis-
© 2013 Nature America, Inc. All rights reserved.
III encoded molecules mostly related to the cell cycle and proliferation, tributed among clusters II, III, V and VIII; the former two clusters rep-
processes coincident with the proliferative burst. Cluster IV included resented rapidly dividing cells and included genes encoding molecules
genes with the highest expression in naive and memory CD8+ T cells, involved in fatty-acid biosynthesis, whereas the latter two clusters
such as Sell (which encodes CD62L), and genes encoding molecules included genes maintained in naive cells as well as memory cells and
suspected to have roles in suppressing the immune response, includ- those encoding molecules involved in the transport of acetyl-CoA and
ing Cnr2 and Slfn5. The genes of cluster V mostly encoded ribosomal fatty-acid oxidation (Fig. 1e and Supplementary Table 2). These data
proteins and small nuclear RNAs and had moderate expression in supported the observation that a switch from glycolysis to fatty-acid
naive and early activated cells as well as in the memory population. metabolism is necessary for proper memory formation15–17.
Cluster VI included genes that encode phenotypic markers tradition-
ally associated with effector and effector-memory CD8+ subsets, such Predicted regulators of the T cell response
as KLRG1, CD11b and Id2, as well as migratory receptors, such as The breadth of information in the data set from the ImmGen Project
S1PR5 and CX3CR1. Genes associated with memory-precursor cells provided a platform with which to investigate the basis of the differ-
were present in cluster VII, including Il7r, Bcl2 and Tcf7. Gene expres- ent patterns of gene regulation observed across the ten clusters of
sion in cluster VIII was lower in cells responding to infection than CD8+ T cells identified. As part of the global analysis of the ImmGen
in naive T cells early in the response, and expression recovered after Project, which includes all types of cells of the immune system, we
day 6; gene expression in cluster IX was low in naive cells, then rose used cutting-edge network reverse engineering to identify potential
and then fell slowly over time; whereas gene expression in cluster X regulators of gene expression18 (metadata, http://www.immgen.org/
remained high into memory time points. ModsRegs/modules.html). Each ‘module’ of the ImmGen Project
Included in clusters IX and X were many genes whose products have consists of groups of coregulated genes identified from the entire
known roles in memory formation, such as T-bet (Tbx21) and Blimp-1 data set of the ImmGen Project (explanation of modules, ref. 18;
(Prdm1), in addition to inflammatory receptors such as S1PR1 and modules, http://www.immgen.org/ModsRegs/modules.html). We
the interleukin 12 receptor (IL-12R), and Krüppel-like-factors, which then used the Ontogenet algorithm18 to predict likely transcriptional
have been linked to proliferation and survival10; this provided early regulators for each module on the basis of the expression profile of
confirmation of the validity of the technique. More unexpected was those gene sets, ‘leveraged’ by analysis including all data from the
the rapid upregulation of expression of effector molecules such as ImmGen Project. To determine where our activated CD8+ T cell clus-
granzyme B, interferon-γ and IL-2, encoded by genes of cluster I. ters were in those modules, we used a hypergeometric test for two
Although it has been shown in reporter mice that an interferon-γ groups (comparing each CD8+ T cell cluster to each fine module)
signal can be detected as early as 24 h after immunization with OVA to identify any statistically significant enrichment for genes of clus-
peptide–pulsed dendritic cells11, our data suggested that the gain of ters I–X in fine modules of the ImmGen Project (with application of
effector function that occurred with priming was initiated as early as a Benjamini-Hochberg false-discovery rate of 0.05 or lower to the
12 h after antigen recognition. P-value table of all ten clusters throughout all fine modules). We found
To identify unique genes encoding molecules potentially involved that several fine modules showed significant enrichment for genes of
specifically in the function of memory and late memory CD8+ each cluster (Supplementary Fig. 4a and Supplementary Table 3).
T cells, we looked for transcripts that correlated with an exem- For example, fine module 99, which includes genes expressed in natu-
plar of each cluster (genes not expressed until day 45 or day 100; ral killer (NK) cells, NKT cells and activated CD8 + T cells, showed
R2 > 0.85). Very few genes met those strict criteria; we identified the most significant enrichment for genes in cluster X. Associated
six genes as ‘memory specific’ and seven as ‘late-memory specific’. with each fine module were predicted transcriptional ‘regulators’ of
We confirmed mRNA abundance by quantitative PCR (Fig. 1d and the genes identified in each cluster, each with a ‘regulatory weight’ in
Supplementary Fig. 3). According to those criteria, no genes were a given cell type that indicates its activity as a regulator for a particu-
specifically downregulated at the later time points, which was unex- lar module in a particular cell type. We pooled predicted activators
pected, given the quiescent state of memory cells. As anticipated, Bcl2 or repressors from all of the fine modules that showed enrichment
nature immunology aDVANCE ONLINE PUBLICATION 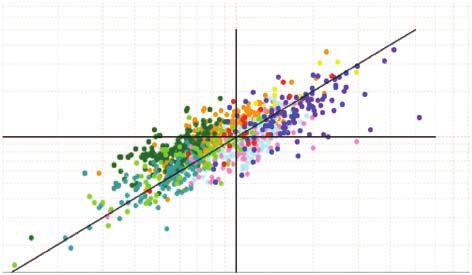
resource
Figure 2 Coregulated genes can be used to T cells
+
predict transcriptional regulation of T cell CD8 T cells
Activated
activation. Enrichment for genes in activated +
Predicted activators Predicted repressors CD8 T cells
CD8+ T cell clusters (identified in Fig. 1) in the
Tbx21, Id2, Relb, Rora, Klf12, Smyd1, Eomes, Nab1, Stat4, Pou2af1, Pax5, Mycn, Ebf, Pparg, Cebpb (regulator
context of fine modules of coregulated genes I
Runx2 (regulator weights: 0.199 to 0.00468) weights: –0.00086 to –0.0215)
identified by the ImmGen Consortium, for genes Churc1, Phf5a, Cbx5, Hdac6, Taf9, Mybl2, E2f1, Elof1, Insm1, Scmh1, Klf3, Runx1, Cited2, Foxd4, Nfkbia, Foxp1,
II
encoding selected regulators of T cells (key) E2f6, Nkrf, Myc, Tfdp2 (regulator weights 0.131 to 0.0743) Arntl, Tcf7, Foxj2 (regulator weights: –0.00032 to –0.0493)
predicted through the use of the Ontogenet III
Uhrf1, Dnmt1, Foxm1, E2f8, Suv39h1, Hmgb2, Tcf19, E2f7, Klf12, Ciita, Nfe2l1, Chd7, Foxj2 (regulator weights:
Hat1, Whsc1 (regulator weights: 0.0130 to 0.00794) –0.00006 to –0.0807)
algorithm18 based on enriched modules Ets1, Irf7, Irf9, Bcl11b, Elk4, Lef1, Tox, Trim14, Tcf7, Gata3, Runx2, Mybl1, Klf12, Lmo2, Egr3, Scmh1, Rorc, Smad3,
(Supplementary Fig. 4), ‘curated’ by relevance IV Nfatc3, Nfatc1, Egr2, Nab2, Foxo1, Zbtb7b, Stat2, Tcfe3, Irf8, Notch3, Tbx21, Tcfe2a, Stat6, Ctbp2, Cux1, Tcf4, Irf5
to T cell biology and in order of predicted Irf1, Ets2, Hif1a (regulator weights: 0.129 to 0.0101) (regulator weights: –0.00007 to –0.0735)
Cnbp, Smyd3, Myc, Elof1, Hat1, Zeb1, Rarb, Hdac2, Atoh1, Foxd4, Tbx6, Mycl1, Ppard, Cited2, Cbx2, E2f4 , Klf7,
weight, for which genes with a ‘weight’ of 0 do V
Smad7, Stat2 (regulator weights: 0.135 to 0.00058) Runx3, Pbrm1 (regulator weights: –0.00011 to –0.0188)
not contribute to the regulatory program of that Nab1, Klf6, Irf5, Tcfe3, Rxra, Id2, Ciita, Pias3, Eomes, Rara, Taf2, Pax5, Hic1, Mycn, Nfkb1, Pparg, Relb, Cebpb, Zfhx3,
cell population. VI Klf12, Relb, Rora, Smyd1, Runx2, Smad3, Stat4, Prdm1, Ebf1, Maf, Gata3, Mllt3, Bcl11b (regulator weights:
Zeb2 (regulator weights: 0.117 to 0.00182) –0.00039 to –0.0826)
Tbx21, Gata3, Nfatc3, Lef1, Tox, Nfatc1, Bcl11b, Tcf7, Prmt5, Chd7, Nfix, Klf3, E2f2, Tcf4, Irf5, Mef2c, Lmo2
VII
Pias1, Foxo3, Tcf4 (regulator weights: 0.0953 to 0.00294) (regulator weights: –0.00077 to –0.10023)
for genes from CD8+ T cell clusters (I–X) Nfatc2, Nab1, Stat6, Ets1, Bcl11b, Irf7, Lef1, Gata3, Tcfe3,
VIII Klf6, Smad7, Tcf7, Tox, Id2, Rxra, Foxo4, Foxo3, Tbx21,
Stat2, Tcf20, Nfkb1, Nfatc1, Relb, Creg1, Tcf4, Insm1, Zeb1,
Tcfeb, Klf8, Tcfe2a, Pax5, Bcl6, Foxp4, Ctbp2 (regulator
and ranked them in order of the predicted Smad4, Eomes (regulator weights: 0.199 to 0.0262) weights: –0.00042 to –0.0231)
regulatory weight. We used a linear model to IX
Rxra, Tcfe3, Stat6, Irf5, Id2, Smad2, Klf6, Tbx21, Eomes,
Smad3, Prdm1 (regulator weights: 0.0758 to 0.00097)
Maf, Scmh1, Zbtb7b, Pax5, Zeb1, Hmgn3, Satb1, Foxp4,
Hdac7, Ets1 (regulator weights: –0.00028 to –0.0641)
generate a prediction of the expression of the Tbx21, Nab1, Tcfe3, Irf5, Id2, Runx2, Foxp1, Eomes, Rora, Maf, Etv3, Hic1, Mycn, Runx1, Pax5, Nab2, Prdm1, Srebf2,
modules’ genes in each cell type on the basis X Smyd1, Bhlhe41, Stat4, Zeb2, Runx3 (regulator weights:
0.199 to 0.00044)
Pax5, Hdac7 (regulator weights: –0.00028 to –0.0854)
of the activity-weighted expression of the
© 2013 Nature America, Inc. All rights reserved.
regulators18. We assigned colors on the basis
of their predicted role as regulators of gene expression (as indicated that these cells truly represented precursors that seeded the long-
by the meta-analysis at http://www.immgen.org/ModsRegs/modules. term memory compartment (Supplementary Fig. 5b,d). Many of
html) in T cells, CD8+ T cells or activated T cells (Fig. 2). We identi- these genes ‘turned off ’ by 48 h, not to re-emerge until day 45 of the
fied many genes encoding transcriptional regulators known to have response, which suggested that some priming of gene expression may
roles in CD8+ T cell activation and differentiation, including Tbx21, have occurred very soon after antigen exposure.
Erg2, Egr3, Prdm1, Bcl11b, Tcf7, Bcl6, Foxo1, Foxo3, Id2, Tcf3 and We also identified many regulators whose involvement was previ-
many genes encoding STAT proteins (Fig. 2 and Supplementary ously unappreciated in the differentiation of CD8+ T cell response
Fig. 4). For example, on the basis of these results, we predicted that by this strategy. Confirming a potential for predicted involvement,
the products of Id2, Tbx21 and Prdm1 in various combinations would quantitative PCR showed that the abundance of Rora, Zeb2, Tox, Ets1
positively regulate genes in clusters VI, IX and X, which include genes and Tcf19 mRNA was greater in the KLRG1hi CD8+ effector T cell
expressed in short-term effector-memory cells; it is known that the subset than in KLRG1lo effector cells sorted from the same response
loss of each of these regulators results in impaired generation of this (Supplementary Fig. 4c). Comparison of the expression of those
subset19,20. Conversely, we identified the Tcf7 as encoding a regulator regulators in the context of KLRG1 expression provided preliminary
of the genes in clusters IV, VII and VIII, which include many genes information about their potential functions; for example, Rora and
associated with naive and long-term memory populations; it is known Zeb2 were expressed ‘preferentially’ in the KLRG1hi subset and both
that loss of Tcf7 impairs memory formation. Thus, this strategy holds encode predicted positive regulators of genes in clusters VI and X,
promise for the identification of additional regulators of the CD8+ T which include genes expressed by short-term effector, short-term
cell response. memory and late effector-memory cells. These data suggested that
The expression patterns of CD127 (IL-7R) and KLRG1 can be used to the products of Rora and Zeb2 and other previously unknown regu-
predict T cell fate early in the immune response21–23. IL-7RloKLRG1hi lators may control the gene-expression patterns of those subsets of
cells have been identified as short-lived effector cells, whereas CD8+ effector cells.
IL-7RhiKLRG1lo CD8+ T cell populations include a subset of cells
that go on to become long-lived memory cells and have been called Core gene clusters during CD8+ T cell differentiation
‘memory-precursor effector cells’19. To put our data in context of that We next used the CD8+ T cell cluster gene signatures identified above
paradigm, we used published microarray data comparing the gene (Fig. 1) to correlate changes in gene expression during differentiation
expression of IL-7Rhi and IL-7Rlo CD8+ effector cells responding to into short-lived effector-memory or long-term memory precursor
infection with lymphocytic choriomenengitis virus19 and analyzed cells. Inhibition of transcription factors of the E-protein family by
the expression of those genes in the context of infection with Lm- Id2 and Id3 has been shown to alter CD8+ T cell differentiation24–26.
OVA (Supplementary Fig. 5). Cells near the peak of infection showed For example, loss of Id2 expression impairs the survival of effector
enrichment for the majority (86%) of genes with higher expression in cells and results in the failure to accumulate KLRG1 hi short-lived
the IL-7Rlo CD8+ T cell population than in the IL-7Rhi CD8+ T cell pop- effector cells24. Conversely, Id3 is needed to sustain the long-lived
ulation; these included genes encoding molecules involved in cell cycle memory population, and abundant Id3 expression can be used to
and mitosis, almost half of which were in cluster III (Supplementary predict memory-precursor potential24. To determine how differences
Fig. 5a,c). The IL-7Rlo effector cell population showed enrichment for in gene expression early in the immune response could be used to pre-
genes from clusters VI, IX and X; these included genes whose expres- dict and were correlated with known memory potential of particular
sion increased at the peak of infection (48 h) and then was sustained populations, we evaluated gene-expression profiles in the context of
or decreased slowly in the memory phase (Supplementary Fig. 5a,c). our ten expression clusters for three comparisons of CD8+ effector
Genes expressed by IL-7Rhi cells near the peak of the response were populations: Id2-deficient versus Id2-wild-type KLRG1lo OT-I cells
upregulated only very late during infection when we evaluated expres- from day 6 of infection; KLRG1loIL-7Rhi versus KLRG1hiIL-7Rlo OT-I
sion by the CD8+ population as a whole, which supported the idea cells from day 6 of infection; and Id3hi versus Id3lo KLRG1loIL-7Rlo
aDVANCE ONLINE PUBLICATION nature immunology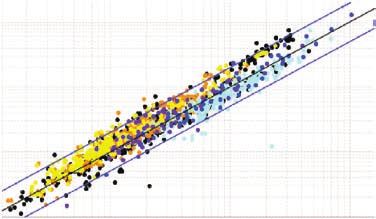
resource
a Id2-KO Id2-WT Id3hi Id3lo
Figure 3 Regulation of core gene-expression modules by memory precursor
cells. (a) Flow cytometry of CD8+ T cells from Id2-deficient mice (Id2-KO)
5 2 1 29 17 2 0 24 0
10
and Id2-wild-type mice (Id2-WT) and Id3hi and Id3lo CD8+ T cells, on
104 day 6 of infection with VSV-OVA. Numbers in quadrants indicate percent
103 cells in each. (b) Heat map of the frequency of enrichment of clusters
KLRG1
102 (Fig. 1c) in wild-type and Id2-deficient samples collected on day 6 of
14 85 5 48 84 14 72 3
infection with Lm-OVA and Id3hi and Id3lo samples collected on day 5
102 103 104 105 of infection with VSV-OVA (both pre-peak time points) for the following
IL-7R
comparisons: Id2-deficient versus wild-type cells (both KLRG1loIL-7Rhi;
b I II III IV V VI VII VIII IX X top), KLRG1loIL-7Rhi cells versus KLRG1hiIL-7Rlo cells (both wild-type;
Id2-KO vs Id2-WT 0.5 0.73* 0.15 0.97* 0.78* 0.35* 0.81* 0.6* 0.45 0.38 middle), or Id3hi versus Id3lo cells (both CD44+KLRG1loIL-7Rlo; bottom).
KLRG1lo vs KLRG1hi 0.3 0.86* 0.18 0.97* 0.92* 0.15* 0.79* 0.47 0.14* 0.12*
Numbers in map indicate proportion of cells with enrichment for that
Id3hi vs Id3lo 0* 0.49 0.11 0.9* 0.6* 0.14* 0.72* 0.19* 0.03* 0.2*
comparison; a frequency of 1.0 (red) indicates memory potential, and a
1.0 0.5 0 frequency of 0.0 (blue) indicates effector potential. *P < 0.05 (χ2 test).
(c) ‘Volcano plots’ of the comparison of Id2-deficient KLRG1lo cells
Frequency of enrichment versus wild-type KLRG1lo cells (top), wild-type KLRG1lo cells versus wild-
type KLRG1hi cells (middle), and Id3hi cells versus Id3lo cells (bottom),
c 0
Id2-WT
II
Id2-KO
III IV VII
showing cluster-specific genes for each comparison. Numbers in bottom
–1 right and left corners indicate the number of genes in that region. Data
P (log10)
–2 are representative of three independent experiments with three mice per
–3 genotype (a) or three experiments with three independent samples from
99 273 94 16 1 35 14 59 pooled spleens (b,c; n ≥ 3 per sample).
0.2 1 5 0.2 1 5 0.2 1 5 0.2 1 5
© 2013 Nature America, Inc. All rights reserved.
Expression (fold) Expression (fold) Expression (fold) Expression (fold)
Id2-KO vs Id2-WT
KLRG1hi KLRG1lo molecules associated with proliferation and division were expressed
0
–1 differently by Id2-deficient versus Id2-wild-type cells and by KLRG1hi
P (log10)
–2
–3
cells versus KLRG1lo cells but had equivalent expression in Id3hi cells
–4 and Id3lo cells. Notably, all three comparisons indicated that the subset
53 317 90 20 1 35 15 58
0.1 1 10 0.1 1 10 0.1 1 10 0.1 1 10
of cells biased toward memory precursor potential had lower expres-
Expression (fold) Expression (fold) Expression (fold) Expression (fold) sion of genes in cluster III (cell cycle and division) and cluster IV
KLRG1lo vs KLRG1hi (short-term effector memory) than did their more short-lived effector
Id3lo Id3hi
0 counterparts, even at the peak of expansion (Fig. 3a,c). These data
–1
suggested that the earliest phases of the immune responses in the
P (log10)
–2
–3
–4
context of deficiency in Id2 or Id3 may have previously unappreciated
–5 differences in activation or division based on the temporal regulation
202 191 113 14 4 35 21 54
0.1 1 10 0.1 1 10 0.1 1 10 0.1 1 10 of genes in cluster II and III, defects not identified in earlier analyses
Expression (fold) Expression (fold) Expression (fold) Expression (fold) of deficient cells. Furthermore, although it has been reported to be
Id3hi vs Id3lo
homogeneous, the population assumed to contain memory precursors
may actually be more heterogeneous than previously thought.
OT-I cells, sorted on the basis of their expression of a green fluores-
cent protein (GFP) reporter of Id3 on day 5 of infection24 (Fig. 3a). In TCR clonality does not alter core gene signatures
each comparison, cells with greater memory potential were in the first Many immunological advances have made use of model pathogens
population listed. We assessed whether genes from each cluster were and donor cells with transgenic expression of TCRs that can be moni-
biased toward cells with memory potential versus effector potential tored by artificially high precursor frequency and/or expression of
in any of the comparisons (Fig. 3b); here, we determined ‘enrichment’ congenic markers. However, it is known that the broader range of
by the fraction of genes with a change in expression of over onefold affinity and lower precursor frequency of polyclonal endogenous
(versus the null hypothesis of independence of 0.5). This analysis CD8+ T cell responses, as well as pathogen-specific inflammatory
shows skewing for many of the key CD8+ T cell gene clusters: genes environments, lead to differences in the differentiation of effector
in clusters III, VI, IX and X, which included many of the effector and and memory cells, including the induction of T-bet expression during
effector-memory associated genes, were ‘preferentially’ expressed in infection with L. monocytogenes27–29. We therefore sought to deter-
the Id2-wild-type, KLRG1hi and Id3lo populations, whereas genes in mine if differences in TCR repertoire and frequency led to changes
clusters IV, V and VII, which included genes associated with naive, in the expression of core gene clusters. We used tetramers of H-2K b
early effector and late memory, were ‘preferentially’ expressed in the loaded with OVA peptide to identify endogenous, antigen-specific
Id2-deficient, KLRG1lo and Id3hi populations. CD8+ T cells from nontransgenic mice infected with Lm-OVA on
To further demonstrate the relative gene expression in the three days 8 and 45 of infection (Supplementary Fig. 6). We used the
comparisons, we generated plots of each comparison for clusters II, resultant profiling data to compare the transcriptional response of
III, IV and VII (Fig. 3c). We found considerable enrichment for genes polyclonal OVA peptide–specific (tetramer-positive) cells with that
linked to cluster IV (naive and late memory) and cluster VII (memory of OT-I T cells, across the gene clusters identified above (Fig. 1). Few
precursor) in Id2-deficient, KLRG1lo and Id3hi cells (Fig. 3b); 90–97% genes had a difference in expression of over twofold in transgenic
of the genes in cluster IV and 72–81% of those in cluster VII had cells versus tetramer-positive OVA peptide–specific cells at day 8, and
higher expression in Id2-deficient, KLRG1lo and Id3hi cells than their even fewer had such a difference in expression at day 45 of infection
counterpart populations (Id2-wild-type, KLRG1hi and Id3lo, respec- (Fig. 4a), which suggested that the frequency of antigen-specific T
tively). This analysis also provided several unexpected observations. cell precursors and TCR repertoire did not greatly alter gene expres-
Of particular interest to us was cluster II, for which genes encoding sion at effector or memory time points. The few genes found to be
nature immunology aDVANCE ONLINE PUBLICATION 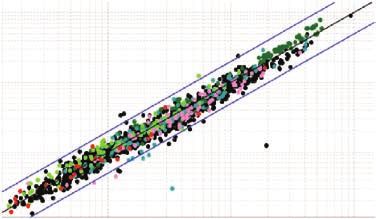
resource
a help, all of which can affect the number of T cells recruited to the
Day 8 Day 45
4 II 13 I response, the kinetics of their activation, and their differentiation fate
10
Expression (Tet+)
III IV
V
as effector and memory cells. We sought to determine if there were
VI
103 VII notable differences in the transcriptional response to stimulation by the
VIII X
102
IX same antigen in the context of a bacterial infection versus a viral infec-
tion. To contrast with the Lm-OVA model analyzed above, we used
102 103 104 vesicular stomatitis virus expressing recombinant ovalbumin (VSV-
Expression (OT-I) OVA). We transferred OT-I cells as described above and subsequently
b I 0.278 ± 0.115
infected the recipient mice with either agent. We then collected OT-I
Tet+: day 8 vs day 45
5 II 0.240 ± 0.013 **
Expression (fold)
III 0.428 ± 0.034 ** cell–derived CD8+ T cells and profiled them as described above.
IV –0.093 ± 0.025 *
1 V 0.273 ± 0.015 ** When we plotted the overall responses, it was apparent that
VI 0.270 ± 0.080 expression patterns over each time course were generally similar,
VII 0.025 ± 0.015
0.2
VIII –0.054 ± 0.019 with sequential induction and ‘shut-off ’ of the same blocks of genes
0.2 1 5
IX 0.132 ± 0.078 (Fig. 5a). Some distinctions were detectable; for example, a group of
X –0.014 ± 0.040
Expression (fold)
transcripts repressed during the effector period were not reinduced as
OT-I: day 8 vs day 45
effectively after infection with VSV-OVA as after infection with Lm-
Figure 4 Common gene-expression patterns of transgenic and endogenous OVA. The induction and contraction of the response after infection
CD8+ effector and memory T cells. (a) Difference in gene expression of with VSV-OVA or Lm-OVA were generally superimposable for the
H-2Kb–OVA tetramer–positive antigen-specific (endogenous) cells (Tet +)
same core gene signatures identified by clusters I–X (Fig. 5b), which
versus OT-I cells (OT-I) on day 8 or day 45 of infection with Lm-OVA, for
suggested that many aspects of the CD8+ T cell responses were antigen
© 2013 Nature America, Inc. All rights reserved.
genes identified by K-means clustering analysis (Fig. 1); colors in plots
(genes) match colors of clusters (key); blue diagonal lines indicate a focused and ‘blind’ to pathogen-specific inflammatory events.
difference in expression of twofold. (b) Comparison of gene expression To better delineate differences between the responses, we used
on day 8 versus day 45 after infection as in a for tetramer-positive cells, analysis of variance (ANOVA); for simplicity, we grouped the results
plotted against that for OT-I CD8+ T cells; colors in plots (genes) match obtained for days 5–10 and days 45–100 into the effector phase and
colors of clusters (key); values in key indicate the change in expression
memory phase, respectively. We identified a few distinct transcripts
(mean yi − xi) ± s.e.m.; diagonal line indicates y = x. *P < 0.001 and
**P < 0.00001 (t-test). Data are representative of two independent
(with a change in expression of over twofold) by this analysis (Fig. 5c
experiments with three mice per group. and Supplementary Table 4). For example, Klrg1 was induced more
effectively during infection with Lm-OVA, whereas Ctla4 and Pdcd1
(which encodes the costimulatory molecule PD1) had higher expres-
r egulated differently in the two cell types were almost exclusively sion during infection with VSV-OVA; these differences tended to be
genes encoding TCRs, ribosomal proteins and small nuclear RNAs. conserved at the effector and memory phases (Fig. 5c). We confirmed
The only notable exceptions were modest enrichment for Klra3, Klra8 several of those differences at the protein level by flow cytometry; the
and Klra9 transcripts in OT-I cells (data not shown); Klra3, Klra8 results reflected expression differences by a subset of cells (CTLA-4
and Klra9 had 1.9-, 1.8- and 2.4-fold higher expression, respectively, and KLRG1) and different expression by the population as a whole
in tetramer-positive cells than in naive cells and had 3.3-, 2.4- and (PD-1; Fig. 5d). Genes known to be IL-12 dependent31 during infec-
3.9-fold higher expression, respectively, in OT-I cells than in naive tion had moderately higher expression during infection with Lm-OVA
cells. By comparing the ratio of expression at day 8 to that at day 45 (Supplementary Fig. 7a). However, this was mainly a difference in
for OT-I and tetramer-positive cells, we observed a similar ‘evolution’ magnitude, in that most of the IL-12-responsive genes were upreg-
of gene expression in both conditions, but it was also apparent that ulated in both infections but were upregulated to a greater extent
genes in clusters II and III had a small but uniformly higher ratio after infection with Lm-OVA than after infection with VSV-OVA
of expression by polyclonal tetramer-positive effector and memory (Supplementary Fig. 7b). We found a very similar pattern for genes
populations (Fig. 4b). As clusters II and III included many genes responsive to type I interferons31, with moderate skewing toward
encoding molecules involved in cell cycle and division, this suggested infection with Lm-OVA (Supplementary Fig. 7c); however, again this
that the priming event for a low-frequency, antigen-specific T cell was largely due to subtle differences in magnitude (Supplementary
population drove more proliferation of those cells, perhaps because of Fig. 7d). These data may yield insight into the more rapid contraction
less competition for antigen and activation signals than the competi- of T cell populations responding to VSV than of those responding to
tion encountered by high-frequency precursor cells, for which such L. monocytogenes. However, whereas the differences after infection
signals may be limiting. Notably, however, examination of clusters with Lm-OVA or with VSV-OVA were quantitative, there was mini-
linked to memory potential or formation (clusters VI–X) showed that mal indication of transcripts uniquely affected in one condition or the
most genes were regulated similarly in the two populations. Thus, by other (Supplementary Table 4). Despite the distinct milieu elicited
genome-wide assessment of gene expression, our data showed that by bacterial and viral infection, the core gene-expression programs
endogenous and monoclonal responses reflected similar ‘transcrip- of our ten clusters were conserved in the CD8+ effector and memory
tional programming’ during memory formation and supported the populations (Fig. 5e), and the few differences tended to represent
conclusion that the small number of phenotypic differences used to differences in the amplitude of expression.
suggest differences in memory formation in this context8,30 do not
represent a substantial divergence in core gene signatures. Shared signatures of functionally related cell types
Many cell types of the immune system share conserved gene-
Similar gene signatures during different infections expression modules. Using data from the ImmGen Project, we com-
The immune response tailors itself to each pathogenic threat by pared pairs of B cell, NKT cell and γδ T cell populations to identify
responding to molecular cues, including the inflammatory cytokine any statistically significant enrichment for genes from our CD8+
milieu, antigen load, innate signaling and requirements for CD4+ T cell T cell clusters during their activation, as a clue to differentiation
aDVANCE ONLINE PUBLICATION nature immunology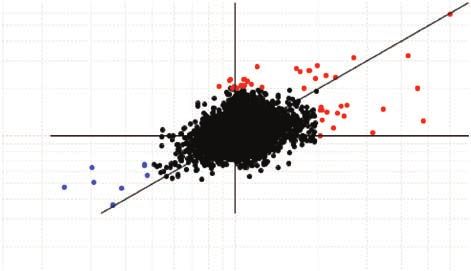
resource
a Lm-OVA VSV-OVA b
Time (d) 0 6 8 10 15 45 100 0 5 6 8 15 45 100
Lm-OVA versus VSV-OVA
Expansion Peak Contraction Day 15 Memory Late memory
Expression
(Lm-OVA)
4
18 16 25
18 149 16 16 32 25
149 16 32
10
69 72 65 54 74 57
103
102
69 72 65 54 74 57
102 103 10
4
Expression (VSV-OVA)
–3.0 3.0
Relative expression
c d e
MFI 1,612 MFI 193 MFI 875 I 0.089 ± 0.031
i ii iii Klrg1
Gpr114 Klra3
II 0.155 ± 0.009**
Lm-OVA 0.270 ± 0.093
Expression (fold)
Expression (fold)
III
(memory cells)
Aqp9
17 2 0.048 ± 0.089
(VSV-OVA)
2 IV
1.5
Events (% of max)
iv v Satb1
V 0.247 ± 0.011**
Ctla4 VI –0.207 ± 0.063
vi MFI 5,477 MFI 443 MFI 903
0.5 VII 0.014 ± 0.010
Car2 0.5 –0.162 ± 0.011
VSV-OVA VIII
Pdcd1 3.4 9.8 IX –0.303 ± 0.078*
vii viii ix X –0.249 ± 0.033*
0.2 5 0.2 5
2 3 4 5
10 10 10 10
Expression (fold) Expression (fold)
CTLA-4 PD-1 KLRG1
(effector cells) (Lm-OVA)
© 2013 Nature America, Inc. All rights reserved.
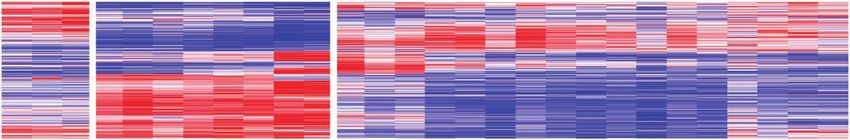
Figure 5 Regulation of genes associated with activation state is independent of infection. (a) Heat map of all genes upregulated or downregulated
more than twofold in pooled effector cells relative to their expression in pooled memory cells during infection with Lm-OVA (LM) or VSV-OVA (VSV) at
matching effector or memory time points (above plots). (b) Direct comparison of expression at each time point after infection with Lm-OVA or VSV-OVA;
numbers in top left and bottom right corners indicate number of genes with difference in expression of over twofold (blue lines as in Fig. 4a).
(c) Change in gene expression after infection with Lm-OVA versus VSV-OVA at pooled effector time points (horizontal axis) versus that at pooled memory
time points (vertical axis); red, genes upregulated after infection with Lm-OVA; blue, genes upregulated after infection with VSV-OVA; labels indicate
infection-specific genes of interest. (d) Flow cytometry of OT-I CD8+ cells at day 6 of Lm-OVA infection or day 5 of VSV-OVA infection; numbers at
top indicate median fluorescent intensity (MFI); numbers above bracketed lines indicate percent CTLA-4 + cells (left) or KLRG1+ cells (right) in gated
populations. (e) Comparison of gene expression by pooled effector cells versus pooled memory cells after infection with Lm-OVA (horizontal axis) versus
that comparison after infection with VSV-OVA (presented as in Fig. 4b). *P < 0.001 and **P < 0.00001 (t-test). Data are from three independent
experiments with three mice (a–c,e) or four mice (d) per group.
or functional pathways conserved in activated CD8+ T cells and center B cells, an activated population. Conversely, we found strong
other lineages (Fig. 6a). We defined ‘enrichment’ as the fraction of correlations in certain subsets of cells known to have ‘memory-like’
genes with a change in expression of over onefold. In confirmation traits, notably NKT cells and γδ T cells. NKT cells and CD8+ memory
of the validity of this approach, comparisons of germinal center and T cells share a dependence on IL-15 for survival and homeostasis,
marginal zone B cells with follicular B cells showed very little cor- rapid production of cytokines such as interferon-γ, cytolytic ability,
relation with any memory or effector-like clusters, whereas genes in expression of activation markers such as CD44, and the ability to rap-
clusters II and III (mostly encoding molecules involved in division idly respond to their cognate antigen. Thus, we might have expected
and proliferation) had a significant bias for presence in germinal all NKT cells to demonstrate a strong bias with our memory-specific
+
+
a b
4
4
NK
D
D
C
C
NK MCMV day 1
vs
vs
NK MCMV day 7
en
en
+
–
ll
ll
NK mem
ce
le
le
2
ce
2
IEL or NK
γδ
sp
γδ
sp
B
OT-I naive
B
+
–
vs
vs
l
ll
ol
4
4
+
–
OT-I day 6
fo
D
D
.f
δ2
δ2
C
C
vs
vs
OT-I day 8
tγ
tγ
KT
KT
C
Z
Ac
Ac
OT-I day 10
M
G
N
N
CD8+ (day 8) OT-I day 15
Early & late mem 0.38 0.46 0.92 0.7 0.92 1* NK
0.38 0.5 0.8 OT-I day 45
Early mem 1* 0.88 1
CD8+ (day 10 or 15) OT-I day 100
Late mem 0.57 0.43 0.86 0.6 0.86 1 CD8+ (day 6)
NKT 44–1.1– thy
PC 2
I 0.5 0.61 0.82* 0.82* 0.68 0.54 NKT 44+1.1–thy
NKT
II 0.89* 0.64* 0.15* 0.41* 0.21* 0.2* NKT NKT 44+1.1+ thy
III 0.99* 0.62* 0.87* 0.88* 0.86* 0.62* CD8 mem + NKT 4+ spl
IV 0.24* 0.51 0.15* 0.18* 0.14* 0.1* NKT 4– spl
0.59 0.25* NKT Thy Tγδ Spl NKT 4+ liver
V 0.83* 0.03* 0.13* 0.12*
Clusters NKT 4– liver
VI 0.45 0.62 0.98* 0.94* 1* 0.92* Tγδ thy
VII 0.21* 0.47 0.33* 0.23* 0.38 0.56 Tγδ spl
VIII 0.22* 0.31* 0.58 0.39* 0.44 0.64* Tγδ Thy CD8+ naive Tγδ Vγ2–
Correlation 0.62 0.68* 0.74* 0.66 Act Tγδ
IX 0.8* 0.77*
Tγδ Vγ2+
X 0.34* 0.48 0.88* 0.75* 0.89* 0.97* IEL act
1.0 0.50 0 PC 1
IEL
Figure 6 Genes induced in CD8+ memory T cells correlate with gene expression by NKT cells and activated γδ T cells. (a) Heat map of the frequency
of enrichment for CD8+ T cell gene clusters (Fig. 1c) or memory-specific genes (Fig. 1d) in populations of B cells, NKT cells and γδ T cells.
Red and blue (key) indicate cluster comparisons with the highest and lowest frequency of correlation (25%): red, higher frequency (>0.75); blue,
lower frequency (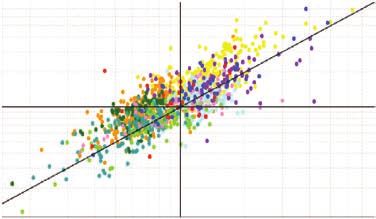
resource
gene sets generated above (Fig. 1d). However, the only population e ffector phenotype by inducing the transcription factor T-bet19; it is
that showed significant bias toward expression of the ‘memory spe- likely other receptor-ligand pairs identified in our analyses have simi-
cific’ genes was splenic CD4− NKT cells, compared with resting CD4+ larly important roles in differentiation and memory formation.
T cells (Fig. 6a). This supported the idea that NKT cells bridge the Our analyses allowed a broad, unbiased look at gene-expression
gap between innate and adaptive immune responses. In contrast to and regulatory networks involved in T cell activation. For example,
other comparisons, which showed bias in only a few clusters, activated consistent with published work, we identified the products of Id2,
Vγ2+ and Vγ2− γδ T cells showed highly significant bias for early and Prdm1, Stat4 and Tbx21 as potential regulators of cluster IV, which
late memory gene sets, compared with resting γδ T cells. is one of the clusters mostly closely associated with terminally dif-
To address those similarities further, we used principal-component ferentiated effector cells34. Our data identified RORα (clusters I, VI
analysis to visualize the variation among different innate subsets and and X) as an additional potential regulator of CD8+ effector cells,
memory T cells (Fig. 6b). We found that NKT cells mapped near which is notable, as RORα expression is upregulated after antigen
memory T cells as well as γδ T cells, whereas NK cells, intraepithelial exposure, particularly at the peak of infection, and is important for the
lymphocytes and effector CD8+ T cells mapped together. Notably, the STAT3-dependant differentiation of CD4+ cells of the TH17 subset of
‘memory’ NK cell population did not group with the CD8+ memory helper T cells35. Notably, we identified the E proteins E2A (Tcf3; also
populations in particular, which indicated that antigen-experienced known as Tcfe2a ) and E2-2 (Tcf4) as potential repressors of clusters
NK cells were more similar to NK cell and CD8+ effector T cell popu- IV and VIII, which include genes expressed in naive and late effector-
lations than to any of the memory populations analyzed. Together memory populations. Conversely, we identified Id2, ZEB1 and ZEB2,
these data suggested that NKT cells and γδ T cells may share aspects which all may inhibit later E-protein activity, as predicted activators of
of their transcriptional profile, as well as functional characteristics, clusters I, VI, VIII, IX and X. By parsing genes expressed during CD8+
with CD8+ memory cells, whereas the gene-expression signature of T cell activation into clusters of common kinetic expression, we found
© 2013 Nature America, Inc. All rights reserved.
CD8+ effector T cells may be more similar to that of innate effector many regulators potentially used to activate and/or repress multiple
cells, including NK cells and intraepithelial lymphocytes. clusters. For example, we identified T-bet as an activator of clusters
I, VII, VIII, IX and X but a repressor of cluster IV, which suggests its
DISCUSSION activity may serve not only to promote effector and effector-memory
Through the use of high-resolution microarray analyses, we sought to differentiation programs but also to repress naive and late-memory
better understand the complexities of gene-expression changes during gene-expression signatures. Thus, we believe this strategy for identify-
the course of infection, covering a range of CD8+ T cell–activation ing potential regulators of transcriptional signatures holds promise
states from early after activation to late memory. Using this data set, and will facilitate the elucidation of complex transcriptional networks
we identified clusters of genes with similar expression patterns, which that control the differentiation of effector and memory T cells at vari-
allowed us to visualize core transcriptional changes during the immune ous points in the immune response. The results of our study have
response. By comparing the response of CD8+ T cells to model antigens established a comprehensive transcriptional view of CD8+ T cell acti-
from bacterial and viral infections, we concluded that the transcrip- vation, identifying new pathways and genes to be investigated in the
tional program governing effector and memory CD8+ T cell differen- context of CD8+ immunity. The data set of the ImmGen Project and
tiation is not necessarily tailored for viral versus bacterial pathogens, the identification and establishment of canonical gene clusters associ-
despite substantially different infection contexts. Furthermore, we ated with different stages of CD8+ T cell activation and differentiation
found that monoclonal populations of CD8+ T cells with transgenic provides a platform for future studies.
expression of the TCR underwent differentiation events very similar
to those of their endogenous polyclonal counterparts, which provided Methods
previously unavailable confirmation of the biological relevance of Methods and any associated references are available in the online
transgenic experimental models widely used in immunology. Together version of the paper.
these data provide valuable insight into the transcriptional mecha-
nisms of T cell activation and identify putative regulators of CD8+ Accession codes. GEO: microarray data, GSE15907.
T cell responses, which offers a resource to the community.
Note: Supplementary information is available in the online version of the paper.
The ten clusters in our analysis allowed us to correlate changes in
gene expression with progressive stages of T cell activation and to iden- Acknowledgments
tify, through evidence of coordinated regulation, previously unknown We thank eBioscience, Affymetrix and Expression Analysis for support of the
biological processes that operate during each stage. These clusters fit ImmGen Project. Supported by the US National Institutes of Health (AI072117 and
the present knowledge of gene expression and describe several known AI067545 to A.W.G.; T32 AI060536 to J.A.B.; PN2 EY016586 to D.A.B. and M.L.D.;
P30 CA016087 for cell sorting; and R24 AI072073 (National Institute of Allergy
biological pathways in activated CD8+ T cells but, notably, we iden- and Infectious Diseases) to the ImmGen Consortium), the Pew Scholars program
tified many additional genes with characteristic expression kinetics (A.W.G.) and the Cancer Research Institute (A.W.G. and V.M.).
during infection. One unexpected result was the prevalence of genes
with strong neuronal association in cluster IV and memory-specific AUTHOR CONTRIBUTIONS
J.A.B. did experiments, designed studies, analyzed data and wrote the manuscript;
gene sets (Nsg2, Cnr2, Cnrip1 and Prss12). Some of those genes, such
J.K. sorted cell subsets and analyzed data; A.D. analyzed data and edited the
as Cnr2, encode molecules with immunosuppressive effects in mac- manuscript; D.A.B., V.M. and M.L.D. designed and did early infection experiments,
rophages32 and might have a role in maintaining homeostasis in naive analyzed data and contributed to writing the manuscript; E.Y. sorted cell subsets;
and memory T cells. Similarly, members of the Schlafen 5 subfamily and A.W.G. designed studies, analyzed data and wrote the manuscript.
curb proliferation when expressed in T cells33. Many members of the
COMPETING FINANCIAL INTERESTS
S1P receptor family were also expressed, in addition to the proin- The authors declare no competing financial interests.
flammatory molecule IL-12Rβ and the prosurvival chemokine recep-
tor CX3CR1. The identification of IL-12Rβ was not unexpected, as Reprints and permissions information is available online at http://www.nature.com/
IL-12 is known to drive CD8+ T cells toward a terminally differentiated reprints/index.html.
aDVANCE ONLINE PUBLICATION nature immunology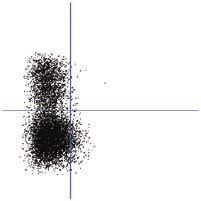
resource

                                                   1. Heng, T.S. & Painter, M.W. The Immunological Genome Project: networks of gene                 19. Joshi, N.S. et al. Inflammation directs memory precursor and short-lived effector
                                                       expression in immune cells. Nat. Immunol. 9, 1091–1094 (2008).                                   CD8+ T cell fates via the graded expression of T-bet transcription factor. Immunity 27,
                                                   2. Haining, W.N. et al. Identification of an evolutionarily conserved transcriptional                281–295 (2007).
                                                       signature of CD8 memory differentiation that is shared by T and B cells. J. Immunol.         20. Rutishauser, R.L. et al. Transcriptional repressor Blimp-1 promotes CD8+ T cell
                                                       181, 1859–1868 (2008).                                                                           terminal differentiation and represses the acquisition of central memory T cell
                                                   3. Kaech, S.M., Hemby, S., Kersh, E. & Ahmed, R. Molecular and functional profiling                  properties. Immunity 31, 296–308 (2009).
                                                       of memory CD8 T cell differentiation. Cell 111, 837–851 (2002).                              21. Kaech, S.M. et al. Selective expression of the interleukin 7 receptor identifies
                                                   4. Sarkar, S. et al. Functional and genomic profiling of effector CD8 T cell subsets                 effector CD8 T cells that give rise to long-lived memory cells. Nat. Immunol. 4,
                                                       with distinct memory fates. J. Exp. Med. 205, 625–640 (2008).                                    1191–1198 (2003).
                                                   5. Wirth, T.C. et al. Repetitive antigen stimulation induces stepwise transcriptome              22. Schluns, K.S., Kieper, W.C., Jameson, S.C. & Lefrancois, L. Interleukin-7 mediates
                                                       diversification but preserves a core signature of memory CD8+ T cell differentiation.            the homeostasis of naive and memory CD8 T cells in vivo. Nat. Immunol. 1,
                                                       Immunity 33, 128–140 (2010).                                                                     426–432 (2000).
                                                   6. Kaech, S.M. & Ahmed, R. Memory CD8+ T cell differentiation: initial antigen                   23. Huster, K.M. et al. Selective expression of IL-7 receptor on memory T cells identifies
                                                       encounter triggers a developmental program in naive cells. Nat. Immunol. 2, 415–422              early CD40L-dependent generation of distinct CD8+ memory T cell subsets. Proc.
                                                       (2001).                                                                                          Natl. Acad. Sci. USA 101, 5610–5615 (2004).
                                                   7. Busch, D.H., Kerksiek, K.M. & Pamer, E.G. Differing roles of inflammation and                 24. Yang, C.Y. et al. The transcriptional regulators Id2 and Id3 control the formation
                                                       antigen in T cell proliferation and memory generation. J. Immunol. 164, 4063–4070                of distinct memory CD8+ T cell subsets. Nat. Immunol. 12, 1221–1229 (2011).
                                                       (2000).                                                                                      25. Cannarile, M.A. et al. Transcriptional regulator Id2 mediates CD8+ T cell immunity.
                                                   8. Badovinac, V.P., Haring, J.S. & Harty, J.T. Initial T cell receptor transgenic cell               Nat. Immunol. 7, 1317–1325 (2006).
                                                       precursor frequency dictates critical aspects of the CD8+ T cell response to infection.      26. D’Cruz, L.M., Lind, K.C., Wu, B.B., Fujimoto, J.K. & Goldrath, A.W. Loss of E protein
                                                       Immunity 26, 827–841 (2007).                                                                     transcription factors E2A and HEB delays memory-precursor formation during the
                                                   9. Haluszczak, C. et al. The antigen-specific CD8+ T cell repertoire in unimmunized                  CD8+ T-cell immune response. Eur. J. Immunol. 8, 2031–2041 (2012).
                                                       mice includes memory phenotype cells bearing markers of homeostatic expansion.               27. Harty, J.T. & Badovinac, V.P. Shaping and reshaping CD8+ T-cell memory. Nat. Rev.
                                                       J. Exp. Med. 206, 435–448 (2009).                                                                Immunol. 8, 107–119 (2008).
                                                   10. Yamada, T., Park, C.S., Mamonkin, M. & Lacorazza, H.D. Transcription factor ELF4             28. Obar, J.J., Khanna, K.M. & Lefrancois, L. Endogenous naive CD8+ T cell precursor
                                                       controls the proliferation and homing of CD8+ T cells via the Kruppel-like factors               frequency regulates primary and memory responses to infection. Immunity 28,
                                                       KLF4 and KLF2. Nat. Immunol. 10, 618–626 (2009).                                                 859–869 (2008).
© 2013 Nature America, Inc. All rights reserved.

                                                   11. Beuneu, H. et al. Visualizing the functional diversification of CD8+ T cell responses        29. Obar, J.J. et al. Pathogen-induced inflammatory environment controls effector and
                                                       in lymph nodes. Immunity 33, 412–423 (2010).                                                     memory CD8+ T cell differentiation. J. Immunol. 187, 4967–4978 (2011).
                                                   12. Grayson, J.M., Zajac, A.J., Altman, J.D. & Ahmed, R. Cutting edge: increased                 30. Marzo, A.L. et al. Initial T cell frequency dictates memory CD8+ T cell lineage
                                                       expression of Bcl-2 in antigen-specific memory CD8+ T cells. J. Immunol. 164,                    commitment. Nat. Immunol. 6, 793–799 (2005).
                                                       3950–3954 (2000).                                                                            31. Agarwal, P. et al. Gene regulation and chromatin remodeling by IL-12 and type I
                                                   13. Gründemann, C. et al. Cutting edge: identification of E-cadherin as a ligand for the             IFN in programming for CD8 T cell effector function and memory. J. Immunol. 183,
                                                       murine killer cell lectin-like receptor G1. J. Immunol. 176, 1311–1315 (2006).                   1695–1704 (2009).
                                                   14. Dietz, S.B., Whitaker-Menezes, D. & Lessin, S.R. The role of αEβ7 integrin (CD103)           32. Sacerdote, P., Massi, P., Panerai, A.E. & Parolaro, D. In vivo and in vitro treatment
                                                       and E-cadherin in epidermotropism in cutaneous T-cell lymphoma. J. Cutan. Pathol. 23,            with the synthetic cannabinoid CP55, 940 decreases the in vitro migration of
                                                       312–318 (1996).                                                                                  macrophages in the rat: involvement of both CB1 and CB2 receptors.
                                                   15. Pearce, E.L. et al. Enhancing CD8 T-cell memory by modulating fatty acid                         J. Neuroimmunol. 109, 155–163 (2000).
                                                       metabolism. Nature 460, 103–107 (2009).                                                      33. Geserick, P., Kaiser, F., Klemm, U., Kaufmann, S.H. & Zerrahn, J. Modulation of
                                                   16. Araki, K. et al. mTOR regulates memory CD8 T-cell differentiation. Nature 460,                   T cell development and activation by novel members of the Schlafen (slfn) gene
                                                       108–112 (2009).                                                                                  family harbouring an RNA helicase-like motif. Int. Immunol. 16, 1535–1548
                                                   17. van der Windt, G.J. et al. Mitochondrial respiratory capacity is a critical regulator            (2004).
                                                       of CD8+ T cell memory development. Immunity 36, 68–78 (2012).                                34. Kallies, A. Distinct regulation of effector and memory T-cell differentiation. Immunol.
                                                   18. Gautier, E.L. et al. Gene-expression profiles and transcriptional regulatory pathways that       Cell Biol. 86, 325–332 (2008).
                                                       underlie the identity and diversity of mouse tissue macrophages. Nat. Immunol. 13,           35. Sundrud, M.S. & Rao, A. Regulation of T helper 17 differentiation by orphan nuclear
                                                       1118–1128 (2012).                                                                                receptors: it’s not just RORγt anymore. Immunity 28, 5–7 (2008).

                                                   ImmGen Project Consortium:
                                                   Paul Monach4, Susan A Shinton5, Richard R Hardy5, Radu Jianu6, David Koller6, Jim Collins7, Roi Gazit8,
                                                   Brian S Garrison8, Derrick J Rossi8, Kavitha Narayan9, Katelyn Sylvia9, Joonsoo Kang9, Anne Fletcher10,
                                                   Kutlu Elpek10, Angelique Bellemare-Pelletier10, Deepali Malhotra10, Shannon Turley10, J Adam Best1,
                                                   Jamie Knell1, Ananda W Goldrath1, Vladimir Jojic11, Daphne Koller11, Tal Shay12, Aviv Regev12, Nadia Cohen13,
                                                   Patrick Brennan13, Michael Brenner13, Taras Kreslavsky13, Natalie A Bezman14, Joseph C Sun14,
                                                   Charlie C Kim14, Lewis L Lanier14, Jennifer Miller15, Brian Brown15, Miriam Merad15, Emmanuel L Gautier15,16,
                                                   Claudia Jakubzick15, Gwendalyn J Randolph15,16, Francis Kim17, Tata Nageswara Rao17, Amy Wagers17,
                                                   Tracy Heng18, Michio Painter18, Jeffrey Ericson18, Scott Davis18, Ayla Ergun18, Michael Mingueneau18,
                                                   Diane Mathis18 & Christophe Benoist18

                                                   4Department  of Medicine, Boston University, Boston, Massachusetts, USA. 5Fox Chase Cancer Center, Philadelphia, Pennsylvania, USA. 6Computer Science
                                                   Department, Brown University, Providence, Rhode Island, USA. 7Department of Biomedical Engineering, Howard Hughes Medical Institute, Boston University, Boston,
                                                   Massachusetts, USA. 8Immune Diseases Institute, Children’s Hospital, Boston, Massachusetts, USA. 9Department of Pathology, University of Massachusetts Medical
                                                   School, Worcester, Massachusetts, USA. 10Dana-Farber Cancer Institute and Harvard Medical School, Boston, Massachusetts, USA. 11Computer Science Department,
                                                   Stanford University, Stanford, California, USA. 12Broad Institute, Cambridge, Massachusetts, USA. 13Division of Rheumatology, Immunology and Allergy, Brigham and
                                                   Women’s Hospital, Boston, Massachusetts, USA. 14Department of Microbiology & Immunology, University of California San Francisco, San Francisco, California, USA.
                                                   15Icahn Medical Institute, Mount Sinai Hospital, New York, New York, USA. 16Department of Pathology & Immunology, Washington University, St. Louis, Missouri,

                                                   USA. 17Joslin Diabetes Center, Boston, Massachusetts, USA. 18Division of Immunology, Department of Microbiology & Immunobiology, Harvard Medical School,
                                                   Boston, Massachusetts, USA.

nature immunology aDVANCE ONLINE PUBLICATION 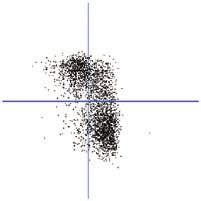
You can also read