Inhibition of the Sodium-Potassium-Chloride Cotransporter Isoform-1 Reduces Glioma Invasion
←
→
Page content transcription
If your browser does not render page correctly, please read the page content below
Published OnlineFirst June 22, 2010; DOI: 10.1158/0008-5472.CAN-09-4666

Tumor and Stem Cell Biology
                                                                                                                        Cancer
                                                                                                                      Research
Inhibition of the Sodium-Potassium-Chloride Cotransporter
Isoform-1 Reduces Glioma Invasion
Brian R. Haas and Harald Sontheimer

Abstract
             Malignant gliomas metastasize throughout the brain by infiltrative cell migration into peritumoral areas.
          Invading cells undergo profound changes in cell shape and volume as they navigate extracellular spaces along
          blood vessels and white matter tracts. Volume changes are aided by the concerted release of osmotically active
          ions, most notably K+ and Cl−. Their efflux through ion channels along with obligated water causes rapid cell
          shrinkage. Suitable ionic gradients must be established and maintained through the activity of ion transport
          systems. Here, we show that the Sodium-Potassium-Chloride Cotransporter Isoform-1 (NKCC1) provides the
          major pathway for Cl− accumulation in glioma cells. NKCC1 localizes to the leading edge of invading process-
          es, and pharmacologic inhibition using the loop diuretic bumetanide inhibits in vitro Transwell migration by
          25% to 50%. Short hairpin RNA knockdowns of NKCC1 yielded a similar inhibition and a loss of bumetanide-
          sensitive cell volume regulation. A loss of NKCC1 function did not affect cell motility in two-dimensional
          assays lacking spatial constraints but manifested only when cells had to undergo volume changes during mi-
          gration. Intracranial implantation of human gliomas into severe combined immunodeficient mice showed a
          marked reduction in cell invasion when NKCC1 function was disrupted genetically or by twice daily injection
          of the Food and Drug Administration–approved NKCC1 inhibitor Bumex. These data support the consideration
          of Bumex as adjuvant therapy for patients with high-grade gliomas. Cancer Res; 70(13); 5597–606. ©2010 AACR.

Introduction                                                         to Na+/K+-ATPase activity, cytoplasmic [K+] is high, creating
                                                                     an outward gradient for K+ in most living cells. However, this
   Among the most difficult cancers to treat, gliomas are pri-       is not true for Cl− ions. Indeed, most neurons do not main-
mary brain tumors derived from glial cells. Their unusual            tain a significant gradient for Cl− ions, which instead are
propensity to diffusely invade surrounding brain makes com-          thought to be distributed at equilibrium. Recent studies eval-
plete surgical resection impossible (1). Unlike other cancers,       uating immature neurons, astrocytes, and gliomas concluded
which spread hematogenously, gliomas actively migrate                that Cl − ions accumulate intracellularly, establishing an
along blood vessels or white matter tracts (2). The narrow           outwardly directed gradient for Cl−. Direct measurements us-
extracellular spaces require invading glioma cells to undergo        ing Cl−–specific indicators suggest that Cl− concentrations
dynamic changes in cell shape and volume, which has been             may be as high as 100 mmol/L in immature neurons (9),
suggested to be accomplished partially by ion channel activ-         40 mmol/L in astrocytes (10), but only around 6 to 10
ity (3, 4). It has been postulated that invading tumor cells         mmol/L in mature neurons (11). In immature neurons, this
may shrink their leading processes while moving into narrow          explains why the activation of γ-aminobutyric acid–gated Cl−
spaces by coordinating the release of K+ and Cl− along with          channels causes depolarization of the cell membrane. We re-
osmotically obligated water. These ions may be released              cently showed that Cl− is maintained ∼100 mmol/L in glioma
through ion channels or transporters; research on glioma             cells (12) and that the electrochemical gradient for Cl− pro-
cells suggests that invading glioma cells primarily use ion          vides the energetic driving force for cell shrinkage as cells
channels for this process (5–8). Therefore, cells must estab-        invade (12). The high intracellular [Cl−] in gliomas is proba-
lish and maintain suitable ionic gradients for K+ and Cl−. Due       bly achieved through the action of the Sodium-Potassium-
                                                                     Chloride Cotransporter Isform 1 (NKCC1; ref. 13). NKCC1 is
                                                                     ubiquitously expressed in most tissue types, aiding in cell vol-
Authors' Affiliation: Department of Neurobiology, Center for Glial   ume regulation (14). It couples the influx of Na+, K+, and 2Cl−,
Biol ogy i n Medi cine, Uni versity o f A lab ama at Bir mingham,
Birmingham, Alabama                                                  using the inward gradient for Na+ for the uphill transport of
                                                                     two Cl−. NKCC1 is sensitive to bumetanide, a loop diuretic,
Note: Supplementary data for this article are available at Cancer
Research Online (http://cancerres.aacrjournals.org/).                used under the trade name Bumex, for the treatment of
Corresponding Author: Harald Sontheimer, 1719 6th Avenue South,      patients with severe renal failure (15–17).
CIRC 425, Birmingham, AL 35294. Phone: 205-975-5805; Fax: 205-          In this study, we investigate the contribution of NKCC1 to
975-6320; E-mail: sontheimer@uab.edu.                                glioma cell migration and invasion hypothesizing that
doi: 10.1158/0008-5472.CAN-09-4666                                   NKCC1 activity establishes a gradient for Cl− necessary to
©2010 American Association for Cancer Research.                      support cell volume changes required of invading glioma

www.aacrjournals.org                                                                                                                    5597

      Downloaded from cancerres.aacrjournals.org on February 1, 2021. © 2010 American Association for Cancer
                                                    Research.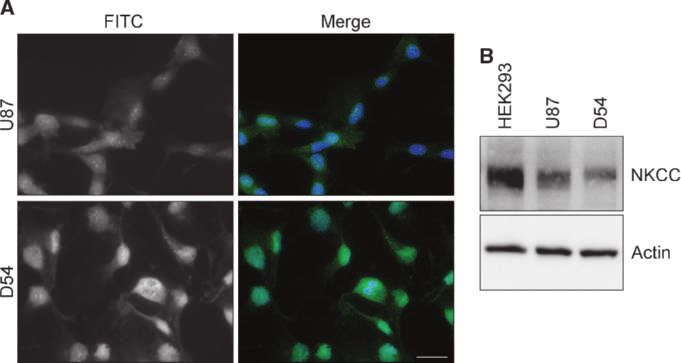
Published OnlineFirst June 22, 2010; DOI: 10.1158/0008-5472.CAN-09-4666

       Haas and Sontheimer

       cells. Under conditions mimicking the spatial constraints       serum in PBS and incubated overnight at 4°C. After washing
       encountered in vivo, we show that NKCC1 localizes to the        with PBS, FITC-conjugated goat anti-rabbit secondary anti-
       leading edges of migrating cells and pharmacologic inhibi-      bodies (Molecular Probes) were diluted 1:500 in blocking
       tion of NKCC1 with the loop diuretic, bumetanide, reduces       buffer and incubated for 1 hour in the dark. Cells were
       glioma cell migration. Furthermore, we show that the genetic    washed twice with PBS, incubated with 4′,6-diamidino-2-
       knockdown of NKCC1, using short hairpin RNA (shRNA) con-        phenylindole (DAPI) 1:2,000 in PBS, and washed once with
       structs, inhibits cellular volume regulation and eliminates     PBS. Coverslips were mounted on glass slides with Gel
       bumetanide-sensitive migration. Implantation of human gli-      Mount aqueous mounting medium (Sigma). Fluorescent
       oma cells into immunocompromised severe combined im-            images were acquired with a Zeiss Axiovert 200 M using a
       munodeficient (SCID) mice shows significantly reduced           ×63 oil immersion lens.
       cellular invasion in animals chronically treated with bumeta-
       nide or implanted with NKCC1 knockdown cells. These data        Transwell migration assays
       suggest the Food and Drug Administration (FDA)–approved            As prior studies (12), 8.0- or 3.0-μm pore polyethylene ter-
       loop diuretic bumetanide or related compounds could be          aphthalate track-etched membrane cell culture inserts (BD
       considered for clinical use in patients with invasive malig-    Biosciences) were prepared, and cells were allowed 5 or 12
       nant gliomas.                                                   hours (8.0- and 3.0-μm pore sizes, respectively) to migrate in
                                                                       the presence or absence of bumetanide. Five random fields
       Materials and Methods                                           per insert were imaged at ×20 magnification on a Zeiss
                                                                       Axiovert 200M. Migrated cells were counted using ImageJ
       Cell culture                                                    (NIH Image, NIH). To visualize NKCC1 localization, migrat-
          Experiments were performed using glioma cell lines D54-      ing D54 cells were fixed, stained, and imaged as previously
       MG (glioblastoma multiforme, WHO grade IV; Dr. D. Bigner,       described (20) with a ×40 air objective. Digital zooms of a
       Duke University, Durham, NC) and U87-MG [glioblastoma           single cell were taken at 0.5-μm steps for a total of 61 images
       multiforme, WHO grade IV, American Type Culture Collec-         (30.5 μm) and 76 images (38 μm) for the leading and lagging
       tion (ATCC), passaged < 4 mo]. The D54 line has not recently    edges, respectively.
       been authenticated. Cell cultures were maintained in
       DMEM/F12 (Invitrogen), supplemented with 2 mmol/L L-            Two-dimensional scratch/migration assay
       glutamine (CellGro) and 7% fetal bovine serum (FBS; Aleken         D54 or U87 glioma cells were grown to a confluent mono-
       Biologicals). Glioma cells were kept at 37°C in a 90% O2/10%    layer, and scratches were made using a 200-μL pipette tip.
       CO2 humidified atmosphere. HEK293 cells (ATCC) were main-       Cells recovered and migrated into the wound site for 8 hours
       tained in DMEM with 10% FBS at 37°C in a 95% O2/5% CO2          in the presence or absence of bumetanide. Images were ac-
       humidified atmosphere.                                          quired with at ×10 magnification with a Zeiss Axiovert 200M
                                                                       at 0 and 8 hours. The scratch area was measured using
       Solutions                                                       ImageJ at both 0 and 8 hours, and quantified as a ratio of
          NaCl bath solution (pH 7.4, osmolarity 310 ± 10 mOsm)        8:0 hours.
       contained the following (in mmol/L): 130 NaCl, 5.0 KCl,
       10.5 glucose, 32.5 HEPES, and 1 CaCl 2. Bumetanide was          Western blot protocol
       added to bath solutions or migration assay buffer from a           Cultured cells were lysed, subjected to SDS-PAGE, and
       1,000 × stock solution. DMSO at its final concentration         transferred to polyvinylidene difluoride paper as previously
       (0.1%) did not disturb cell volumes or affect volume regula-    described (21). Membranes were blocked in a blocking buffer
       tion (data not shown).                                          (5% milk in TBS plus Tween 20) for 1 hour at room temper-
                                                                       ature. Then, the membranes were incubated in primary
       Cell volume measurements and proliferation                      NKCC antibody, which recognizes both isoforms (Develop-
          Cell volumes were measured as previously described (18),     mental Studies Hybridoma Bank) at 1:5,000 in blocking buffer
       by electronic sizing with a Coulter counter Multisizer 3        for 30 minutes at room temperature. The membranes were
       (Beckman-Coulter). Cells were kept at 37°C in bath solution     washed three times for 15 minutes in 5% milk in TBS plus
       during volume regulation experiments. Relative volume           Tween 20 and blocked for 1 hour at room temperature. Blots
       measurements were calculated as a ratio to the average of       were incubated with horseradish peroxidase–conjugated sec-
       five baseline measurements before hyperosmotic challenge.       ondary antibodies (Santa Cruz Biotechnology) for 30 minutes
       Proliferation assays were performed as previously described     at room temperature. After washing, blots were developed
       (19) in the presence or absence of varying concentrations of    with Super Signal West Fempto enhanced chemilumines-
       bumetanide (Sigma) and were measured in triplicate.             cence (Thermo Fisher Scientific) using an Eastman Kodak
                                                                       Image Station 4000 MM (Kodak). NKCC immunoreactivity
       Immunocytochemistry                                             was normalized to actin loading control (Sigma).
          D54-MG (D54) and U87-MG (U87) glioma cells were
       grown and fixed as previously described (19); NKCC1 anti-       ShRNA and control stable cell lines
       body (Millipore) was diluted 1:100 in blocking buffer con-         To knockdown NKCC1 expression, we obtained commer-
       taining 0.1% Triton X-100 in PBS plus 3.3% normal goat          cially available pGIPZ-lentiviral shRNAmir vectors containing

5598   Cancer Res; 70(13) July 1, 2010                                                                            Cancer Research

             Downloaded from cancerres.aacrjournals.org on February 1, 2021. © 2010 American Association for Cancer
                                                           Research.
Published OnlineFirst June 22, 2010; DOI: 10.1158/0008-5472.CAN-09-4666
NKCC1 Inhibition Reduces Glioma Invasion
either a nonsilencing scrambled sequence that does not placed in 4% PFA overnight at 4°C. The PFA was replaced
match any known mammalian genes (NS) or one of five hair- with a 10% sucrose solution in 0.1 mol/L phosphate buffer
pin sequences targeting SLC12A2 (Open Biosystems). The (pH 7.4; phosphate buffer contains 28.34 mmol/L NaH2PO4
hairpin sequences were as follows: and 72.11 mmol/L Na2HPO4) for 1 hour at 4°C. Brains were
NS, 5′-TGCTGTTGACAGTGAGCGATCTCGCTTGG GCG- transferred to a 30% sucrose solution (in phosphate buffer)
AGAG TAAGTA GTGAAGCCACAGATGTACTTACT- at 4°C until the brains sank (∼30 h). Brains were embedded
CTCGCCCAAGCGAGAGTGCCTATGCCTCGGA-3′ in O.C.T. Compound Tissue Tek (Sakura Finetek), sliced on
27, 5′-TGCTGTTGACAGTGAGCGCGGTCTATCAGTCC- a Leica CM 1850 UV cryostat (Leica Microsystems) into
TTGTAATATAGT GAAGCCACAGATGTATATTACAAG- 30-μm serial sections, and placed on Colorfrost/Plus slides
GACTGATAGACCTTGCCTACTGCCTCGGA-3′ (Fisher-Thermo Scientific). Slices were treated to remove
141, 5′-TGCTGTTGACAGTGAGCGCGGCCCTATTGTGC- O.C.T. compound and stained with H&E. Images for analysis
CTTTAAATTAGT GAAGCCACAGATGTAATTTAAAGG- were acquired with Olympus BX51 upright modified with
CACAATAGGGCCTTGCCTACTGCCTCGGA-3′ a LUDL motorized stage using the ×4 objective. Every
382, 5′-TGCTGTTGACAGTGAGCGCCCTTACCTTCTATT- tenth section was analyzed using the Stereo Investigator
CATAAATTAGT GAAGCCACAGATGTAATTTATGAA- software's Cavalieri estimator to calculate tumor volume
TAGAAGGTAAGGATGCCTACTGCCTCGGA-3′ (MBF Bioscience). Fluorescent images of every tenth section
662, 5′-TGCTGTTGACAGTGAGCGACGATGGCTTATTAA- were acquired with the AxioVision 4.6 software (Carl Zeiss)
GAACAAATAG TGAAGCCACAGATGTATTTGTTCT- on a Zeiss Axiovert 200M. The software is equipped with a
TAATAAGCCATCGCTGCCTACTGCCTCGGA-3′ Length tool function allowing the accurate measurement of
690, 5′-TGCTGTTGACAGTGAGCGCGCTTTCCAGATGT- distances in an image. The Length function was used to
TTGCTAAATAGT GAAGCCACAGATGTATTTAGCAAA- measure tumor invasion distance from the edge of the
CATCTGGAAAGCTTGCCTACTGCCTCGGA-3′. tumor mass.
D54 cells were transfected using the Amaxa Biosystems
nucleofection technique, as previously detailed (22). Statistical analysis
For all experiments, raw data were analyzed and
In vivo animal studies graphed using the Origin 7.5 software (Microcal Software),
All animal experiments were approved and in accordance and appropriate statistical tests were chosen according to
with the Institutional Animal Care and Use Committee of the data analyzed using GraphPad Instat (GraphPad Soft-
the University of Alabama at Birmingham. Tumor cells ware). Unless otherwise stated, all data are reported with
(5 × 10⁵) were stereotactically injected at a 2.5-mm depth, SEM and *, **, or *** indicate P < 0.05, P < 0.01, or P <
2.0 to 2.5 mm left of midline, and 2.0 to 2.5 mm posterior to 0.001, respectively.
bregma into female C.B.-17 SCID mice, ages 6 to 8 weeks, as
previously reported (23). A total of 5 × 10⁵ tumor cells were Results
implanted in two 5-μL injections. Mice were divided into
two treatment groups involving twice daily injections of bu- Bumetanide inhibits glioma migration when
metanide (5.5mg/kg) or vehicle for 3 weeks. For knockdown space is limited
cells, they were prepared as above but without randomized The central hypothesis in this study posits that the NKCC1
treatment groups. Afterwards, the brains were removed and transporter establishes ionic gradients required for rapid cell
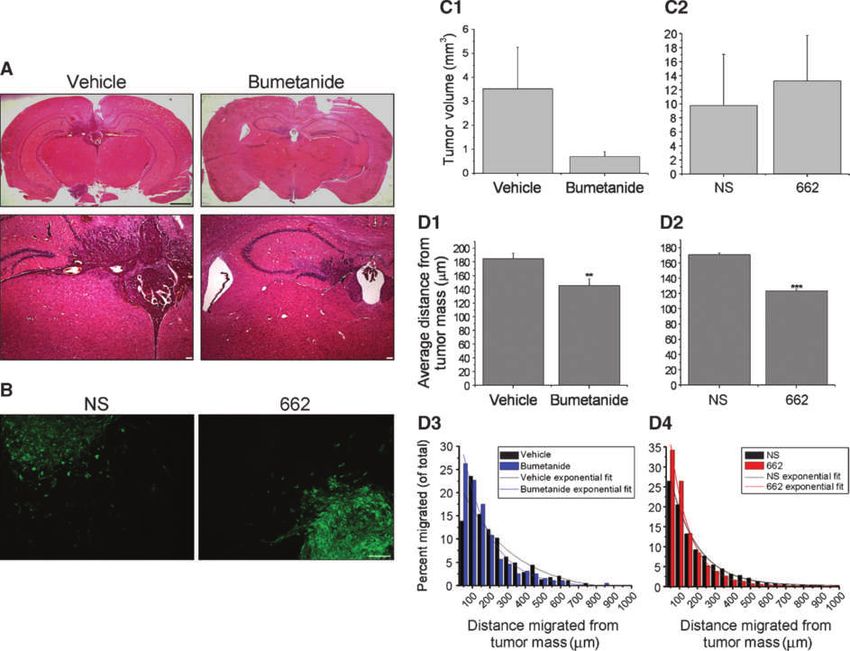
Figure 1. NKCC1 is expressed
in several glioma cell lines.
A, immunofluorescent images of
D54 and U87 glioma cells labeled
with an antibody against NKCC1.
The staining was repeated in
triplicate three independent
times. Scale bar, 20 μm.
B, example Western blot showing
NKCC expression in whole-cell
lysates of HEK293 (positive
control), U87, and D54 cell lines
with actin serving as a loading
control. Full-length blots are
presented in Supplementary
Fig. S1.
www.aacrjournals.org Cancer Res; 70(13) July 1, 2010 5599
Downloaded from cancerres.aacrjournals.org on February 1, 2021. © 2010 American Association for Cancer
Research.Published OnlineFirst June 22, 2010; DOI: 10.1158/0008-5472.CAN-09-4666
Haas and Sontheimer
Figure 2. Inhibition of NKCC1 with bumetanide reduces three-dimensional migration when space is limited. A, representative differential interference
contrast microscopy images of D54 glioma cells that have migrated through an 8- or 3-μm Transwell barrier, for 5 or 12 h, respectively, with or without
bumetanide. Scale bar, 50 μm. B, B1, quantification of D54 glioma cell relative percent migration of on 8- and 3-μm pore Transwell barriers.
B2, quantification of U87 glioma cell relative percent migration on 8- and 3-μm pore Transwell barriers. Unpaired t test for 8- and 3-μm pore Transwells.
Experiments were performed in triplicate and repeated five independent times. C, representative images of U87 glioma cells at 0 and 8 h of two-dimensional
migration in the presence or absence of 200 μmol/L bumetanide. Scale bar, 100 μm. D, D1, quantification of percent wound closure for both D54 and
U87. The experiment was performed in duplicate and repeated at least three independent times. Unpaired t test, P > 0.05, for D54 and U87. D2, D54 glioma
cell proliferation in the presence or absence of the NKCC1 inhibitor, bumetanide, at four different concentrations. The experiment was completed in
triplicate and repeated three independent times. One-way ANOVA, P > 0.05.
5600 Cancer Res; 70(13) July 1, 2010 Cancer Research
Downloaded from cancerres.aacrjournals.org on February 1, 2021. © 2010 American Association for Cancer
Research.Published OnlineFirst June 22, 2010; DOI: 10.1158/0008-5472.CAN-09-4666
NKCC1 Inhibition Reduces Glioma Invasion
volume changes that aid the invasion of glioma cells; hence, growth throughout the experiment duration (Fig. 2D2). At
this transporter plays an essential role in glioma invasion. day 4, there was no significant difference in the normalized
To examine this question, we used several cell migration/ cell number across all conditions. These data suggest that
invasion assays in which the efficacy of pharmacologic or ge- NKCC1 inhibition compromises cell invasion across barriers
netic inhibitors of NKCC1 was investigated. We used two without affecting overall cell motility.
common human glioma cell lines, D54 and U87. As illustrat-
ed in Fig. 1, both cell lines showed robust NKCC1 expression NKCC1 localizes to the leading edge of invading
as judged by immunohistochemistry (Fig. 1A) and Western glioma cells
blot analysis (see Supplementary Fig. S1 for full-length blots; For NKCC1 to participate in cell invasion as an influx path-
Fig. 1B). To mimic the spatial constraints of extracellular way for Cl−, it may be advantageous to localize the transport-
brain space, we used 8- or 3-μm pore Transwell migration as- er to cell processes already past spatial constraints and in the
says. U87 and D54 glioma cells were allowed to migrate for 5 process of enlarging their volume. We therefore examined the
or 12 hours (8- or 3-μm pore Transwell, respectively) in the cellular localization of NKCC1 glioma cells fixed in the midst
presence or absence of bumetanide. As exhibited in Fig. 2A, of traversing a Transwell barrier. As depicted in Fig. 3, the
bumetanide significantly inhibited D54 glioma cell migration leading edges/processes of migrating D54 glioma cells
compared with controls through 8- and 3-μm pore Transwell showed colocalization of NKCC1 and phalloidin, whereas
barriers by approximately 25% and 50%, respectively (Fig. 2B1). the lagging parts showed little to no colocalization. Separate
A similar inhibition was found for U87 glioma cells with ∼35% digital magnifications of the boxed area (Fig. 3) highlight the
inhibition of migration across the 8-μm pore Transwell barrier lagging and leading edges. Arrows indicate points at which
and 50% inhibition across the 3-μm pore (Fig. 2B2). the cell is depicted in “three-view” (central panel is x,y; top
Because NKCC1 is important for glioma cells' volume panel is x,z; left panel is z,y). These data suggest that glioma
adjustment in constricted spaces, we would expect migration cells migrating across a Transwell barrier preferentially local-
in an unrestricted environment to be less dependent on ize NKCC1 to the membrane on leading edges of the cell.
NKCC1. To test this, we assessed glioma migration in a
two-dimensional wound closure assay with D54 and U87 gli- Genetic knockdown of NKCC1 eliminates
oma cells. Figure 2C shows example images of U87 glioma bumetanide-sensitive migration
cells taken at 0 and 8 hours, in the presence or absence of Although bumetanide is a fairly selective NKCC inhibitor,
bumetanide. After 8 hours, average wound closure was it has been reported to block some other transporters, most
∼50% in U87 cells and 35% in D54, and importantly, notably, the Potassium-Chloride Cotransporters (KCC;
bumetanide did not alter the wound closure significantly refs. 24–27). Hence, to show that the above effects were
(Fig. 2D1), suggesting that cell motility was unaffected. To due to NKCC1 disruption and not KCC, we suppressed
rule out any antiproliferative effects of bumetanide, D54 cells NKCC1 by stably transfecting D54 glioma cells with lentiviral
were grown for 4 days in varying concentrations of bumeta- vectors expressing five different NKCC1-knockdown shRNAs
nide, 0.2 to 200 μmol/L, which did not alter population (27, 141, 382, 662, and 690), each targeting a different region
Figure 3. NKCC1 localizes to the
membrane on the leading edge of
cells migrating across Transwell
barriers. First row, representative
merged and individual channel
images obtained at ×40. White
box, digital zoom images in the
second and third rows. Second
row, little to no NKCC1 (green) and
phalloidin (red) colocalization on
the lagging edge of a migrating
glioma cell, whereas the leading
edge of the same cell (third row)
shows NKCC1 expression on
the plasma membrane. Blue,
DAPI nuclear stain. Arrows,
cross-sections of cells seen in
three-view through the
imaging plane.
www.aacrjournals.org Cancer Res; 70(13) July 1, 2010 5601
Downloaded from cancerres.aacrjournals.org on February 1, 2021. © 2010 American Association for Cancer
Research.Published OnlineFirst June 22, 2010; DOI: 10.1158/0008-5472.CAN-09-4666
Haas and Sontheimer
Figure 4. Genetic knockdown of NKCC1 has no effect on proliferation but eliminates bumetanide-sensitive migration. A, representative Western blot
of whole-cell lysates of HEK293 (positive control), U87 and D54 glioma cells, and D54 glioma cells stably transfected with NKCC1 knockdowns
(NS, scrambled shRNA; 27, 141, 382, 662, 690, shRNAs each targeting a different portion of the SLC12A2 gene). Actin served as a loading control.
B, quantification of NKCC1-knockdown cell line protein levels normalized to loading controls. Experiments were performed in duplicate and repeated four
independent times. One-way ANOVA, P < 0.001, Tukey-Kramer post hoc test. C, NKCC1-knockdown cell line proliferation during 4 d. Experiments were
performed in triplicate and repeated five independent times. One-way ANOVA, P > 0.05. D, quantification of NKCC1-knockdown cell line relative
percent migration across a 3-μm pore Transwell barrier. Experiments were performed in triplicate and repeated five independent times.
of the SLC12A2 gene, or a scrambled, nonsilencing (NS) lines, 662 and 690, compared with NS cells. NS cell migration
shRNA. To determine whether NKCC1 levels were effectively was inhibited by 50% in the presence of bumetanide over
knocked down, protein levels from whole-cell lysates from 12 hours (Fig. 4D), yet the two knockdown cell lines were bu-
knockdown-transfected cells were compared with NS by metanide insensitive (unpaired t test, P > 0.05). The abolish-
Western blot analysis (Fig. 4A). The NKCC antibody recog- ment of bumetanide-sensitive migration in knockdowns 662
nizes both isoforms, but only NKCC1 has been found in gli- and 690 along with the Western blot analysis is consistent
omas (13). HEK293 cells were used as a positive control as with a loss of functional NKCC1.
they express both NKCC1 and NKCC2. As shown in Fig. 4A,
expression of NKCC was significantly reduced with four of NKCC1 blockade with bumetanide or through genetic
the five NKCC1-knockdown shRNA constructs. After normal- knockdown blocks functional volume regulation
izing to actin, constructs 27, 382, 662, and 690 each reduced We hypothesize that during Transwell migration, cells
NKCC expression by at least 50% compared with NS (Fig. 4B). must regulate their volume to traverse the pores involving
The shRNA construct 141, which failed to decrease NKCC the release of Cl−, K+, and H2O. Once successfully tra-
expression, was not further used. versed, cells utilize NKCC1 to reestablish volume. To mim-
We next examined NKCC1-knockdown lines in biological ic these volume changes, we used an osmotic challenge
assays examining growth, Transwell migration, and bume- (15 mmol/L NaCl) while monitoring cell volume changes
tanide sensitivity. There was no significant difference in cell with a Multisizer-3 Coulter Counter. The ability of glioma
proliferation between NS and all knockdowns (Fig. 4C). We cells to regulate their volume back to baseline after hyper-
then determined the ability of cells to migrate in the pres- osmotic challenge is termed regulatory volume increase
ence or absence of bumetanide. Employing 3-μm pore Trans- (RVI) and was presented in the presence or absence
well barriers, we studied the migration of two knockdown of 200 μmol/L bumetanide at 37°C. Figure 5A shows that
5602 Cancer Res; 70(13) July 1, 2010 Cancer Research
Downloaded from cancerres.aacrjournals.org on February 1, 2021. © 2010 American Association for Cancer
Research.Published OnlineFirst June 22, 2010; DOI: 10.1158/0008-5472.CAN-09-4666
NKCC1 Inhibition Reduces Glioma Invasion
vehicle-treated D54 glioma cells undergo bumetanide-sensi- in vivo by implanting D54 glioma cells stably transfected with
tive RVI, and 40 minutes postchallenge, D54 glioma cells eGFP (D54-eGFP), and either NS or 662, into the brains of
exposed to bumetanide had failed to regulate their volume SCID mice. Tumors were confirmed and visualized in vivo
back to baseline compared with cells exposed to vehicle using an 8.5T magnetic resonance imaging (MRI) and repre-
(Fig. 5A, right). Similarly, RVI in NS cells was completely sentative images (Supplementary Fig. S2) suggest markedly
inhibited by bumetanide, whereas both 662 and 690 knock- reduced tumor sizes after bumetanide treatment. However,
down cells failed to undergo RVI in the presence or ab- the limited spatial resolution of MRI combined with the tu-
sence of bumetanide (Fig. 5B). In Fig. 5B (bottom right), mor metastasis made it impossible to quantitatively assess
the normalized mean cell volumes (MCV), compared tumor volumes by serial MRI. Therefore, we complemented
across all conditions at 40 minutes postchallenge, were sig- these studies by assessing tumor volume with quantitative
nificantly different from NS cells exposed to vehicle but stereology. Slices were stained with H&E, and tumor volumes
not from each other. Together, these data confirm that ge- were determined using the Cavalieri estimator of the Stereo
netic knockdown confers functional inhibition of NKCC1. Investigator software (Fig. 6A). Tumor volumes were highly
variable in vehicle-treated tumors, but smaller and less vari-
Inhibition of NKCC1 by bumetanide or stable able in bumetanide-treated mice. Due to the variability of the
knockdown decreases glioma cell invasion from vehicle-treated group, this difference did not quite reach sta-
tumors implanted into SCID mice tistical significance (P = 0.06; Fig. 6C1). Because our Trans-
After assessing the effects on NKCC1 inhibition on glioma well studies imply NKCC1 functions primarily to aid cell
cells in vitro, we next investigated whether the inhibition of invasion, we determined the glioma cell invasiveness into
NKCC1 would affect glioma cell migration and invasion peritumoral brain by measuring distances migrated from
Figure 5. Functional RVI is inhibited by
NKCC1 blockade with bumetanide or genetic
knockdown. A, left, normalized MCVs
(n = 10,000–20,000 cells) of D54 glioma cells
undergoing RVI after hyperosmotic (15 mmol/L
NaCl) challenge in the presence or absence of
bumetanide. Experiments were performed
four independent times. Right, D54 glioma cell
normalized MCVs at 40 min posthyperosmotic
challenge. B, normalized MCVs for NS, 662,
and 690 lines undergoing RVI after
hyperosmotic challenge in the presence or
absence of bumetanide. Experiments were
performed four (662) or five (NS, 690)
independent times. Bottom right, knockdown
cell line normalized MCVs at 40 min
postchallenge. One-way ANOVA, P < 0.05,
Tukey-Kramer post hoc test.
www.aacrjournals.org Cancer Res; 70(13) July 1, 2010 5603
Downloaded from cancerres.aacrjournals.org on February 1, 2021. © 2010 American Association for Cancer
Research.Published OnlineFirst June 22, 2010; DOI: 10.1158/0008-5472.CAN-09-4666
Haas and Sontheimer
Figure 6. Bumetanide or NKCC1 genetic knockdown inhibits in vivo glioma cell invasion but not tumor size. A, examples of 30-μm brain slices with
xenografted tumor tissue stained with H&E from vehicle- or bumetanide-treated mice. Top, whole brain slice (black scale bar, 1 mm). Bottom, ×4
magnification routinely used for calculating volume (white scale bar, 100 μm). B, immunofluorescent images of NS and 662 tumors in brain slices with cells
that have migrated at various distances away from the main tumor mass. Scale bar, 100 μm. C, quantification in vivo tumor volumes for D54-eGFP tumors
(C1) and NKCC1-knockdowns (C2). Tumor volumes between vehicle-treated (n = 4) and bumetanide-treated (n = 7) tumors (C1), and between NS (n = 7) and
662 (n = 8) tumors (C2) were not significantly different. Unpaired t test, P > 0.05. D, tumor cell average distance migrated from primary tumor mass in
vehicle-treated (n = 390) and bumetanide-treated (n = 194) mice (D1) and knockdowns (D2), NS (n = 4,591) and 662 (n = 4,690). D3, distribution of invaded
D54-eGFP tumor cells from both vehicle- and bumetanide-treated tumors. The decay constants of the exponential fit curves were approximately 295
and 160 for vehicle- and bumetanide-treated groups, respectively. D4, distribution of invaded tumor cells from both NS and 662 tumors. The decay
constants of the exponential fit curves were approximately 154 and 112 for NS and 662, respectively (for full equation values, see Supplementary Table S1).
the primary tumor mass. Using green fluorescent protein spectively (Supplementary Table S1 for equation values),
fluorescence, we acquired images of all visible invading cells with the Origin 7.5 software for comparison. These data sug-
(Fig. 6B). After measuring each invading cell(s) distance, we gest that roughly one third (1/e) of the vehicle-treated tumor
calculated the average distance migrated from the tumor cells migrated at least 295 μm from the tumor, which was
mass (Fig. 6D1). We found a significant difference between almost twice that of bumetanide-treated tumors. Hence,
vehicle- and bumetanide-treated tumors. We then plotted these data indicate that bumetanide inhibits in vivo glioma
the distance of cell migration as a function of frequency of cell invasion.
occurrence (Fig. 6D3). These data were well fit to a single We then repeated these in vivo experiments using one
exponential function. An exponential decrease in the cell NKCC1-knockdown cell line, 662, compared with NS cells.
number with invasion distance is predicted by Withers and As before, we assessed tumor volume and found no statistical
Lee (28). From this function, y = A1*e(−x/t)+y0, one can conve- difference between NS and 662 tumor volumes (Fig. 6C2).
niently derive the decay constants (t) of 295.4 ± 78.7 and However, when we evaluated the average distance glioma
160.0 ± 12.5 for vehicle- and bumetanide-treated tumors, re- cells migrated from the tumor mass, we found a significant
5604 Cancer Res; 70(13) July 1, 2010 Cancer Research
Downloaded from cancerres.aacrjournals.org on February 1, 2021. © 2010 American Association for Cancer
Research.Published OnlineFirst June 22, 2010; DOI: 10.1158/0008-5472.CAN-09-4666
NKCC1 Inhibition Reduces Glioma Invasion
decrease in invading 662 cells (Fig. 6D2). The average Several studies (34, 35), including ones in glioma cells
distance migrated from the tumor mass was significantly (22, 36), suggest that Cl− efflux is important during defined
different at 170.74 and 123.55 μm for NS and 662 tumors, re- stages of cell division, particularly preceding mitosis. We were
spectively. As previously mentioned, we further examined the surprised to find cell proliferation unaffected by NKCC1 dis-
frequency distribution of glioma cell migration (Fig. 6D4) de- ruption. It is possible that chronic NKCC1 inhibition leads to
riving the decay constants of 154.0 ± 5.3 for NS tumors and compensatory expression of alternative Cl− transporters, for
111.9 ± 6.3 for 662 tumors. These data, from in vivo tumor example, the Cl−/HCO3− transporter AE3 (37). This may also
growth, suggest NKCC1 facilitates the invasion of glioma cells. explain why NKCC1-null mice are viable at birth (38). Despite
possible compensatory mechanisms, our study shows that
Discussion NKCC1 inhibition with bumetanide decreases cell migration.
Although, bumetanide is a potent inhibitor of NKCC1, it could
In this study, we show that the disruption of Cl− uptake possibly affect other cation/chloride cotransporters, such as
through NKCC1, pharmacologically, or shRNA-knockdown the KCCs, even with the affinity NKCC>>KCC (27). Although
inhibits glioma cell invasion. More specifically, cell migration the bumetanide concentration used (200 μmol/L) may have
was inhibited in three-dimensional migration assays in which also inhibited KCCs, similar or even higher concentrations
cells encounter spatial constraints, yet cell motility on a two- have previously been used by us (12, 13) and others (39–43)
dimensional substrate was unaffected by NKCC1 inhibition. to selectively block NKCC1. Importantly, our data (Fig. 5)
Importantly, NKCC1 inhibition reduced cell invasion upon shows that NKCC1-knockdown cells are insensitive to bume-
implantation of gliomas into SCID mice in which individual tanide, suggesting that the drug targets only NKCC1 in our
tumor cells invaded significantly less deep into the surround- experiments.
ing brain upon NKCC1 disruption. We also found that invading glioma cells preferentially lo-
These findings support the hypothesis that glioma cells calize NKCC1 at the leading edge. This may suggest that Cl−
undergo profound changes in cell volume as they invade transport supports local cell volume changes, which possibly
brain tissue and they use Cl− as an osmolyte to regulate cell does not affect overall cell volume. An important aspect of
volume while invading. Ion movement across the membrane the pharmalogical affect of bumetanide on cell invasion is
is associated with obligatory water movement and has been the fact that the drug is FDA approved (Bumex) for the treat-
shown to play a critical role in cell shape and volume ment of kidney disease, and hence, it would have a short path
changes associated with glioma cell migration (3, 12, 29, to clinical use as adjuvant therapy for gliomas.
30), and if normosmotic conditions are perturbed, glioma
Disclosure of Potential Conflicts of Interest
cell migration is significantly reduced (see Supplementary
Fig. S3 and Supplementary Text). Ion movement also plays No potential conflicts of interest were disclosed.
an important role in migration in other cell types. Chloride
efflux through ion channels has been shown to play a major Acknowledgments
role in cell invasion. For example, in HeLa cells, pharmalo-
gical inhibition of Cl− channels or antisense knockdown of We thank Martin Pike for the MR imaging assistance and Susan
Buckingham for animal surgical expertise. The NKCC antibody developed by
the chloride channel ClC-3 inhibits Transwell migration by
Forbush and Lytle was obtained from the Developmental Studies Hybridoma
50% (31). Similar results were reported for nasopharyngeal Bank developed under the auspices of the National Institute of Child Health
carcinoma cells (32). Glioma cells express several members and Human Resources and maintained by The University of Iowa, Department
of the ClC channel family including ClC-3 (33), and the Cl− of Biological Sciences, Iowa City, IA 52242.
channel inhibitor 5-nitro-2-(3-phenylpropylamino)-benzoate Grant Support
reduces invasion (29). Consequently, ClC-3 may similarly
be involved in the volume changes of invading glioma cells. NIH-RO1-036692, RO1-031234, and Neuroscience Blueprint Core Grant NS57098.
However, for purposes of this study, the molecular identity The costs of publication of this article were defrayed in part by the
of the underlying Cl− current is irrelevant. For Cl− to act as
payment of page charges. This article must therefore be hereby marked
advertisement in accordance with 18 U.S.C. Section 1734 solely to indicate
osmolyte, it must be accumulated intracellularly and re- this fact.
quires sustained uptake of Cl− through NKCC1. Indeed, gli-
omas have been shown to accumulate Cl− up to 100 mmol/L Received 12/22/2009; revised 04/12/2010; accepted 05/10/2010; published
intracellularly (12). OnlineFirst 06/22/2010.
References
1. Hoelzinger DB, Demuth T, Berens ME. Autocrine factors that sustain cell migration and invasion using Cl− and K+ ion channel blockers.
glioma invasion and paracrine biology in the brain microenvironment. J Neurosci 1999;19:5942–54.
J Natl Cancer Inst 2007;99:1583–93. 4. Ordaz B, Vaca L, Franco R, Pasantes-Morales H. Volume changes
2. Giese A, Westphal M. Glioma invasion in the central nervous system. and whole cell membrane currents activated during gradual osmolar-
Neurosurgery 1996;39:235–50. ity decrease in C6 glioma cells: contribution of two types of K+ chan-
3. Soroceanu L, Manning TJ, Jr., Sontheimer H. Modulation of glioma nels. AJP - Cell Physiol 2004;286:C1399–1409.
www.aacrjournals.org Cancer Res; 70(13) July 1, 2010 5605
Downloaded from cancerres.aacrjournals.org on February 1, 2021. © 2010 American Association for Cancer
Research.Published OnlineFirst June 22, 2010; DOI: 10.1158/0008-5472.CAN-09-4666
Haas and Sontheimer
5. Sontheimer HW. An unexpected role for ion channels in brain tumor cotransport in C6 glioma cells. Properties and role in volume regulation.
metastasis. Exp Biol Med (Maywood) 2008;233:779–91. Eur J Biochem 1988;171:425–33.
6. Sontheimer H. Ion channels and amino acid transporters support the 26. Gillen CM, Brill S, Payne JA, Forbush B III. Molecular cloning and
growth and invasion of primary brain tumors. Mol Neurobiol 2004; functional expression of the K-Cl cotransporter from rabbit, rat,
29:61–71. and human. A new member of the cation-chloride cotransporter fam-
7. Vila-Carriles WH, Kovacs GG, Jovov B, et al. Surface expression of ily. J Biol Chem 1996;271:16237–44.
ASIC2 inhibits the amiloride-sensitive current and migration of glio- 27. Gagnon KB, Adragna NC, Fyffe RE, Lauf PK. Characterization of glial
ma cells. J Biol Chem 2006;281:19220–32. cell K-Cl cotransport. Cell Physiol Biochem 2007;20:121–30.
8. Fan S, Sun Z, Jiang D, et al. BmKCT toxin inhibits glioma proliferation 28. Withers HR, Lee SP. Modeling growth kinetics and statistical distri-
and tumor metastasis. Cancer Lett 2009;291:1158–66. bution of oligometastases. Semin Radiat Oncol 2006;16:111–9.
9. Kuner T, Augustine GJ. A genetically encoded ratiometric indicator 29. Ransom CB, O'Neal JT, Sontheimer H. Volume-activated chloride
for chloride: capturing chloride transients in cultured hippocampal currents contribute to the resting conductance and invasive migra-
neurons. Neuron 2000;27:447–59. tion of human glioma cells. J Neurosci 2001;21:7674–83.
10. Kettenmann H, Backus KH, Schachner M. γ-Aminobutyric acid 30. Lyons SA, Chung WJ, Weaver AK, Ogunrinu T, Sontheimer H. Auto-
opens Cl-channels in cultured astrocytes. Brain Res 1987;404:1–9. crine glutamate signaling promotes glioma cell invasion. Cancer Res
11. DeFazio RA, Hablitz JJ. Chloride accumulation and depletion during 2007;67:9463–71.
GABA(A) receptor activation in neocortex. Neuroreport 2001; 31. Mao J, Chen L, Xu B, et al. Volume-activated chloride channels con-
12:2537–41. tribute to cell-cycle-dependent regulation of HeLa cell migration.
12. Habela CW, Ernest NJ, Swindall AF, Sontheimer H. Chloride accu- Biochem Pharmacol 2009;77:159–68.
mulation drives volume dynamics underlying cell proliferation and 32. Mao J, Chen L, Xu B, et al. Suppression of ClC-3 channel expression
migration. J Neurophysiol 2009;101:750–7. reduces migration of nasopharyngeal carcinoma cells. Biochem
13. Ernest NJ, Sontheimer H. Extracellular glutamine is a critical modu- Pharmacol 2008;75:1706–16.
lator for regulatory volume increase in human glioma cells. Brain Res 33. Olsen ML, Schade S, Lyons SA, Amarillo MD, Sontheimer H.
2007;1144:231–8. Expresssion of voltage-gated chloride channels in human glioma
14. Haas M, Forbush B III. The Na-K-Cl cotransporters. J Bioenerg Bio- cells. J Neurosci 2003;23:5572–82.
membr 1998;30:161–72. 34. Tang YB, Liu YJ, Zhou JG, Wang GL, Qiu QY, Guan YY. Silence of
15. Asbury MJ, Gatenby PB, O'Sullivan S, Bourke E. Bumetanide: potent ClC-3 chloride channel inhibits cell proliferation and the cell cycle via
new “loop” diuretic. Br Med J 1972;1:211–3. G/S phase arrest in rat basilar arterial smooth muscle cells. Cell Prolif
16. Popowicz P, Simmons NL. [3H]bumetanide binding and inhibition of 2008;41:775–85.
Na+ + K+ + Cl− co-transport: demonstration of specificity by the use 35. Yu WF, Zhao YL, Wang K, Dong MM. Inhibition of cell proliferation
of MDCK cells deficient in co-transport activity. Q J Exp Physiol and arrest of cell cycle progression by blocking chloride channels in
1988;73:193–202. human laryngeal cancer cell line Hep-2. Neoplasma 2009;56:224–9.
17. Isenring P, Jacoby SC, Chang J, Forbush B. Mutagenic mapping of 36. Habela CW, Sontheimer H. Cytoplasmic volume condensation is an
the Na-K-Cl cotransporter for domains involved in ion transport and integral part of mitosis. Cell Cycle 2007:6.
bumetanide binding. J Gen Physiol 1998;112:549–58. 37. Stewart AK, Yamamoto A, Nakakuki M, Kondo T, Alper SL, Ishiguro
18. Ernest NJ, Weaver AK, Van Duyn LB, Sontheimer HW. Relative con- H. Functional coupling of apical Cl−/HCO3− exchange with CFTR in
tribution of chloride channels and transporters to regulatory volume stimulated HCO3− secretion by guinea pig interlobular pancreatic
decrease in human glioma cells. Am J Physiol Cell Physiol 2005; duct. Am J Physiol Gastrointest Liver Physiol 2009;296:G1307–1317.
288:C1451–1460. 38. Flagella M, Clarke LL, Miller ML, et al. Mice lacking the basolateral
19. Bomben VC, Sontheimer HW. Inhibition of transient receptor poten- Na-K-2Cl cotransporter have impaired epithelial chloride secretion
tial canonical channels impairs cytokinesis in human malignant glio- and are profoundly deaf. J Biol Chem 1999;274:26946–55.
mas. Cell Prolif 2008;41:98–121. 39. Kelly T, Kafitz KW, Roderigo C, Rose CR. Ammonium-evoked altera-
20. Cuddapah VA, Sontheimer H. Molecular interaction and functional tions in intracellular sodium and pH reduce glial glutamate transport
regulation of ClC-3 by Ca2+/calmodulin-dependent protein kinase activity. Glia 2009;57:921–34.
II (CaMKII) in human malignant glioma. J Biol Chem 2010;285: 40. Garay RP, Nazaret C, Hannaert PA, Cragoe EJ, Jr. Demonstration of
11188–96. a [K+,Cl−]-cotransport system in human red cells by its sensitivity to
21. Olsen ML, Campbell SL, Sontheimer H. Differential distribution of [(dihydroindenyl)oxy]alkanoic acids: regulation of cell swelling and
kir4.1 in spinal cord astrocytes suggests regional differences in k+ distinction from the bumetanide-sensitive [Na+,K+,Cl−]-cotransport
homeostasis. J Neurophysiol 2007;98:786–93. system. Mol Pharmacol 1988;33:696–701.
22. Habela CW, Olsen ML, Sontheimer H. ClC3 is a critical regulator of 41. Chen H, Sun D. The role of Na-K-Cl co-transporter in cerebral ische-
the cell cycle in normal and malignant glial cells. J Neurosci 2008; mia. Neurol Res 2005;27:280–6.
28:9205–17. 42. Tse WK, Au DW, Wong CK. Effect of osmotic shrinkage and hormones
23. Soroceanu L, Gillespie Y, Khazaeli MB, Sontheimer H. Use of chlorotoxin on the expression of Na+/H+ exchanger-1, Na+/K+/2Cl− cotransporter
for targeting of primary brain tumors. Cancer Res 1998;58:4871–9. and Na+/K+ -ATPase in gill pavement cells of freshwater adapted
24. Lauf PK, Adragna NC, Garay RP. Activation by N-ethylmaleimide of a Japanese eel, Anguilla japonica. J Exp Biol 2007;210:2113–20.
latent K+-Cl− flux in human red blood cells. Am J Physiol 1984; 43. Wertheimer EV, Salicioni AM, Liu W, et al. Chloride is essential for
246:C385–390. capacitation and for the capacitation-associated increase in tyrosine
25. Chassande O, Frelin C, Farahifar D, Jean T, Lazdunski M. The Na+/K+/Cl− phosphorylation. J Biol Chem 2008;283:35539–50.
5606 Cancer Res; 70(13) July 1, 2010 Cancer Research
Downloaded from cancerres.aacrjournals.org on February 1, 2021. © 2010 American Association for Cancer
Research.Published OnlineFirst June 22, 2010; DOI: 10.1158/0008-5472.CAN-09-4666
Inhibition of the Sodium-Potassium-Chloride Cotransporter
Isoform-1 Reduces Glioma Invasion
Brian R. Haas and Harald Sontheimer
Cancer Res 2010;70:5597-5606. Published OnlineFirst June 22, 2010.
Updated version Access the most recent version of this article at:
doi:10.1158/0008-5472.CAN-09-4666
Supplementary Access the most recent supplemental material at:
Material http://cancerres.aacrjournals.org/content/suppl/2010/06/22/0008-5472.CAN-09-4666.DC1
Cited articles This article cites 42 articles, 15 of which you can access for free at:
http://cancerres.aacrjournals.org/content/70/13/5597.full#ref-list-1
Citing articles This article has been cited by 10 HighWire-hosted articles. Access the articles at:
http://cancerres.aacrjournals.org/content/70/13/5597.full#related-urls
E-mail alerts Sign up to receive free email-alerts related to this article or journal.
Reprints and To order reprints of this article or to subscribe to the journal, contact the AACR Publications
Subscriptions Department at pubs@aacr.org.
Permissions To request permission to re-use all or part of this article, use this link
http://cancerres.aacrjournals.org/content/70/13/5597.
Click on "Request Permissions" which will take you to the Copyright Clearance Center's (CCC)
Rightslink site.
Downloaded from cancerres.aacrjournals.org on February 1, 2021. © 2010 American Association for Cancer
Research.You can also read