Why people were quarantining in the Territory: Results from the NT Quarantine Centres - Charles Darwin ...
←
→
Page content transcription
If your browser does not render page correctly, please read the page content below
Why people were quarantining in the Territory:
     Results from the NT Quarantine Centres

           A Northern Institute Working Paper

                     Fiona Shalley
                     Andrew Taylor
                      George Tan
                     Sigurd Dyrting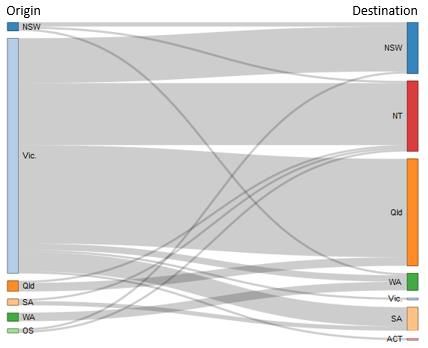
KEY POINTS

 •   This Working Paper provides information on why people were quarantining in the two government-run
     NT quarantine centres, including where they came from and where they were going to. Understanding
     the role of quarantine centres is a current research void in the broader picture of changed internal
     migration within Australia as a result of COVID-19. Results from two surveys of quarantine residents are
     presented in the report.

 •   We found a significant majority of survey respondents were from Victoria (71%) which aligns with its
     extended period of lockdown during the survey collection period. However, we found less evidence of
     ‘COVID-refugees’ solving the Territory’s population problem.

 •   Overall, the main reason respondents were in the Territory quarantining was to transit to another State
     or Territory (45%). This was followed by reasons related to work or business (26%).

 •   We found that quarantine respondents fell into three broad groups – those visiting or passing through the
     NT on their way to somewhere else (51%), Territory residents returning (19%), and those intending to
     relocate to the Territory for the short or longer-term (30%).

 •   For those relocating to the NT in the longer-term, 7 per cent cited the NT’s “COVID-safe” reputation in
     their top three reasons for moving to the Territory, while 16 per cent of those relocating in the short term
     cited this reason for being in the Territory.

 •   On a scale of 0 to 10, respondents rated their physical wellbeing (average = 8.1) higher than their mental
     wellbeing (average = 7.5) and higher than their financial situation (average = 7.2). However, greater
     numbers felt that COVID-19 had negatively impacted their mental wellbeing. Many respondents reported
     higher levels of stress and anxiety and feelings of isolation and loneliness.

 •   Territorian residents in quarantine reported higher impacts from COVID-19 on their financial situation
     compared to non-residents. They felt comparatively less impacted in the domains of mental and physical
     wellbeing.

 •   Results showed that the Territory quarantine centres played a significant role in delivering a COVID-safe
     passport to people so they could transit from one jurisdiction to another. Their record in providing a safe,
     healthy and secure facility means there could be potential for the NT to play a larger role in the Australian
     quarantine business in the longer term.

 •   Uncertainty around future migration patterns will remain regardless of the efficacy of the COVID-19
     vaccination program. Ongoing research on changing migration drivers will provide more confidence to
     current population predictions.

                                                                                                                2
Contents
Introduction ..................................................................................................................................................................4
1. Border closures and hotspot restrictions ......................................................................................................5
Survey methods ............................................................................................................................................................6
Results ...........................................................................................................................................................................8
EXIT survey ................................................................................................................................................................8
2. Participants ...................................................................................................................................................8
The Territory and Me – COVID Update Quarantine Survey ................................................................................... 13
3. Participants ................................................................................................................................................ 13
4. Reasons for coming to the Territory? ........................................................................................................ 14
5. Lives in the Territory .................................................................................................................................. 16
6. Visiting or passing through ......................................................................................................................... 17
7. Relocating to the Territory for the longer term ......................................................................................... 18
8. Relocating in the short term ...................................................................................................................... 20
9. COVID-19 impacts on the employment of quarantine residents ............................................................... 22
10. Impacts from COVID-19 on the physical, mental and financial wellbeing of quarantine residents ........... 23
11. Impacts of COVID-19 on others thinking of migrating to the Northern Territory ...................................... 29
12. Last words .................................................................................................................................................. 30
Discussion and policy implications ............................................................................................................................. 31
Conclusions ................................................................................................................................................................ 33
References ................................................................................................................................................................. 33
Acknowledgements
This research was in part funded by a grant provided by the Northern Territory Government [No. D18-0289] to
investigate population trends and prospects in the Northern Territory of Australia. All opinions and interpretations
are nevertheless independent and are entirely of the authors.
Our thanks are extended to the residents of the quarantine centres for taking the time to complete the surveys and
to share their stories. We appreciate that in many cases this may have been difficult. We are also very grateful to the
support we received from the Territory Welfare Group in promoting the survey to the quarantine residents.
3Introduction
Migration within Australian was significantly disrupted by the COVID-19 pandemic, but it did not cease. Instead it
was facilitated by State/Territory quarantine requirements. Quarantining continues as the major government public
health response to dealing with the safe movement of people to and around Australia during the pandemic. Typically,
people are quarantined if they were returning from overseas, were crossing “hard border” closures between
jurisdictions, were recently in a declared COVID hotspot, or they were entering certain remote areas of Australia1.
Residents are isolated from the rest of the community either at home (if this is appropriate) or in quarantine centres
(often hotels) so they can be monitored for symptoms. People must quarantine if they are directed to do so by a
public health authority (Australian Government, Department of Health).
The NT quarantine facilities are unique in the Australian quarantine model in that they are directly operated by the
NT government working in partnership with the National Critical Care and Trauma Response Centre (including use of
AUSMAT2 personnel). Two main facilities were in operation through the period of this research – the Howard Springs
Centre in Greater Darwin and the Todd Centre in Alice Springs. Both facilities are relatively close to the main hospital
in each city providing good access in the event of positive cases being detected. The larger Howard Springs facility
provided residents with a personal veranda, air-conditioning units vented directly to the outside, and supervised
outdoor physical activity which many other designated hotel quarantine facilities could not provide. Further details
of the NT quarantine processes, facilities and amenities can be found here
https://coronavirus.nt.gov.au/travel/quarantine/mandatory-supervised-quarantine
There has been much discussion about changed internal migration flows during the pandemic, but no research has
been conducted to identify the reasons people are passing through quarantine facilities. This research on why people
were in the NT’s quarantine centres sits within the broader The Territory and Me research program (a summary of
the associated survey activity is provided in Table 1) which focuses on the drivers of migration to and from the
Northern Territory and the general experiences of those who are living or have lived in the Territory. Using results
from the pre-pandemic survey has allowed us to track the impact of COVID-19 on changing migration sentiments.
The NT quarantine centres provided a rare opportunity to gather information on the permanent or temporary
migration intentions of people in quarantine. The Northern Territory’s Chief Minister spoke about ‘coronavirus
refugees’ in late August 2020 (NT News, 1 Sep 2020), saying residents in southern states were ‘fleeing’ to the
Northern Territory. The combined results of two surveys of quarantine facility residents were expected to be helpful
to informing the evidence base about the broader story of COVID refugees (ABS News, 2020) and in particular, are
people escaping COVID “hotspots” to settle in the Territory?
1
Information sourced from healthdirect which is an Australian government-funded service that provides approved health
information and advice https://www.healthdirect.gov.au/coronavirus-covid-19-self-isolation-faqs
2
NCCTRC provides clinical and academic leadership in trauma and critical care, preparing Australian clinicians for deployment
to local, national and international emergencies. AUSMAT are Australian Medical Assistance Teams incorporating doctors,
nurses, paramedics, fire-fighters and allied health staff.
4Table 1 Survey activity associated with The Territory and Me research program
Survey Survey period Survey status
The Territory and Me (TTaM) June 2019 – December 2019 Finished
The Territory and Me – COVID Update (TTaM-CU) July 2020 – December 2020 Continuing
The Territory and Me – COVID Update, Quarantine September 2020 Continuing
(TTaM-CUQ)
EXIT survey (quarantine centres only) September 2020 Continuing
Note: Publications associated with the results of all survey activity can be found here:
https://theterritoryandme.cdu.edu.au/publications
1. Border closures and hotspot restrictions
As at January 2021, the Northern Territory was the only jurisdiction to have no reported community transmission of
COVID-19. State and Territory governments remain active in declaring hotspot areas to protect their communities
from the potential spread of the virus. Who was in quarantine during the survey collection period was largely driven
by hard border closures between State and Territories, declared hotspot areas, and the ongoing restrictions around
entry to remote NT Indigenous communities. However, consolidated information on changed travel restrictions over
this period was difficult to authoritatively verify. Table 2 provides a broad overview of the mandatory quarantine
requirements during the survey period compiled from various government sources and media reporting on updated
restrictions. It was assumed that people coming from overseas were also obligated to spend two weeks in the centres
if they were travelling to or through the NT.
5Table 2 Summary of hard border restrictions and hotspot declarations, September 2020 to January 2021
Source: compiled by author using various online government sites updating their quarantine requirements and media
reporting through the period
Survey methods
These analyses are from two online surveys which were administered through the Northern Territory quarantine
centres in Darwin and Alice Springs. The surveys commenced on 17 September 2020 and data reported in this
Working Paper relates to the period ending 31 January 2021. The survey activity will continue as long as the centres
remain operational. The two surveys were:
1. The Territory and Me- COVID Update Quarantine (TTaM-CUQ) which was designed to collect a range of
information from people in the quarantine centres on the topics of:
• Socio-demographics including sex, age, country of birth, usual residence, Indigenous status,
employment and education, and residency status;
• Main reasons for being in the Territory;
• Impacts of COVID on physical, mental and financial wellbeing as well as current housing, employment
or business circumstances;
• Whether relocating to the Territory or whether they know anyone who might be relocating; and
• Impact of COVID on migration decisions.
Some of the survey content overlapped with the general TTaM-CU survey so that results can be compared.
The TTaM-CUQ survey was advertised through information brochures provided in the quarantine welcome
6packs, advertising on the rolling public noticeboard system and quarantine staff encouraging survey
participation in their interactions with residents. On average, the survey took respondents less than 15
minutes to complete.
2. The quarantine EXIT survey contained only 6 questions and took less than 3 minutes to complete. A link to
the EXIT survey was provided in the final email to each resident unit (single, couple or family group
travelling together) informing them of the exit date and time. This EXIT survey focused on collecting
information on where the residents were from, where they intended to go after leaving quarantine (broad
region), whether they intended to settle in the NT (in the short or long term), and their main reason for
being in the NT.
At the end of January, we had obtained 303 responses from the TTaM-CUQ survey and 332 from the EXIT survey.
As discussed, only one survey per quarantine ‘unit’ (i.e. single, couple, family group) was completed for the EXIT
survey, such that the 332 responses represented 454 people. It is likely that some people completed both surveys,
however the different questions in the two surveys prevented duplication or differentiation of answers. Both
surveys were voluntary, and respondents were required to be at least 18 years old. The research was conducted
under Charles Darwin University’s ethics in human research clearance process (H18091).
The majority of responses in both surveys were collected through the month of October 2020, accounting for 60
per cent of the TTaM-CUQ participation and 47 per cent of the EXIT survey participation – see Figure 1.
Figure 1 Respondent participation in the quarantine surveys, September 2021 to January 2021
TTaM-CUQ EXIT survey
200 200
no. of respondents
no. of respondents
150 150
100 100
50 50
0 0
Sep-20 Oct-20 Nov-20 Dec-20 Jan-21 Sep-20 Oct-20 Nov-20 Dec-20 Jan-21
Source: EXIT survey, TTaM-CUQ
Life-course analysis has again been used to understand the migration decisions of quarantine residents as these
choices are often influenced by the changing needs of each life stage. The adult life-course generally includes
finishing education and finding employment, entering relationships and starting families, potentially changing jobs,
becoming empty nesters, retiring and aging further (Dyrting et. al 2020; Kley 2010). Similar to our analysis of
previously collected TTaM data, for this analysis the life-course was broken into four broad age group stages:
people in their early career stage (aged 18 – 29), people in their mid-career (aged 30 – 49), people in their pre-
retiree stage (aged 50 – 59), and those in their retiree stage (aged 60 years and over). It is noted that the ‘retiree’
7stage does not necessarily include people who are retired, rather it denotes the age from which most people are
retired.
The following research questions were applied to the quarantine survey data:
• Who is quarantining in the Territory?
• Where did they come from (origin) and where do they intend to go after quarantine (destination)?
• Do they intend to stay in the Territory in the short or long term?
• How has COVID-19 impacted their employment circumstances and their physical, mental and financial wellbeing?
Results
This Working Paper draws data from both surveys. The next section presents analysis from the EXIT survey relating
to overall respondent numbers and flows through the quarantine centres, including their origin and destination.
Following this, we use in-depth analysis from the TTaM-CUQ on migration intentions, reasons for moving or visiting
the Territory and the impact of COVID-19 on the various domains of the wellbeing of the survey participants.
EXIT survey
As noted in the Methods section, the EXIT survey was completed on behalf of each resident unit – i.e. the group of
people travelling together. These groups were categorised as single, couple and family. Family groups generally
consisted of one or two adults with children aged less than 18 however a small number of extended families were
also categorised to this group. The main respondent was 18 years or older.
2. Participants
The distribution of the resident groups and age groups who participated in the EXIT are shown in Figure 2. The
majority of participants were single travellers (72%) and survey participation was mostly represented in the age
groups from 20 to 59. There were fewer participants aged 60 and over and those under 15 were travelling with their
family group.
8Figure 2 Percentage of participating residents, by responding groups and age groups
Resonding groups Age groups
80 20
60 15
Percentage
Percentage
40 10
20 5
0 0
single couples families 0-14 15-19 20-29 30-39 40-49 50-59 60-69 70+
Source: EXIT survey
The main reason for being in the Territory for EXIT survey participants was to transit to another state/territory (45%),
followed by reasons related to a job or business (26%) and returning home from interstate or overseas (11%).
Although single travellers were the largest group of respondents, the responding groups had similar intentions
relative to their length of stay in the Territory. Proportionally, the majority of each group intended to stay for less
than 3 months (between 70% and 74%), while single people were slightly more likely than the other groups to
indicate they were staying for 12 months or more (22% compared to 17% of families and 18% of couples) – see Figure
3.
Figure 3 Length of time expecting to stay in the Territory, by resident responding group
100%
80%
60%
40%
20%
0%
Family Couple single
Less than 3 months 3 to less than 12 months 12 months or more
Source: EXIT survey
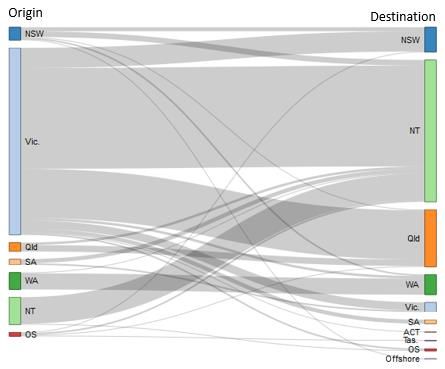
Figure 4 shows the flow of quarantine respondent groups from their point of origin on the left (their usual place of
residence) to their destination on the right (where they indicated they were going after leaving quarantine). Almost
9three quarters of survey participants came from Victoria (71%). The next largest group was from the Northern
Territory (11%) followed by Western Australia (6%). More than half of all responding groups indicated their
destination was the Northern Territory (55%), with another 22 per cent going to Queensland and 10 per cent to New
South Wales. Less than 1 per cent were going overseas or offshore.
The biggest flow of quarantine residents was between Victoria and the Northern Territory, followed by those
travelling from Victoria through to Queensland. Some of the flow takes people from the state of origin to the same
state of destination and this is particularly so for respondents from Western Australia and to a lesser extent Victoria
whose governments imposed regional border restrictions within their states. It is clear from this diagram that many
people were passing through the Northern Territory quarantine centres on their way to another state/territory.
Figure 4 Origin to destination flows, EXIT survey respondents
Source: EXIT survey
The respondent flow was re-examined for those who were in-transit only (Figure 5), i.e. their reason for being in
Territory quarantine was to transit to another State/Territory. Victoria increased its dominance as the place of origin
(85% of respondents), with Queensland being the main destination (40%). Victorians comprised most respondents
10travelling to Queensland (90%). Interestingly, a quarter of the in-transit flow had the Northern Territory as their
destination, however this is likely to refer to a short stay in the NT (less than 3 months) before travelling to their
eventual destination outside of the NT.
Figure 5 Origin to destination flows, EXIT survey respondents in transit
Source: EXIT survey
Are they any COVID-refugees from Victoria?
Excluding those who indicated they were in transit only, Victoria remained the largest State/Territory of origin (62%).
Of those coming from Victoria with a destination of Northern Territory (n=92), 36 per cent were returning home, 33
per cent were in the Territory for their job or business, and 16 per cent were there because of NT’s COVID safe
reputation.
It is interesting to put these results in the context of current Australian migration data. The most recent estimates of
regional migration are for the September 2020 quarter (ABS, 2021), the quarterly period prior to the collection of
the TTaM-CUQ. These ABS data indicate that interstate arrivals to the Territory decreased by around 200 compared
to the previous quarter and in net terms, the Northern Territory gained the most population from Victoria (n=230).
Figure 7 shows interstate arrivals to the Territory since December 2014. The overall trend is volatile, with most peaks
in the December quarter and the arrival low points in the September quarter. However, the impact of COVID-19 on
11interstate arrivals appears generally unremarkable in the context of the last three years, rather than the significant
decline that may have been expected by the imposition of hard state/territory border closures. Arrivals to the
Territory have not stopped.
Figure 7 Interstate arrivals to the Northern Territory, December 2014 to September 2020
4,500
4,000
3,500
3,000
Number
2,500
2,000
1,500
1,000
500
0
Jun-15
Jun-16
Jun-17
Jun-18
Jun-19
Jun-20
Sep-20
Dec-14
Mar-15
Sep-15
Dec-15
Mar-16
Sep-16
Dec-16
Mar-17
Sep-17
Dec-17
Mar-18
Sep-18
Dec-18
Mar-19
Sep-19
Dec-19
Mar-20
Source: ABS, Regional internal migration estimates, September 2020
Looking specifically at arrivals to the Territory from Victoria, ten-year trends for the June and September quarters
are presented in Figure 8. Generally, the June quarter arrivals are higher than the September quarter arrivals which
likely reflects the attraction of the beginning of the dry season compared to the start of the build-up season. Data
trends show the September 2020 arrivals passed the June 2020 arrivals for the first time since 2011 if the very small
difference in 2014 is ignored. It is also significantly increased compared to the September 2019 point which suggests
increasing flows from Victoria. Whether this could be used to confirm the COVID-refugee phenomenon requires a
longer time series. The 2020 December quarter interstate migration data will be released in May 2021.
Figure 8 Arrivals from Vic to NT, June and September quarters, 2010 – 2020
1000
900
800
700
No. of people
600
500
400
300
200
100
0
2010 2011 2012 2013 2014 2015 2016 2017 2018 2019 2020
June qtr Sept qtr
Source: ABS.Stat
12Key findings from the EXIT survey
• Victorians made up the majority of the in-transit flow of quarantine residents.
• Victorians were the largest group who signalled their intention to stay in the NT for longer. This
supports evidence of an increasing flow of migrants from Victoria highlighted in the official ABS
preliminary interstate migration estimates.
• Both these findings are likely to be linked to the hard border restrictions in Victoria.
• Results also identify the function of NT quarantine facilities as transit centres to other
States/Territories.
The Territory and Me – COVID Update Quarantine Survey
The TTaM-CUQ survey was completed by 303 respondents and the questionnaire content related specifically to
themselves and their circumstances. It included more extensive content than the EXIT survey and is used to examine
migration decisions and why participants were in the Territory. This survey also included questions about participants
overall wellbeing and the impact of COVID-19 on their employment situation, and their financial, physical and
emotional wellbeing.
3. Participants
More than half of the TTaM-CUQ survey participants were female (56%), however the proportion of participating
males was higher than in the TTaM-CU survey conducted with the general population (44% compared to 32%).
Similar to the EXIT survey, respondents belonging to the mid-career age group (43%) made up the largest proportion
across life-stages. (Figure 9). Nearly 60% of respondents were travelling alone, a further 19% travelled with their
partner and 7% travelled as a family group.
Figure 9 Life-stage Distribution of survey respondents
140
120
100
Respondents
80
60
40
20
0
Early career (18-29) Mid career (30 - 49) Pre-Retiree (50-59) Retiree (60+)
Life Stage
Source: TTaM-CUQ
13The majority of TTaM-CUQ participants (73%) were not residents of the Territory nor had ever lived in the Territory
(Figure 10). About 12 per cent lived in the Territory and were returning from interstate or overseas and another 7
per cent lived in the Territory for part of the year (e.g. fly-in-fly-out or contract workers).
Figure 10 Usual residence in relation to the Territory, TTaM-CUQ survey participants
250
200
Respondents
150
100
50
0
NT resident Live part year Used to live Never lived
Source: TTaM-CUQ
4. Reasons for coming to the Territory?
Asked for their main reason for returning to or being in the Territory, over a third of respondents indicated they were
in the Territory for a job or for business (38%) (either for themselves or a family member) and another 10 per cent
were returning home from interstate or overseas. Similar to results from the EXIT survey, a large proportion identified
that they were in transit to another state or territory (33%). The main reason for being in the Territory differed by
the life-stage of the respondent (Figure 11). People in their mid-career were the group most likely to be in quarantine,
and they were also more likely than the other life stages to be in transit, to be in the Territory for their job or general
business reasons, and to be returning home. Respondents in their early-career were the least likely to be in transit
to another State/Territory (6%), while those in the early-career or retiree stages were more likely to be visiting family
or friends (2%, 2%) compared to people in either the mid-career or pre-retiree stages. NT’s COVID-safe reputation
was identified as their main reason by just 4 per cent of respondents.
14Figure 11 Main reason for being in the Territory, by life-stage of TTaM-CUQ survey participants
Transiting to another State/Territory
Job or business
Returning home
Visiting family/friends
Studying
Travelling/holiday
NT's COVID-safe reputation
FIFO
0 10 20 30 40 50
Percentage of responses
Early career Mid-career Pre-Retiree Retiree
Source: TTaM-CUQ
When asked whether they were relocating to the Territory, 30 per cent of the respondents indicated they were
(n=90), while 51 per cent were only visiting or passing through, and 19 per cent lived all or part of their time in the
Territory (see Figure 12). Of those who were relocating, 60% intended to stay in the Territory for 12 months or more
while the remaining 40 per cent said they were staying for less than 12 months.
Figure 12 intention to relocate as proportion of TTaM-CUQ survey respondents
Source: TTaM-CUQ
These groups differed in their age and sex profile, therefore they are examined separately for their reasons for being
in quarantine.
155. Lives in the Territory
About half of the respondents who usually lived in the Territory (all or part of the time) were females (51%), and 41
per cent were single with the remaining either married/de-facto or in a relationship. Nearly two thirds were travelling
alone (64%) - see Figure13.
Almost two thirds were returning home from interstate or overseas (65%), while 32 per cent were in quarantine
because of their job or business. For more than half, their permanent residence was in the Darwin city and suburbs
(55%) and another quarter lived in Alice springs.
Figure 13 Demographic profile, TTaM-CUQ respondents who live in the Territory
70
60
50
Percentage
40
30
20
10
0
Family
Alone
Pre-Retiree
Retiree
Spouse/partner
Early-career
Mid-career
Friends/colleagues
Life-stage Travelling group
50
In a relationship
40
Percentage
30
Single
20
10
0 10 20 30 40 50 60
0
Percentage
Female Male
Source: TTaM-CUQ
Using the question asking Territory respondents where they intended to be living in two years, we calculated their
expected retention rate for remaining in the Territory. At 59 per cent, this was lower than the expected 2-year
retention rate of 84 per cent calculated for respondents in the TTaM-CU survey. While over a third said COVID-19
had not influenced their plans for living in the Territory (36%), 31 per cent said that COVID-19 had made them feel
less likely to leave. Another 22 per cent felt more uncertain about where they wanted to live because of COVID-19.
In the main TTaM-CU survey, less respondents felt uncertain (14%) and more said that COVID-19 had not influenced
16their plans (56%) suggesting the NT respondents in quarantine felt a larger COVID-19 impact on their future migration
intentions.
6. Visiting or passing through
Of those respondents who did not live in the Territory, the majority (n=150) were visiting or passing through. Figure
14 provides their summary demographic profile. In this group just over half were male (51%). Compared to those
who were Territory residents, they were more likely to be in their retiree stage (21% compared to 11%) and less
likely to be in their early-career (13% compared with 22%). More were either married/de-facto or in a relationship
(57%) rather than being single (28%). Similar proportions were travelling alone (61% compared with 64%) and almost
all had never lived permanently in the Territory (93%).
Figure 14 Demographic profile, respondents visiting or passing through
70
60
50
Percentage
40
30
20
10
0
Family
Alone
Retiree
Pre-Retiree
Spouse/partner
Early-career
Mid-career
Friends/colleagues
Life-stage Travelling group
60
50 In a relationship
Percentage
40
30
Single
20
10
0 20 40 60 80
0
Percentage
Female Male
Source: TTaM-CUQ
Figure 15 shows the most common reasons for being in the Territory for those who were visiting or passing through.
The majority were in transit to another State/Territory (61%), and of these, 3 per cent were passing through the
Territory because of their intention to relocate to another State. A quarter were in the Territory for their work or
business and 6 per cent were here for compassionate reasons.
17Figure 15 Main reason for being in the Territory, respondents who were visiting
In transit
Job/business/volunteer in Territory
Compassionate reasons
Visiting family
FIFO
Returning from overseas
Tourist
0 10 20 30 40 50 60 70
Percentage
Source: TTaM-CUQ
7. Relocating to the Territory for the longer term
About 1 in 20 of the quarantine respondents said that they were relocating to the Territory for the longer term i.e.
they intended to be living in the Territory for at least 12 months.
These respondents were mainly female (57%). They were generally in their mid or early career (89%) and more likely
to be in a relationship (61%), than to be single (39%), however most were travelling alone (52%) – see Figure 16. Few
had lived in the Territory previously (20%). Eight in 10 were from Melbourne and a further 6 people were from
regional Victoria.
18Figure 16 Demographic profile, respondents relocating for longer term
70
60
50
Percentage
40
30
20
10
0
Family
Alone
Retiree
Friends
Pre-Retiree
Spouse/partner
Early-career
Mid-career
Life-stage Travelling group
60
50 In a
relationship
Percentage
40
30
Single
20
10
0 10 20 30 40 50 60 70
0
Percentage
Female Male
Source: TTaM-CUQ
These respondents were asked to nominate their top three reasons for moving to the Territory – Figure 17. The most
common was associated with their job or business (27%), followed closely by reasons linked to location amenity
including the climate and lifestyle (24%), the landscape and environment (14%) and the culture and people (12%).
Sixteen people said they moved to be closer to family and friends (19%), while 7 per cent chose the NT’s ‘COVID safe’
reputation as one of the reasons they relocated.
19Figure 17 Top three reasons for moving to the Territory, respondents relocating for longer term
Job/Business
Climate/lifestyle
Landscape/environment
Culture/people
To be nearer to family and friends
NT COVID-safe
Education/Training
Defence transfer
0 10 20 30
Percentage
Source: TTaM-CUQ
8. Relocating in the short term
Another 12 per cent of survey participants indicated they were relocating to the Territory in the short term (i.e. they
expected to be in the NT for less than 12 months). This group was predominantly comprised of those in their early
or mid-career (83%) (Figure 18). Comparisons with those intending to relocate in the longer terms highlighted some
differences. Firstly, more were in their retiree stage compared to those relocating in the longer term (14% compared
to 2%). They were also much more likely to be female (83% compared to 57%) and more likely to be single than those
intending to relocate for 12 months or more (44% and 39% respectively). Like those relocating in the longer term,
80 per cent had never lived in the Territory and similar proportions came from Melbourne (83%). Their main reason
for being in the Territory was associated with work (60%) while 17 per cent had moved to be closer to family or
friends. Eleven people were in the Territory because of their enrolment in higher education.
20Figure 18 Demographic profile, respondents relocating for short term
60
50
40
Percentage
30
20
10
0
Family
Alone
Retiree
Spouse/partner
Pre-Retiree
Friends
Early-career
Mid-career
Life-stage Travelling group
100
80 In a relationship
Percentage
60
40 Single
20
0 10 20 30 40 50 60
0
Percentage
Male Female
Source: TTaM-CUQ
Asked for their top three reasons for being to the Territory (Figure 19), NT’s COVID safe reputation was more
commonly cited (16%) compared to the respondents relocating for the longer term (7%). The simple fact that the
border was open to them was selected by 13 per cent of respondents. However, reasons associated with the
landscape, weather and outdoor activities were more influential to many (19%, 18%, 14%). More than two-thirds
had considered a more permanent move to the NT.
21Figure 19 Top three reasons in the Territory, respondents relocating in short term
Landscape/environment
Weather/climate
NT COVID-safe
Outdoor activities
NT border open
Employment
Arts/culture/markets
Family/compassionate
0 5 10 15 20
Percentage
Source: TTaM-CUQ
Key findings from TTaM-CUQ
• The survey differentiated three groups quarantining in the NT facilities – those who lived in the
Territory (19%), those who were visiting or passing through (51%), and those intending to relocate
(30%).
• Territory residents in quarantine were less certain about where they intended to live in 2 years and had
lower intended 2-year retention rates compared to the TTaM-CU participants.
• Compared to those visiting or just passing through, quarantine respondents intending to relocate were
generally younger and more likely to be female. They were predominately from Victoria. Those
relocating in the longer term were in the Territory for work or business reasons, but both groups were
also attracted by reasons associated with location amenity.
9. COVID-19 impacts on the employment of quarantine residents
More than two thirds (68%) of the quarantine respondents said they were currently employed, and 13 per cent said
they were seeking employment or a business opportunity. Nearly 6 per cent of the respondents were either currently
or had previously received the JobKeeper payment3.
An analysis of free-text responses to the question on how COVID-19 changed the respondents’ job situation since
March 2020 showed that more than 70 per cent had their employment impacted in some way. The main impacts
3
The JobKeeper payment is a Commonwealth Government subsidy to assist businesses significantly affected by COVID to keep
their employees.
22are shown in Figure 20. The most common included working less hours, for less pay or losing employment altogether
(28%), followed by increased hours or increased stress related to their employment while 16 per cent said that they
were required to worked from home, online or their business practices had changed to decrease their people
contact. Changed duties/business structure or the introduction of new work safe practices and the requirement to
quarantine were also cited. Twelve percent said they had found work by relocating. A small number said that COVID-
19 had prompted them to reassess their work priorities while others had changed their job or had been promoted.
Figure 20 Impacts of COVID-19 on employment circumstances
Found work by relocating
Quarantine requirements
Changed duties/business structure/work practices
Requirement to work from home or online
Increased hours/stress
Lost job/less hours/less pay (including jobkeeper)
0 5 10 15 20 25
Percentage of responses
Source: TTaM-CUQ
10. Impacts from COVID-19 on the physical, mental and financial wellbeing of
quarantine residents
There is a growing body of evidence about impacts from the COVID-19 pandemic on individuals and families (The
Lancet, 2020). We were interested in measuring these impacts and asked respondents to rate their physical, mental
and financial wellbeing and indicate how COVID-19 had impacted their rating. A final open text question asked
respondents to provide comment on how COVID-19 had affected their overall lifestyle.
In the three charts below, we have cross-classified responses to respondent’s self-rated score (from zero to ten with
zero being the lowest rating) with the question ‘Is this better, about the same or worse because of COVID-19?’ for
each of the following questions:
• Q12: Please rate your physical wellbeing
• Q14: Please rate your mental wellbeing
• Q16: Please rate your financial situation
• Q18: Please tell us how COVID-19 has impacted your overall lifestyle
23Physical wellbeing
The distribution of self-rated physical wellbeing, scaled from 0 to 10, is included in Figure 21. The chart includes the
proportion of respondents at each rating who decided it was the same, better or worse because of COVID-19. The
majority of respondents rated their physical wellbeing as 8 or above, with an average rating of 8.1, but 6 per cent of
respondents rated it at 5 or less. Almost two-thirds felt COVID-19 had little to no impact on their physical wellbeing.
However, 28 per cent said that it was worse because of COVID-19 and 10 per cent felt it was better. Those feeling it
had negatively impacted their physical wellbeing were more likely to rate it at 8 or below, while those feeling COVID
had a positive impact were more likely to rate it 8 or above.
Figure 21 Distribution of responses to self-rated physical wellbeing with whether it was about the same, better or
worse due to COVID-19
About the same Better Worse
100
80
No. of respondents
60
40
20
0
1 2 3 4 5 6 7 8 9 10
Self-rating of physcial wellbeing
Source: TTaM-CUQ
Mental wellbeing
Figure 22 provides the distribution of self-rated mental wellbeing and the proportion of respondents at each rating
who decided it was the same, better or worse because of COVID-19. The majority of respondents rated their mental
wellbeing as 8 or above, with an average rating of 7.5. Sixteen percent of respondents rated it at 5 or less. Less than
half (45%) felt COVID-19 had little to no impact on their mental wellbeing, however more said that it was worse
because of COVID-19 (49%) and only 6 per cent felt it was better. Those feeling COVID-19 had negatively impacted
their mental wellbeing were distributed across the rating scale, including three who rating their mental wellbeing as
10. All respondents who rated their mental wellbeing below 4 also said COVD-19 had a negative impact on their
rating. Those feeling COVID-19 had a positive impact were most likely to rate it as 10.
24Figure 22 Distribution of responses to self-rated mental wellbeing with whether it was about the same, better or
worse due to COVID-19
About the same Better Worse
80
60
No. of respondents
40
20
0
1 2 3 4 5 6 7 8 9 10
Self-rating of mental wellbeing
Source: TTaM-CUQ
Financial situation
Figure 23 provides the distribution of self-rated financial situation and again includes the proportion of respondents
at each rating who decided it was the same, better or worse because of COVID. The majority of respondents rated
their financial situation as 8 or above, with an average rating of 7.2. More than one in five respondents rated it at 5
or less (22%). While 57 per cent felt COVID had little to no impact on their financial situation, 31 per cent said that it
was worse because of COVID-19 and 12 per cent felt it was better. Those feeling COVID had negatively impacted
their financial situation were much more likely to rate it at 7 or below, and those feeling COVID had a positive impact
were more likely to rate it 8 or above.
25Figure 23 Distribution of responses to self-rated financial situation with whether it was about the same, better or
worse due to COVID-19
About the same Better Worse
60
No. of respondents
40
20
0
1 2 3 4 5 6 7 8 9 10
Self-rating of financial situation
Source: TTaM-CUQ
These results suggest that COVID-19 had the largest impact on the mental wellbeing of quarantine centre
respondents, however overall, they rated their financial situation lower than their physical or mental wellbeing. We
note that self-rated wellbeing is a subjective measure and situation dependent (Deaton & Stone, 2013), however our
results are improved by showing the level of impact COVID-19 had on their rating. Interestingly, even those at the
extreme positive end of the scale indicated that COVID-19 had a negative or positive influence on aspects of their
wellbeing.
In comparison to other States/Territory, people in the Territory were the least impacted by the more severe
restrictions associated with containing the spread of CVOID-19. This is generally supported by a comparison of the
impact of COVID-19 between respondents from the Territory and respondents from other places. Victorian
respondents were also pulled out separately because of their extended period of lockdown (Table 3). Data showed
smaller proportions of NT respondents said that COVID-19 had made the physical and mental domains of their
wellbeing worse, however they felt their financial situation was more negatively affected compared to respondents
from other places, including Victorians. This may be linked to the transactional costs of being required to quarantine
to return home or to conduct business interstate while it may have been a financial choice for some non-residents.
Table 3 Comparative impacts of COVID-19 on domains of wellbeing, NT residents vs Non-residents
Non-residents Non-residents
Impact of COVID-19 Residents total Victorians only
Physical wellbeing
Better 8.47% 10.2% 11.1%
About the same 71.2% 59.8% 58.6%
Worse 20.3% 30.1% 30.3%
26Mental wellbeing
Better 3.4% 6.5% 5.6%
About the same 52.5% 41.2% 40.2%
Worse 44.1% 52.2% 54.3%
Financial situation
Better 10.2% 13.1% 12.8%
About the same 44.1% 59.6% 57.3%
Worse 45.8% 27.4% 29.9%
Source: TTaM-CUQ
Overall impacts on people’s lifestyle
A free-text question in the survey provided an opportunity for respondents to comment further on how COVID-19
had impacted their lives. We undertook a meta-analysis of these texts to identify the main themes related to the
effects of COVID-19. Many responses contained sentiments that contributed to more than one theme. Generally,
the sentiments expressed were more negative to the respondents’ general wellbeing.
Figure 24 shows themes expressing negative sentiments as a proportion of total responses. The most common theme
was related to impacts on mental health including increased stress, anxiety, loneliness and isolation which was
evident in 23 per cent of respondent comments. A related theme was more explicitly connected to the impacts of
lockdown including the lack of social contact and comments on what were felt to be draconian restrictions and limits
to personal freedoms. The consequences to physical health were also mentioned in 7 per cent of responses.
“I have become a lot more introverted and nervous to spend time with other people because of the fears of getting
covid and because of the lockdown restrictions which were in place in Melbourne. I feel like I have to relearn how to
have an active and busy social and work life. I’ve also become a lot more sedentary which has made me quite unfit
because I hate exercising with a mask on.”
“We used to live in Melbourne, and for the last 6 months it has felt like we were under house arrest. We (a couple)
lived in a tiny 1 bedroom apartment which we loved, but which was not at all chosen with 24/7 working from home
in mind.”
Being separated from family and friends was the second most common theme (21% of responses) and this was linked
by many to the limitations around travel and increased costs. The opportunity and financial costs of quarantine
requirements were also cited in 36 responses and many of these wrote about less family time because of the
quarantining requirements of their fly-in, fly-out work conditions.
“Forced 2 weeks quarantine every time I return from offshore roster. Reduced time with family …”
A loss of control or increased uncertainty around planning for the future was distressing for 5 per cent of
respondents.
“It has been a huge relief to be able to come here, and have the feeling that at least we’re “doing something”, during
this time where it feels like all of our agency has been stripped away.”
“I think twice before making decisions. I have to think foe [sic] two – me and CoVid.”
“… Also, there’s a greater sense of uncertainty when it comes to making plans for the future.”
27Other distresses were expressed around disruption to or ending of relationships and personal grief about not be able
to see loved ones in critical care or attend funerals. Having increased responsibilities for caring or meeting the special
needs of people being cared for was also cited by a small number.
Figure 24 Negative themes associated with the impact of COVID-19 on overall lifestyle
Stress, anxiety, isolation, low motivation
Separation from family and friends
Lockdown conditions
Lost job or reduced employment/ hours /security / business
Concerns being in public, reduced social life, restricted activities
Opportunity and financial costs of quarantine
Limits to travel/ higher costs
Less healthy including being more sedentary, eating/drinking…
Relocated for work or lifestyle
Work/study from home, forced online
Mistrust of government, unable to get government support
Higher uncertainty/ loss of control
Relationship interruption/ breakdown, unable to see loved ones…
Negative financial impacts, less superannuation
More difficult or increased caring responsibilities
0 5 10 15 20 25
% of total responses
Source: TTaM-CUQ
A smaller proportion of comments picked up neutral or positive sentiments (Figure 25). Just over 5 per cent said
COVID-19 had little or no impact on their overall lifestyle. Others pointed to the opportunities presented by the social
restrictions to reassess life (2.6%) and being forced to slow down and attend to self and family care (2.6%).
“It has increased possibility and growth for our family.”
“ … Positive impact – I have gotten through a lot of ‘life admin’ and started a very productive veggie garden.”
People also expressed gratitude for living in the Territory or being in the Territory where they felt relatively safer and
were offered freedoms to live life more normally.
“Highly restrictive to normal life, impact of children not being able to attend school and usual activities in (sic.)
enormous for us. We are looking forward to living a more normal life again in the Territory.”
28A small number expressed comments that COVID-19 had improved their financial position which may also be
reflected in some of the positive financial wellbeing data. It could be related to fewer opportunities to spend money
leading to increased savings, or increased social assistance associated with the jobKeeper and jobSeeker4 schemes.
Figure 25 Positive or neutral themes associated with the impact of COVID-19 on overall lifestyle
Limited or no impact
New appreciation, assessing values/ meaning
Slowed down, more time to look after self/ family
Better overall health/ wellbeing
Grateful for living in, being in the Territory
Travelled more
Improved financial position, spending less
0 1 2 3 4 5 6
% of total responses
Source: TTaM-CUQ
Key findings of COVID-impacts on wellbeing domains
• On a scale of 0 to 10, respondents rated their physical wellbeing (average = 8.1) higher than their
mental wellbeing (average = 7.5) and higher than their financial situation (average = 7.2). However
greater numbers felt that COVID-19 had a negatively impacted their mental wellbeing. Many
respondents reported higher levels of stress and anxiety and feelings of isolation and loneliness.
• The financial circumstances of people in quarantine was likely affected by the generally negative
impacts from COVID-19 on their employment and the expenses associated with quarantining. Territory
residents appeared disproportionally impacted in this domain, potentially reflecting the additional cost
overheads of having business, family and support networks in other states/territory.
11. Impacts of COVID-19 on others thinking of migrating to the Northern Territory
To gauge sentiments on the impact of COVID-19 on more general migration intentions associated with moving to
the Territory, we asked respondents ‘Do you know anyone who is thinking about migrating to the Northern Territory
4
JobSeeker is the financial assistance offered by the Commonwealth government for Australians between 22 and the age
pension age who were looking for work. It replaced Newstart Allowance and was generally provided at a higher amount.
29(either from overseas or from elsewhere in Australia )’ and followed this with the question ‘Given developments with
COVID-19, do you think they are more likely, less likely or equally likely to migrate to the Territory in the next 6 to 12
months?’
Overall 77 people or 27 per cent of quarantine respondents knew of someone who was thinking about moving to
the NT. Sixty percent of these thought they were more likely to move to the NT because of current COVID conditions.
12. Last words
The survey provided a final opportunity to comment and many of the respondents’ sentiments aligned well with the
diverse function the quarantine centres played for the three groups of residents – the people who lived in the
Territory, visitors and those relocating. A selection of quotes has been used to demonstrate the interaction between
the quarantine function and the respondent’s reason for being there.
For returning Territorians, the quarantine centres facilitated their journey home or became a part of doing business
in other states during the pandemic. Some suggested that the centres were an exemplar in providing a safe and
healthy environment that significantly lowered the risk of transmission associated with travel.
“… I think it should become the only centre for quarantine in Aus. It seems that hotels have a comparatively higher
risk of transmission and of negative mental health impacts. Howard Springs permits outside exercise and
conversation with other travellers. It's a great model that deserves to be promoted and replicated “
For most visitors, the function of quarantining in the NT was simply to get them to somewhere else. It appeared that
respondents thought it was a comparatively efficient and effective experience, and it was likely the NT was actively
chosen as their preferred place to quarantine in some cases.
“I will only be in the territory for quarantine before leaving and returning to Perth where we live. “
“Thankyou to the NT government for such an amazing quarantine process and for being so warm and welcoming to
Victorian’s …NT has been a wonderful experience so far and certainly has a place in my heart already, and if I didn’t
have a job to get to 2 days after the end of my quarantine I would stay here for as long as I could. I will be back for
a holiday as soon as restrictions allow. Thankyou”
For those relocating in the longer term, quarantine was a necessary part of their larger migration decision that may
itself have been inspired in part by the pandemic. This situation could define a “COVID refugee”.
“… I am ready to settle here, make a life for myself around family and friends, a culture with enormous opportunity,
exploration, travel and adventure… It just took covid in Melbourne to give me the kick up the B to get here…”
For those relocating in the short term, quarantining in the NT appeared to be associated with being uncertain about
where they may decide to live, and some suggested they would keep their options open.
“Id [sic] love to move to the nt. If the cost was less it would be much easier. Thank you nt gov [sic] for providing a
safe quarranteen [sic] facility and allowing victorians to come here. Its very much appreciated by myself and my
family.”
“I think NT, like South Australia; is well place [sic] to see increased migration over the next 12 months. Depending
on how CVOID plays out with vaccines and the like – this may extend into long term relocation over the next 3+years.
That is certainly my plan at this stage.”
A number of respondents took the opportunity to caution about complacency in dealing with the threat of COVID-
19 and the importance of quarantine as a strong line of defence. Examples are presented below.
30“I dearly hope that the quarantine is kept working strictly and following all possible precautions, because it only
takes one careless person to bring COVID here, too, and having seen what is happening all over the world, it’s be a
huge shame if COVID swept the Top End. I especially hope that international arrivals will be treated with untmost
[sic] caution, and that we don’t become complacent and throw open the floodgates.”
“I am a bit concerned about the influx of international travellers to Howard springs. I am terrified of catching Covid
as I must start my new job on xxx in [other state] and can’t afford to become unwell and unable to get there. I’m
sure all the processes are very strict but there is a lot of concern in the facility about this…”
It was evident in the process of this research that different health standards were regulating the application of travel
restrictions by State and Territory governments. Hard borders within and between States, hot spot declarations and
general restrictions to some remote communities meant it was sometimes difficult to effectively filter information
that supported individual circumstances. This led to people being in quarantine unexpectedly and to increased
anxiety around the opportunity costs of quarantine, both financially and emotionally.
“it was very confusing to come through NT from NSW when I live in xxx on the border of xxx. I needed to go into xxx
for medical reasons and had a permit. Hot Spots means different things to different states .. after many phone calls
and looking on government we sites [sic], no two people gave me the same answer. I found that out only by arriving
and being put in quarantine. Information through out Australian is very confusing. I wish they had been more united
as a country ..”
Discussion and policy implications
This Working Paper is based on responses to two surveys of people quarantining in the two NT government facilities
during the period 15 September to 31 January 2021. It provides unique information to the research gap about who
is utilising quarantine to assist their movement and migration within Australia. The data described the demographic
characteristics of the responding quarantine residents, and the flow of people from their origin state/territory to
their destination state/territory. It also identified the reason people were in the Territory which allowed investigation
of three groups of people in the quarantine facilities: those returning home, those visiting or passing through and
those relocating to the Territory. The main findings are below:
• The majority of quarantine survey participants were visiting the Territory and most of these were in
transit to another state/territory. The main state of origin was Victoria.
• Almost a third of respondents of TTaM-CUQ indicated they were relocating to the Territory however only
60 per cent of these intended to live in the Territory for 12 months or more.
• Those respondents relocating in the longer term (18%) were generally female, in their early and mid-
careers, more likely to be in a relationship than single, and 80 per cent were from Melbourne. Those
relocating in the short term (12%) were even more likely to be female and single. Similarly, most were
from Melbourne and generally in their early career (18-29 years) which is the life stage where general
population migration is highest. Traditionally this is the group with largest in-migration numbers to the
Territory which makes their appearance in the quarantine survey data unsurprising.
• There was some evidence of pandemic inspired relocation to the Territory. Whether this “refugees”
stream increases, or they remain in the longer terms needs further monitoring of migration trends.
31You can also read