Quantitative immunohistochemical analysis of myeloid cell marker expression in human cortex captures microglia heterogeneity with anatomical ...
←
→
Page content transcription
If your browser does not render page correctly, please read the page content below
www.nature.com/scientificreports

            OPEN            Quantitative immunohistochemical
                            analysis of myeloid cell marker
                            expression in human cortex
                            captures microglia heterogeneity
                            with anatomical context
                            Molly E. V. Swanson1,2, Helen C. Murray1,2, Brigid Ryan1,2, Richard L. M. Faull1,2,
                            Mike Dragunow2,3 & Maurice A. Curtis1,2*

                            Current immunohistochemical methods of studying microglia in the post-mortem human brain
                            do not capture the heterogeneity of microglial function in response to damage and disease. We
                            therefore investigated the expression of eight myeloid cell proteins associated with changes in
                            function alongside Iba1. To study the myeloid cells we used immunohistochemistry on post-mortem
                            human middle temporal gyrus sections from neurologically normal individuals. First we investigated
                            co-labelling between the classical ‘activation’ marker, HLA-DR and each of the other markers of
                            interest. Significant co-labelling between HLA-DR with CD206, CD32, CD163, or L-Ferritin was
                            observed, although complete overlap of expression of HLA-DR with aforementioned markers
                            was not observed. A qualitative assessment also demonstrated that perivascular macrophages
                            expressed higher levels of the markers of interest we investigated than microglia, suggesting
                            perivascular macrophages show a more phagocytic and antigen presentation state in the human
                            brain. To determine whether the markers of interest were expressed in different functional states,
                            the immunoreactivity for each marker was qualitatively assessed on microglial morphologies.
                            Degenerating marker, L-Ferritin, was specific for dystrophic microglia. We demonstrate that microglial
                            heterogeneity can be investigated in immunohistochemically stain post-mortem human tissue by
                            integrating the single-cell abundance of proteins and cell morphology to infer function.

                            Abbreviations
                            CD	Cluster of differentiation
                            CNS	Central nervous system
                            GM	Grey matter
                            HLA-DR	Human leukocyte antigen, DR isotype
                            Iba1	Ionised calcium binding adaptor protein 1
                            MOI	Marker of interest
                            PI	Point intensity
                            PMD	Post-mortem delay
                            PVM	Perivascular macrophage
                            TSA	Tyramide signal amplification
                            UEA-1	Ulex europaeus-1
                            WM	White matter

                            1
                             Department of Anatomy and Medical Imaging, Faculty of Medical and Health Science, University of Auckland,
                            Private Bag 92019, Auckland, New Zealand. 2Centre for Brain Research, Faculty of Medical and Health Science,
                            University of Auckland, Private Bag 92019, Auckland, New Zealand. 3Department of Pharmacology and Clinical
                            Pharmacology, Faculty of Medical and Health Science, University of Auckland, Private Bag 92019, Auckland, New
                            Zealand. *email: m.curtis@auckland.ac.nz

Scientific Reports |   (2020) 10:11693              | https://doi.org/10.1038/s41598-020-68086-z                                        1

                                                                                                                                   Vol.:(0123456789)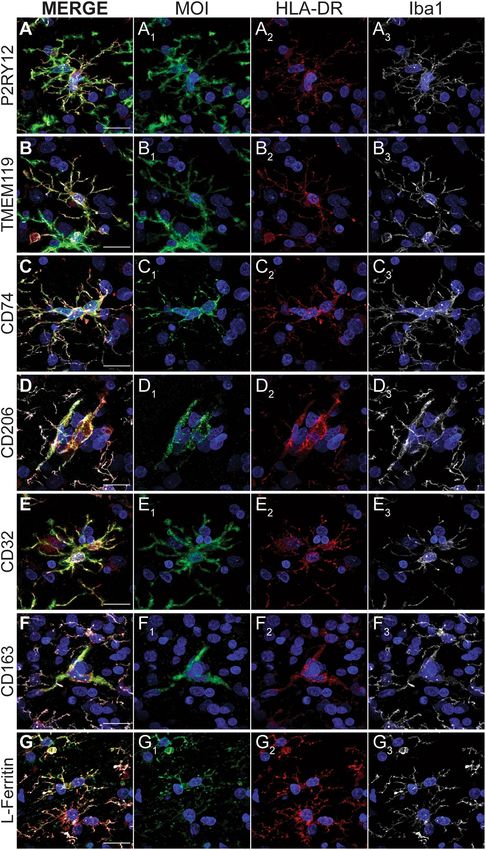
www.nature.com/scientificreports/
Marker Microglia Perivascular Macrophage
P2RY12 +++ −
TMEM119 +++ −
HLA-DR ++ +++
CD74 +++ +++
CD206 − +++
CD32 ++ +++
CD163 + ++
L-Ferritin ++ −
Table 1. Semi-quantitative summary of marker abundance on myeloid cell populations. Key: (−) not
observed, ( +) low abundance, (+ +) moderate abundance, or (+ + +) high abundance in the myeloid cell
population.
Microglia are the innate immune cells of the brain capable of responding to damage and disease. Because of
the high abundance of stimuli in vivo, the variety of microglial reactions in the normal and diseased human
brain make this population highly heterogeneous. Historically, these microglial reactions during damage and/
or disease have been considered ‘activation’. However, this on/off terminology is being phased out as it does not
reflect microglial h eterogeneity1. We sought to investigate how the heterogeneity of microglial and perivascular
macrophage reactions can be investigated in post-mortem human tissue, integrating the single-cell abundance
of key proteins of interest and cell morphology to infer function.
We sought to investigate seven myeloid cell proteins in this study: P2RY12, TMEM119, CD74, CD206,
CD32, CD163, and L-Ferritin. These proteins were chosen because they have previously been highlighted by
single cell RNA sequencing studies, investigated in post-mortem human brain studies, we could demonstrate
antibody specificity in human brain, or show a unique expression by microglia or perivascular macrophages
(Supplementary Table 1)2–26. We investigated the expression of these myeloid cell proteins in the human brain
by co-labelling them with the classical immunohistochemical ‘activation’ marker, human leukocyte antigen-DR
isotype (HLA-DR), investigating their expression on microglia and perivascular macrophages, and identifying
their expression on microglia with different morphologies.
One of the most common immunohistochemical markers used to identify and quantify so-called microglial
activation in the normal and diseased post-mortem human brain is HLA-DR27–29. HLA-DR is an antigen pres-
entation molecule involved in the activation of the adaptive immune system. This function, along with high
HLA-DR immunoreactivity being identified surrounding amyloid beta plaques in human Alzheimer’s disease
brains, resulted in HLA-DR being classed as a marker of pan microglial ‘activation’ in immunohistochemistry
studies30,31. This presents challenges when considering the heterogeneity of microglial reactions to damage and
disease. Furthermore, HLA-DR is constitutively expressed by some resting microglia in the human brain and
there is no evidence that HLA-DR is up-regulated through all forms of microglial reactions32,33. HLA-DR is only
one of thousands of proteins that are differentially up-regulated during a microglial reaction to damage and/
or disease and reflects only one function. We hypothesise that using multiple markers which reflect different
myeloid cell functions will better capture the heterogeneity of microglial functions in studies of post-mortem
human tissue. We quantified the co-labelling between each marker and HLA-DR to determine whether we could
identify different microglial populations in the post-mortem human brain that likely had different functions in
the brain. Determining the expression of this subset of proteins relative to the classical immunohistochemical
activation marker allowed us to determine whether they are expressed by unique populations of myeloid cells
that do not express HLA-DR.
To determine whether the markers of interest (MOIs) are upregulated on microglia that have diverse mor-
phologies, we assessed MOI expression on the common microglial morphologies as a proxy for particular micro-
glial functions. Morphological changes occur during microglial responses to damage and/or disease, and are
hypothesised to increase functions to maintain brain h omeostasis33. Five distinct microglial morphologies are
readily identifiable: ramified, hypertrophic, dystrophic, rod, and a moeboid25,33–42. In previous studies of post-
mortem human brain tissue, microglial morphologies have been used to infer activation state and function
25,26,38,40
. However, it is important to note that microglial functions are not specific to a given morphology, but
rather that morphologies can imply an increase in given functions. We investigated protein expression on dif-
ferent microglial morphologies to determine their expression throughout different microglial states indicative
of different functions.
One consideration of this study was that microglia are not the only myeloid cells in the human brain that
express the proteins being investigated. Perivascular macrophages (PVMs) are one border-associated macrophage
population that reside in the perivascular space of the blood brain b arrier16,20,43–46. While microglia and PVMs
are both resident myeloid populations in the human CNS, they occupy different central nervous system com-
partments and are therefore different functional populations. Because the hypothesis of this study was that the
proteins investigated can be used as markers of microglial activation and function in the brain, the expression
pattern of these proteins on microglia and PVMs was examined.
By determining the expression pattern of proteins indicative of function on microglia and PVMs in post-
mortem human tissue we have demonstrated the ability to identify myeloid cell heterogeneity in the human
cerebral cortex with anatomical context. Our results provide a baseline for the co-labelling of these markers
Scientific Reports | (2020) 10:11693 | https://doi.org/10.1038/s41598-020-68086-z 2
Vol:.(1234567890)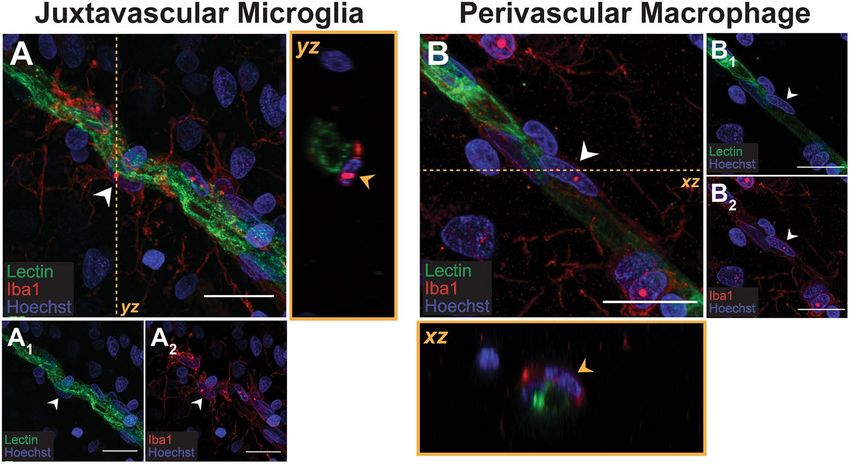
www.nature.com/scientificreports/
with HLA-DR in neurologically normal aged brains which establishes important context for subsequent studies
of neurological disease.
Results
Markers of interest are differentially expressed in grey versus white matter across the
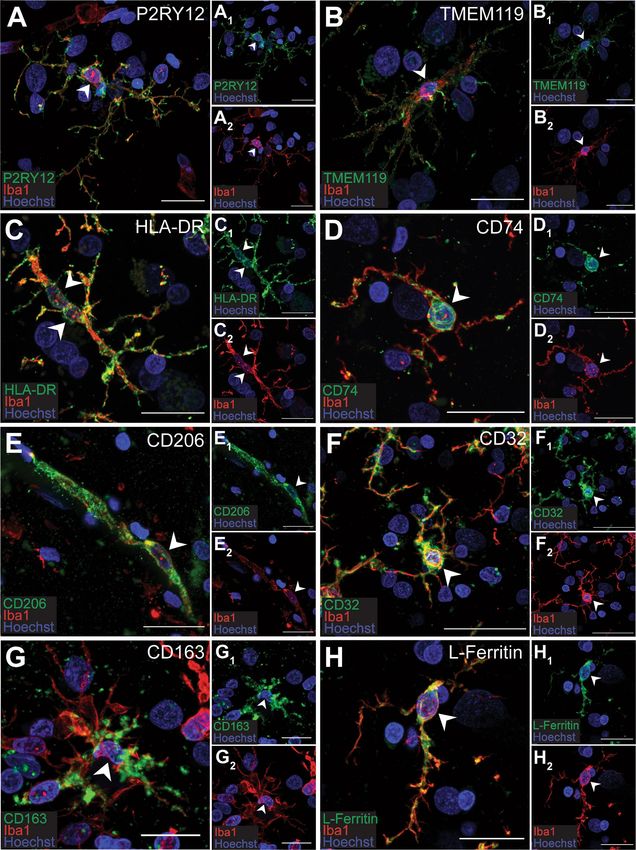
Iba1‑positive population. The immunoreactivity of the MOIs indicative of function were first assessed on
Iba1-positive myeloid cells in the middle temporal gyrus grey matter (GM) and white matter (WM) from neu-
rologically normal subjects. Immunoreactivity for P2RY12, TMEM119, HLA-DR, CD74, CD206, CD32, CD163,
and L-Ferritin was observed on Iba1-positive cells (Fig. 1).
To investigate the expression of the MOIs within the myeloid cell population we used manual cell counting
to determine the percentage of total Iba1-positive cells that were immunoreactive for each MOI. We carried
out this quantification in both the GM and WM as previous research has not investigated the potential differ-
ences in the MOI expression between these regions. It is important to note that we deemed it appropriate to
compare the abundance of MOIs normalised to the total number of Iba1-positive cells for this study because
we did not identify any difference in Iba1-positive cell density between GM and WM (mean WM-GM differ-
ence = 17.16 ± 20.88 cells/mm2, p = 0.1001).
P2RY12 and CD74 were the most abundant markers in the Iba1-positive population and were equally distrib-
uted between GM and WM (Fig. 2). The two least abundant markers were CD206 and CD163, which were more
highly expressed by Iba1-positive cells in GM than WM (Fig. 2). CD32 and L-Ferritin, were also more highly
expressed by Iba1-positive cells in the GM than WM (Fig. 2). TMEM119 and HLA-DR, were expressed equally
by Iba1-positive cells in the GM and WM (Fig. 2). The abundance of the MOIs in the Iba1-positive population
did not correlate with age or post-mortem delay (Supplementary Fig. 2).
Markers of interest are expressed by HLA‑DR‑positive Iba1‑positive cells, but the cell‑by‑cell
intensity of each marker does not strongly correlate with HLA‑DR intensity. Quantification
of the MOIs on Iba1-positive cells demonstrated that the percentage of Iba1-positive cells that expressed these
proteins differed depending on the MOI. We hypothesised that this was because at least some of the MOIs were
up-regulated by microglia with different predominant functions during reactions. We hypothesised that these
MOIs could be expressed by functional populations not expressing HLA-DR. To test this hypothesis, we carried
out a co-labelling analysis with HLA-DR. Only the GM was used for this aspect of the study and all Iba1-positive
cells within the image were manually counted.
All the MOIs we studied co-labelled with HLA-DR (Fig. 3). To determine whether there was a relationship
between HLA-DR and MOI expression, we investigated the correlation between the point intensities of HLA-DR
and each MOI on all Iba1-positive cells (Fig. 4). No linear correlations between HLA-DR point intensities and
TMEM119 or P2RY12 point intensities were observed on Iba1-positive cells (Fig. 4A, B). Only moderate correla-
tions between HLA-DR point intensities and the remaining MOI point intensities were observed (Fig. 4C–G).
Of these correlations, we further analysed the cells with HLA-DR or MOI point intensities in the top ten percent
of values to determine whether the Iba1-positive cells that are potentially the most reactive are up-regulating
multiple proteins and respective functions. When the top ten percent of HLA-DR point intensities were analysed,
we did not observe any stronger correlations with the MOI point intensities (Supplementary Fig. 3). Furthermore,
when the top ten percent of MOI point intensities were analysed, no stronger correlations with HLA-DR point
intensities were observed (Supplementary Fig. 3). Therefore, the Iba1-positive cells that highly express HLA-DR
do not highly express other MOIs indicative of other microglial functions.
Categorisation of HLA‑DR and MOI populations shows functional markers are more abun-
dant on HLA‑DRhigh than on HLA‑DRlow Iba1‑positive cells. Some moderate linear correlations were
observed in the overall correlations of HLA-DR with MOI point intensities on Iba1-positive cells. However, the
highest ten percent of HLA-DR or MOI point intensity correlations demonstrated that high HLA-DR and high
MOI expression did not always co-occur. This result may have simply been an artefact of HLA-DR and MOI
point intensity variability across Iba1-positive cell bodies. To test this, we carried out a second analysis whereby
we categorised Iba1-positive cells as HLA-DRhigh/low and M OIhigh/low, resulting in four populations; HLA-DRhigh
MOI , HLA-DR MOI , HLA-DR MOI , and HLA-DRlow MOIlow. Chi-square analyses were used on
high high low low high
the pooled Iba1-positive populations from all six normal cases to determine whether there was a relationship
between the cellular abundance of HLA-DR and the MOIs (Fig. 5A–G). The percentage of MOIhigh cells within
the HLA-DRhigh versus the HLA-DRlow populations was analysed to determine whether HLA-DRhigh cells had a
higher abundance of the MOI (Fig. 5H–N). Conversely, the percentage of HLA-DRhigh cells within the MOIhigh
versus the M OIlow populations was analysed to determine whether the MOIhigh population had a higher abun-
dance of HLA-DR (Fig. 5O–U). This categorial analysis allowed us to determine whether the MOIs investigated
in this study are highly expressed by Iba1-positive cells not expressing HLA-DR.
In accordance with the lack of linear correlations identified, a Chi-square analysis on the pooled Iba1-positive
HLA-DR-P2RY12 and HLA-DR-TMEM119 populations showed no relationship between HLA-DR and the
expression of P2RY12 or TMEM119 (Fig. 5A, B). Furthermore, when the populations were grouped by HLA-
DRhigh/low, the percentage of the HLA-DRhigh population identified as P2RY12high or TMEM119high was not statisti-
cally different from the percentage of the HLA-DRlow population that was P2RY12high or T MEM119high (Fig. 5H,
I). The same result was observed when the populations were grouped by P2RY12high/low or TMEM119high/low and
the percentage of these populations that were HLA-DRhigh were compared (Fig. 5O, P). Therefore, neither micro-
glial-specific marker is more abundant on HLA-DRhigh Iba1-positive cells than on HLA-DRlow Iba1-positive cells.
Scientific Reports | (2020) 10:11693 | https://doi.org/10.1038/s41598-020-68086-z 3
Vol.:(0123456789)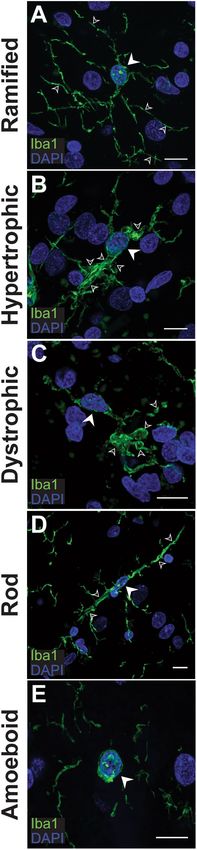
www.nature.com/scientificreports/

                                      Figure 1.  Marker of interest expression by Iba1-positive cells. MOIs, P2RY12 (A), TMEM119 (B), HLA-DR
                                      (C), CD74 (D), CD206 (E), CD32 (F), CD163 (G), and L-Ferritin (H), were fluorescently co-labelled with pan
                                      myeloid cell maker, Iba1, and Hoechst nuclear counterstain in 50-µm thick normal human middle temporal
                                      gyrus sections. Images are maximum projections of confocal z-stacks; scale bars = 20 µm. Arrows indicate Iba1-
                                      positive cell bodies with marker of interest immunoreactivity.

          Scientific Reports |   (2020) 10:11693 |              https://doi.org/10.1038/s41598-020-68086-z                                             4

Vol:.(1234567890)
www.nature.com/scientificreports/
Figure 2. Quantification of the abundance of markers of interest on Iba1-positive cells. Iba1-positive cells were
manually counted in the human middle temporal gyrus and the proportion immunoreactive for MOIs P2RY12,
TMEM119, HLA-DR, CD74, CD206, CD32, CD163, or L-Ferritin was determined. The number of MOI-
positive cells were normalized to the total number of Iba1-positive cells, and the percentages of MOI-positive
cells in GM and WM were compared using paired t-tests. Data presented with each case represented by a single
point and the percentages measured in GM and WM are joined per case (n = 6). Significant difference between
GM and WM: *p < 0.05.
Chi-square analysis on the pooled Iba1-positive HLA-DR-CD74 population demonstrated a relationship
between HLA-DR and CD74 expression (Fig. 5C). When the HLA-DR-CD74 populations was grouped by
HLA-DRhigh/low, we found that the percentage of the HLA-DRhigh population that was CD74high was significantly
higher than the percentage of the HLA-DRlow population that was CD74high (Fig. 5J). In contrast with this, when
the HLA-DR-CD74 populations were grouped by C D74high/low, the percentage of the C D74high population that
was also HLA-DRhigh was not significantly different to the percentage of the C D74low population that was HLA-
DRhigh (Fig. 5Q). Therefore, while CD74 was more abundant in the HLA-DRhigh population, HLA-DR was equally
abundant in the CD74high and C D74low populations.
Because of the high expression of P2RY12, TMEM119, and CD74 across the entire Iba1-positive population
and the unremarkable pattern of co-labelling with HLA-DR, these three MOIs are unlikely to reflect unique
functional populations of reactive microglia in post-mortem human brain.
Chi-square analyses on the remaining pooled Iba1-positive HLA-DR-MOI populations demonstrated rela-
tionships between HLA-DR and the remaining MOIs (Fig. 5D–G). When the populations were grouped by
HLA-DRhigh/low, we found that the percentage of the HLA-DRhigh population that was M OIhigh was significantly
higher than the percentage of the HLA-DRlow population that was M OIhigh (Fig. 5J–N). Therefore, these five
MOIs were more abundant in the HLA-DRhigh than the HLA-DRlow population. For the remaining MOIs, when
the populations were grouped by MOIhigh/low, the percentage of the MOIhigh population identified as HLA-DRhigh
was significantly higher than the percentage of the M OIlow that were HLA-DRhigh (Fig. 5R–U). Therefore, we
identified significant co-labelling between HLA-DR and CD206, CD32, CD163, or L-Ferritin in post-mortem
human brain tissue. It is important to note that for all of these MOIs, we also identified HLA-DRhigh MOIlow and
HLA-DRlow MOIhigh populations. So while HLA-DRhigh Iba1-positive cells are more likely to also be M OIhigh than
HLA-DRlow Iba1-positive cells, some Iba1-positive cells uniquely express HLA-DR or a MOI highly.
Markers of interest are differentially expressed by microglia and perivascular macrophages in
the normal human middle temporal gyrus. Our results so far have not distinguished between the dif-
ferent types of myeloid cells that express Iba1 in the human brain. Within the middle temporal gyrus grey matter,
we would expect to encounter both Iba1-positive microglia and PVMs. The majority of microglia are not associ-
ated with blood vessels and they are therefore typically easily distinguishable from PVMs. However, a subset of
microglia (juxtavascular microglia) are located alongside blood vessels and are therefore indistinguishable from
PVMs by location alone. To overcome this issue, Iba1-positive cells were classified as microglia or PVMs based
on their cellular morphology and location relative to lectin-positive blood vessels. Microglia were identified as
Iba1-positive cells with a highly ramified morphology which could be juxtavascular i.e. associated with lectin-
positive blood vessels (Fig. 6A), as well as scattered throughout the brain parenchyma. In contrast, PVMs were
identified as Iba1-positive cells with an elongated cell body adjacent to lectin-positive blood vessels (Fig. 6B).
Using this method to identify microglia and PVMs, we investigated the marker of interest immunoreactivi-
ties on these CNS myeloid cells (Table 1). Based on the semi-quantitative assessment of the population wide
expression, seven of eight MOIs investigated were differentially expressed by microglia versus PVMs. P2RY12,
TMEM119, and L-Ferritin were only observed on microglia. Conversely, CD206 was only observed on PVMs.
HLA-DR, M CD32, and CD163 were expressed by both microglia and PVMs but were more highly expressed by
PVMs than microglia. CD74 was the only marker to be equally expressed by both myeloid populations.
Scientific Reports | (2020) 10:11693 | https://doi.org/10.1038/s41598-020-68086-z 5
Vol.:(0123456789)www.nature.com/scientificreports/
Figure 3. Immunofluorescent co-labelling of markers of interest with HLA-DR on Iba1-positive cells.
MOIs, P2RY12 (A), TMEM119 (B), CD74 (C), CD206 (D), CD32 (E), CD163 (F), and L-Ferritin (G), were
fluorescently co-labelled with HLA-DR, pan myeloid cell maker, Iba1, and Hoechst nuclear counterstain in
50-µm thick normal human middle temporal gyrus sections. Images are maximum projections of confocal
z-stacks; scale bars = 20 µm.
Scientific Reports | (2020) 10:11693 | https://doi.org/10.1038/s41598-020-68086-z 6
Vol:.(1234567890)www.nature.com/scientificreports/
Figure 4. Correlation analysis of marker of interest and HLA-DR point intensities on Iba1-positive cells. One
MOI was co-labelled with HLA-DR and pan myeloid cell marker, Iba1, in 10-µm thick normal human middle
temporal gyrus sections. Iba1-positive cells in the grey matter were manually counted and the point intensities
of the MOI and HLA-DR were measured. All Iba1-positive cell HLA-DR and MOI point intensities were pooled
from all cases and Pearson’s correlations were used to determine whether the HLA-DR point intensity correlated
with the point intensities of MOI P2RY12 (A), TMEM119 (B), CD74 (C), CD206 (D), CD32 (E), CD163 (F), or
L-Ferritin (G). Abbreviation: PI, point intensity.
Marker of interest expression varies across microglial morphologies. The identification of high,
but not total, co-occurrence of HLA-DRhigh and M OIhigh expression in the case of CD32, CD163, and L-Ferritin
led to the hypothesis that each of these MOI are more up-regulated during different microglial reactions than
HLA-DR. We hypothesise that high expression of HLA-DR or the MOIs investigated in this study are indica-
tive of an increase in a distinct function during microglial reactions. One way of assessing microglial reactions
in post-mortem human tissue is through the analysis of microglial morphologies. Therefore, to investigate this
Scientific Reports | (2020) 10:11693 | https://doi.org/10.1038/s41598-020-68086-z 7
Vol.:(0123456789)www.nature.com/scientificreports/
Figure 5. Distribution analyses of categorized HLA-DR and marker of interest high-low Iba1-positive ▸
populations. One MOI was co-labelled with HLA-DR and pan myeloid cell marker, Iba1, in 10-µm thick normal
human middle temporal gyrus sections. The point intensities (PI) of HLA-DR and MOI P2RY12 (A, H, and
O), TMEM119 (B, I, and P), CD74 (C, J, and Q), CD206 (D, K, and R), CD32 (E, L, and S), CD163 (F, M, and
T), or L-Ferritin (G, N, and U) measured on Iba1-positive cells were used to categorize each Iba1-positive cell
as either HLA-DRhigh MOIhigh, HLA-DRhigh MOIlow, HLA-DRlow MOIhigh, or HLA-DRlow MOIlow. Chi-square
analyses were used to determine whether HLA-DR expression and MOI expression are independent of one
another (A–G); data are presented as pooled Iba1-positive cells from the GM of all 6 normal cases. M OIhigh
high low
cells were grouped based on their HLA-DR status, and the proportion of HLA-DR or HLA-DR cells
determined to be MOIhigh were compared with a student’s t-test (H–N); data are presented as mean ± SD (n = 6).
HLA-DRhigh cells were subsequently grouped based on their MOI status, and the proportion of M OIhigh or
MOIlow cells determined to be HLA-DRhigh were compared with a student’s t-test (O–U); data are presented as
mean ± SD (n = 6). Significance of differences between high-low populations: *p < 0.05, **p < 0.01, ***p < 0.001,
****p < 0.0001.
hypothesis, we qualitatively assessed the expression of HLA-DR and MOIs across different microglial morpholo-
gies.
Five Iba1-positive cell morphologies were identified in the normal human brain (Fig. 7). Ramified had small
triangular cell bodies with thin, highly branched processes (Fig. 7A). Hypertrophic reactive microglia had larger
cell bodies with more intense Iba1 immunoreactivity, thickened processes, and were typically bipolar (Fig. 7B).
Dystrophic microglia are the damaged or dying microglia and were identified by de-ramification of processes,
membrane fragmentation, and had small, rounded or irregularly shaped nuclei (Fig. 7C). Rod microglia are
hypothesised to be the supportive morphology, believed to form along neuronal axons in the grey matter to
support signalling38. These were identifiable as bipolar microglia with thin, branching processes that lay parallel
to neuronal axons projecting through cortical layers (Fig. 7D). Amoeboid microglia can functionally traverse
through tissue and readily phagocytose large debris. Morphologically, they have no processes or in some cases,
have a small leading process. In this study, they were most readily identified as cells with Iba1 immunoreactivity
in a layer around the nucleus (Fig. 7E).
Following the identification of Iba1-positive microglial morphologies, the expression of MOIs was inves-
tigated across microglial morphologies. It is important to note that amoeboid microglia were not included in
this study because, (1) amoeboid microglia and macrophages in the brain parenchyma (whether they are due to
infiltration before death or a post-mortem artefact) are difficult to distinguish; and (2) amoeboid microglia are
not abundant in the neurologically normal aged human brain and it was unlikely that a representative amoeboid
microglia sample could be obtained from the sections stained. Furthermore, CD206 was not included in this
analysis due to its immunoreactivity being confined to PVMs.
P2RY12, TMEM119, HLA-DR, and CD74 were expressed across all four morphologies investigated. CD32
was expressed on pure ramified, hypertrophic, and dystrophic morphologies. It was expressed by microglia
that were bipolar and displayed correct cortical orientation characteristic of rod microglia, but these CD32
immunoreactive cells also showed signs of hypertrophy. Similarly, CD163, was only expressed on ramified,
hypertrophic, and dystrophic microglia. Finally, L-Ferritin, was observed on purely dystrophic microglia. Any
ramified or hypertrophic microglia that expressed L-Ferritin appeared to have a mixed morphology whereby
they also showed signs of dystrophy. Furthermore, no rod microglia showed L-Ferritin immunoreactivity. These
results are summarised in Table 2.
Discussion
This study has provided a comprehensive characterization of HLA-DR co-labelling with seven other myeloid cell
proteins that contribute to microglial reactions in vivo. Using single cell immunohistochemical quantification
methods, we have shown that these proteins identify additional reactive microglial populations to that of HLA-
DR alone in post-mortem cortex from neurologically normal aged controls. Our results therefore reinforce the
conclusion from single-cell RNA sequencing studies that microglial heterogeneity is e xtensive4,7,48–50. As such,
we propose that anatomical studies of microglial changes in disease context using post-mortem human tissue
should use this wider panel of panel of markers in conjunction with HLA-DR.
Current immunohistochemical methods of studying microglia in the post-mortem human brain do not cap-
ture the heterogeneity of microglial function changes in response to damage and disease. Even in recent studies,
HLA-DR is the standard and often lone marker used to identify microglial r eactivity27–29. Analysis of microglia
in post-mortem tissue is also complicated by using methods that quantify the immunoreactivity across an area
of tissue and therefore miss the subtlety of changes that occur at the single cell level. We therefore undertook an
immunohistochemical analysis of seven markers whose expression by Iba1-positive cells can be used to infer a
wider range of cell functions in the post-mortem human cortex. We also developed and validated a single cell
quantification method to assess the correlation of marker intensity with HLA-DR intensity. Our results indicate
that this combined approach of single cell immunohistochemical analysis using a range of markers provides a
more comprehensive assessment of microglial heterogeneity in post-mortem tissue with anatomical context.
This is evidenced by our assessment of grey and white matter where we show the diverse expression of these pro-
teins across these two compartments, supporting the findings of previous single-cell RNA sequencing studies50.
Studies of post-mortem tissue are inherently limited in that they reflect a single time point at the end of life and
stage of disease. This makes it difficult to study dynamic processes such as microglial reactions. While single-cell
RNA sequencing studies in human tissue have provided evidence of distinct microglial populations with unique
Scientific Reports | (2020) 10:11693 | https://doi.org/10.1038/s41598-020-68086-z 8
Vol:.(1234567890)www.nature.com/scientificreports/
Scientific Reports | (2020) 10:11693 | https://doi.org/10.1038/s41598-020-68086-z 9
Vol.:(0123456789)www.nature.com/scientificreports/
Figure 6. Anatomical location and morphologies of microglia and perivascular macrophages relative to lectin-
positive blood vessels. Immunofluorescent double-labelling of pan myeloid cell marker, Iba1, with endothelial
cell marker, lectin, with a Hoechst nuclear counterstain in 100-µm thick normal human middle temporal gyrus
sections allowed for the visualization of juxtavascular microglia (A) and PVMs (B) and identification of cell
characteristics. Juxtavascular microglia appeared as highly ramified Iba1-positive cell adjacent to the lectin-
positive endothelial layer of blood vessels (A). The yz orthogonal view demonstrates that the Iba1-positive
microglia lies outside of the blood vessel with no processes penetrating the blood vessel. PVMs appeared
as elongated Iba1-positive cells devoid of processes with large elongated nuclei (B). The xz orthogonal view
demonstrates the PVM lies adjacent to the blood vessel, not within it. Scale bars = 20 µm.
expression signatures, these findings remain to be validated anatomically using immunohistochemistry. Our
approach provides an effective means to capture this spectrum of microglial function changes with anatomical
context and assess new microglial markers in future studies.
Our study investigated proteins that can be used to distinguish microglia and PVMs (TMEM119, P2RY12,
CD206) or infer an increase in different myeloid cell functions such as antigen presentation (HLA-DR, CD74),
phagocytosis (CD32, CD163) or degeneration (L-ferritin). These protein markers have previously been used in
studies of human brain tissue and provided a reliable basis to investigate microglial reaction heterogeneity in
relation to HLA-DR expression using our quantification method. We identified that all seven of these proteins
or MOIs are expressed by HLA-DR-positive myeloid cells (determined by Iba1), but the cell-by-cell intensity of
each marker does not strongly correlate with HLA-DR intensity. Categorisation into high vs low HLA-DR and
MOI populations shows functional markers are more abundant on HLA-DRhigh Iba1-positive cells. Therefore,
our data suggest that these myeloid cell proteins are significantly co-expressed with HLA-DR on Iba1-positive
cells and that the HLA-DR population encompasses a broad range of microglial reactions. However, we also
identified both HLA-DRhigh MOIlow and HLA-DRlow MOIhigh Iba1-positive populations. This finding suggests
that HLA-DR and each of the MOIs also label different functional populations of Iba1-positive cells in immu-
nohistochemically stained post-mortem tissue. This finding is consistent with extensive microglial heterogeneity
observed in single cell RNA sequencing studies and indicates there is considerable heterogeneity even within
the HLA-DR p opulation4,7,48–50.
To further corroborate the functional changes that are implied by increased expression of the myeloid cell pro-
teins, we investigated the expression of the MOIs on microglial morphologies. Different microglial morphologies
can be identified in immunohistochemically stained post-mortem human tissue and are hypothesised to reflect
the predominant function of a given m icroglia33,38,51. An important limitation is that morphological changes are
highly dynamic, and it is extremely difficult to define the morphology of cells that may be in transition between
different states. Therefore, quantitative assessment of morphologies is highly subjective. Studies have attempted
to overcome this subjectivity by developing unbiased computational analysis methods. Cell body size, number of
processes, and process volume have been used to classify microglia into ramified, hypertrophic, dystrophic and
amoeboid morphologies52,53. However, as no defined set of morphological criteria exist, quantification of these
classifications is still highly subjective to user defined parameters38. While qualitative assessment of morpholo-
gies does not account for cells in transitional states, it is possible to identify the cells at the extreme ends of the
transitional spectrum as distinct morphologies. We used this approach to identify whether our markers showed
specificity to any distinct morphologies.
The majority of the MOIs investigated did not show specificity to a single morphology, indicating that their
functional associations are not necessarily indicative of a specific morphological shift. This result indicates that
heterogeneity in microglial reactions encompasses morphological diversity as well as protein expression. How-
ever, L-Ferritin immunoreactivity in the human brain was specific to dystrophic microglia. While the shift from
ramified ‘resting’ morphology to a hypertrophic morphology is associated with microglial reactions, dystrophic
Scientific Reports | (2020) 10:11693 | https://doi.org/10.1038/s41598-020-68086-z 10
Vol:.(1234567890)www.nature.com/scientificreports/
Figure 7. Indication of the five Iba1-positive microglial morphologies in the human brain. Microglia expressing
pan marker, Iba1 (green), with a ramified (A), hypertrophic (B), rod (C), dystrophic (D) and amoeboid (E)
morphology present in the human middle temporal gyrus. Main cell bodies with Hoechst-positive nuclei (blue)
are indicated with block white arrows while morphology characteristics are indicated with small white arrow
outlines. Images are maximum projections of confocal z-stacks; scale bars = 10 μm.
Scientific Reports | (2020) 10:11693 | https://doi.org/10.1038/s41598-020-68086-z 11
Vol.:(0123456789)www.nature.com/scientificreports/
Marker of Interest Ramified Hypertrophic Dystrophic Rod
P2RY12 ✓ ✓ ✓ ✓
TMEM119 ✓ ✓ ✓ ✓
HLA-DR ✓ ✓ ✓ ✓
CD74 ✓ ✓ ✓ ✓
CD32 ✓ ✓ ✓ ✓*
CD163 ✓ ✓ ✓ ×
L-Ferritin ✓* ✓* ✓ ×
Table 2. Immunoreactivity of markers of interest on microglial morphologies. Key: (×) not observed, (✓)
observed, (✓*) observed on mixed morphologies.
Fixation Case number Hemisphere Age Sex Post-mortem Delay (h)
H169 Right 81 Male 24
H187 Left 98 Female 15
Formalin-fixed frozen H196 Left 85 Male 15
H241 Right 76 Female 12
H243 Right 77 Female 13
H229 Right 88 Female 17
H230 Right 57 Female 32
H240 Right 73 Male 27
Paraffin-embedded
H242 Right 61 Male 20
H244 Right 76 Male 16
H246 Right 89 Male 17
Table 3. Human cases used for this study.
morphology is thought to reflect senescence and d egeneration33,34,38,39,51,54,55. The accumulation of dystrophic
L-Ferritinhigh microglia in the AD brain is hypothesised to be a result of disrupted iron h omeostasis25,26, which
is also disrupted in the normal ageing brain. Thus, the L-ferritinhigh population we identified likely reflects age-
related processes. L-Ferritin point intensities moderately correlated with HLA-DR point intensities on Iba1-
positive cells and the Chi-square analysis demonstrated that L-Ferritin was more abundant on HLA-DRhigh cells
than HLA-DRlow cells. This suggests that the HLA-DR microglial population includes degenerating microglia
and together our results support those of previous studies indicating that L-ferritin and dystrophic morphology
can reliably distinguish this population of senescent or degenerating microglia in human tissue25,26.
As our study investigated the expression of myeloid cell proteins on Iba1-positive cells, our analysis included
both PVMs and microglia. To determine the expression of each MOI across these two myeloid cell populations,
and therefore the potential contribution of the PVMs to our results, we carried out a qualitative assessment to
determine MOI expression across microglia and PVMs. We found that HLA-DR, CD206, CD32, and CD163
were more abundant on PVMs than microglia. These protein expression patterns have been observed previously,
where CD206 and CD163 have been described as positive discriminators of PVMs16,20,21,56,57. We identified CD163
immunoreactivity on ramified Iba1-positive microglia which, in parallel with previous studies, demonstrates that
microglia are also capable of up-regulating CD163, just to a lesser extent than P VMs20–24. The three MOIs that
were more highly expressed by PVMs than microglia (CD206, CD32, CD163) have roles in antigen presentation
and phagocytosis15,18,22,30,58. The expression patterns observed in this study therefore suggest that in the normal
human brain PVMs show greater antigen presentation and phagocytic capabilities than microglia.
Protein expression by microglia and PVMs is driven by microenvironmental stimuli. It is therefore hypoth-
esised that the different protein expression profiles of PVMs and microglia are a result of them populating dif-
ferent CNS compartments14. The borders between the brain and the periphery restrict the influx of potentially
harmful peripheral components into the brain parenchyma, thus helping to maintain h omeostasis16,20,43–46. In
normal conditions, parenchymal microglia would have reduced environmental stimuli driving MOI protein
expression. In contrast, PVMs function on the border of the brain and peripheral blood stream, surveying the
influx of peripheral components into the CNS from the b lood59,60. PVMs are therefore subjected to a range of
environmental stimuli and their protein expression is directly influenced by changes in the periphery. PVMs
are key border phagocytes with antigen presentation capabilities that regulate immune responses, and all these
functions involve the up-regulation of proteins like those i nvestigated14,15,20–24,60–62. While the work presented here
is not primarily focused on PVM activation, the differences in MOI expression between microglia and PVMs
do highlight that these difference cell types contribute to the overall myeloid cell heterogeneity that we wish to
study in post-mortem tissue in a disease context in future studies.
Scientific Reports | (2020) 10:11693 | https://doi.org/10.1038/s41598-020-68086-z 12
Vol:.(1234567890)www.nature.com/scientificreports/
Free-floating Immunohistochemistry Paraffin Immunohistochemistry
Company, Catalogue
Primary antibody number Concentration Visualisation Concentration Visualisation
Alexa Fluor 647 sec- Alexa Fluor 647 second-
goat anti-Iba1 Abcam, ab5076 1:2,000 1:1,000
ondary ary
Sigma Aldrich, Alexa Fluor 488 sec-
rabbit anti-P2RY12 1:2,000 1:500 TSA Alexa Fluor 488
HPA014518 ondary
rabbit anti-TMEM119 Abcam, ab185333 1:500 TSA Alexa Fluor 488 1:500 TSA Alexa Fluor 488
Alexa Fluor 488 or 594 Alexa Fluor 594 second-
mouse anti-HLA-DR DAKO, M0775 1:1,000 1:2,000
secondary ary
Alexa Fluor 488 sec- Alexa Fluor 488 second-
rabbit anti-CD74 Abcam, ab64772 1:500 1:1,000
ondary ary
Alexa Fluor 488 sec- Alexa Fluor 488 second-
rabbit anti-CD206 Abcam, ab64693 1:1,000 1:2,000
ondary ary
Alexa Fluor 488 second-
rabbit anti-CD32 Abcam, ab155972 1:500 TSA Alexa Fluor 488 1:2,000
ary
Alexa Fluor 488 second-
rabbit anti-CD163 Abcam, ab182422 1:1,000 TSA Alexa Fluor 488 1:1,000
ary
Alexa Fluor 488 sec- Alexa Fluor 488 second-
rabbit anti-L-Ferritin Sigma Aldrich, F5012 1:2,000 1:5,000
ondary ary
Table 4. Primary antibodies, concentrations, and visualisation methods for this study.
We have presented evidence that single cell immunohistochemical analysis of seven different myeloid cell
proteins can be used to identify unique functional populations that are not distinguished by HLA-DR alone.
We show that these proteins are significantly associated with HLA-DR, but also label Iba1-positive cells without
HLA-DR expression. Furthermore, these markers are expressed by microglia that show a range of morphologies
which emphasizes that both protein expression and morphology reflect overall microglial heterogeneity. We also
identified that these proteins are differentially expressed by microglia and PVMs in the human brain. Our results
provide a baseline for the co-labelling of these markers with HLA-DR in neurologically normal aged brains which
establishes important context for subsequent studies of neurological disease.
Methods
Human tissue processing. Post-mortem human brain tissue was obtained from the Neurological Foun-
dation Human Brain Bank at the University of Auckland Centre for Brain Research. The human tissue was
donated to the Brain Bank with consent from the donors’ families and its use in this project was approved by
the University of Auckland Human Participants Ethics Committee. Eleven normal cases were used for this study
(Table 3; average age = 78.27 ± 12.01 years, range = 61–98 years; average post-mortem delay = 18.91 ± 6.268 h,
range = 12–32 h; 5 female:6 male). All normal cases had no history of cognitive deficits and their cause of death
was unrelated to any neurological condition. The normal cases had age-related pathological changes, relating to
a maximum Braak score of II or maximum CERAD score of A3B0C0 or equivalent, as determined by an inde-
pendent pathological analysis 63–65.
Human brains were obtained at autopsy and the right, and on occasion the left, hemisphere was fixed by
perfusion of formalin through the cerebral arteries and subsequently dissected into blocks, cryoprotected, and
frozen as previously described 66. Coronal Sects. (50- or 100-µm thick) of fixed-frozen middle temporal gyrus
were cut from the normal cases indicated in Table 3 using a freezing sliding microtome and stored at 4 ºC in PBS
containing 0.1% sodium azide. These free-floating sections were used for the identification of MOI expression
on Iba1-positive cells, qualitative co-labelling of each MOI with HLA-DR, the identification and qualitative
assessment of MOI abundance on microglia and PVMs, and the assessment of MOI abundance on microglial
morphologies.
During the dissection of the formalin-fixed hemisphere, 1-cm thick blocks were taken and processed for paraf-
fin embedding as previously described66. For the quantitative co-labelling analysis of each MOI with HLA-DR,
10-μm thick sections were cut from paraffin-embedded middle temporal gyrus blocks from the normal cases
indicated in Table 3 using a rotary microtome.
Fluorescent immunohistochemical staining of Iba1 and markers of interest. For qualitative
MOI assessments, free-floating fluorescent immunohistochemistry was carried out on the 50- and 100-µm thick
middle temporal gyrus sections as previously described 67. In short, sections were placed into tris–EDTA pH
9.0 buffer and microwaved at 1,100 W for 30 s or until the solution boiled. The sections were incubated in the
solution containing primary antibodies for 72 h at 4 °C on a rocking platform (Table 4) and then in a solution
containing fluorophore-conjugated secondary antibody, specific to the primary antibody species, overnight at
room temperature. Lastly, sections were incubated in Hoechst (1:20,000 in PBS, Molecular Probes, #33,342)
mounted onto glass slides and coverslipped.
Lectin from Ulex europaeus-1 (UEA-1) was used for the visualisation of blood vessels as it is a specific
marker of endothelial c ells68,69. Two forms of lectin from UEA-1 were used in conjunction with other primary
antibodies to label blood vessels in the free-floating MTG sections. A biotinylated lectin from UEA-1 (1:1,000,
Sigma-Aldrich, L8262) was visualised using an AlexaFluor 647-conjugated Streptavidin (1:500, Sigma-Aldrich,
Scientific Reports | (2020) 10:11693 | https://doi.org/10.1038/s41598-020-68086-z 13
Vol.:(0123456789)www.nature.com/scientificreports/
S21374). Alternatively, a DyLight 594-conjugated lectin from UEA-1 (1:100, Vector Laboratories, DL-1067) was
used to directly visualise endothelia.
For the quantification of MOI co-labelling with HLA-DR, paraffin immunofluorescent staining was carried
out on the 10-µm thick middle temporal gyrus sections as previously d escribed70. In short, following dewaxing
rehydration, antigen retrieval was carried out using tris–EDTA pH 9.0 buffer. Serum blocking was carried out
and sections were subsequently incubated in the primary antibodies overnight at 4 ºC and secondary antibod-
ies for 4 h at RT. Finally, sections were incubated in Hoechst (1:20,000 in PBS, Molecular Probes, #33,342) for
10 min to stain all nuclei and coverslipped.
Tyramide signal amplification. A selection of primary antibodies required tyramide signal amplification
(TSA) for visualisation as indicated in Table 2. TSA was carried out as previously described 67. The secondary
antibody cocktail used contained donkey anti-rabbit biotinylated secondary antibody (1:5,000; Jackson Labora-
tories, 711–065-152) as well as the AlexaFluor conjugated secondary antibodies, specific to the non-amplified
primary antibodies.
Imaging. For the visualisation of MOIs on Iba1-positive myeloid cells and assessment of MOI abundance
on different microglial morphologies, goat-Iba1 was co-labelled with one MOI antibody in 50-µm thick free-
floating middle temporal gyrus sections. For identification of MOI co-labelling with HLA-DR, goat anti-Iba1
and mouse anti-HLA-DR were co-labelled with one MOI antibody in 50-µm thick free-floating middle tempo-
ral gyrus sections. All sections were imaged on the Olympus FV1000 confocal microscope using the 100 × oil
immersion lens. Optical z-stacks were taken through the entirety of the cell body and processes. In the case of the
microglial morphology assessments, morphologies were initially determined from the MOI staining, but also
confirmed after imaging of both the MOI and Iba1. All images presented are focused maximum projections of
confocal z-stacks of six to ten 1-μm thick optical slices.
To classify Iba1-positive cells as microglia or PVMs, goat anti-Iba1 was fluorescently co-labelled with lectin
from UEA-1 in the 100-µm thick middle temporal gyrus sections. Microglia and PVMs were first classified based
on previously described cell morphologies and their location relative to lectin-positive blood vessels: parenchymal
microglia were identified in the tissue parenchyma and had small cell bodies with ramified processes, while PVMs
were identified alongside lectin-positive blood vessels and had elongated cell bodies. The parenchymal microglia
included juxtavascular microglia, which are microglia associated with blood vessels. This allowed for a more
direct comparison between microglia and PVMs with relation to blood vessel structures and immunoreactivity of
MOIs. Both microglia and PVMs were imaged on the Olympus FV1000 confocal microscope using the 100 × oil
immersion lens. Optical z-stacks at 1 μm intervals were taken though the entirety of the Iba1-positive cell body
and its processes, as well as the entirety of the associated blood vessel. These optical z-stacks were presented as
z-projections of the xy image to give a representation of the Iba1-positive cell and its adjacent vessel. Iba1 and
UEA-1 were subsequently co-labelled with one MOI in 50-µm thick MTG sections to assess microglial and PVM
expression of MOIs using the same imaging methods.
For the quantification of the abundance of MOIs co-labelled with HLA-DR, goat anti-Iba1 and mouse anti-
HLA-DR were co-labelled with one MOI antibody in 10-µm thick paraffin-embedded MTG sections. Sections
were imaged at 20 × magnification on a Zeiss Z2 Axioimager using MetaSystems VSlide acquisition software and
MetaCyte stitching software. Acquired images were opened on VSViewer v2.1.112 and images from two areas of
grey matter (GM) and two areas of white matter (WM) were extracted.
Manual counting and measurement of marker of interest abundance. Manual counting was car-
ried out in ImageJ v 1.5i. A region of interest (ROI) was drawn based on the Hoechst channel using the polygon
selection tool. By selecting the counting ROI on the Hoechst channel, any bias towards areas of high or low
co-labelling was removed. For the GM images, cortical layers I through VI were all included to exclude any
layer bias. This ROI was approximately 1 m m2 for WM images and 1.5 mm y2 for GM images. Prior to manual
counting, five point measurements of background were measure in the Iba1, MOI, and HLA-DR images. All
Iba1-positive microglia were subsequently counted within this ROI using the multipoint region tool on an Iba1-
Hoechst image. Each point was placed on the cell body of an Iba1-positive cell with a Hoechst-positive nucleus
and was therefore considered a coordinate where a microglia was found. Point intensities of Iba1, HLA-DR, and
the MOI were measured as grey values between 0 and 255 at each coordinate. To be considered Iba1-positive,
the Iba1 point intensity needed to be 20 grey values above background.
Validation of point intensities as an accurate measure of Iba1, HLA‑DR and MOI abundance in each cell.. To
validate that the intensity of a single pixel within the Iba1-positive cell body was a sufficient measure of overall
intensity, another 10 multipoint regions were placed randomly around the Iba1 cell body. The intensities of
HLA-DR, CD74, or CD32 were subsequently measured at these 10 coordinates. The validation was carried out
on approximately 30 Iba1-positive cells per case: a total of 148 cells were measured across the six cases. The mean
point intensity measured across these 10 points were correlated with the original point intensity measured per
Iba1-positive cell (Supplementary Fig. 1). The linear correlations were considered weak if r ≤ 0.3, moderate if
0.3 ≤ r ≤ 0.8 and strong if r ≥ 0.8, and statistical significance was set at p ≤ 0.05—the interpretation of the correla-
tion values was used for all such correlations in this study.
For both cell membrane markers, the mean point intensity strongly correlated with the original measured PI
(HLA-DR: r = 0.8601, p < 0.0001, Fig. 1A; CD32: r = 0.843, p < 0.0001, Fig. 1B). Alternatively, for the cytoplasmic
marker, the measured point intensity only moderately correlated with the original measured PI (CD74: r = 0.7695,
p < 0.0001, Fig. 1C) suggesting that single-pixel point intensity did not consistently reflect total cell intensity. For
Scientific Reports | (2020) 10:11693 | https://doi.org/10.1038/s41598-020-68086-z 14
Vol:.(1234567890)www.nature.com/scientificreports/
this reason, the single point intensity method was used in combination with a second method (categorisation), on
the basis that a dual approach would strengthen the robustness of the conclusions. Therefore, multiple methods
were employed to quantify and statistically analyse the abundance of HLA-DR and MOIs, and the extent of their
co-labelling, in the Iba1-positive cell population.
Statistical analysis of MOI abundance in the Iba1‑positive cell population.. If a cell was Iba1-positive, it was sub-
sequently determined to be immunoreactive for HLA-DR or the MOI if the point intensities were 20 to 40 grey
values above background. This grey value threshold was determined from the counting images, and it allowed
for the detection of HLA-DR or MOI immunoreactivity within Iba1-positive cells and excluded autofluores-
cence present in the tissue. The mean percentages of Iba1-positive cells immunoreactive for HLA-DR or MOI
measured in each case in GM and WM were compared using paired t-tests. Each data point represents a case.
Statistical significance was set at p ≤ 0.05. These percentages were correlated with post-mortem delay and age
using a Spearman’s correlation. Male–female differences could not be investigated because of the low number of
cases in each group.
Statistical analysis of HLA‑DR and MOI co‑labelling in the Iba1‑positive cell population. Due
to the variability in HLA-DR and MOI staining across Iba1-positive cell bodies, the statistical analysis of this
co-labelling was carried out in two ways. Firstly, the point intensities of HLA-DR and MOI were linearly cor-
related. Secondly, The HLA-DR-MOI populations were categorised into HLA-DRhigh/low and M OIhigh/low and the
distribution of Iba1-positive cells into each population was analysed using a Chi-square analysis. The rationale
for categorisation was based on the identified limitation of using single pixel point intensities: if single pixel point
intensity did not accurately reflect total cell intensity, binarization of the data would allow robust categorisation
of a cell as expressing each marker either at a high or low level.
HLA‑DR‑MOI point intensity correlation analysis. To determine whether the HLA-DR and MOI expression
was related, all Iba1-positive cells from all six normal cases were pooled and the HLA-DR and MOI point inten-
sities were correlated using a Pearson’s correlation. To determine whether HLA-DR and MOI expression were
related at higher levels of expression, the 10% of Iba1-positive cells with the highest HLA-DR point intensity or
MOI point intensity were correlated with their respective MOI point intensity or HLA-DR point intensity with
a Pearson’s correlation. While efforts were made to prevent overexposure of any pixels during imaging, some
saturated pixels of 255 grey values were measured for HLA-DR or MOI point intensities. To ensure these point
intensities did not skew any correlations carried out above, correlations were carried out with and without the
saturated pixels. No differences in correlation strength or statistical significance were observed (data not shown).
Categorisation of HLA‑DR‑MOI populations and Chi‑square analysis. To quantify the extent of HLA-DR and
MOI co-labelling on microglia, Iba1-positive cells were categorised into HLA-DRhigh/low and MOIhigh/low groups
and the distribution of cells in each HLA-DR-MOI population was statistically analysed. Using the original
images, intensities for high versus low HLA-DR or MOI staining were compared to background staining. A
threshold intensity above background was subsequently determined for HLA-DR and each MOI. If a point
intensity for any given marker was higher than the threshold intensity above background, an Iba1-positive cell
was considered to have a high expression for this marker. Alternatively, if the point intensity was lower than the
threshold intensity above background, and Iba1-positive cell was considered to have a low expression. Therefore,
each Iba1-positive cell was classified as HLA-DRhigh/low and M
OIhigh/low, resulting in four HLA-DR-MOI groups;
HLA-DRhigh MOIhigh, HLA-DRhigh MOIlow, HLA-DRlow MOIhigh, and HLA-DRlow MOIlow.
HLA-DR and MOI co-labelling on Iba1 cells was first statistically assessed using a Chi-Square analysis. This
test determined whether the distribution of Iba1 cells in the HLA-DRhigh MOIhigh, HLA-DRhigh MOIlow, HLA-
DRlow MOIhigh, and HLA-DRlow MOIlow groups was due to chance. Put simply, this test determined whether there
was a relationship between HLA-DR expression and MOI expression. Statistical significance was set at p ≤ 0.05.
Data presented are from the tests on pooled Iba1-positive cells from all cases. However, the distribution of HLA-
DR-MOI populations in each case was also investigated and the same distributions and statistical significances
were observed (data not shown).
To determine whether activated Iba1-positive cells were more likely to express MOIs, Iba1-positive cells
from each normal case were grouped into HLA-DRhigh or HLA-DRlow populations and the percentage of these
populations found to be MOIhigh was compared. To determine whether MOIhigh Iba1-positive cells were more
activated, Iba1-positive cells were grouped into MOIhigh or M OIlow populations, and the percentage of these
populations found to be HLA-DRhigh was compared. Because all data were equally distributed with no difference
in variances, data were compared using an unpaired student’s t-test and statistical significance was set at p ≤ 0.05.
Ethics approval and consent to participate. Ethics approval was obtained through the University of
Auckland Human Participants Ethics committee (protocol number 011654).
Consent for publication. Not applicable.
Availability of data and materials
Not applicable.
Scientific Reports | (2020) 10:11693 | https://doi.org/10.1038/s41598-020-68086-z 15
Vol.:(0123456789)You can also read