Genetic and Epigenetic Regulation of the Smoothened Gene (SMO) in Cancer Cells - MDPI
←
→
Page content transcription
If your browser does not render page correctly, please read the page content below
cancers
Article
Genetic and Epigenetic Regulation of the
Smoothened Gene (SMO) in Cancer Cells
Hong Lou 1,† , Hongchuan Li 2,† , Andrew R. Huehn 3,4 , Nadya I. Tarasova 3 , Bahara Saleh 3 ,
Stephen K. Anderson 2,3, * and Michael Dean 5, *
 1   Laboratory of Translational Genomics, Division of Cancer Epidemiology and Genetics, Leidos Biomedical
     Research, Inc., National Laboratory for Cancer Research, Gaithersburg, MD 20892, USA; louho@mail.nih.gov
 2   Basic Science Program, Frederick National Laboratory for Cancer Research, Frederick, MD 21702, USA;
     lihongchu@mail.nih.gov
 3   Laboratory of Cancer Immunometabolism, Center for Cancer Research, National Cancer Institute,
     Frederick, MD 21702, USA; andrew.huehn@yale.edu (A.R.H.); tarasovn@mail.nih.gov (N.I.T.);
     baharasaleh93@gmail.com (B.S.)
 4   Department of Molecular Biophysics and Biochemistry, Yale University, New Haven, CT 06510, USA
 5   Laboratory of Translational Genomics, Division of Cancer Epidemiology and Genetics,
     National Cancer Institute, Gaithersburg, MD 20892, USA
 *   Correspondence: andersonst@mail.nih.gov (S.K.A.); deanm@mail.nih.gov (M.D.);
     Tel.: +1-301-846-1330 (S.K.A.); +1-240-760-6484 (M.D.); Fax: +1-301-846-1673 (S.K.A.); +1-301-402-3134 (M.D.)
 †   These authors equally contributed to this paper.

 Received: 29 May 2020; Accepted: 28 July 2020; Published: 8 August 2020

 Abstract: (1) Background: The hedgehog (HH) signaling pathway is a key regulator of embryonic
 patterning, tissue regeneration, stem cell renewal, and cancer growth. The smoothened (SMO) protein
 regulates the HH signaling pathway and has demonstrated oncogenic activity. (2) Methods: To clarify
 the role of the HH signaling pathway in tumorigenesis, the expression profile of key HH signaling
 molecules, including SMO, PTCH1, GLI1, GLI2, and GLI3, were determined in 33 cancer cell lines and
 normal prostate cells and tissues. We performed a computational analysis of the upstream region
 of the SMO gene to identify the regulatory elements. (3) Results: Three potential CpG islands and
 several putative SMO promoter elements were identified. Luciferase reporter assays mapped key
 SMO promoter elements, and functional binding sites for SP1, AP1, CREB, and AP-2α transcription
 factors in the core SMO promoter region were confirmed. A hypermethylated SMO promoter was
 identified in several cancer cell lines suggesting an important role for epigenetic silencing of SMO
 expression in certain cancer cells. (4) Discussion: These results have important implications for our
 understanding of regulatory mechanisms controlling HH pathway activity and the molecular basis of
 SMO gene function. Moreover, this study may prove valuable for future research aimed at producing
 therapeutic downregulation of SMO expression in cancer cells.

 Keywords: hedgehog pathway; smoothened; promoter; methylation; transcription factors

1. Introduction
     The hedgehog (HH) pathway is one of the key signaling pathways regulating embryonic patterning,
tissue regeneration, stem cell renewal, and cancer growth [1–4]. Canonical HH signaling is triggered
by the binding of HH ligand to its receptor PTCH1, resulting in the release of PTCH1-mediated
repression of the seven-transmembrane protein smoothened (SMO). Activation of SMO ultimately
triggers GLI-dependent expression of downstream target genes through a complex network of
post-translational processes and translocations [5]. In the absence of HH ligands, PTCH inhibits SMO,
GLI2 and GLI3, which are phosphorylated and undergo partial proteasome degradation, resulting in

Cancers 2020, 12, 2219; doi:10.3390/cancers12082219                                 www.mdpi.com/journal/cancers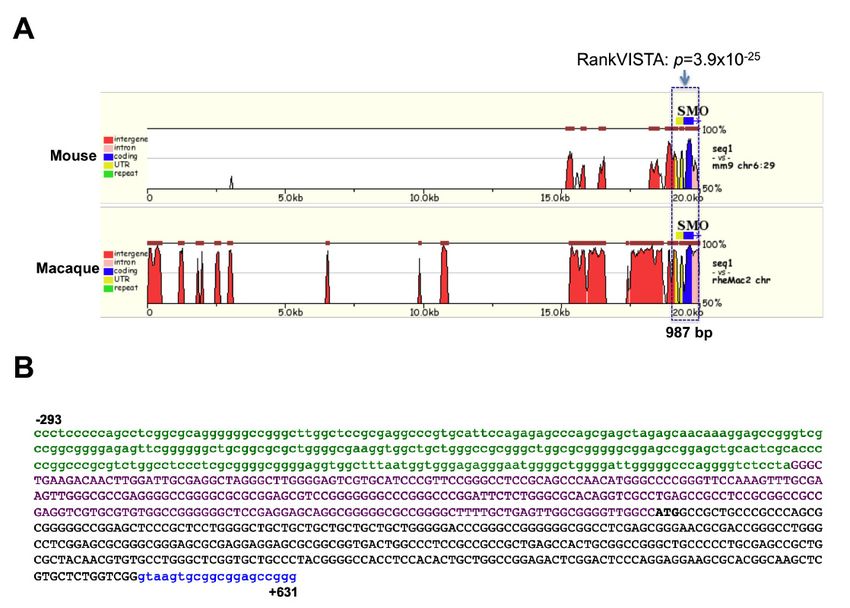
Cancers 2020, 12, 2219                                                                                 2 of 19

repressive forms of GLI2 and GLI3 (GLI2/3 R), which are translocated into the nucleus where they inhibit
the transcription of HH target genes [6,7]. HH pathway activation amplifies the signal by increasing
GLI1 levels, and in contrast, potentiates negative regulators such as PTCH1 and HH interacting protein
(HHIP) [8,9]. The positive and negative feedback loops ensure that the activity of HH signaling is kept
within an optimal range. Constitutive activation of the HH pathway has been observed in various
types of malignancies caused either by mutations in the pathway, such as PTCH1 loss-of function or
SMO activation in basal cell carcinoma, or through HH overexpression, as observed in small-cell lung
cancer, glioma, endometrial carcinoma, digestive tract tumors, pancreas, and prostate [10–16].
       The switch between active and inactive states of the HH pathway involves rapid translocation of
SMO. The SMO protein is the key positive regulator of the HH pathway, and GLI family proteins play
a critical role in the regulation of HH signaling pathway activity. Despite a strong link between SMO
expression, HH pathway activity, and cancer development, the basis for SMO gene regulation has not
been well characterized. Therefore, an investigation of the mechanisms controlling the expression of
SMO and additional HH pathway genes may provide valuable insight into HH signaling alterations
associated with cancer development. SMO also is the major target for pharmaceutical agents that
modulate HH pathway activity [17–19], such as vismodegib [20] and sonidegib [21]. We previously
studied SMO peptides and found that specific lipopeptides can serve as effective inhibitors [22,23].
       DNA methylation of HH pathway genes is a potential regulatory mechanism in the progression
of cancers. Several epigenetic factors that act on the HH signaling pathways have been associated with
cancer initiation and progression [10,24]. It was reported that distinct subgroups of cancers have an
exceptionally high frequency of cancer-specific CpG island hypermethylation [25,26]. Methylation has
been studied as a clinical biomarker for the diagnosis and prognostic evaluation of various cancers,
especially in breast cancer [27]. Recently, SMO methylation was used as a biomarker for the occurrence
and development of breast cancer [28].
       In the current study, we have developed a qRT-PCR method to accurately determine the expression
levels of SMO, PTCH1, GLI1, GLI2, and GLI3 in a panel of cancer cell lines. Different SMO expression
patterns in the cancer cell lines led us to characterize SMO gene regulatory elements. The SMO
50 -flanking region and Exon 1 were analyzed in silico, revealing that the region surrounding the
SMO transcriptional start site (TSS) has an extremely high GC content (70%+) that prevents its PCR
amplification by traditional methods. We used a touchdown PCR method to amplify SMO promoter
fragments and determined their promoter activity using a dual luciferase assay. EMSA analysis
identified binding sites for the transcription factors, SP1, AP1, CREB, and AP-2α, which likely play
an important role in SMO transcriptional activity in cancer cells. To gain insight into the epigenetic
regulation of SMO, bisulfite sequencing PCR (BSP) and methylation-specific PCR (MSP) were carried
out to determine the methylation status of the potential SMO promoter region. The relationship
between the methylation status and SMO mRNA expression was analyzed.

2. Results

2.1. Expression of HH Signaling Molecules in Cancer Cell Lines and Normal Prostate Cells and Tissues
     To gain a greater understanding of the transcriptional regulation of the HH pathway components,
a careful analysis of mRNA levels for key HH signaling genes was conducted. Quantification of mRNA
expression levels using a real-time PCR method is increasingly used to determine the activity of HH
signaling genes. However, most studies use a relative RT-PCR method, which is less precise and
does not provide meaningful comparisons of gene expression between different cell lines. Therefore,
accurate quantitation of HH pathway mRNA expression is necessary. In this study, we developed and
validated a standard curve based on a Taqman qRT-PCR method to measure key HH signaling genes,
including SMO, PTCH1, GLI1, GLI2, and GLI3.
     The results produced a broad linear dynamic range of detection of at least six logs and a small
quantitative variation produced by triplicate analysis. The slope of the curve was used to determine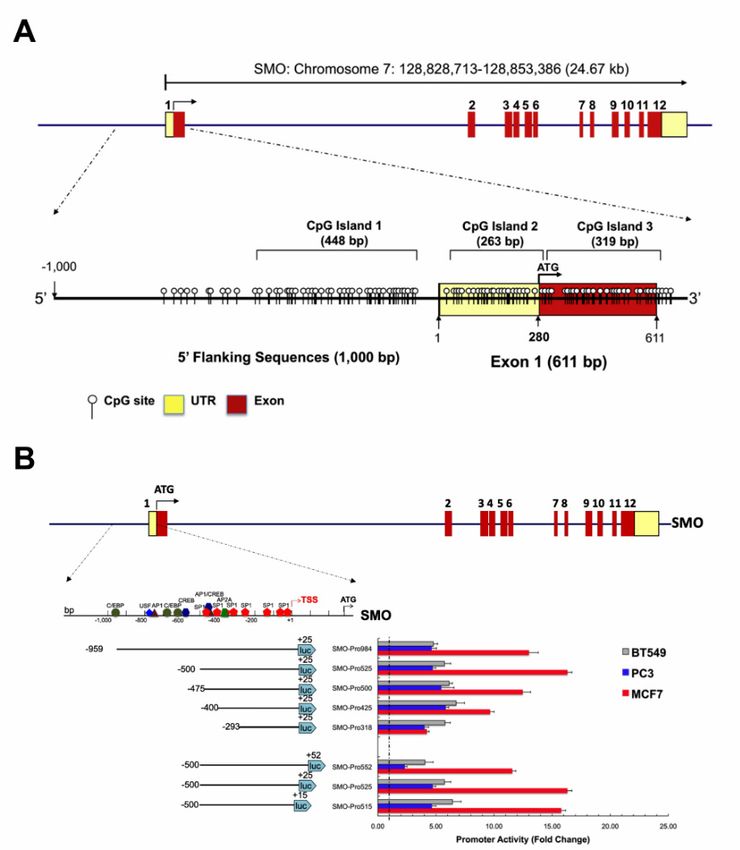
Cancers 2020, 12, 2219 3 of 19
Cancers 2020, 12, x 3 of 18
The results
the reaction produced
efficiency. a broad
Efficiency = [10 (−1/slope)
linear dynamic rangeThe
] −1 [29]. of efficiency
detection of standard
at least six logsfor
curve andalla genes
small
quantitative
is greater than variation
92%, and 2
produced by triplicate
R is greater than 0.99. analysis. The slope of the curve was used to determine
the reaction efficiency.
The expression Efficiency
levels = [10 (−1/slope)
of HH signaling ] −1 [29]. The
components efficiency
were of standard
determined curvecell
in 33 cancer for lines
all genes
usingis
greater
the than 92%,
quantitative and RRT-PCR
Taqman 2 is greater than 0.99.
method. Expression levels of the HH pathway genes, the HH signaling
The expression
receptors PTCH andlevels SMO,ofand HHthe signaling components were
target transcription factorsdetermined
GLI2 andin 33 cancer
GLI3, varied cell lines using
significantly
the quantitative Taqman RT-PCR method. Expression levels of the
among the cancer cell lines (Figure 1). The SMO gene exhibited the highest level of mRNA expressionHH pathway genes, the HH
signaling
and receptors
the greatest PTCH
variation and SMO,
between and(22.98
cell lines the target
± 31.80,transcription factors GLI2
95% CI 11.70~31.25), comparedand GLI3, varied
with PTCH1
significantly among the cancer cell lines (Figure 1). The SMO gene exhibited
(8.72 ± 10.44, 95% CI 5.02~12.42), GLI2 (1.25 ± 2.08, 95% CI 0.56~1.99) and GLI3 (18.04 ± 20.26, 95% CI the highest level of
mRNA expression
10.85~25.22), whereas and the (0.17
GLI1 greatest variation
± 0.25, 95% CIbetween
0.08~0.26) cell lines
that (22.98 ±as31.80,
functions 95% CI of
an amplifier 11.70~31.25),
HH signal,
compared with
consistently showedPTCH1 low(8.72 ± 10.44,in95%
expression CI 5.02~12.42),
all cancer cell lines.GLI2 (1.25 ± 2.08,
In addition, the 95% CI 0.56~1.99)
absence and GLI3
of SMO expression
was confirmed in seven cell lines, including five breast cancer cell lines and the stomach cancer as
(18.04 ± 20.26, 95% CI 10.85~25.22), whereas GLI1 (0.17 ± 0.25, 95% CI 0.08~0.26) that functions AGSan
amplifier
cell of HH signal,
line, whereas the lackconsistently
of SMO wasshowed accompaniedlow expression in all cancer
by undetectable GLI3 in cell lines.
colon In addition,
cancer the
HT29 cells.
absence
A of SMO
Significantly expression
lower expressionwas level
confirmed
in normalin seven cell tissues
prostate lines, including five breast
was confirmed (Table cancer
1). cell lines
and the stomach
Significant cancercorrelations
positive AGS cell line,werewhereas
identified thebetween
lack of SMO
SMOand wasGLI2
accompanied by undetectable
transcript levels (Pearson’s
GLI3 in colon
correlation = 0.359,
cancer p= HT29 cells.
0.040), and Abetween
SignificantlyPTCH1 lower
andexpression level in
GLI3 (Pearson’s = 0.532,tissues
normal prostate
correlation p = 0.001).
was
confirmed (Table 1).
No correlation was found between the expression levels of SMO/PTCH or SMO/GLI1 (Figure S1).
Figure 1.1. The
Figure Theexpression
expressionlevels of of
levels HH HHsignaling components.
signaling (A) Distribution
components. of mRNA
(A) Distribution levelslevels
of mRNA of SMO,of
PTCH, GLI1, GLI2, and GLI3 in 33 cancer cell lines. Mean values ± SCE of each gene
SMO, PTCH, GLI1, GLI2, and GLI3 in 33 cancer cell lines. Mean values ± SCE of each gene are are indicated by
horizontal
indicated by bars. (B) Comparison
horizontal bars. (B)ofComparison
mRNA levels. of The
mRNAmRNA levels
levels. of mRNA
The the five levels
genes were
of thequantitated
five genes
from
were the Taqman RT-PCR
quantitated from theas described in Materials
Taqman RT-PCR and Methods.
as described Data are and
in Materials presented by cell
Methods. lineare
Data in
decreasing
presented by order
cellof SMO
line mRNA level.
in decreasing order of SMO mRNA level.
Table 1. The expression level of hedgehog pathway genes in 33 tumor cell lines and 5 normal cells
and tissues.
Level of mRNA Expression *
SMO PTCH GLI1 GLI2 GLI3
Tissue Cell lines Mean SD Mean SD Mean SD Mean SD Mean SD
PCA2B 19.46 1.34 46.74 4.84 0.03 0.01 0.00 0.00 26.22 7.56
VCaP 15.15 1.13 10.15 0.99 0.00 0.00 0.10 0.03 28.43 8.59
PC3 11.33 0.59 0.39 0.04 0.02 0.01 1.96 0.13 17.13 2.73
DU145 11.14 1.88 1.27 0.15 0.03 0.01 9.36 0.58 0.47 0.09
Prostate
CAHPV10 4.59 0.37 5.31 0.49 0.08 0.02 0.43 0.08 58.71 5.91
NCIH660 4.18 1.00 6.61 1.41 0.01 0.00 ND 0.02 0.01
LNCaP 3.90 0.45 4.10 0.51 0.01 0.01 ND 12.09 0.85
22RV1 0.18 0.10 14.68 0.13 0.19 0.04 0.01 0.01 7.91 0.76
T47D 44.96 1.23 8.71 0.53 ND ND 9.99 0.76
BT549 36.26 5.84 4.64 0.69 0.54 0.10 ND 18.91 3.93
Breast MB435 3.56 0.50 11.43 1.99 0.04 0.02 ND 10.56 1.76
SK-BR3 0.02 0.00 2.72 0.32 0.00 0.01 0.00 0.00 4.39 1.21
SUM52 ND 2.16 0.85 0.02 0.00 0.00 12.09 3.09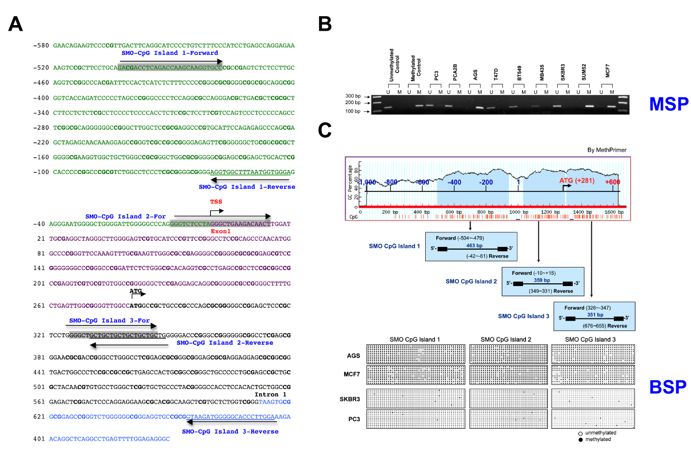
Cancers 2020, 12, 2219                                                                                                                                                  4 of 19

                              Table 1. The expression level of hedgehog pathway genes in 33 tumor cell lines and 5 normal cells and tissues.

                                                                         Level of mRNA Expression *
                                                           SMO                      PTCH                     GLI1                   GLI2                  GLI3
                  Tissue             Cell lines    Mean          SD         Mean           SD         Mean          SD      Mean           SD     Mean           SD
                                      PCA2B        19.46         1.34       46.74          4.84       0.03          0.01     0.00          0.00   26.22          7.56
                                       VCaP        15.15         1.13       10.15          0.99       0.00          0.00     0.10          0.03   28.43          8.59
                                        PC3        11.33         0.59        0.39          0.04       0.02          0.01     1.96          0.13   17.13          2.73
                  Prostate           DU145         11.14         1.88        1.27          0.15       0.03          0.01     9.36          0.58    0.47          0.09
                                    CAHPV10        4.59          0.37       5.31           0.49       0.08          0.02     0.43          0.08   58.71          5.91
                                    NCIH660        4.18          1.00       6.61           1.41       0.01          0.00     ND                    0.02          0.01
                                     LNCaP         3.90          0.45       4.10           0.51       0.01          0.01     ND                   12.09          0.85
                                     22RV1         0.18          0.10       14.68          0.13       0.19          0.04     0.01          0.01    7.91          0.76
                                      T47D         44.96         1.23       8.71           0.53       ND                     ND                   9.99           0.76
                                      BT549        36.26         5.84        4.64          0.69       0.54          0.10     ND                   18.91          3.93
                                      MB435         3.56         0.50       11.43          1.99       0.04          0.02     ND                   10.56          1.76
                                     SK-BR3         0.02         0.00       2.72           0.32       0.00          0.01     0.00          0.00    4.39          1.21
                   Breast            SUM52          ND                      2.16           0.85       0.02          0.00     0.00                 12.09          3.09
                                     MCF10A         ND                      3.24           0.68       ND                     ND                   29.75          0.55
                                      MB231         ND                      25.20          1.99       ND                     0.71          0.07   60.85          2.76
                                     SUN159         ND                       2.68          0.59       0.74          0.13     ND                   31.01          0.70
                                      MCF7          ND                      0.87           0.16       0.03          0.01     0.01          0.00    5.54          0.63
                                      SN-12C      114.33         8.01       5.11           1.19       0.10          0.04     4.47          0.21   21.85           2.9
                                       TK-10       95.49         9.04        8.95          3.19       0.30          0.13     0.46          0.04    0.08          0.01
                  Kidney
                                       786-0      87.90          6.39       4.22           1.05       0.38          0.12     6.07          0.73   13.87          3.93
                                      ACHN         2.54          0.25       32.37          1.43       0.47          0.05     1.09          0.45   85.73          3.36
                                       U251        31.36         4.97        1.19          0.19       0.08          0.01     1.01          0.10   16.50          1.16
                                      SF539        38.50         4.61       2.61           0.77       0.13          0.05     0.85          0.09   25.44          1.65
               Glioblastoma
                                      SNB75        27.07         4.50       7.33           0.82       0.32          0.07     0.83          0.09   20.28          0.59
                                      SF268        61.21         9.89       10.97          2.55       0.07          0.02     4.70          0.25   11.96          0.57
                                     IGROV1        85.11         13.96      17.00          3.53       0.11          0.01     0.62          0.02    ND
                   Ovary             OVCAR4        33.99         3.56       5.46           1.15       0.03          0.02     0.74          0.08    ND
                                      SKOV3         5.65         1.48       3.85           0.57       0.92          0.07     1.32          0.19   15.48          1.24
                  Others
                 Stomach              AGS           ND                      0.37           0.06       0.01          0.00     2.07          0.91   0.08           0.004
                   Skin             SK-MEL2        9.28          0.85       27.98          6.50       0.75          0.16     2.43          0.10   48.77           5.6
                  Colon               HT29          ND                      5.09           0.30       0.08          0.01     0.93          0.04    ND
                   Lung               H322         11.00         2.63        1.64          0.16       0.06          0.03     0.19          0.01    0.75          0.17
                 Myeloma            RPMI8226        0.02         0.00       2.64           0.46       0.02          0.01     0.85          0.09    0.37          0.07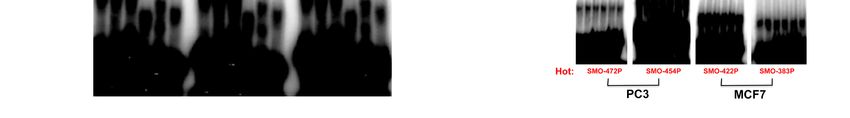
Cancers 2020, 12, 2219                                                                                                                                                                 5 of 19

                                                                                         Table 1. Cont.

                                                                                   Level of mRNA Expression *
                                                                    SMO                        PTCH                      GLI1                        GLI2                  GLI3
                  Tissue                    Cell lines      Mean          SD           Mean           SD          Mean          SD          Mean            SD     Mean           SD
           Normal prostate cell              WPMY           30.23         6.66          4.39          1.00        0.44          0.10         14.73          4.23   51.85          14.58
           Normal prostate cell             WPE-sterm       33.51         1.35          5.40          0.45        0.13          0.01         0.47           0.06   88.00           8.36
       Normal human prostate tissue                         7.71          2.90          2.93          1.21        0.18          0.01         0.44           0.02   9.87           0.41
       Normal human trachea tissue                           2.89         0.23          1.55          0.06        0.24          0.10          0.65          0.25    6.65          2.83
        Normal human breast tissue                          2.97          0.56          2.37          0.38        0.23          0.13         0.85           0.35   28.90          10.17
                                      Abbreviations: SD, Standard Deviation; ND, not detectable. * Relative mRNA expression = (Target gene/18s rRNA) × 106 .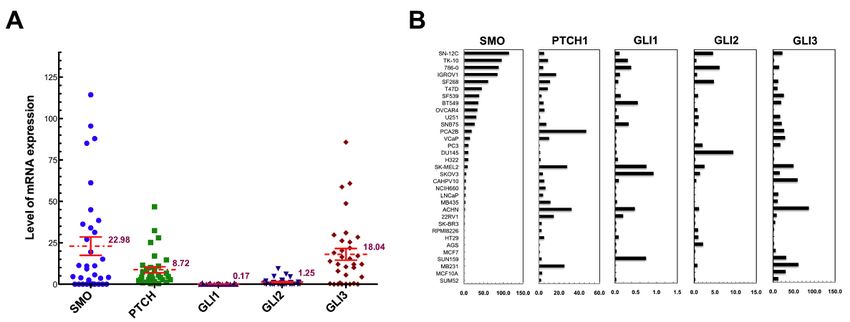
Cancers 2020, 12, 2219                                                                                    6 of 19

2.2. Hypermethylation of the SMO Gene in Non-Expressing Cancer Cell Lines
      We have identified three CpG islands in the 50 -flanking region of the SMO gene, and CpG island
1 is located in the proximal promoter region. We therefore analyzed the methylation status of CpG
island 1 of the SMO gene in 33 cancer cell lines using the MSP and BSP methods (Figure 2 and Table 2).
The sequences and locations of the primer pairs used in BSP and MSP are shown in Table S1 and
Figure 2A. The methylation frequency was determined using MSP real time PCR. The seven cell
lines that did not express SMO (SUM52, MCF10A, MB231, SUN159, MCF7, AGS, and HT29) were
all hypermethylated in the amplification region (Table 1 and Figure 2B). In contrast, less than 10%
methylation was found in the other cell lines, which expressed SMO (Table 2). To determine the
methylation status in all three CpG islands, we performed BSP for AGS, MCF7, SKBR3 and PC3
  Cancers
cells. Ten2020, 12, x of the amplified region of the putative SMO promoter for each cancer cell line
             clones                                                                               5 ofwere
                                                                                                       18
sequenced, and methylation status was established for three CpG islands in this region using bisulfite
  sequencing. The
sequencing.       The full
                       full methylation
                            methylation of
                                         of all
                                            all three
                                                 three CpG
                                                       CpGislands
                                                           islandswas
                                                                   wasconfirmed
                                                                       confirmedininAGS
                                                                                     AGSand
                                                                                         andMCF7
                                                                                             MCF7  cells,
                                                                                                      cells,
  whereas no methylation was found in the cell lines SKBR3 and PC3 that express SMO (Figure 2C).
whereas no methylation was found in the cell lines SKBR3 and PC3 that express SMO (Figure 2C).

      Figure 2. Hypomethylation of the 50 -flanking region of the SMO gene. (A) Bases are numbered relative
       Figure 2. Hypomethylation of the 5′-flanking region of the SMO gene. (A) Bases are numbered relative
      to the transcription start site at position + 1. CpG sites are shown in bold. The primers used for
       to the transcription start site at position + 1. CpG sites are shown in bold. The primers used for
      amplification and sequencing of bisulfate modified DNA were indicated by grey for forward and
       amplification and sequencing of bisulfate modified DNA were indicated by grey for forward and
      underline for reverse primer. The long arrows indicate the orientation. (B) Methylation-specific PCR
       underline for reverse primer. The long arrows indicate the orientation. (B) Methylation-specific PCR
      analysis of the SMO upstream regulatory region in methylated/unmethylated controls and nine cancer
       analysis of the SMO upstream regulatory region in methylated/unmethylated controls and nine
      cell lines. M indicates hypermethylated SMO; U indicates unmethylated SMO. (C) SMO promoter
       cancer cell lines. M indicates hypermethylated SMO; U indicates unmethylated SMO. (C) SMO
      methylation analysis by MethPrimer. Three CpG-rich regions surrounding SMO TSS in a span of the
       promoter methylation analysis by MethPrimer. Three CpG-rich regions surrounding SMO TSS in a
      1611 base pairs and results of bisulfite DNA sequencing were shown.
       span of the 1611 base pairs and results of bisulfite DNA sequencing were shown.

                    Table 2. Epigenetic regulation of SMO mRNA expression in tumor cell lines.

                  Tissue      Cell Lines   SMO mRNA Level *       SMO Methylation Frequency (%)
                               PCA2B            19.46                         0.47
                                VCaP            15.15                         1.65
                                 PC3            11.33                         0.61
                               DU145            11.14                         1.99
                  Prostate
                              CAHPV10            4.59                         2.67
                              NCIH660            4.18                         1.41
                               LNCaP             3.9                          1.93
                               22RV1             0.18                          4.9
                                T47D            44.96                         4.05
                               BT549            36.26                         1.47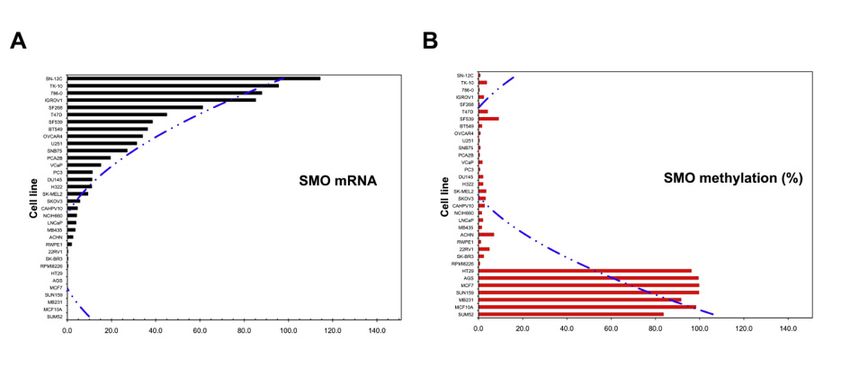
Cancers 2020, 12, 2219                                                                                                  7 of 19

                      Table 2. Epigenetic regulation of SMO mRNA expression in tumor cell lines.

                Tissue             Cell Lines             SMO mRNA Level *         SMO Methylation Frequency (%)
                                    PCA2B                       19.46                           0.47
                                     VCaP                       15.15                           1.65
                                      PC3                       11.33                           0.61
                                    DU145                       11.14                           1.99
               Prostate
                                   CAHPV10                       4.59                           2.67
                                   NCIH660                       4.18                           1.41
                                    LNCaP                         3.9                           1.93
                                    22RV1                        0.18                            4.9
                                     T47D                       44.96                           4.05
                                     BT549                      36.26                            1.47
                                     MB435                       3.56                            1.41
                                    SK-BR3                       0.02                            2.32
                Breast              SUM52                        ND                             83.57
                                    MCF10A                       ND                             98.28
                                     MB231                       ND                             91.52
                                    SUN159                       ND                              99.6
                                     MCF7                        ND                             99.66
                                     SN-12C                    114.33                           0.71
                                      TK-10                     95.49                            3.7
               Kidney
                                      786-0                     87.9                            0.33
                                     ACHN                       2.54                            6.88
                                     SF268                      61.21                           0.36
                                     SF539                       38.5                           9.06
            Glioblastoma
                                      U251                      31.36                           0.31
                                     SNB75                      27.07                           0.77
                                    IGROV1                      85.11                           2.37
                Ovary               OVCAR4                      33.99                           0.84
                                     SKOV3                       5.65                            3.1
              Stomach                 AGS                       ND                              99.36
                Skin                SK-MEL2                     9.28                             3.39
               Colon                  HT29                      ND                              96.22
                Lung                  H322                       11                             1.98
              Myeloma               RPMI8226                    0.02                             0.57
              Abbreviations: ND, not detectable. * Relative mRNA expression = (Target gene/18s rRNA) × 106 .

     To confirm the role of methylation in silencing SMO gene expression, the breast cancer cell line
MCF7 that lacked SMO gene expression and the prostate cancer cell line PC3 with moderate SMO
expression were treated with 5-aza-dC for 72 h Treatment with 5-aza-dC resulted in the expression
of SMO in MCF7 cells, however, treatment with 5-aza-dC decreased SMO expression in PC3 cells
(Table 3).

                  Table 3. Demethylation treatment restored SMO mRNA expression in MCF7 cell.

                                                Control                                 5-Aza Treatment (1 µM)
          Cell Line        Methylation Frequency (%)        mRNA Level       Methylation Frequency (%)     mRNA Level
           MCF7                      99.6                        0                     57.9                      16.1
           PC3                       0.6                       113.3                   1.5                       86.5

2.3. Interspecies Comparison of Genomic SMO Sequences
     For a comparison of mammalian SMO genes, we analyzed 20,500 bp of SMO genome sequence
including the upstream; 50 -UTR; exon 1; and part of intron 1 regions for human, mouse, and rhesus
monkey. Multiple sequence alignment of the 20,500 bp of SMO was performed by the mVista web-tool
(Figure 3). The macaque sequence is highly homologous to the human sequence, as 87.5% of the 20-kb
region showed at least 88% sequence identity over a 100 bp window. In contrast, the mouse sequence
shares 71.2% identity with human, with several conserved noncoding sequences (CNS) showing at
least 70% identity over 100 bps.
Cancers 2020, 12, 2219 8 of 19
Cancers 2020, 12, x 7 of 18
Figure3.3. In
Figure In silico
silico analysis
analysis of
of the SMO upstream
the SMO upstream region.
region. (A)
(A)Alignment
Alignmentofofthe 50 -flankingregion
the5′-flanking regionof
ofthree
threemammalian
mammalian SMO genes. A 20 kb segment of upstream sequence including
SMO genes. A 20 kb segment of upstream sequence including exon-1 from exon-1 from
the
the mouse, macaque and human SMO genes was aligned by the MLAGAN
mouse, macaque and human SMO genes was aligned by the MLAGAN algorithm of the mVista algorithm of the mVista
program.
program. TheThe sequences
sequences ofof mouse
mouse and
and macaque
macaque are are aligned
aligned to
tothe
thehuman
humanSMOSMOsequence
sequence(x-axis);
(x-axis);
numbering
numbering is relative to the transcription start site. Conserved regions (>70% homologyover
is relative to the transcription start site. Conserved regions (>70% homology over100
100bpbp
window) are shaded. The box indicates conserved regions among the three sequences,
window) are shaded. The box indicates conserved regions among the three sequences, as determined as determined
by RankVista (p ≤ 10−5−5), with the p values given above. (B) The structure of the 924 bp conserved
by RankVista (p ≤ 10 ), with the P values given above. (B) The structure of the 924 bp conserved
sequence. The 50 -flanking region is defined as sequence upstream (from the 50 end) of the transcript
sequence. The 5′-flanking region is defined as sequence upstream (from the 5′ end) of the transcript
start site and shown in green lower-case letters. The intron is shown in blue lower-case letters. The exon
start site and shown in green lower-case letters. The intron is shown in blue lower-case letters. The
is shown in uppercase letters, with UTR as purple and coding sequence as black color, respectively.
exon is shown in uppercase letters, with UTR as purple and coding sequence as black color,
respectively.
The global genomic sequence comparison showed significant highly conserved regions among
the three genes immediately upstream of the transcriptional start site (p = 3.9 × 10⁻²⁵ ). Five additional
2.4. In Silico Analysis of the SMO Upstream Regulatory Region
CNS were identified, but all had a lower p value that was greater than 0.005. A 924 bp region consisting
of theSubmission
full length of50 -UTR
a 1611and
bp sequence, including
exon 1 regions, 1000
along bp 293
with 5′-upstream region and
bp of upstream andthe
20 full
bp ofExon 1 of
intron
1the human is
sequence, SMO gene,
shown in to the MatInspector
Figure 3B. This regionsoftware program
possesses (core similarity
83% identity between >the
0.85; matrix
mouse and similarity
human
optimized)
SMO returned
genes, and 336 potential
95% between humanTFBS, distributed over the entire sequence. Furthermore, we
and rhesus.
performed an analysis with the PromoterInspector program and found a 1028 bp potential promoter
2.4. In Silico
region Analysis
within of the SMOlocated
this sequence, Upstream Regulatory
from positionRegion
−508 to +520 bp. By using the ModelInspector
program, 25 models
Submission of were identified,
a 1611 includingincluding
bp sequence, SMAD-MIT, SMAD-AP1,
1000 YY1-SMAD,
bp 50 -upstream ETF-AP1,
region and theSP1-ETS.
full
SP1F-NF1, IKRS-AP2, EGR-SP1, SP1-KLFS, GATA-SP1, CAAT-CAAT, NFKB-SP1,
Exon 1 of the human SMO gene, to the MatInspector software program (core similarity > 0.85;and SP1-CAAT.
matrix similarity optimized) returned 336 potential TFBS, distributed over the entire sequence.
2.5. Functionalwe
Furthermore, Analysis of the an
performed Core SMO Promoter
analysis with the PromoterInspector program and found a 1028 bp
potential promoter
Sequence region
analysis within this
revealed that sequence, located
the 5′-flanking fromof
region position
the human to +520
−508SMO bp.exhibits
gene By using the
a high
ModelInspector program, 25 models were identified, including SMAD-MIT, SMAD-AP1,
GC content and lacks a consensus TATA element. Three potential CpG islands were identified YY1-SMAD,
ETF-AP1, SP1-ETS.
surrounding SP1F-NF1,
the SMO gene TSSIKRS-AP2,
using theEGR-SP1,
MethPrimer SP1-KLFS,
program GATA-SP1, CAAT-CAAT,
(Figure 4A). NFKB-SP1,
We evaluated different
and SP1-CAAT.PCR conditions and programs for amplification of the SMO promoter sequence. The
experimental
GC-rich sequences contained within the SMO gene promoter region were effectively amplified by a
touchdown program in the presence of 3% DMSO [30,31]. Comparison of the touchdown PCR results
with PCR under standard condition (fixed annealing temperature, 35 cycles) program for five primer-
pairs corresponding to the upstream region of SMO is shown in Figure S2 and Table S1.Cancers 2020, 12, 2219 9 of 19
2.5. Functional Analysis of the Core SMO Promoter
Sequence analysis revealed that the 50 -flanking region of the human SMO gene exhibits a high GC
content and lacks a consensus TATA element. Three potential CpG islands were identified surrounding
the SMO gene TSS using the MethPrimer program (Figure 4A). We evaluated different experimental
PCR conditions and programs for amplification of the SMO promoter sequence. The GC-rich sequences
contained within the SMO gene promoter region were effectively amplified by a touchdown program in
the presence of 3% DMSO [30,31]. Comparison of the touchdown PCR results with PCR under standard
condition (fixed annealing temperature, 35 cycles) program for five primer-pairs corresponding to the
upstream region of SMO is shown in Figure S2 and Table S1.
The potential promoter region upstream of the SMO gene was analyzed using interspecies
comparison with the Genomatix package. Multiple regulatory elements are located surrounding the
TSS of SMO and may play a role in the regulation of SMO expression. To determine the minimal
sequences required for promoter function and identify cis-acting elements controlling SMO promoter
activity, a series of truncated luciferase constructs were generated by progressive deletion from the
50 end of a 984 bp fragment (region from −959 to +25 relative to the TSS), to produce five constructs
(Figure 4B and Table S1), based on our 50 truncation analysis result (Figure S3). Plasmids containing
SMO gene fragments were transiently transfected into three cancer cell lines (prostate cancer line PC3;
breast cancer lines BT549 and MCF7), and the luciferase activities of these constructs were measured.
The highest promoter activity was observed in MCF7 cells, and moderate activity was found in
PC3 and BT549 cells. In MCF7 cells, increased promoter activity was detected upon removal of 459 bp of
50 sequence up to position −500 bp (relative to the transcription initiation site), indicating the presence
of negative regulatory element(s) in the region from −959 bp to −500 bp in MCF7 cells. When truncated
to −470 bp, the promoter activity returned to the full-length promoter activity, and deletion of
additional sequence to either −400 or −293 further reduced promoter activity, suggesting the presence
of positive regulatory element (s) in the region −500 bp to −293 bp. In PC3 and BT549 cells, the 50
truncations had little effect and maximal activity was observed with the PGL3-SMO-400/+25 construct.
The PGL3-SMO-500/+25 construct exhibited the highest promoter activity in MCF7 cells, therefore,
this reporter vector was used for subsequent 30 deletion analysis (Figure 4B).
To further identify the 30 boundary of the core promoter, three plasmids were generated sharing
the same 50 boundary at position −500, and variable 30 ends from +50 to −15. In contrast to the
results from the 50 deletion analysis, luciferase activity with the 30 deletions showed similar effects
in all three cell lines. The promoter activities were comparable between the PGL3-SMO-500/+25 and
PGL3-SMO-500/+15 in the three cell lines, while the addition of 25 bp of 30 sequence to +50 resulted in
a decreased activity (Figure 4B), indicating an absence of downstream promoter element activity in the
SMO promoter.
Taken together, these results demonstrated that the region between −500 and +15 bp is important
for the transcriptional activity of the SMO promoter, and both negative and positive regulatory regions
can affect the promoter activity of the SMO gene depending on cell context.Cancers 2020, 12, 2219 10 of 19
Cancers 2020, 12, x 8 of 18
Figure4.4.Functional
Figure Functionalanalysis
analysisofofthe coreSMO
thecore SMOpromoter.
promoter.(A) (A)Structure
StructureofofthetheSMO
SMOgene.
gene.AAschematic
schematic
representation
representationofofthe theexon-intron
exon-intronorganization
organizationand andUTRUTRregion.
region.Twelve
Twelveexons
exonsare areindicated
indicatedby bythe
the
numbered
numberedrectangles.
rectangles. Distribution
Distribution of of CpG
CpG dinucleotides
dinucleotides in in aa 1611
1611 bp
bpfragment
fragmentof theSMO
ofthe SMOgene
gene
harboring 0 upstream region and full exon 1 is shown. Each vertical line represents a single
harboring10001000bp bp55′ upstream region and full exon 1 is shown. Each vertical line represents a single
CpG
CpGsite.
site.Numbering
Numberingisisrelativerelativetotothethetranscription
transcriptionstart
startsite
siteatatexon
exon1.1.Transcription
Transcriptionorientations
orientationsare
are
indicated
indicatedby byarrows.
arrows.(B) (B)Functional
Functionallocalization
localizationofofthe theSMO
SMOpromoter.
promoter.AAschematic
schematicofofthe theSMO
SMOgene
gene
structure
structureisisshown
shownabove.
above.Twelve
TwelveSMO SMOexons exonsare
areindicated
indicatedby bythe
thenumbered
numberedrectangles.
rectangles.AAschematic
schematic
diagram 0 of SMO
diagramofof thethe
1500 bp 5bp
1500 -flanking
5′-flankingregion region of and
SMO serial
andtruncation constructs
serial truncation of the SMO
constructs of promoter
the SMO
and their corresponding
promoter luciferase activities
and their corresponding in different
luciferase activitiescell
intypes are shown.
different Serial
cell types aredeletions
shown. atSerial
the
0 and the 30 ends of the promoter fragment of SMO are shown on the left. The promoter activities
5deletions at the 5′ and the 3′ ends of the promoter fragment of SMO are shown on the left. The
measured
promoter after transfection
activities measured into PC3,
after BT549 andinto
transfection MCF7 PC3,cells are shown
BT549 and MCF7 on the right.
cells The relative
are shown on the
size and position of fragments cloned into the pGL3 vector are indicated
right. The relative size and position of fragments cloned into the pGL3 vector are indicated by the lines below bythe
the
schematic,
lines below andthethe numbersand
schematic, in parentheses
the numberson ineither side of on
parentheses each fragment
either side ofindicate the distance
each fragment in
indicate
nucleotides
the distanceupstream from the
in nucleotides SMO start
upstream from codon
the SMO 50 and
of thestart 30 ends
codon of5′each
of the andfragment.
3′ ends of The
eachluciferase
fragment.
activity of the pGL3
The luciferase constructs
activity of the pGL3 is shown as fold-increase
constructs is shown asof corrected light
fold-increase units relative
of corrected light to an relative
units empty
pGL3
to an empty pGL3 vector control. Values represent the mean, and error bars indicate the SEMthree
vector control. Values represent the mean, and error bars indicate the SEM of at least of at
independent experiments.experiments.
least three independent
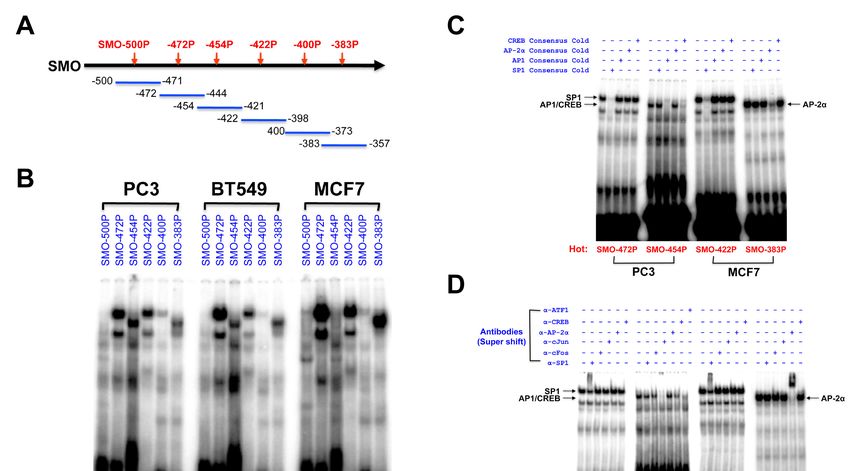
2.6. Identification of Transcription Factor Binding Sites in the SMO Gene Promoter
The potential promoter region upstream of the SMO gene was analyzed using interspecies
EMSA experiments
comparison were conducted
with the Genomatix package.toMultiple
investigate the binding
regulatory of nuclear
elements proteins
are located to the core
surrounding the
proximal
TSS of SMO SMOand promoter
may playsequences
a role ininthe
nuclear extracts
regulation of PC3,
of SMO BT549 and
expression. ToMCF7 cells.the
determine (Figure 5).
minimal
Six overlapping oligonucleotide probes covering the region between −500 and −357 bp (Figure
sequences required for promoter function and identify cis-acting elements controlling SMO promoter 5A) that
significantly enhanced
activity, a series promoterluciferase
of truncated activity inconstructs
MCF7 cells weregenerated
were prepared by
to investigate
progressivetheir DNA-protein
deletion from the
binding activity.
5′ end of a 984 bpDouble-stranded
fragment (region DNAfrom probes
−959 tospanning ~30 bp,
+25 relative covering
to the TSS), tothe −500
regionsfive
produce to −471
constructs
(SMO-500P); −472 to −444 (SMO-472P); −454 to −421 (SMO-454P); −422 to −398 (SMO-422P);
(Figure 4B and Table S1), based on our 5′ truncation analysis result (Figure S3). Plasmids containing −400 to
−373
SMO(SMO-400P);
gene fragmentsand −383 −357 (SMO-383P)
weretotransiently were into
transfected prepared.
three The SMO-472P,
cancer cell linesSMO-454P,
(prostate SMO-422P,
cancer lineCancers 2020, 12, 2219 11 of 19
and SMO-383P probes showed clear binding with nuclear proteins extracted from PC3, BT549 and
Cancers
MCF72020,
cells,12,while
x the SMO-500P and SMO-400P probes did not produce strong complexes with 10 of 18
nuclear
proteins from any of the cell lines tested (Figure 5B). The SMO-472P, SMO-422P and SMO-383P showed
and anti-CREB
strong bindingantibodies.
with nuclearTherefore, SP1, AP1
protein from MCF7,(c-Jun/ATF1)/CREB, and
but strong binding inAP-2α all appear
the SMO-454P to play
region a
was
role in SMO gene regulation.
observed with nuclear proteins from PC3 and BT549 (Figure 5B).
Figure 5. EMSA analysis of the core region of SMO promoter. (A) A binding assay using overlapping
Figure 5. EMSA analysis of the core region of SMO promoter. (A) A binding assay using overlapping
probes in the SMO promoter. A schematic illustration of six probes used for EMSA is shown in the
probes in the SMO promoter. A schematic illustration of six probes used for EMSA is shown in the
upper panel. (B) The 32P-labeled probes were incubated with nuclear extracts from PC3, BT549 and
upper
MCF7panel. (B) The 32P-labeled
cells, respectively. probes were
(C) Competition incubated
analysis using awith nuclear
50-fold excessextracts from PC3,
of unlabeled BT549 and
oligonucleotides
MCF7 cells, respectively. (C) Competition analysis using a 50-fold
(cold). The 32P-labeled SMO-472P and SMO-422P were incubated with nuclear extracts from excess of unlabeled
PC3 cells
oligonucleotides
in the presence of(cold). Theexcess
a 50-fold 32P-labeled SMO-472P
unlabeled consensus and
SP1,SMO-422P
AP1, AP-2α, wereandincubated with nuclear
CREB oligonucleotides,
extracts from PC3
respectively. cells in the
Similarly, the presence of a analysis
competition 50-fold excess unlabeled SMO-454P
of 32P-labeled consensus SP1,and AP1, AP-2α,were
SMO-383P and
CREB oligonucleotides, respectively. Similarly, the competition analysis of 32P-labeled
performed with nuclear extracts from MCF7 cells. (D) Supershift analysis using specific antibodies. SMO-454P
and SMO-383P
Antibodies wereincluding
(2 µg), performed with nuclear
anti-SP1, extracts
anti-c-Fos, from MCF7
anti-c-Jun, cells. (D)anti-CREB
anti-AP-2α, Supershift and
analysis using
anti-ATF1,
specific antibodies. Antibodies
were preincubated with 10 µg (2ofµg), including
nuclear anti-SP1,
extracts before anti-c-Fos,
the addition anti-c-Jun, anti-AP-2α,probes.
of the 32P-labeled anti-
CREB and anti-ATF1, were preincubated with 10 µg of nuclear
The bands of SP1, AP1/CREB, and AP-2α binding are indicated by arrows. extracts before the addition of the 32P-
labeled probes. The bands of SP1, AP1/CREB, and AP-2α binding are indicated by arrows.
The specificity of binding was tested in competition experiments using excess unlabeled
3.oligonucleotides
Discussion carrying consensus sequences and specific antibodies. A competition assay was
conducted with four probes, SMO-472P, SMO-454P, SMO-422P, and SMO-383P, to confirm DNA-protein
The HH pathway drives oncogenesis in many cancers, and strategies targeting this pathway
complexes. The DNA-protein complexes formed by the SMO-472P and SMO-422P probes were
have been developed, most notably through inhibition of SMO, which is a key step involved in the
reduced or disappeared completely in the presence of a 50-fold excess of the consensus SP1-binding
regulation of the seven-transmembrane oncoprotein. SMO can activate the glioma-associated
oligonucleotide, but not in the presence of excess unlabeled consensus oligonucleotides for other TFs
oncogene (GLI) family of transcription factors, leading to hyperproliferation of epithelial cells [32].
(Figure 5C). The major complex formed by the SMO-454P probe disappeared completely in the presence
CpG islands represent a common epigenetic element that regulates transcription at many
of a 50-fold excess of unlabeled consensus AP1 and was greatly reduced by CREB oligonucleotides,
promoters through methylation-induced silencing. In this study, the most striking feature revealed
but not by the addition of excess unlabeled consensus SP1 and AP-2α oligonucleotides. The major
by in silico analysis of the SMO promoter is the abundance of CpG dinucleotides and multiple SP1
band observed with the SMO-383P probe was reduced only in the presence of a 50-fold excess of
binding sites (7 × SP1 sites) close to the TSS. SP1 has been widely described as a general transcription
unlabeled consensus AP-2α oligonucleotide (Figure 5C).
factor involved in the transcription of gene promoters that lack a TATA box. CpG-rich promoters
A supershift assay with specific antibodies was performed using nuclear extracts from PC3 and
bound by DNA sequence-specific transcription factors including SP1 have the highest expression
MCF7 cells to confirm the identity of the TFs generating the complexes observed in Figure 5C. As shown
level, and deletion of SP1 binding sites results in significantly decreased promoter activity [33,34].
We have isolated and cloned DNA fragments containing the predicted SMO promoter region,
and the strongest promoter activity was identified in the 5′-UTR region around −500/+25 that contains
a high GC content, is CpG rich and lacks a canonical TATA box. Evaluation of the predicted SP1
consensus sites revealed that the SMO-472P (−472 to −444 bp) and SMO-422P (−422 to −398 bp) regionsCancers 2020, 12, 2219 12 of 19
in Figure 5D, the DNA-protein complexes in the SMO-472P and SMO-422P regions were supershifted
by the anti-SP1 antibody. The complex in the SMO-383P region was supershifted by the anti-AP-2α
antibody. The complex in the SMO-454P region was inhibited by anti-c-Jun, anti-ATF1, and anti-CREB
antibodies. Therefore, SP1, AP1 (c-Jun/ATF1)/CREB, and AP-2α all appear to play a role in SMO
gene regulation.
3. Discussion
The HH pathway drives oncogenesis in many cancers, and strategies targeting this pathway
have been developed, most notably through inhibition of SMO, which is a key step involved in the
regulation of the seven-transmembrane oncoprotein. SMO can activate the glioma-associated oncogene
(GLI) family of transcription factors, leading to hyperproliferation of epithelial cells [32].
CpG islands represent a common epigenetic element that regulates transcription at many promoters
through methylation-induced silencing. In this study, the most striking feature revealed by in silico
analysis of the SMO promoter is the abundance of CpG dinucleotides and multiple SP1 binding sites
(7 × SP1 sites) close to the TSS. SP1 has been widely described as a general transcription factor involved
in the transcription of gene promoters that lack a TATA box. CpG-rich promoters bound by DNA
sequence-specific transcription factors including SP1 have the highest expression level, and deletion of
SP1 binding sites results in significantly decreased promoter activity [33,34].
We have isolated and cloned DNA fragments containing the predicted SMO promoter region,
and the strongest promoter activity was identified in the 50 -UTR region around −500/+25 that contains
a high GC content, is CpG rich and lacks a canonical TATA box. Evaluation of the predicted SP1
consensus sites revealed that the SMO-472P (−472 to −444 bp) and SMO-422P (−422 to −398 bp) regions
are functional in binding to the SP1 transcriptional factor as shown in EMSA/supershift experiments.
In addition, inducible TF factors binding to AP1 and AP2 sites were also identified in the promoter
region and may play a role in modulating SMO expression.
The epigenetic regulation of SMO transcription was characterized in 33 cancer cell lines.
We determined the mRNA expression of the major HH pathway genes, SMO, PTCH1, GLI1, GLI2,
and GLI3 and found the highest level of mRNA expression was observed in the SMO gene, but their
corresponding proteins were very rare or produced weak signals in normal breast epithelium [35].
We have also measured mRNA expression levels of SMO, PTCH1 and GLI1 in the NCI60 cell line panel
(Table S2). SMO expression was undetectable in 8 of 60 cancer cell lines in the panel. The highest
expression of SMO was found in ovary, followed by lung and kidney cancer cell lines. Fagerberg, L. et al.,
have carried out a comprehensive analysis by RNA-seq and combined antibody-based proteomics to
classify the tissue-specific expression of genes across major human organs and tissues [36]. Expression
of SMO is variable and can be detected in all 27 tissue samples. The highest expression of SMO was
observed in ovary, endometrium, skin, and prostate. In addition, expression in normal human tissues
obtained through the UCSC genome browser exhibited similar patterns: expression of SMO and GLI3
is high overall, but variable, whereas PTCH1 and GLI1 seem to have a very selective expression pattern.
Analysis of the expression levels of the HH pathway genes in the 1457 cell lines in the Cancer Cell Line
Encyclopedia (CCLE, https://portals.broadinstitute.org/ccle) showed a significant positive correlation
(r = 0.37, p < 0.0001) between SMO and GLI2, supporting the conclusion that SMO gene regulation is
important in HH pathway regulation (Figure S4).
DNA methylation is a major epigenetic regulatory mechanism of gene expression and is involved
in the progression of cancer [37]. The absence of SMO expression in seven cell lines derived from
breast (5 of 9), stomach (1 of 1), and colon (1 of 1) cancer tissues was correlated with a high level of
gene methylation. The level of SMO mRNA was negatively correlated with the methylation status of
the SMO promoter (Figure 6). In this study, SMO and GLI3 were undetectable in the HT29 colon cancer
cell line. This result is consistent with a previous study that showed SMO methylation leads to the
silencing of GLI3 expression [38]. Moreover, full methylation was confirmed in all three CpG islands
in the MCF7 breast cancer cell line, and stomach cancer cell line AGS, and SMO expression in MCF7Cancers 2020, 12, 2219 13 of 19
cells were restored after 1 µM 5-Aza treatment. The results indicate that DNA methylation of the SMO
gene may play an important role in the development of cancer. Cell lines from breast cancer tissue
showed the highest methylation frequency, 56% (5/9), whereas eight prostate cancer cell lines had no
detectable methylation in the SMO gene. Whether the degree of SMO methylation correlates with the
tissue specificity remains to be explored. By using a ChIP-sequencing approach, specific histone mark
Histone 3 Lysine 4 Acetylation (H3K4Ac) peaks have been confirmed in the proximal promoter of the
SMO and GLI1 genes, demonstrating the expression of these genes was regulated by the removal of
H3K4Ac mediated by Histone Deacetylase 3 (HDAC3) [39]. It will be important to perform functional
assays
Cancersto 12, x transcription factors binding to SMO promoter region and their biological impact
validate
2020, 12 of 18
using ChIP-seq or site-directed mutagenesis in future studies.
Figure 6. Correlation of mRNA level and methylation frequency of the SMO gene in 33 cancer cell
lines. (A) mRNA level of SMO in decreasing order. (B) Distribution of methylation frequency (%) in
Figure 6. Correlation of mRNA level and methylation frequency of the SMO gene in 33 cancer cell
the cell lines by a quantitative MSP method.
lines. (A) mRNA level of SMO in decreasing order. (B) Distribution of methylation frequency (%) in
the cell lines by a quantitative MSP method.
The full mechanistic details of HH signal transduction are still under investigation. Abnormal
HH activation has been implicated in tumorigenesis in a wide variety of tumors, and SMO and
The full mechanistic details of HH signal transduction are still under investigation. Abnormal
GLI play a critical role in this pathway. GLI2 is suggested to function primarily as a transcriptional
HH activation has been implicated in tumorigenesis in a wide variety of tumors, and SMO and GLI
activator, and GLI3 as a repressor [4]. A significant positive correlation was identified between the
play a critical role in this pathway. GLI2 is suggested to function primarily as a transcriptional
expression of SMO and GLI2 in our study. This is consistent with previous reports that identified
activator, and GLI3 as a repressor [4]. A significant positive correlation was identified between the
overexpression of SMO and GLI2 in progesterone receptor (PR) negative breast cancers and gastric
expression of SMO and GLI2 in our study. This is consistent with previous reports that identified
cancers [35,40]. Overexpression of GLI1 and GLI2 leads to tumor development in transgenic mice,
overexpression of SMO and GLI2 in progesterone receptor (PR) negative breast cancers and gastric
suggesting that GLI1 or GLI2 contribute to tumorigenesis [17,41]. PTCH1 is an established tumor
cancers [35,40]. Overexpression of GLI1 and GLI2 leads to tumor development in transgenic mice,
suppressor gene and developmental regulator. Although the role of GLI3 as a negative regulator of HH
suggesting that GLI1 or GLI2 contribute to tumorigenesis [17,41]. PTCH1 is an established tumor
signaling is well established in the context of normal development, its role in cancer has largely been
suppressor gene and developmental regulator. Although the role of GLI3 as a negative regulator of
ignored [42–44]. In this study, we have demonstrated that GLI3 expression is positively correlated with
HH signaling is well established in the context of normal development, its role in cancer has largely
PTCH1 levels. This result is indirectly supported by the finding of increased expression of PTCH and
been ignored [42–44]. In this study, we have demonstrated that GLI3 expression is positively
GLI3 in cancerous tissues and correlated with the increased proliferating index of Ki-67 in breast cancer.
correlated with PTCH1 levels. This result is indirectly supported by the finding of increased
Moreover, PTCH1 haploinsufficiency is associated with distinct autosomal dominant syndromes [45].
expression of PTCH and GLI3 in cancerous tissues and correlated with the increased proliferating
Previous studies have demonstrated that loss of function mutations of the tumor suppressor PTCH1 or
index of Ki-67 in breast cancer. Moreover, PTCH1 haploinsufficiency is associated with distinct
gain of function mutations of SMO are associated with basal cell carcinoma [46,47]. These data suggest
autosomal dominant syndromes [45]. Previous studies have demonstrated that loss of function
that the repressive effect of PTCH1 and GLI3 on HH signaling has a crucial role in cancer development.
mutations of the tumor suppressor PTCH1 or gain of function mutations of SMO are associated with
4.basal cell carcinoma
Materials [46,47]. These data suggest that the repressive effect of PTCH1 and GLI3 on HH
and Methods
signaling has a crucial role in cancer development.
4.1. Computational Analysis of the SMO Gene
4. Materials and Methods
Identification and sequence analysis of evolutionarily conserved regions (ECRs) of the SMO gene
were
4.1. performed withAnalysis
Computational the ECRofBrowser,
the SMOand the publicly available web-based tool mVista [48] using the
Gene
MLAGAN algorithm. A search for potential TFBS in the upstream regulatory region of the SMO gene
Identification and sequence analysis of evolutionarily conserved regions (ECRs) of the SMO
gene were performed with the ECR Browser, and the publicly available web-based tool mVista [48]
using the MLAGAN algorithm. A search for potential TFBS in the upstream regulatory region of the
SMO gene was performed online at Genomatix using the MatInspector program
(http://www.cbrc.jb/research/db/TFSEARCH.html).Cancers 2020, 12, 2219 14 of 19
was performed online at Genomatix using the MatInspector program (http://www.cbrc.jb/research/db/
TFSEARCH.html).
4.2. Cell Lines and 5-Aza Treatment
All cell lines were purchased from American Type Culture Collection (ATCC, Rockville, MD, USA)
and grown according to the ATCC instructions. Total RNA from human prostate tissues was obtained
from Clontech (Mountain View, CA, USA). 5-Azacytidine (5-Aza, Sigma-Aldrich, St. Louis, MO, USA)
was freshly prepared in PBS before use. A vehicle control consisting of culture medium alone was
included in the analysis. MCF7 and PC3 cells were pre-cultured for 24 h, then treated with 1 µM
5-Aza for 72 h. Cells were collected by centrifugation, then genomic DNA and RNA were extracted
and analyzed.
4.3. Real Time Quantitative RT-PCR
Total cellular RNA was isolated and purified by RNeasy columns (QIAGEN Valencia, CA, USA)
according to the manufacturer’s instructions with on-column and in-solution DNaseI
digestion. RNA quality and quantity were determined using Agilent RNA 6000 Nano Chip
(Agilent Technologies Inc., CA, USA). cDNA synthesis was carried out using Random Hexamer
primer, Taqman Reverse Transcription Reagents kit (Applied Biosystems Foster City, CA,
USA). Taqman real time RT-PCR primers and probes for target genes were designed by
using the Primer Express software. SMO Fwd: 50 -GAGACTCGGACTCCCAG-30 ; Rev: 50 -GTA
TACGGCACACAGCAG-30 and probe: 50 (FAM)-TCGGGCCTCCGGAAT-(MGB)30 . PTCH1 Fwd:
50 -GCATAGGAGTGGAGTTCA-30 ; 50 -CCCTGCGGTTCTTGTC-30 and probe 50 (FAM)-TTGGCCT
TTCT-(MGB)30 . GLI1 Fwd: 50 -GTCTCAAACTGCCCAGC-30 ; Rev: 50 -CGTTCAAGAGAGACTGGG-30
and Probe: 50 (FAM)-TCCCACACCGGTACCA-(MGB)30 . PTCH2, (Assay ID = Hs01085642_ml),
GLI2 (Assay ID = Hs00257977_ml) and GLI3 (Assay ID = Hs00609233_ml). Taqman real time
RT-PCR was used to determine the expression profile, with a 18S rRNA plasmid as the standard
reference gene using primers Fwd: 50 -CCGAAGCGTTTACTTTGAAAAAA-30 ; Rev: 50 -TTCCAT
TATTCCTAGCTGCGGTAT-30 and probe 50 (VIC)-AGTGTTCAAAGCAGGCC-(MGB)30 . The PCR
reactions were performed in 20 µL final volume containing 5 ng of cDNA, 1 × Master Mix (TaqMan
Universal PCR Master Mix, ABI, CA, USA), 900 nM of each primer and 200 nM of each probe,
respectively. The thermal cycling conditions are 40 cycles of PCR amplification (UNG incubation:
50 ◦ C, 2 min; Ampli TaqGold activation: 95 ◦ C, 10 min; denaturation: 95 ◦ C, 15 s; annealing/extension:
60 ◦ C, 1 min) (ABI PRISM 7900HT Sequence Detection System, CA, USA). All assays were performed
in triplicate, and each plate contained the same standard and positive quality control sample. For each
unknown sample, the copy number of each gene is calculated using linear regression analysis from their
respective standard curves. The relative mRNA expression level of target genes was normalized by the
following formula: (copy number of target gene)/(copy number of 18S rRNA) × 10e6. The standard
curves were generated using a dilution series of plasmids containing SMO, PTCH1, PTCH2, GLI1,
GLI2, and GLI3 from full length cDNA (ATCC, Rockville, MD, USA). The copy number of plasmid
cDNA was calculated by optical density according to the exact molar mass derived from the sequences.
Serial dilutions were made to obtain 10e1 to 10e7 copies. The slope and intercept were calculated for
each run using a linear regression analysis of the log copy number versus threshold cycle (Ct) value for
both target genes and 18S rRNA standard curves [49].
4.4. Bisulfite Modification and Bisulfite Sequencing PCR (BSP)
DNA was extracted using the QIAamp DNA Mini Kit (Qiagen, Valencia, CA, USA).
Bisulfite modification of 1µg of genomic DNA was performed with the EpiTect Bisulfite Kit (Qiagen,
Hilden, Germany) as described by the manufacturer. Primers for BSP and identification of predicted
CpG islands in the SMO promoter region were carried out with the assistance of Methyl Primer
Express Software v1.0 (Applied Biosystems) and MethPrimer (http://www.urogene.org/methprimer/).Cancers 2020, 12, 2219 15 of 19
The primer sequences used for methylation analysis are summarized in Table S1. PCR reactions were
performed in a volume of 25 µL containing 10 ng of bisulfite-converted DNA and 20 pmol of each
primer using Platinum® PCR SuperMix (Invitrogen, Carlsbad, CA, USA). Thermal cycling conditions
were 95 ◦ C for 2 min, followed by 35 cycles of 95 ◦ C for 15 s, 56 ◦ C for 30 s, 72 ◦ C for 10 s, and a final
extension at 72 ◦ C for 5 min. For sequence analysis, the PCR products were subcloned into a pCR2.1
vector using a TOPO TA Cloning kit (Invitrogen, Carlsbad, CA, USA) according to the manufacturer’s
instructions. At least 12 clones were sequenced in an ABI 3730 DNA Sequencer (Applied Biosystems,
Foster City, CA, USA) for each cell line tested. Methylation analysis was performed using BiQ Analyzer
software [50].
4.5. Methylation-Specific PCR (MSP)
The MSP products were 132 bp long. Unmethylated and methylated human DNA were used
as a negative and a positive control, respectively (Qiagen, Hilden, Germany). Water blanks and
PCR mixtures without template were also used as experimental controls in each assay. The primers
were listed in Table S1. The amplification cycles performed were 38 cycles. After PCR, products
were separated on a 2% agarose gel, and stained with ethidium bromide. Bisulfite treatment and
MS-PCR assays were performed in duplicate for all samples. Each experiment was performed at least
three times.
4.6. Real-Time Quantitative MSP
The bisulfite–converted genomic DNA was amplified using fluorescence-based real-time MSP
using FastStart SYBR Green Master Kit (Roche). Methylation of the SMO gene was examined using
actin as the internal control for DNA quantification. The beta actin gene contains no CpG dinucleotides
and is not affected by DNA methylation status or bisulfite treatment. The primers for quantitative
MSP are the same as the normal MSP shown in Table 1. Real-time PCR conditions were 95 ◦ C for
10 min followed by 40 cycles of 94 ◦ C for 15 s, 59 ◦ C for 60 s with data acquisition after each cycle.
In the end, properties of real-time PCR conditions and amplification products were checked by melting
curve analysis. PCRs were done in two replicates of each sample with the 7900HT Fast Real-Time PCR
System (Applied Biosystems).
4.7. Touchdown PCR of the SMO Promoter Region
PCR was carried out in a volume of 50 µL containing 100 ng of genomic DNA, 20 pmol of each
primer and 3% Dimethyl Sulfoxide (DMSO, Sigma-Aldrich, St. Louis, MO, USA) using Platinum®
PCR SuperMix Kit (Invitrogen, Carlsbad, CA, USA). A modified touchdown PCR was performed with
the following cycling conditions: The templates were denatured at 94 ◦ C for 3 min, and then 20 cycles
composed of 20 s at 95 ◦ C, 30 s annealing with a stepwise reduction of annealing temperature from 68 ◦ C
to 58 ◦ C decreasing by 0.5 ◦ C every cycle, and an elongation step of 4 min at 72 ◦ C. Twenty additional
cycles were then performed at 94 ◦ C 20 s, 58 ◦ C for 40 s, and 72 ◦ C for 40 s. The standard PCR program
was 35 cycles at 94 ◦ C 20 s, 58 ◦ C for 40 s, and 72 ◦ C for 40 s. All PCR products were analyzed by
electrophoresis on a 1.0% agarose gel stained with ethidium bromide.
4.8. Generation of Luciferase Reporter Plasmids
A series of truncated SMO promoter constructs, including five deletions from the 50 side and three
deletions on the 30 side, were created by PCR using the primers shown in Table S1. PCR products were
cloned into the TOPO-TA vector, and inserts were excised with SacI and XhoI and cloned into pGL3
(Promega, Madison, WI, USA) to generate constructs in the forward orientation. All subclones were
verified by sequencing. Sequence analysis was performed with the Molecular Evolutionary Genetics
Analysis (MEGA) software version 7.You can also read


