Application of text mining to develop AOP based mucus hypersecretion genesets and confirmation with in vitro and clinical samples - Nature
←
→
Page content transcription
If your browser does not render page correctly, please read the page content below
www.nature.com/scientificreports
OPEN Application of text mining
to develop AOP‑based mucus
hypersecretion genesets
and confirmation with in vitro
and clinical samples
Emmanuel Minet, Linsey E. Haswell, Sarah Corke, Anisha Banerjee, Andrew Baxter,
Ivan Verrastro, Francisco De Abreu e Lima, Tomasz Jaunky, Simone Santopietro,
Damien Breheny & Marianna D. Gaça*
Mucus hypersecretion contributes to lung function impairment observed in COPD (chronic obstructive
pulmonary disease), a tobacco smoking-related disease. A detailed mucus hypersecretion adverse
outcome pathway (AOP) has been constructed from literature reviews, experimental and clinical
data, mapping key events (KEs) across biological organisational hierarchy leading to an adverse
outcome. AOPs can guide the development of biomarkers that are potentially predictive of diseases
and support the assessment frameworks of nicotine products including electronic cigarettes. Here,
we describe a method employing manual literature curation supported by a focused automated text
mining approach to identify genes involved in 5 KEs contributing to decreased lung function observed
in tobacco-related COPD. KE genesets were subsequently confirmed by unsupervised clustering
against 3 different transcriptomic datasets including (1) in vitro acute cigarette smoke and e-cigarette
aerosol exposure, (2) in vitro repeated incubation with IL-13, and (3) lung biopsies from COPD and
healthy patients. The 5 KE genesets were demonstrated to be predictive of cigarette smoke exposure
and mucus hypersecretion in vitro, and less conclusively predict the COPD status of lung biopsies. In
conclusion, using a focused automated text mining and curation approach with experimental and
clinical data supports the development of risk assessment strategies utilising AOPs.
Cigarette smoking is a leading cause of mortality and a major contributor to cardiovascular diseases, chronic
obstructive pulmonary disease (COPD), and lung cancer. The introduction of new nicotine delivery devices,
including electronic cigarette and tobacco heated products offers smokers potentially reduced risk alternatives
compared to combustible tobacco products. The longer-term risk associated with these potentially reduced risk
alternatives is not yet fully understood, and their rapid diversification is adding further demands in terms of risk
characterization and stewardship of ingredients. In 2017, Murphy et al.1 proposed an assessment framework for
modified risk tobacco and nicotine products focussed on chemical emissions, pre-clinical, clinical, and popula-
tion studies. The pre-clinical studies consisting of:
1. in vitro regulatory toxicology including genotoxicity testing such as Ames, mouse lymphoma assays, neutral
red cytotoxicity t esting2.
2. in vitro modelling of tobacco related-disease endpoints including cancer (transformation assays), cardio-
vascular (monocyte adhesion, endothelial wound healing), and COPD (goblet cell hyperplasia)3–6.
Regulatory toxicology assays and in vitro models of disease rely on apical endpoints and do not provide
mechanistic information on the mode of action of the different products’ aerosols. Thus, the proposed assessment
framework by Murphy et al.1 incorporates systems biology. Top down omics approaches are unbiased since there
British American Tobacco, GR&D Centre, Regents Park Road, Southampton SO15 8TL, UK. * email: marianna_
gaca@bat.com
Scientific Reports | (2021) 11:6091 | https://doi.org/10.1038/s41598-021-85345-9 1
Vol.:(0123456789)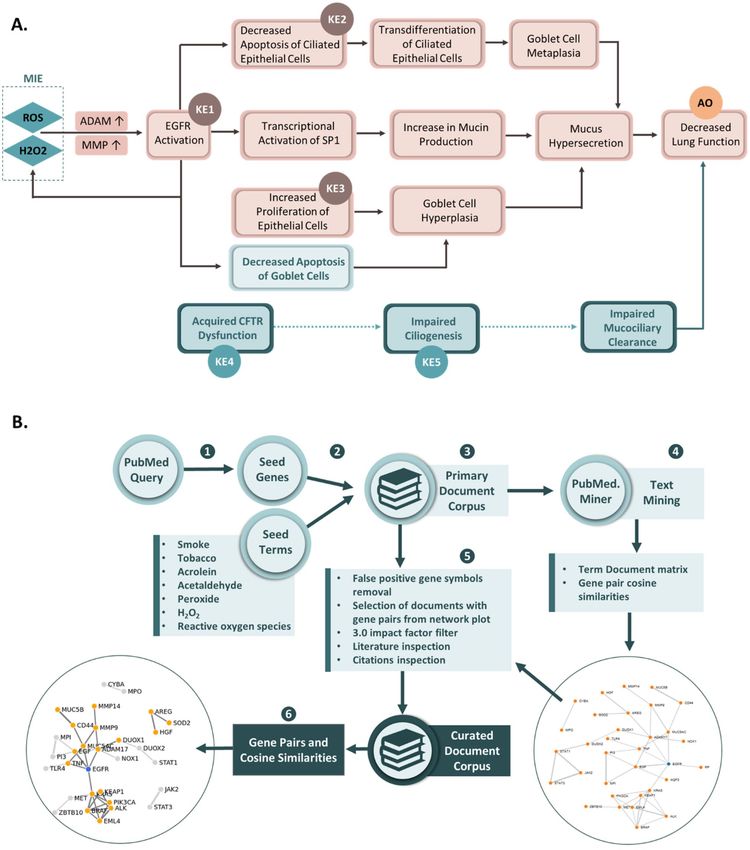
www.nature.com/scientificreports/
is no single end-point pre-selected. Furthermore, they are well suited to provide mechanistic information since
they can be applied to a variety of sub-cellular matrices such as RNA, proteins, and metabolites.
Data generated from systems biology approaches can yield an abundance of multi-layered information beyond
expression levels. Knowledge-base repositories including K EGG7–9, GO, and the R eactome10 catalogue genes,
pathways and their corresponding biological function. These repositories can be mined to match experimental
gene expression profiles with biological functions to derive mechanistic understandings of the effects caused by
a treatment. Current analysis tools for systems biology are, however, poorly tailored towards tobacco product
toxicity and diseases. Adverse outcome pathways (AOPs) frameworks however, can combine datasets from sys-
tems biology discovery along a series of key events (KE) to confirm or define new genesets with better relevancy
to diseases, including tobacco-related d iseases11,12.
An AOP framework describes the causal link between a molecular initiating event (MIE) followed by a
series of KEs organized across a biological hierarchy from the molecular to the cellular, organ, individual, and
population level ultimately leading to an adverse o utcome13. AOPs are modular constructs based on the best
evidence available at the time and for which the robustness of each KE is evaluated using Bradford-Hill criteria of
plausibility, essentiality, and empirical support. KEs can form the foundation of new genesets that are not driven
by functional gene ontology, but that are more directly related to disease process14. In the field of toxicology, an
AOP can help to define an “integrated testing strategy (ITS)” which could have a predictive value on the impact
of chemicals on human health and or on the environment (eco-toxicology)13.
In 2017, Luettich et al.12, described an AOP for mucus hypersecretion (AOP ID 148). This phenotype is
symptomatic of COPD, asthma, and, for some elements, cystic fibrosis. COPD is a tobacco smoking-related
condition and is predicted to become a leading cause of mortality in the twenty-first century due to the added
contribution of air p ollution15. COPD is a complex, progressive, and non-reversible disease characterized by
airflow limitation and 5 stages of severity. The reduction of the respiratory capacity is due, amongst other, to
airway tissue remodelling and mucus hypersecretion.
The mucus hypersecretion AOP has 10 modules in total, one MIE, eight KEs, with a decrease in lung func-
tion as the adverse o utcome12. There is strong evidence that free radicals and oxidative stress are the molecular
initiating events leading to EGFR activation, the first key event in the mucus hypersecretion AOP. In turn, EGFR
activation leads to a series of key events involved in the loss of ciliated cells, increase in the goblet cell population
and ultimately mucus hypersecretion (Fig. 1A). The confidence in the relationship between the different KEs of
this pathway ranges from strong, to moderate and w eak12.
In this report, we describe the development of four bespoke genesets constructed using in silico literature
mining with search terms based on 3 KEs and 2 putative KEs that contributes to the mucus hypersecretion AOP
and to mucocilliary clearance impairment, respectively. A text-mining approach combined with manual curation
was used to identify genes involved in each of the KEs, and to formulate interaction networks. Unsupervised
hierarchical clustering was performed to assess the discrimination power of the KE genesets on two in vitro
transcriptomic datasets obtained from studies in which (1) 3D reconstituted human lung tissue (MucilAir, Epi-
thelix Sarl), were exposed to aerosols from a reference cigarette (1R6F), an electronic cigarette (IS1(TT)) or air,
(2) in vitro human tracheal epithelial cells IL-13, an inducer of the mucus hypersecretion phenotype. A similar
analysis was conducted on a public transcriptomic data set generated from lung tissue samples of COPD patients
and healthy smokers to determine whether the genesets allowed to group samples based on the health status
of the subjects. We report that the genesets suitably discriminated between in vitro cigarette smoke exposure,
vapour/air exposure, and IL-13 treatments. The genesets, however, did not discriminate between health status
when applied to RNA levels from lung biopsies taken from healthy and COPD subjects.
Results
Stage 1: Mucus hypersecretion key events literature gathering. Three key events from the mucus
hypersecretion AOP (Fig. 1, adapted from Luettich et al.)12 and two putative key events (unpublished) involved
in impaired mucus clearance were selected for the purpose of gene interaction networks building, namely:
Key Event 1 (KE1): ’EGFR Activation’.
Key Event 2 (KE2): ’Decreased apoptosis (epithelial cells)’.
Key Event 3 (KE3): ’Increased proliferation (epithelial cells)’.
Putative Key Event 4 (pKE4): ’Acquired CFTR dysfunction’.
Putative Key Event 5 (pKE5): ’Impaired ciliogenesis’.
The seed gene (S-genes) list for each of these key events is shown in Supplementary Table S1 and used in com-
bination with the key terms “smoke” OR “tobacco” OR “acrolein” OR “acetaldehyde” OR “peroxide” OR “H2O2”
OR “reactive oxygen species” to mine relevant abstracts in NCBI PubMed. The resulting abstracts accessible in
the evidence tables (Supplementary Tables S2–S6) formed the document corpus and were processed using the
R package pubmed.mineR16 to find co-occurrences of each gene on this list with every other gene on the same
list, with each gene pair mentioned being ranked by cosine s imilarity17. Cosine similarity of gene co-occurrences
was used as a score to assess potential gene interactions with 0 meaning no co-occurrence and 1 meaning 100%
co-occurrence in the document corpus. Table 1 summarizes some of the key metrics from the primary docu-
ment corpus. An example of the KE1 resulting cosine similarity interaction matrix for the seed genes is shown
in Fig. 2A alongside the corresponding interaction network (Fig. 2B). Each KE integration matrix for the top
60 gene pairs is presented in Supplementary Figure S6 and the cosine similarity for each gene pair is given in
Supplementary Tables S7–S11.
Stage 2: Mucus hypersecretion key event literature curation. For each KE, the abstracts describ-
ing a gene pair and published in journals with impact factors above 3.0 were retained and inspected to confirm
Scientific Reports | (2021) 11:6091 | https://doi.org/10.1038/s41598-021-85345-9 2
Vol:.(1234567890)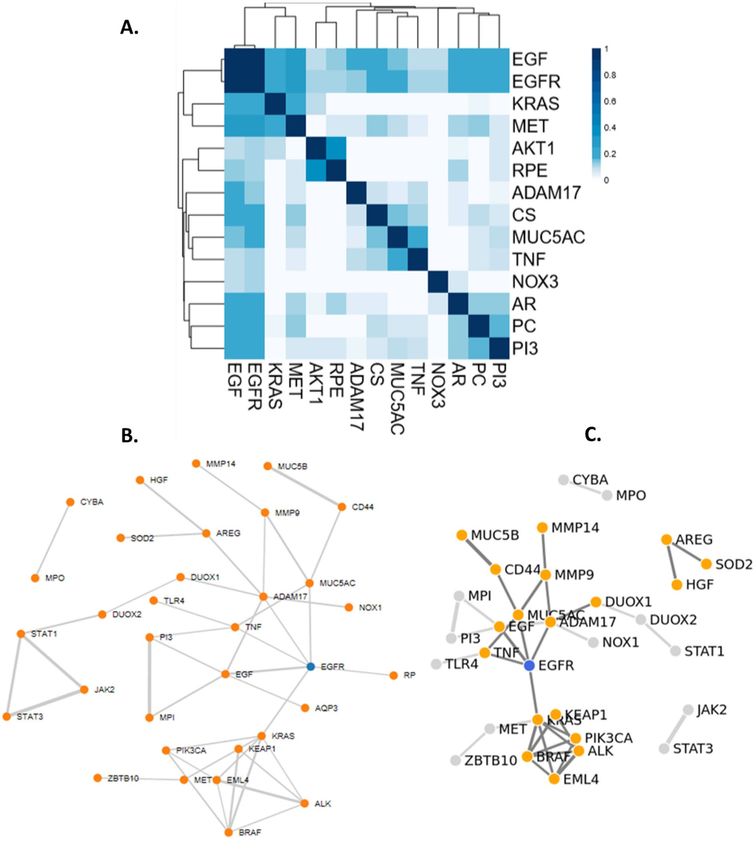
www.nature.com/scientificreports/

                                  Figure 1.  (A) Mucus hypersecretion AOP and impaired mucocilliary clearance key events (AOP 148). (B) Text
                                  mining process. 1. A manual search was first conducted using KE terms to derive seed genes. 2. Pubmed was
                                  searched using a combination of seed genes and tobacco related key terms. 3. The resulting primary document
                                  corpus was then mined for gene symbols (4) 4. Gene pairs were used to construct network plots. 5. Gene pairs
                                  from articles with an impact factor equal or higher than 3.0 were retained together with the corresponding
                                  publication. Further manual searches were conducted to include the most recent literature. 6. Gene network
                                  plots and KE genesets were finalized based on the curated document corpus.

                                  the associated gene pairs and remove false positive, e.g. due to the use of acronyms redundant of gene names.
                                  Manual literature review focused primarily on publications from journals with an impact factor > 5.0. Abstracts,
                                  introductions, discussions were studied in more detail until the relevance of the paper in terms of the AOP could

Scientific Reports |   (2021) 11:6091 |               https://doi.org/10.1038/s41598-021-85345-9                                                 3

                                                                                                                                            Vol.:(0123456789)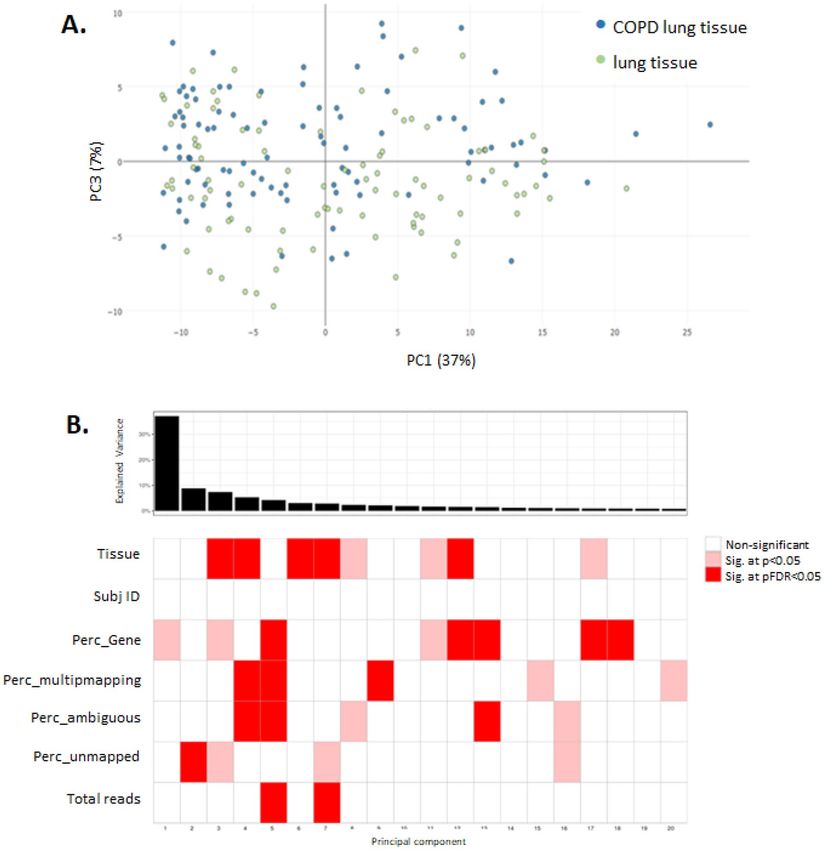
www.nature.com/scientificreports/
Primary document corpus Curated corpus
Total number of Total number of
Number of abstract unique genes from Number of abstracts unique genes after
Number of seed genes retrieved retrieved abstracts after curation curation Unique genes in detail List of gene pairs
a S-genes: 1; R-genes: 18;
KE1 1 718 215 165 + 12 25 See Table S12
A-genes: 6
S-genes: 20 (one dupli-
KE2 21 17,570 1242 244 + 6a KE2: 35; KE2-KE3: 124 cate removed); R-genes: See Table S13
8; A-genes: 7
KE3: 106; KE2-KE3: S-genes: 84; R-genes:
KE3 84 42,465 1873 265 + 6a See Table S14
124 16; A-genes: 6
S-genes: 34; R-genes:
KE4 34 2115 516 80 + 11a 50 See Table S15
13; A-genes: 3
S-genes: 42 (one
duplicate and one false
KE5 44 192 114 7 + 13a 51 See Table S16
acronym removed);
R-genes: 0; A-genes: 9
Table 1. Summary of literature reference, gene pairs pre- (Stage 1) and post- (Stage 2) curation used for
building the key event (KE) networks. a Indicates number of genes that were added after a further manual
inspection of key references.
be established. Next, if a given gene pair of interest was not present in any of the highest-ranking abstracts, the
publications from journals with an impact factor between 3.0 and 5.0 were also inspected. The manual review of
these papers focused mainly on abstracts. Once it was established that the paper included relevant information
on the gene pairs that otherwise could not be annotated, the rest of the paper (introduction, results, discussion)
was also analysed. Only references with genes using HGNC-approved symbols were further carried to this stage
and formed the curated document corpus.
The gene pair (co-occurrence) number confirmed for each KE is summarized in Table 1 and the associated
genes were grouped in a category labelled “R-genes” (Relevant-genes). The detail of the literature reference and
associated gene pairs is given in Supplementary Tables S12–S16. Each gene pair of interest has been annotated
with biological pathways and processes, molecular interactions, cell- and tissue-specific expression or protein
subcellular location information available through public resource databases (KEGG, IntAct, Reactome). Bio-
logical information shared among both members of a pair is reported in a table of top-scoring co-occurring
gene pairs presented in Supplementary Tables S12–S16. A further manual search was conducted from review
article citations to identify the most relevant references to complete the curated document corpus. A few more
genes were retrieved from this last step and were put in the category “A-genes” (Additional genes) and the gene
list and references are accessible in Supplementary Table S17. For each KE, genes from the co-occurring pairs
(R-genes) were pooled with the seed genes (S-genes) and the “A-genes” to obtain KE-specific genesets. The gene
list for KE2 and KE3 were merged due to the important overlap found between these two key events. The full
list of KE genes is given in Supplementary Tables S18–S21. Only four KE genesets are described since KE2 and
KE3 genes were pooled due to the degree of redundancies in contributing genes.
KE1 is used as an illustration. In KE1, one seed gene was pre-defined (S-gene), 22 gene pairs were found post-
curation of the document corpus connecting 18 genes (R-genes) (Fig. 2C—blue genes connections). Another 6
genes (A-genes) were included from the additional literature review post-curation from a collection of 12 refer-
ences retrieved manually. The resulting total of S-gene (1) + relevant genes in pairs (18) + additional genes from
ad hoc searches (6) gives 25 genes included in the KE1 geneset.
Stage 3: Key event genesets validation. 3 datasets were used to conduct the validation step using data
from (1) in vitro 3D MucilAir™ human airway cells exposed acutely to cigarette smoke and e-cigarette aerosol,
(2) in vitro human tracheal epithelial cells treated for 21 days with IL-1318, and (3) COPD patient b
iopsies19. The
validation analyses are described below for each dataset.
i. 3D human airway cells acute in vitro exposure to cigarette smoke and e-cigarette aerosol. This experiment
was conducted in house and the sequencing data is accessible on NCBI SRA. Cells were exposed for one
hour at the air liquid interface to air, cigarette smoke or electronic cigarette vapour. The following aerosol
dilution settings 1/30 1R6F, 1/3 IS(TT1) were used to achieve equivalent nicotine delivery and cell viability
above 80% at 24 hrs and 48 hrs post-exposure. The rationale for selecting these dilutions is detailed in
Haswell et al.20. The tissue QC data are shown in Supplementary Figs. S3 to S5, including expression of
goblet, ciliated, and basal cell markers, ciliary beat frequency (CBF) and LDH release. Nicotine measured
in the in vitro cell exposure chamber media is presented in Supplementary Fig. S2. RNA-sequencing
was performed on samples taken at 24 hrs and 48 hrs post-exposure. Results from the differential gene
expression contrasting air vs cigarette smoke, air vs e-cigarette aerosol at 24 hrs and 48 hrs post-exposure
are summarized in the volcano plots shown in Fig. 3. The full list of differentially expressed genes with
selected pFDR and fold change thresholds is given in Supplementary Tables S22–S25. Heatmaps show-
ing the sample-specific expression levels of "Mucus Hypersecretion" AOP-related genes demonstrated
that cigarette smoke-treated samples cluster together irrespective of the KE (Fig. 4A and Supplementary
Fig. S7). Notably, the two treatment time-based subgroups of 1R6F-exposed samples (24 hrs and 48 hrs)
Scientific Reports | (2021) 11:6091 | https://doi.org/10.1038/s41598-021-85345-9 4
Vol:.(1234567890)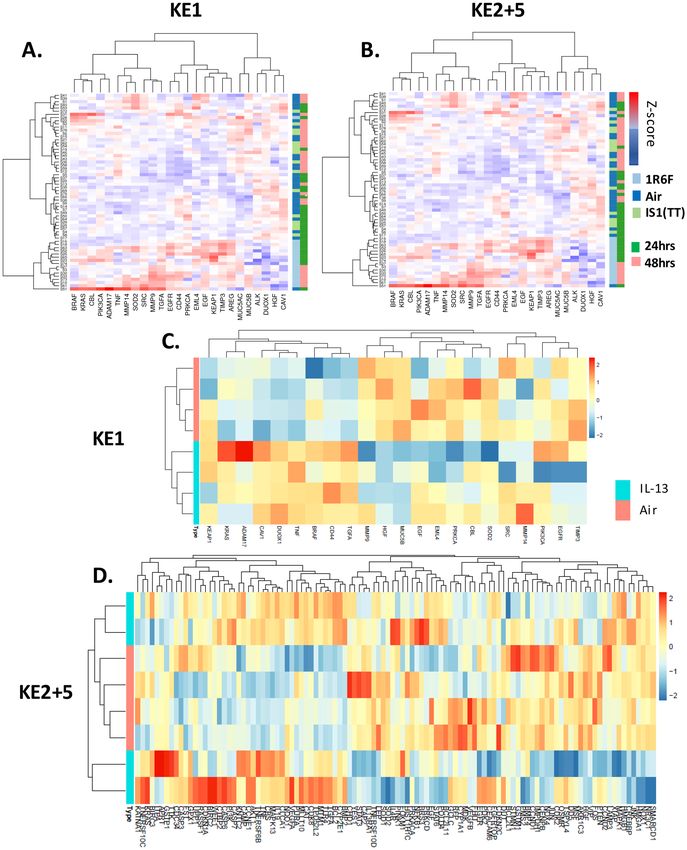
www.nature.com/scientificreports/
Figure 2. (A) Cosine-similarity matrix for KE1 seed genes. (B) Network plot established from the document
corpus using a cosine similarity threshold > 0.1. (C) Network plot established using the curated document
corpus and a cosine similarity threshold > 0.1.
are also found together within the sub clusters of the distance dendrogram (Fig. 4A,B and Supplemen-
tary Fig. S7). Clustering of samples according to the recovery time post-treatment (24 hrs and 48 hrs) is
particularly evident, when the analysis is based on the expression levels of genes involved in decreased
apoptosis or increased proliferation of epithelial cells (Supplementary Fig. S7). In total, the expression of
24 "Mucus Hypersecretion" AOP-associated genes was significantly changed by more than two-fold in
response to 1R6F treatment at an adjusted p-value (pFDR) < 0.05.
ii. Human tracheal epithelial cells exposed to IL-13 repeated treatment. We performed an unsupervised cluster-
ing using our KE genesets and a microarray dataset from human tracheal epithelial cells grown at the air
liquid interface untreated and treated with IL-13 for 21 days18 (GSE37693). The repeated IL-13 treatment
leads to a typical mucus hypersecretion phenotype akin of the phenotype observed in inflammatory lung
diseases such as asthma and COPD. Using this approach, we found that our genesets were able to dis-
Scientific Reports | (2021) 11:6091 | https://doi.org/10.1038/s41598-021-85345-9 5
Vol.:(0123456789)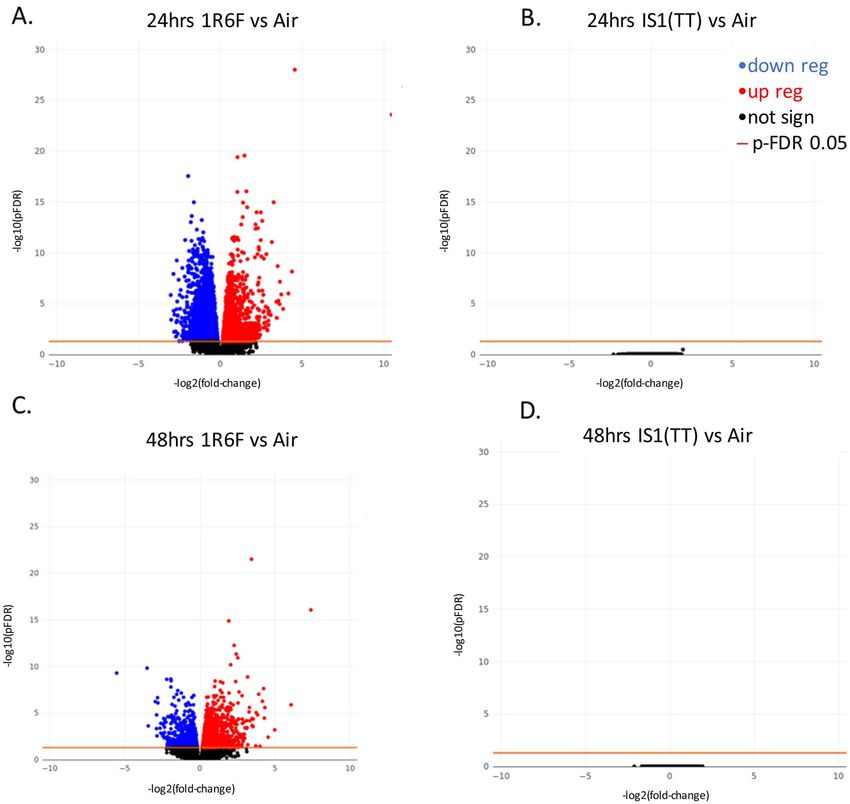
www.nature.com/scientificreports/
Figure 3. Volcano plots for the following 4 RNA-seq contrasts with pFDR < 0.05 threshold. 1R6F cigarette
smoke exposure (1/30 dilution) vs air control, 24 hrs (A) and 48 hrs (C) post-exposure recovery, respectively.
IS1 (TT) electronic cigarette aerosol exposure (1/3 dilution) vs air control, 24 hrs (B) and 48 hrs (D) post-
exposure recovery, respectively.
criminate the IL-13 treated samples from the untreated samples (Fig. 4C,D and Supplementary Fig. S8).
For all four KE genesets (KE1, KE2-3, KE4, KE5) clustering was observed based on treatment.
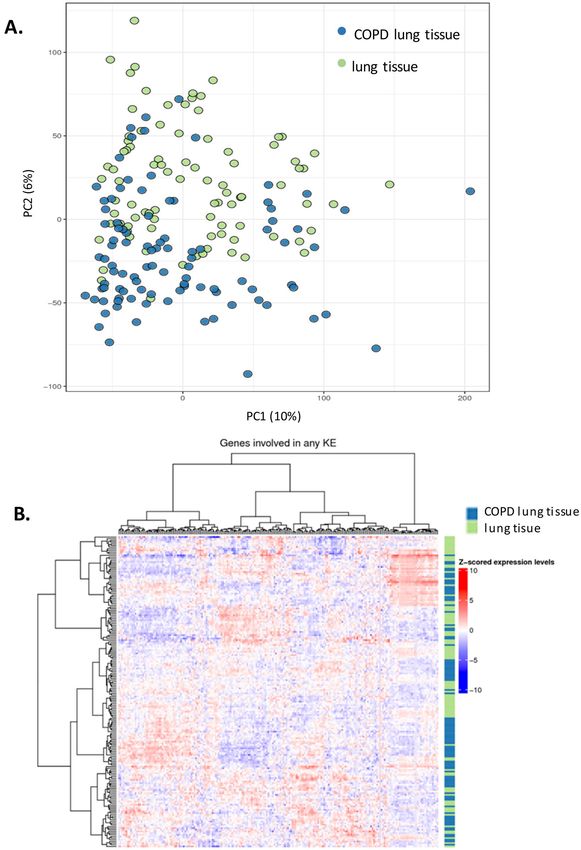
iii. Human COPD lung tissue biopsies. This study analyses the expression levels of "Mucus Hypersecretion"
AOP-associated genes in lung tissue samples obtained from 98 patients with COPD and 91 non-COPD
subjects. All subjects had been diagnosed with lung cancer. RNA-seq dataset from lung biopsies col-
lected during this study were downloaded from SRA P RJNA24581119. Exploratory analysis revealed that
subjects cluster by tissue disease status (COPD vs normal) on the second principal component (Fig. 5A).
Heatmaps of tissue-specific expression levels of "Mucus Hypersecretion" AOP-related genes showed no
obvious clustering of lung tissue samples by their disease status (Fig. 5B). Principle component analy-
sis (PCA) analyses revealed a potential disease status-effect on the expression of KE-associated genes
(Fig. 6A), however, the affected principal components (second, third or fourth) were also influenced by
confounding technical factors/quality of sequencing (perc gene, perc unmapped) (Fig. 6B). Perc_gene and
perc_unmapped are percentage of read-pairs mapped to one location in the genome and unambiguously
associated with a single gene and percentage of read-pairs not mapped to any location in the genome,
respectively. Therefore, it is not possible to conclude what is driving the separation.
Scientific Reports | (2021) 11:6091 | https://doi.org/10.1038/s41598-021-85345-9 6
Vol:.(1234567890)www.nature.com/scientificreports/
Figure 4. Unsupervised clustering using two in vitro datasets and the KE genesets. (A) and (B) show clustering
using the acute exposure (1 hrs) to cigarette smoke, e-cigarette aerosol, and air with 24 and 48 hrs post-exposure
recovery for KE1 and KE2 + 5 genesets, respectively. (C) and (D) show unsupervised clustering using the 21-day
incubation with IL-13 and corresponding air control with KE1 and KE2 + 5 genesets, respectively.
Discussion
AOPs are framework constructs mapping the causal link from a MIE to an AO all the way to the individ-
ual and population level14. Each intermediary incident at each level of biological organization (macromole-
cules, cells, organs) that ultimately is contributing to the adverse outcome is supported by literature evidence.
Therefore, AOPs offer the biological context to frame a targeted risk assessment and testing strategy13. Such
an assessment strategy can be applied to potentially reduced risk tobacco and nicotine delivery products and
Scientific Reports | (2021) 11:6091 | https://doi.org/10.1038/s41598-021-85345-9 7
Vol.:(0123456789)www.nature.com/scientificreports/
Figure 5. Application of the KE genesets to samples from COPD and non-COPD lung biopsies. (A) Principal
component analysis comparing the whole normalized RNA-seq data from the COPD and non-COPD samples.
(B) Unsupervised clustering using the COPD and non-COPD gene expression data and the pooled genesets
from the five KEs.
Scientific Reports | (2021) 11:6091 | https://doi.org/10.1038/s41598-021-85345-9 8
Vol:.(1234567890)www.nature.com/scientificreports/
Figure 6. Principal component analysis with the COPD and non-COPD lung samples using the key event
genes expression data (A) and corresponding covariate explaining the variance (B). Perc_ambiguous Percentage
of read-pairs mapped to one location in the genome and associated with more than one gene. Perc_gene
Percentage of read-pairs mapped to one location in the genome and unambiguously associated with a single
gene. These are used in the differential expression analysis. Perc_multimapping Percentage of read-pairs mapped
to more than one location in the genome. Perc_unmapped Percentage of read-pairs not mapped to any location
in the genome.
provide information on tobacco-related disease risk. Here, we used a previously published AOP for mucus
hypersecretion12, an adverse event observed in COPD and asthma patients, to reverse engineer KEs specific gen-
esets by leveraging literature mining process described by Rani et al.16. The genesets were then validated against
three transcriptomics datasets representing (1) an in vitro 3D human lung tissue (MucilAir™) acute exposure to
tobacco smoke or electronic cigarette aerosol, (2) a repeated incubation in vitro with IL-13 a known inducer of
the mucus hypersecretion p henotype18, and (3) a COPD lung biopsies d ataset19.
The first step of our geneset building exercise was to select three known key events from the published AOP
on mucus hypersecretion12 (KE1, KE2, KE3 shown in Fig. 1A) and two putative key events contributing to muco-
cilliary clearance dysfunction (unpublished) (KE4, KE5, Fig. 1A). The level of organization for the selected key
events were at the macromolecular and cellular levels to account for the proximity to the endpoint considered
which is gene expression. Next, a manual pubmed search was conducted using the KE name to retrieve a list
Scientific Reports | (2021) 11:6091 | https://doi.org/10.1038/s41598-021-85345-9 9
Vol.:(0123456789)www.nature.com/scientificreports/
of “seed genes” (S-genes) (Fig. 1B, Supplementary Table S1) which formed the basis of the automated abstract
search. For KE1, EGFR was already identified as the S-gene12 and therefore no further search was conducted.
The primary document corpus was subsequently assembled from automated text mining using the seed genes
(Supplementary Table S1) in combination with the terms “smoke” OR “tobacco” OR “acrolein” OR “acetalde-
hyde” OR “peroxide” OR “H2O2” OR “reactive oxygen species” as input in pubmed.mineR16. These key terms
were selected because they are known terms associated with mucus hypersecretion phenotypes in the context
of COPD, asthma, and respiratory irritancy21–23. A total of 63,060 abstracts (primary document corpus) were
recovered in total for all 5 KEs (Table 1 and Supplementary Tables S2–S6) and 3960 unique gene symbols. 175
genes were cited in pairs and ranked as the top pairs for each KE based on the highest cosine similarity score
(Supplementary Tables S7–S11).
A manual inspection step was subsequently performed using 761 abstracts (curated document corpus) (Sup-
plementary Tables S12–S16) from journals in the top impact factor range of 3.0 and above and containing at
least one of 175 top gene pairs based on the highest cosine similarities. The impact factor filter was introduced to
achieve a more focussed set of articles prior to manual curation. The thresholds of 3.0 was selected to take into
account both the estimated reach of the journal (as measured by the impact factor) and the amount of available
articles matching the search terms. After the removal of abstracts with false positive gene symbols (e.g. acronyms
identical to gene names) from the curated document corpus, a supervised approach was taken to provide further
manual curation of available literature by inspecting articles cited in the retained publications. From this, an
additional 48 abstracts were retrieved (Table 1) (Supplementary Tables S18–S21). One of the limitations of the
approach is the application of an arbitrary “3.0 minimum impact factor” filter. Impact factor do not reflect the
quality of any individual research and could lead to discarding highly relevant information published in more
specialized journals. The resulting reduction in the number of gene pairs from 175 to 132 is moderate in contrast
to an almost 80-fold reduction in the number of abstracts used to ascertain the gene relationships. This supports
the idea that the curated document corpus and filter applied have not led to a considerable loss of information.
25, 124, 50, and 51 unique genes, split between S-genes, curated document corpus genes, and literature cited
in the curated document corpus, were retrieved for KE1, KE2 + KE3, KE4, and KE5, respectively (Table 1) (Sup-
plementary Tables S18–S21). 31 of these genes overlapped with the COPD gene list published by Bosse in 201224
(Supplementary Fig. S9). Amongst these genes, we find IL13 and its receptor IL13RA1 which are known the be
driving the mucus hypersecretion phenotype in asthma. MMPs such as MMP9 and MMP12 were also significant
and key players in tissue remodelling associated with the histologic alteration in C OPD25,26. A more modest 9
27
genes were mapped with a proposed asthma geneset developed by Poole et al. which was based on transcrip-
tomic screens performed on samples from asthma patients and gene candidates from GWAS (genome wide
association studies) (Supplementary Fig. S9). It is important to remember that the AOP geneset we derived from
our literature mining used “tobacco”, “smoke” and “oxidative stress” search terms, therefore, it is not anticipated
to retrieve asthma specific genes. Yet, some common genes are expected in the context of goblet cell hyperplasia
and mucus hypersecretion occurring in both COPD and asthma.
The KE genesets were subsequently validated by unsupervised clustering against 3 different transcriptomic
datasets including (1) an acute cigarette smoke and e-cigarette exposure, (2) a repeated incubation with IL-1318,
and (3) lung biopsies from COPD and healthy p atients19.
Using the genesets individually for KE1, KE2 + 3, KE4, KE5 both the acute smoke exposure and repeated
IL-13 treatment clustered separately from the untreated controls. In the acute exposure, the air control clustered
together with the e-cigarette (IS1(TT)) aerosol exposure. The genes driving the differential clustering were, but
not limited to, TLR4, MUC5AC, NQO1, TIMP3, TIMP3, MMP9, MMP13, TGFA, EGR1, and DNAI2. It was not
surprising to observe the clustering of cigarette smoke treated samples given that the primary document corpus
search was performed with the key term “smoke” and “tobacco”. This result, however, positively confirmed that
the genesets are related to tobacco smoke exposure, a key matrix in the onset of COPD. No response was observed
from the IS1(TT) aerosol exposure at a p-FDR of 0.05 and below which lead to the clustering of the IS1(TT)
samples with the air samples. A similar clustering effect was observed with IL-13 and air treated cells. “IL-13” was
a seed gene included in the document corpus for KE2 to 5 (Supplementary Table S1), therefore, these genesets will
be enriched for IL-13 responsive genes. KE1, however, only used EGFR as S-gene, yet clustering is observed for
the IL-13 treated cells and non-treated cells with KE1 genes (Fig. 4C). Interestingly, IL-13 treatment is a known
inducer of the mucus hypersecretion and goblet cell hyperplasia phenotype in air liquid interface cell cultures28.
Importantly the IL-13-CLCA1-MAPK13 inflammatory response pathway involved in mucus hypersecretion has
been identified to be common to asthma sufferers and COPD p atients18,29. CLCA1 is a chloride channel specific
to mucosal tissues which increased activity is associated with the expression of the mucin protein MUC5AC
and activation of MAPK13. MUC5AC, CLCA1, MAPK13, IL13 and its receptor I L13RA128,30. These genes are
all found in our KE2 + 3 geneset for decreased apoptosis of ciliated cells and increased proliferation of epithelial
cells which precedes goblet cell hyperplasia and metaplasia. CLCA1 is also one of the 6 genes (CLCA1, IL4, IL13,
MMP12, TGFB1, TLR4) found in common between our KE genesets and the genesets proposed by B osse24 for
COPD and Poole27 for asthma.
When the unsupervised clustering approach was applied to a sequencing dataset from COPD lung biopsies
and non-COPD lungs19, our proposed geneset did not offer sufficient resolution to discriminate between the
groups (Fig. 5B). Although, some level of clustering was observed as illustrated by a principal component analysis
(Fig. 6A) a number of confounding factors could be identified from the dataset that may have contributed to the
clustering mostly related to the quality of the sequencing such as unmapped reads, and perc_gene (percentage
of read-pairs mapped to one location in the genome and unambiguously associated with a single gene) (Fig. 6B).
Clustering based on disease status was observed when the principal component analysis was performed on the
entire gene expression data and therefore additional genes may be driving this discrimination. Kim et al. 19,
reported a total of 2312 differentially expressed genes when comparing the expression data from COPD lung and
Scientific Reports | (2021) 11:6091 | https://doi.org/10.1038/s41598-021-85345-9 10
Vol:.(1234567890)www.nature.com/scientificreports/
non-COPD lung. Of these, 29 were also present in our KE-based genesets but they were not sufficient to drive
the unequivocal clustering of the samples on a disease status basis. Even with 2312 differentially expressed genes
the separation of the groups was not complete. Importantly, in the Kim et al.19 paper the COPD samples were not
stratified by gold stage and it was not specified which samples were from patients with or without emphysema.
This is important since KE1, KE2 and KE3 in this paper relate more specifically to phenotypes observed in COPD
patients without emphysema19. Furthermore, 90 of the COPD subjects were all diagnosed with lung cancer and
were split in one of the following three COPD treatment groups, (1) corticosteroids, (2) muscarinic receptor
antagonist, and (3) beta-agonist which will also impact gene expression profile. This illustrates the complexity
of validating genesets for COPD, a progressive heterogenous disease which can be further confounded by the
variety of medical approaches. Transcriptomics applied to biopsies of COPD patients who were stratified between
Gold stage 1 to 5 with or without emphysema may be better suited to complete the validation of the proposed
genesets, unfortunately such comprehensive datasets are currently missing.
In this study, we have illustrated how text mining with an automated element can be exploited to build
AOP-specific tools that can potentially be deployed for risk assessment. The text mining method used here was
described by Rani et al.16, but is only one amongst many other possibilities. In particular, some of the filters that
were used such as an impact factor cut off were arbitrary. The fluid nature of the selection criteria at the curation
stage and the diversity of platforms poses a real challenge to harmonize any form of text mining strategy. The
text mining exercise performed here was simple in the sense that it looked an association of genes by pairs. Yet,
further information can be retrieved from the curated document corpus such as the nature of the gene pair inter-
actions (up-regulation, down-regulation) which could give additional granularity in the downstream analyses.
In conclusion, AOPs are live constructs which evolve based on the available literature. AOPs can be used
to map the most relevant end points in a risk assessment strategy. Here, we presented one approach involving
manual search and automatic text mining to identify a suite of up-to-date genes associated with key events of
the mucus hypersecretion AOP. Validation of the genesets conducted with in vitro samples resulted in good
discrimination of a variety of treatment, IL-13, cigarette smoke, e-cigarette aerosol, and air. In vitro models
combined with relevant AOP-related markers such as KE-specific genesets offer a cheaper and faster risk assess-
ment option compared to in vivo studies. The genesets failed to predict disease status from COPD biopsy samples
which is possibly confounded by technical factors and clinical factors including disease heterogeneity and medical
treatment. Nevertheless, we propose that text mining is a promising and important tool that can be exploited to
develop up to date AOP-related genesets.
Materials and methods
Stage 1: mucus hypersecretion key events literature gathering. The mucus hypersecretion AOP
was described by Luettich et al.12 and the KEs were used as a basis for literature gathering. NCBI PubMed was
used to access literature and followed the mining process described by Rani et al. 2 01516. A primary body/
corpus of abstracts was assembled from manual searches using the KE names (search terms can be found in
Supplementary Table S1). For each KE, a list of seed genes was selected from the primary corpus by manual
review. KE1 already had one seed gene defined by the AOP. Next, a document corpus was created for each KE by
performing a search with each seed genes in combination with the terms “smoke OR tobacco OR acrolein OR
acetaldehyde OR peroxide OR H 2O2 OR reactive oxygen species” using the R package “pubmed.mineR”16. The
document corpus for each KE is detailed in Supplementary Tables S2–S6. The HGCN compliant gene symbols
present in the returned abstracts were identified by “automated named entity recognition” which is a pubmed.
mineR tool to from the “term document matrix”. The abstract co-occurrence of each gene on this list with every
other gene on the same list was assessed using the cosine-similarity for each gene pair17. Cosine similarity of
gene co-occurrences was used as a score to assess potential gene interactions with 0 meaning no co-occurrence
and 1 meaning 100% co-occurrence in the document corpus. Supplementary Tables S7–S11 present the cosine
similarity score for each KE gene pairs at completion of stage 1.
Stage 2: mucus hypersecretion key event literature curation. A filtering step was applied to the
gene pairs occurring in each KE document corpus by retaining abstracts with HGCN gene pairs in publications
with impact factor equal or above 3.0 (Supplementary Tables S12–S16). The remaining co-occurring gene pairs
were automatically annotated with biological information available through four different resource databases:
IntAct, KEGG, Reactome, and the Human Protein Atlas using R annotation packages31. The literature specified
as evidence of potential biological interactions was then manually reviewed to confirm the relevance of the
article. Additionally, a supervised approach was undertaken to provide further manual curation of available
literature. This was conducted by reviewing the relevant reference articles cited by the authors of the manually
curated abstracts, or revising the literature referenced in recent review papers. A curated document corpus was
then compiled for each KE and is described in Supplementary Tables S12–S17.
Experimental in vitro data. Cell culture. MucilAir™ (Epithelix Sarl, Geneva, Switzerland), a 3D cell cul-
ture systems, composed of reconstituted, differentiated human airway epithelia of nasal origin cultured the air–
liquid interface were used for this s tudy32. One donor was used for this study: Donor #MD046001, age: 64 yo,
Caucasian, male and as the tissue was constructed from passaged cells, they were not deemed relevant material
under the UK Human Tissue Act 2004. The cells were obtained with informed consent and the culture was sup-
plied fully anonymized for research purpose only.
Products. 1R6F reference cigarettes (University of Kentucky) are a 10 mg ISO tar yield tobacco product. 1R6F
were conditioned in accordance with ISO 3402:199933 before use. The prototype IS1(TT) electronic cigarette is
Scientific Reports | (2021) 11:6091 | https://doi.org/10.1038/s41598-021-85345-9 11
Vol.:(0123456789)www.nature.com/scientificreports/
a closed modular device and the ‘Twilight Tobacco’ variant was used containing 5 mg/ml nicotine replaceable
e-liquid cartridge (Supplementary Fig. S1A).
Experimental design and exposure method. MucilAir™ cells were placed in exposure c hambers34 with basal
media and exposed to either aerosols from the IS1(TT) prototype or from 1R6F cigarettes. Aerosols from both
products were generated using a RM20S smoking machine (Borgwaldt KC, Germany). 1R6F smoke was pro-
duced at a 1/30 aerosol:air dilution with vent blocked under the HCI smoking regime (55 ml puff volume drawn
over 2 s once every 30 s with a bell-wave puff profile)35. Aerosol from the e-cigarette was produced at a 1/3
dilution following the CORESTA recommended method n°81 (55 ml puff volume, 3 s puff duration, 30 s puff
interval), and a square wave puff profile36. For both exposures an air control was run alongside which received
sterile air at an identical puffing regime to the product exposure. Three independent replicate exposures were
undertaken for each product and air control, and within these exposures three replicate transwells were assigned
per product. After exposure, cells were incubated in fresh 700 μl MucilAir™ Culture Medium for 24 and 48 hrs
(RNA-seq). The basal media was collected for cell viability measurement (LDH release). The cells were lysed and
stored at − 80 °C for total RNA extraction. A schematic of the experimental design is presented in Supplemen-
tary Fig. S1B.
Experimental quality controls. The following controls were run on the samples to ensure adequate expo-
sure to the aerosol and tissue integrity:
1. Dosimetry Following completion of each exposure run, media from the in vitro cell exposure chambers
were collected for nicotine quantification to confirm exposure to the aerosol (Supplementary Fig. S2). The
UPLC–MS/MS-based procedure is described in Haswell et al. 2017 and 2 01820,37 with the UPLC method
adapted from Onoue et al. and the quantitative MS/MS method settings described by Jin et al.38,39.
2. Cellular integrity and morphology The air control tissue morphology was checked by immunohistochemistry
for the following respiratory epithelium markers: MUC5AC, FOXJ1 and p63 (Supplementary Fig. S3). To
confirm health and function of the cultures at both 24 and 48 h post exposure the following markers were
assessed (1) CBF (Supplementary Fig. S4), (2) trans-epithelial electrical resistance (TEER) (not shown), (3)
cell viability using LDH release (Supplementary Fig. S5). All these methods were as previously described in
Haswell et al. 2017 and 2 01820,37.
3. Statistics Pairwise comparisons were assessed using a non-parametric Mann–Whitney u-test using Minitab
v18.1. and non-logged data for nicotine, TEER, CBF, and LDH release.
RNA isolation and RNA‑seq. The RNA isolation and sequencing procedure was identical to the method
described in Haswell et al. 201837. Briefly, the cells were lysed with QIAzol and the RNA was extracted using
the QIAGEN miRNeasy Mini Kit (Hilden, Germany) and a QIACube workstation. All RNA samples had a RIN
greater or equal to 8.0. Sequencing was performed on an Illumina NextSeq 500 platform (Illumina, Sand Diego,
CA, USA) at a depth of 40 million pair reads with 150 bp paired-end. (Raw FASTQ sequence files can be found
on NCBI-SRA at: https://www.ncbi.nlm.nih.gov/bioproject, SRP237772).
IL‑13 and COPD treatment transcriptomics datasets. Microarray dataset GSE37693 was down-
loaded from the following Gene Expression Omnibus link: https://www.ncbi.nlm.nih.gov/geo/query/acc.
cgi?acc=GSE37693. Briefly this geneset compares the transcriptome of the primary cell type hTECs (human Tra-
cheal Epithelial Cells) grown at the air liquid interface and treated for 3 weeks with IL-13 and the corresponding
untreated controls. The repeated IL-13 treatment triggers goblet cell hyperplasia and mucus hypersecretion18.
The next generation sequencing dataset GSE57148 was downloaded from the sequence read archive (SRA) web-
site: https://www.ncbi.nlm.nih.gov/sra?term=SRP041538. This dataset is derived from tissue biopsies from 98
COPD patients and 91 non-COPD smokers all diagnosed with lung c ancer19. The biopsies were taken from the
healthy margin of resected tissues.
RNA‑seq, microarray data analyses and clustering. For the RNA-seq data analysis, the assessment
was performed using linear modelling with the air control exposure as reference while adjusting for relevant fac-
tors including exposure run, Next Generation Sequencing run, treatment and time point. Subsequently, empiri-
cal Bayesian analysis was applied including p-value adjustment for multiple testing, which controls for false
discovery rate (pFDR)40. For each comparison, the null hypothesis was that there was no difference between the
groups being compared. The Bioconductor package Limma was used41. The primary output from the statisti-
cal analysis is a set of fully annotated (when available) lists of genes differentially expressed in the comparison
of interest. The same approach was applied to the COPD RNA-seq data from the Jeong et al.41,42 publication
(PRJNA245811), but comparing COPD samples with non-COPD samples.
The normalized expression data from our 1R6F and IS1(TT) experiment and from the Alevy et al., and Jeong
et al.18,42, papers were processed as follow for unsupervised clustering. The IL-13 microarray GSE37693 Illumina
HumanHT-12 V3.0 expression beadchips probe IDs were decoded into the corresponding gene symbols using
the R package illuminaHumanv3.db43. For all datasets the expression data was extracted for the KE genes. The
data were mean-centered and scaled to unit-variance (i.e. Z-scores). The resulting samples and gene expression
profiles were finally subjected to an agglomerative hierarchical clustering analysis based on their pairwise Euclid-
ean distances and Ward linkage. Both hierarchical clustering analysis and heatmap visualization were supported
by the R package C omplexHeatmap44.
Scientific Reports | (2021) 11:6091 | https://doi.org/10.1038/s41598-021-85345-9 12
Vol:.(1234567890)www.nature.com/scientificreports/
For the COPD samples, separate PCA models were calculated for each subset of KE genes using the R pack-
age pcaMethods45. Pairwise association tests were subsequently performed in R between each principal com-
ponent and technical factors in the data (related to read quality). For an association between a categorical and a
continuous factor, ANOVA was used, whereas for an association between two continuous factors, a Spearman
correlation test was used.
Received: 8 April 2020; Accepted: 26 February 2021
References
1. Murphy, J. et al. Assessing modified risk tobacco and nicotine products: Description of the scientific framework and assessment
of a closed modular electronic cigarette. Regul. Toxicol. Pharmacol. 90, 342–357 (2017).
2. ICH. S2 Guidance on genotoxicity testing and data interpretation for pharmaceuticals intended for human use, ICH harmonised
tripartite guideline (S2(R1)). 2011 06 Sep 2019]; Available from: https://www.ich.org/fileadmin/Public_Web_Site/ICH_Products/
Guidelines/Safety/S2_R1/Step4/S2R1_Step4.pdf.
3. BeruBe, K., et al. In vitro models of inhalation toxicity and disease. The report of a FRAME workshop. Altern. Lab. Anim. 37(1),
89–141 (2009).
4. Breheny, D.O., Pant, K., Gaça, M. Comparative tumor promotion assessment of e-cigarette and cigarettes using the in vitro Bhas
42 cell transformation assay. Environ. Mol. Mutagen. 58(0893–6692), 190–198 (2017).
5. Taylor, M. et al. A comparative assessment of e-cigarette aerosols and cigarette smoke on in vitro endothelial cell migration. Toxicol.
Lett. 277, 123–128 (2017).
6. Taylor, M. et al. E-cigarette aerosols induce lower oxidative stress in vitro when compared to tobacco smoke. Toxicol. Mech. Methods
26(6), 465–476 (2016).
7. Kanehisa, M. Toward understanding the origin and evolution of cellular organisms. Protein Sci. 28(11), 1947–1951 (2019).
8. Kanehisa, M. et al. KEGG: integrating viruses and cellular organisms. Nucleic Acids Res 49(D1), D545–D551 (2021).
9. Kanehisa, M. & Goto, S. KEGG: kyoto encyclopedia of genes and genomes. Nucleic Acids Res. 28(1), 27–30 (2000).
10. Tieri, P. & Nardini, C. Signalling pathway database usability: lessons learned. Mol. Biosyst. 9(10), 2401–2407 (2013).
11. Lowe, F. J. et al. Development of an adverse outcome pathway for the onset of hypertension by oxidative stress-mediated perturba-
tion of endothelial nitric oxide bioavailability. Appl. Vitro Toxicol. 3(1), 131–148 (2017).
12. Luettich, K. et al. The adverse outcome pathway for oxidative stress-mediated EGFR activation leading to decreased lung function.
Appl. Vitro Toxicol. 3(1), 99–109 (2017).
13. Tollefsen, K. E. et al. Applying adverse outcome pathways (AOPs) to support integrated approaches to testing and assessment
(IATA). Regul. Toxicol. Pharmacol. 70(3), 629–640 (2014).
14. Vinken, M. et al. Adverse outcome pathways: A concise introduction for toxicologists. Arch. Toxicol. 91(11), 3697–3707 (2017).
15. Lopez-Campos, J. L., Tan, W. & Soriano, J. B. Global burden of COPD. Respirology 21(1), 14–23 (2016).
16. Rani, J., Shah, A.B., & Ramachandran, S. pubmed.mineR: an R package with text-mining algorithms to analyse PubMed abstracts.
J. Biosci. 40(4), 671–682 (2015).
17. Sethi, P. & Alagiriswamy, S. Association rule based similarity measures for the clustering of gene expression data. Open Med.
Inform. J. 4, 63–73 (2010).
18. Alevy, Y. G. et al. IL-13–induced airway mucus production is attenuated by MAPK13 inhibition. J. Clin. Investig. 122(12), 4555–
4568 (2012).
19. Kim, W. J. et al. Comprehensive analysis of transcriptome sequencing data in the lung tissues of COPD subjects. Int. J. Genomics
2015, 206937 (2015).
20. Haswell, L. E. et al. Reduced biological effect of e-cigarette aerosol compared to cigarette smoke evaluated in vitro using normal-
ized nicotine dose and RNA-seq-based toxicogenomics. Sci. Rep. 7(1), 888 (2017).
21. Bhalla, D. K. et al. Cigarette smoke, inflammation, and lung injury: A mechanistic perspective. J. Toxicol. Environ. Health B Crit.
Rev. 12(1), 45–64 (2009).
22. Cheah, N. P. et al. In vitro effects of aldehydes present in tobacco smoke on gene expression in human lung alveolar epithelial cells.
Toxicol. In Vitro 27(3), 1072–1081 (2013).
23. Strzelak, A., et al. Tobacco smoke induces and alters immune responses in the lung triggering inflammation, allergy, asthma and
other lung diseases: A mechanistic review. Int. J. Environ. Res. Public Health 15(5) (2018).
24. Bosse, Y. Updates on the COPD gene list. Int. J. Chron. Obstruct. Pulmon. Dis. 7, 607–631 (2012).
25. Hendrix, A. Y. & Kheradmand, F. The role of matrix metalloproteinases in development, repair, and destruction of the lungs. Prog.
Mol. Biol. Transl. Sci. 148, 1–29 (2017).
26. Koo, H.H. Lim, M.N., Yim, J., Kim, W.J. Relationship between plasma matrix metalloproteinase levels, pulmonary function,
bronchodilator response, and emphysema severity. Int. J. Chron. Obstruct. Pulmon. Dis. 11(1), 1129–1137 (2016).
27. Poole, A., et al. Dissecting childhood asthma with nasal transcriptomics distinguishes subphenotypes of disease. J. Allergy Clin.
Immunol. 133(3), 670–8 e12 (2014).
28. Thavagnanam, S. et al. Effects of IL-13 on mucociliary differentiation of pediatric asthmatic bronchial epithelial cells. Pediatr. Res.
69(2), 95–100 (2011).
29. Iwashita, H. et al. Increased human Ca(2)(+)-activated Cl(-) channel 1 expression and mucus overproduction in airway epithelia
of smokers and chronic obstructive pulmonary disease patients. Respir. Res. 13, 55 (2012).
30. Yasuo, M. et al. Relationship between calcium-activated chloride channel 1 and MUC5AC in goblet cell hyperplasia induced by
interleukin-13 in human bronchial epithelial cells. Respiration 73(3), 347–359 (2006).
31. Bioconductor AnnotationData Packages Bioconductor version: Release (3.9). 2019.
32. Baxter, A. et al. Targeted omics analyses, and metabolic enzyme activity assays demonstrate maintenance of key mucociliary
characteristics in long term cultures of reconstituted human airway epithelia. Toxicol. In Vitro 29(5), 864–875 (2015).
33. 3402:1999, I. Tobacco and tobacco products—Atmosphere for conditioning and testing, in 3402:1999, ISO, Editor. 1999. p. 5.
34. Adamson, J. et al. Assessment of an in vitro whole cigarette smoke exposure system: The Borgwaldt RM20S 8-syringe smoking
machine. Chem. Cent. J. 5, 50 (2011).
35. WHO. SOP 01 Standard operating procedure for intense smoking of cigarette. World Health Organization Tobacco Laboratory
Network 2012; Available from: https://apps.who.int/iris/bitstream/handle/10665/75261/9789241503891_eng.pdf;sequence=1.
36. Stevens, R. CORESTA Electronic Cigarette Task Force. 2014 07 Aug 2019]; Available from: https://www.coresta.org/sites/default/
files/pages/CORESTA-ECIG-TF_FDA-Ecig-Wrkshp_20141210-11.pdf.
37. Haswell, L. E. et al. In vitro RNA-seq-based toxicogenomics assessment shows reduced biological effect of tobacco heating products
when compared to cigarette smoke. Sci. Rep. 8(1), 1145 (2018).
Scientific Reports | (2021) 11:6091 | https://doi.org/10.1038/s41598-021-85345-9 13
Vol.:(0123456789)www.nature.com/scientificreports/
38. Jin, M. et al. A LC-MS/MS method for concurrent determination of nicotine metabolites and role of CYP2A6 in nicotine metabo-
lism in U937 macrophages: implications in oxidative stress in HIV + smokers. J. Neuroimmune. Pharmacol. 7(1), 289–299 (2012).
39. Onoue, S.Y., Seto, Y., Yamada, S. Pharmacokinetic study of nicotine and its metabolite cotinine to clarify possible association
between smoking and voiding dysfunction in rats using UPLC/ESI-MS. Drug Metab. Pharmacokinet. 26(4), 416–422 (2011).
40. Hochberg, Y. & Benjamini, Y. More powerful procedures for multiple significance testing. Stat. Med. 9(7), 811–818 (1990).
41. Law, C.W.A., M., Su, S., Dong, X., Tian, L., Smyth, G. K., Ritchie, M. E., RNA-seq analysis is easy as 1–2–3 with limma, Glimma
and edgeR [version 3; peer review: 3 approved]. F1000Research, 2018. 5 (.1408).
42. Jeong, I. et al. Gene expression profile of human lung in a relatively early stage of COPD with emphysema. Int. J. Chron. Obstruct.
Pulmon. Dis. 13, 2643–2655 (2018).
43. Dunning, M.L., A.; Eldridge, M., illuminaHumanv3.db: Illumina HumanHT12v3 annotation data (chip illuminaHumanv3) R pack-
age version: 1.26.0. 2015.
44. Gu, Z., Eils, R. & Schlesner, M. Complex heatmaps reveal patterns and correlations in multidimensional genomic data. Bioinfor-
matics 32(18), 2847–2849 (2016).
45. Stacklies, W. et al. pcaMethods: A bioconductor package providing PCA methods for incomplete data. Bioinformatics 23(9),
1164–1167 (2007).
Acknowledgements
The authors are grateful to Fios Genomics for their support with the RNA-seq data analysis and Epithelix Sarl
for their contribution with the immunohistochemistry. The authors thank Stela Bozhilova for her help with
Fig. 1 and Supplementary Fig. S1 graphical representations. This work was funded by British American Tobacco.
Author contributions
L.E.H., S.C., A.B., A.B., I.V., T.J., and S.S. performed the exposure experiments, nicotine quantification, meas-
urement of functional endpoints, RNA preparation. L.H., F.dA.L. and E.M. conducted the data analysis. E.M.,
L.E.H., D.B. and M.G. designed the study, wrote and reviewed the paper.
Competing interests
All the authors are currently employed by British American Tobacco (Investments) Ltd, and the study was funded
by British American Tobacco (Investments) Ltd. Elements of this work were conducted Fios Genomics Ltd. as
part of a commercial contract.
Additional information
Supplementary Information The online version contains supplementary material available at https://doi.
org/10.1038/s41598-021-85345-9.
Correspondence and requests for materials should be addressed to M.D.G.
Reprints and permissions information is available at www.nature.com/reprints.
Publisher’s note Springer Nature remains neutral with regard to jurisdictional claims in published maps and
institutional affiliations.
Open Access This article is licensed under a Creative Commons Attribution 4.0 International
License, which permits use, sharing, adaptation, distribution and reproduction in any medium or
format, as long as you give appropriate credit to the original author(s) and the source, provide a link to the
Creative Commons licence, and indicate if changes were made. The images or other third party material in this
article are included in the article’s Creative Commons licence, unless indicated otherwise in a credit line to the
material. If material is not included in the article’s Creative Commons licence and your intended use is not
permitted by statutory regulation or exceeds the permitted use, you will need to obtain permission directly from
the copyright holder. To view a copy of this licence, visit http://creativecommons.org/licenses/by/4.0/.
© The Author(s) 2021
Scientific Reports | (2021) 11:6091 | https://doi.org/10.1038/s41598-021-85345-9 14
Vol:.(1234567890)You can also read