An exploratory assessment of stretch induced transmural myocardial fiber kinematics in right ventricular pressure overload - Nature
←
→
Page content transcription
If your browser does not render page correctly, please read the page content below
www.nature.com/scientificreports
OPEN An exploratory assessment
of stretch‑induced transmural
myocardial fiber kinematics in right
ventricular pressure overload
Danial Sharifi Kia1, Ronald Fortunato2, Spandan Maiti1,2, Marc A. Simon1,3,4,5,6 &
Kang Kim1,2,3,4,5,6,7*
Right ventricular (RV) remodeling and longitudinal fiber reorientation in the setting of pulmonary
hypertension (PH) affects ventricular structure and function, eventually leading to RV failure.
Characterizing the kinematics of myocardial fibers helps better understanding the underlying
mechanisms of fiber realignment in PH. In the current work, high-frequency ultrasound imaging and
structurally-informed finite element (FE) models were employed for an exploratory evaluation of the
stretch-induced kinematics of RV fibers. Image-based experimental evaluation of fiber kinematics
in porcine myocardium revealed the capability of affine assumptions to effectively approximate
myofiber realignment in the RV free wall. The developed imaging framework provides a noninvasive
modality to quantify transmural RV myofiber kinematics in large animal models. FE modeling results
demonstrated that chronic pressure overload, but not solely an acute rise in pressures, results in
kinematic shift of RV fibers towards the longitudinal direction. Additionally, FE simulations suggest
a potential protective role for concentric hypertrophy (increased wall thickness) against fiber
reorientation, while eccentric hypertrophy (RV dilation) resulted in longitudinal fiber realignment.
Our study improves the current understanding of the role of different remodeling events involved in
transmural myofiber reorientation in PH. Future experimentations are warranted to test the model-
generated hypotheses.
Transmural myocardial fiber orientations in the right ventricular (RV) wall lead to unique structural and bio-
mechanical properties and play a key role in RV function. Pulmonary hypertension (PH) is a disease that results
in RV pressure overload, ventricular remodeling, myocardial hypertrophy and fibrosis. RV failure remains the
main cause of mortality in the setting of PH1 with 3-year mortality rates as high as 33–38%2,3.
Previous studies have closely linked RV biomechanics to ventricular f unction4. From a biomechanical per-
spective, RV myocardium experiences increased wall thickness, tissue stiffening, fibrosis, chamber dilation and
transmural fiber reorientation in PH5,6. RV remodeling and fiber reorientation towards the longitudinal (apex
to base) direction results in drastically different RV biomechanics, affecting the transmural distribution of wall
stress7, ventricular twisting motions and filling and ejection mechanics of the RV8. Nevertheless, mechanistically,
RV fiber reorientation is poorly understood and there remains a debate around the a daptive9 vs. maladaptive8
nature of fiber remodeling in PH. Characterizing the kinematics of myocardial fibers will help establishing a
better understanding of the underlying mechanisms of fiber realignment in PH. However, full-thickness trans-
mural RV fiber kinematics remains largely unexplored, mainly due to imaging difficulties caused by the RV wall
thickness in large animal models and human patients, limiting our ability to study fiber kinematics transmu-
rally. Despite high imaging resolutions, the depth limit of optical techniques such as multi-photon microscopy
1
Department of Bioengineering, University of Pittsburgh, Pittsburgh, PA, USA. 2Department of Mechanical
Engineering and Materials Science, University of Pittsburgh, Pittsburgh, PA, USA. 3Division of Cardiology,
Department of Medicine, University of Pittsburgh School of Medicine, 623A Scaife Hall, 3550 Terrace Street,
Pittsburgh, PA 15213, USA. 4Heart and Vascular Institute, University of Pittsburgh Medical Center (UPMC),
Pittsburgh, PA, USA. 5Pittsburgh Heart, Lung, Blood and Vascular Medicine Institute, University of Pittsburgh
and University of Pittsburgh Medical Center (UPMC), Pittsburgh, PA, USA. 6McGowan Institute for Regenerative
Medicine, University of Pittsburgh, Pittsburgh, PA, USA. 7Center for Ultrasound Molecular Imaging and
Therapeutics, University of Pittsburgh, Pittsburgh, PA, USA. *email: kangkim@upmc.edu
Scientific Reports | (2021) 11:3587 | https://doi.org/10.1038/s41598-021-83154-8 1
Vol.:(0123456789)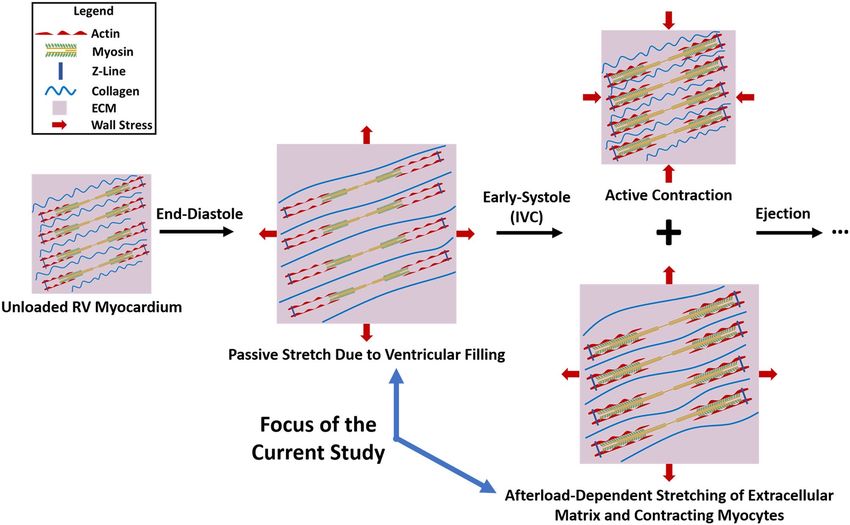
www.nature.com/scientificreports/
Figure 1. Stretch-induced deformations experienced by RV myocardium during diastolic filling and the IVC
phase of early-systole. During diastole, ventricular filling results in passive stretch of the RVFW. IVC follows
tricuspid valve closure at end-diastole, during which active myocardial contraction increases chamber pressures
(while both tricuspid and pulmonary valves remain closed) and results in increased wall stress (afterload) and
stretching of the RVFW. Both active contraction and stretching happen simultaneously during this phase, as
reflected in increased ventricular pressures6,13 in addition to ventricular wall thinning13,14 and fiber stretch13
during early-systole. This is followed by pulmonary valve opening and systolic ejection, which results in negative
RVFW contractile strains. The current study focuses on stretch-induced deformations of RV myocardium
during the end-diastolic and early-systolic phases of a cardiac cycle, without considering the effects of
cardiomyocyte contraction. ECM extracellular matrix, RV right ventricle, RVFW right ventricular free wall, IVC
isovolumetric contraction.
(100–1200 μm limit10) and long imaging time, exposure to ionizing radiation, availability and cost-effectiveness
issues with diffusion tensor magnetic resonance imaging11,12 (DTMRI) limit their applicability for benchtop
or clinical studies on RV fiber kinematics. On the other hand, ultrasound imaging is a widely available, non-
ionizing, cost-effective technique capable of overcoming the depth limits of optical methods to assess cardiac
structure and function.
RV myocardium undergoes different modes of deformation during a cardiac cycle (Fig. 1). In the current
work we focus on the stretch-induced deformations of right ventricular free wall (RVFW) during diastolic fill-
ing and the isovolumic contraction (IVC) phase of early-systole (Fig. 1). IVC follows tricuspid valve closure at
end-diastole, when active myocardial contraction increases chamber pressures (while both tricuspid and pulmo-
nary valves remain closed) which results in increased wall stress (afterload) and stretching of the RVFW. Both
active contraction and passive stretching happen simultaneously during early-systole, as reflected in increased
ventricular pressures6,13 (demonstrating active contraction) in addition to fiber stretch13 and ventricular wall
thinning13,14 (demonstrating stretch-induced deformations). This is followed by pulmonary valve opening and
systolic ejection. Myocardial contraction (fiber shortening) results in small reversible changes in fiber angles
towards the longitudinal d irection15,16, as also reflected in the torsional motion of the h eart17. However, longitu-
5,6,8
dinal fiber remodeling in PH has been identified as an end-stage remodeling event accompanied by reduced
RV ejection f raction8 and diminished systolic myofiber s hortening18 (minimum principle strains). While the
eventual outcome of fiber remodeling may affect ventricular contractile m echanics19,20, decreased minimum
principle strains at end-stage P H18 results in smaller myofiber kinematic shifts towards the longitudinal direc-
tion compared to normotensive loading and makes myofiber contraction less likely to mechanistically stimulate
transmural fiber reorientation in PH. Motivated by this, we hypothesized that stretch-induced deformations
experienced by RV myocardium (Fig. 1) in the setting of PH may result in myofiber kinematic shifts towards
the longitudinal direction. Stretch-induced deformations have been studied as a stimuli for fiber reorientation
in other biological t issues21,22.
Scientific Reports | (2021) 11:3587 | https://doi.org/10.1038/s41598-021-83154-8 2
Vol:.(1234567890)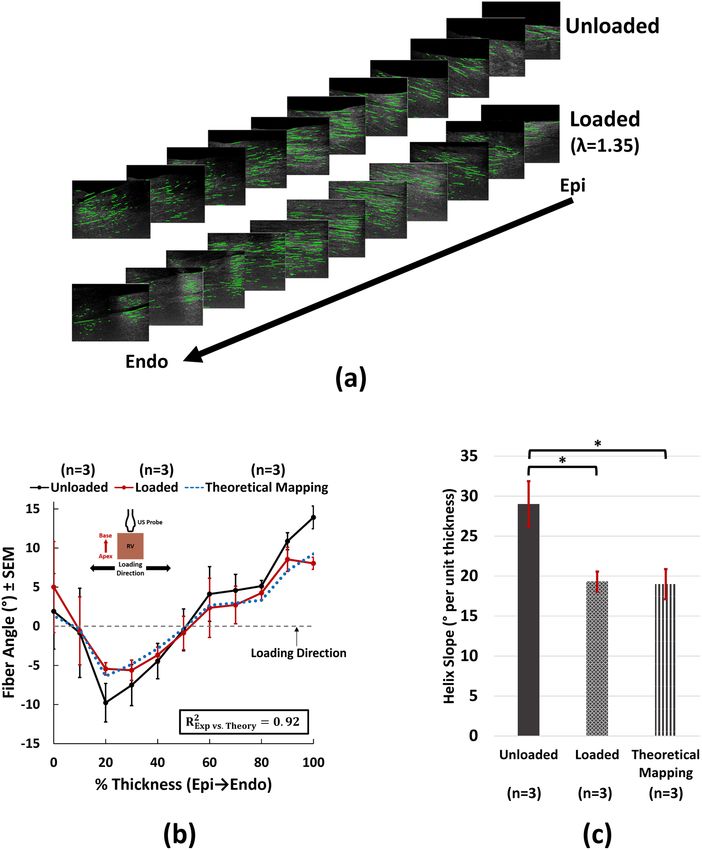
www.nature.com/scientificreports/
Stretching of the myocardial niche in early-systole is of particular importance in the setting of pressure
overload, mainly due to the increased afterload (wall stress). Previous studies have reported an increase in
stretch-activated Ca2+ transient amplitudes in response to pressure overload, with no significant alterations in
the diastolic sarcomere l ength23. Additionally, expressions of stretch-induced24 c-fos proto-oncogenes and fetal
isoforms of α-actin have been identified as an early growth-induction response in pressure overload25. Increased
early-systolic stretch is also evident in echocardiographic assessments of patients with increased RV a fterload26.
Due to material anisotropy and nonlinearity5,6,27,28, depending on the ratio of the applied mechanical stimuli
(strain), stretching of RV myocardium may lead to fiber kinematics towards different directions under different
loading scenarios (supplementary Fig. S1). Stretch-induced alterations in the biomechanical stimuli applied to
the myofiber niche has the potential to activate different remodeling pathways leading to fiber realignment and
structural remodeling29–32.
In the first stage of this study, an enhanced framework was developed and validated against histological
measurements to analyze high-frequency ultrasound (HFU) images for quantification of transmural RV myofiber
orientations. Stretch-induced myofiber reorientation under uniaxial loading was studied to demonstrate the
feasibility of the developed framework to study RV fiber kinematics. Furthermore, due to the complexity associ-
ated with coupled biaxial loading/HFU imaging, nonlinear structurally-informed fiber embedded finite element
(FE) models of the RV myocardium were developed to conduct an exploratory study on biaxial fiber kinemat-
ics. FE models were used to study the role of different remodeling events such as fi brosis5,6, concentric5,6,33 and
6,34
eccentric hypertrophy on stretch-induced RV fiber kinematics in acute and chronic pressure overload. Our
exploratory study improves the current understanding of the role of different remodeling events involved in
transmural reorientation of RV fibers in PH. This will help with appropriate hypothesis generation for future
experimental studies on RV fiber kinematics while ongoing work focuses on development of improved imaging
algorithms for coupled HFU imaging/biaxial loading.
Methods
HFU imaging to quantify transmural RV fiber kinematics. Previous studies have demonstrated the
potential of HFU imaging in characterizing muscle fibers with high spatial resolution, using a combination of
multi-scale decomposition and diffusion filtering techniques35,36. However, to the best of our knowledge, no
efforts have been made to quantify the transmural kinematics of RV myofibers using HFU imaging. In the first
stage of this study an enhanced HFU imaging framework was developed to study the transmural kinematics of
RVFW myofibers (Fig. 2a).
Development of an HFU imaging framework. A square specimen was harvested from the basal anterior zone
(r2 zone12) of porcine RVFW (procured from a local butchery) and scanned at 50 MHz using an HFU scanner
(Vevo2100, FUJIFILM-VisualSonics, Toronto, Canada). HFU images were acquired at a precision of 524 pixels/
cm while the imaging probe was positioned along the apex to base direction, normal to the transmural axis of
the RVFW (from epicardium to endocardium). Using a servo stage, 3D scans were generated by stacks of 2D
images acquired at 102 µm increments, chosen based on the transducer elevational beam width. Since HFU
scans result in high noise in the acquired images, similar to previous s tudies36, a nonlinear anisotropic diffusion
filter (NLADF) was used to reduce the noise levels (Fig. 2a)37:
∂I
(1)
= ∇. c x, y, t ∇I = c x, y, t �I + ∇c · ∇I
∂t
Here, I is the image intensity in 2D space, t represent the iteration steps and c is the anisotropic diffusion
tensor at point (x, y), as previously defined35,36. The NLADF filtering framework is based on the diffusion equa-
tion (directional gaussian b lurring37) and helps reducing the noise levels while keeping the main features of
37
the image . The acquired B-mode images were filtered using Eq. 1 at two different iterations, NLADF(t1) and
NLADF(t2), while t 2 > t1. Appropriate iteration times (t1 and t2) were manually selected by observing noise
reduction in the denoised images produced by NLADF (t1 = 100 and t2 = 300 iterations for the purposes of this
study). This was followed by multi-scale decomposition of fine and coarse components of the image (Fig. 2a):
C1 = I(t0 ) − NLADF(t1 ) (2)
C2 = NLADF(t1 ) − NLADF(t2 ) (3)
ReINLADF = α1 C1 + α2 C2 + (1 − α1 − α2 )NLADF(t2 ) (4)
where I(t0) is the original B-mode image, C 1 is the fine component of the HFU image, C 2 is the coarse compo-
nent, ReINLADF is the reconstructed image following NLADF and multi-scale decomposition, and α1 and α2 are
the scaling gains for image reconstruction (Fig. 2a). ReINLADF helps boosting the fine components in the HFU
image, while keeping the main features. Similar to previous work36, α1 and α2 were set at 0.6 and 0.2, respectively.
Despite considerably reduced noise levels after the NLADF, high noise in the original image leads to myofibers
represented in interrupted segments (Fig. 2a). Therefore, a coherence enhancing diffusion filter (CEDF)38 was
used to establish connectivity between disconnected fiber segments, while preserving the orientation of features
in the original B-mode image (Fig. 2a). CEDF functions similar to the NLADF algorithm (Eq. 1) while the diffu-
sion tensor c(x,y,t) is replaced by an adaptive structure tensor constructed using localized image orientations36,38.
This helps completing disconnected segments while keeping the orientation of features in the original image
Scientific Reports | (2021) 11:3587 | https://doi.org/10.1038/s41598-021-83154-8 3
Vol.:(0123456789)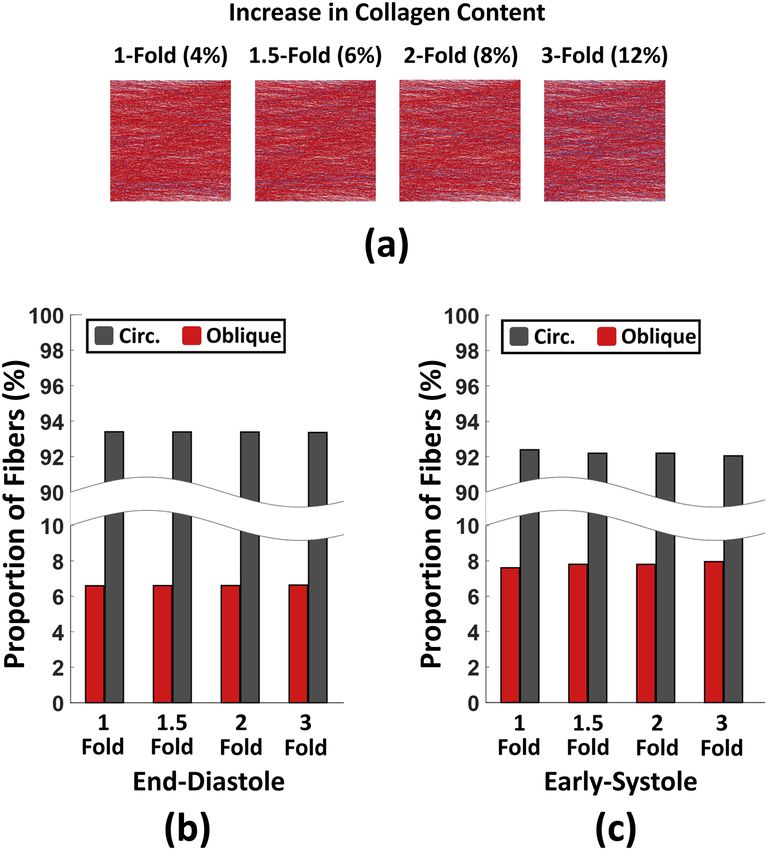
www.nature.com/scientificreports/
Figure 2. The ultrasound image processing framework used to detect transmural RV myofiber orientations.
(a) Development of the HFU imaging framework. Basal anterior zone RVFW specimens were scanned while
the ultrasound probe was aligned with the apex-to-base direction, normal to the transmural axis. High
noise in the acquired high-frequency B-mode images were reduced via multi-scale decomposition using
NLADF, followed by establishing myofiber connectivity by CEDF. Skeleton extraction was performed on the
resulting image, followed by fiber detection using the Hough transform and fitting a normal PDF to the fiber
distributions. (b) Algorithm verification by comparing HFU measurements with histological staining (H&E).
Error bars demonstrate fiber spread (standard deviation of the distribution of fiber orientations; measure of
fiber dispersion) at each transmural section. Fiber angles are normalized to 0° at the epicardial layer, to better
demonstrate the transmural change in fiber angles and facilitate comparison with previous s tudies42. Dotted
lines between HFU measurements are for visualization purposes only. TV Tricuspid valve, Epi Epicardium, Endo
endocardium, HFU high-frequency ultrasound, H&E hematoxylin and eosin stain, RV right ventricle, RVFW
right ventricular free wall, PDF probability density function.
(Fig. 2a). Following each filtering step, the resulting image was denoised via threshold-based techniques36. Appro-
priate denoising thresholds were manually selected for each image.
Scientific Reports | (2021) 11:3587 | https://doi.org/10.1038/s41598-021-83154-8 4
Vol:.(1234567890)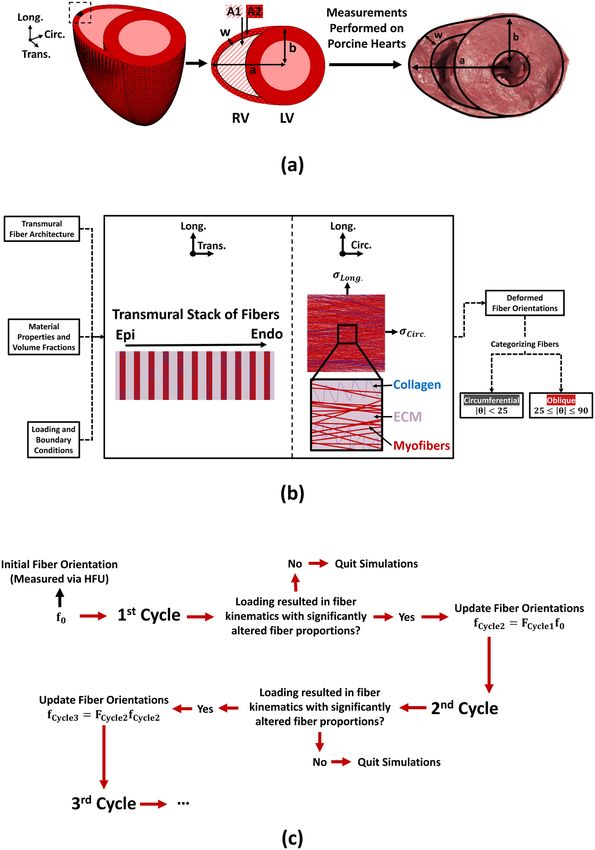
www.nature.com/scientificreports/
Volume fraction Material properties
ECM (except collagen) 3%28,46 α = 0.7 kPa β = 1.5 kPa
Myofibers 93% Emyo = 10 kPa
Collagen Fibers 4%47,48 Ecol = 1250 kPa λr = 1.15 ± 0.1
Table 1. RV material properties and volume fractions used for FE modeling.
Finally, the resulting image was converted to a binary format and, subsequent to skeleton extraction, myofiber
orientations were detected using the Hough transform (Fig. 2a). A Gaussian probability density function (PDF)
was then fitted to the fiber distribution at each section throughout the RV wall to quantify transmural fiber
orientations. Distribution means were reported as the dominant orientation at each transmural section, while
standard deviation of the distributions represent the fiber spread (dispersion)39. Algorithm development was
performed using MATLAB (Mathworks, Natick, MA).
Algorithm validation with histological measurements. For technical validation purposes, HFU measurements
were compared with transmural histological staining of the RVFW specimen using a hematoxylin and eosin
(H&E) stain. Fiber orientation of histological sections were detected using gradient based image analysis tech-
niques, as described in our previous studies5,6. Briefly, for each histological section, local image gradients were
calculated at each pixel, followed by the formation of the second-moment tensor of the gradient map:
w
x, y
Ix
x, y
Ix
x, y
dxdy
w
x, y
Ix
x, y
Iy
x, y
dxdy
H =
w x, y Ix x, y Iy x, y dxdy w x, y Iy x, y Iy x, y dxdy (5)
Here, H is the structure tensor (2 × 2 symmetric positive-definite matrix), w(x,y) is a gaussian weighing
function specifying the region of interest for integration, and Ix and I y are the partial spatial derivatives of the
image I(x,y) in x and y directions, respectively (obtained using a cubic B-spline i nterpolation40). Dominant fiber
orientations at each transmural section were acquired by evaluating the first eigenvector of the resulting second-
moment tensor40,41. Image processing and fiber orientation analysis of histological sections were performed using
the OrientationJ toolbox40,41 in ImageJ (imagej.nih.gov). Similar to previous studies42, for algorithm validation
and comparison purposes, fiber angles measured via histology and HFU imaging were normalized to 0° at the
epicardial layer to better demonstrate the transmural change in fiber angles and eliminate any tissue alignment
mismatch between HFU and histological measurements.
Feasibility evaluation of the developed framework to study the transmural kinematics of RV myofibers under uniax-
ial loading. Following algorithm verification, RVFW specimens (n = 3) were harvested from the basal anterior
zone of porcine myocardium and loaded using a custom displacement-controlled uniaxial loading gripper that
allows real-time HFU imaging. Fiber orientations were measured and analyzed in the RV circumferential-longi-
tudinal coordinate system when apex-to-base denotes the longitudinal direction. Transmural fiber orientations
were then analyzed under a stretch ratio (λ) of 1.35 in the circumferential direction. This was chosen based on a
RV systolic pressure of ≈ 105 mmHg in PH34 and approximation of RVFW stretch based on previously reported
biomechanical properties for a porcine model43. Experimentally measured fiber kinematics were compared with
theoretical predictions for an incompressible transversely isotropic solid with affine k inematics44:
√
Sin(θUnloaded )∗
θLoaded = arctan (6)
Cos(θUnloaded )∗ 2
Here, θUnloaded represents the unloaded fiber orientation at each transmural section, θLoaded is the fiber angle
after loading-induced realignment and λ is the amount of uniaxial stretch. We hypothesized that uniaxial loading
results in transmural realignment of RV myofibers towards the loading direction. Additionally, the transmural
variation of fiber angles was approximated via linear regression (fiber angles vs. %thickness). Slope of the linear
fit to transmural fiber angles demonstrates the helix slope of the RVFW (change in fiber angle per unit thickness),
which was hypothesized to decrease in response to uniaxial loading.
Finite element modeling to study RV fiber kinematics under biaxial loading. While the devel-
oped HFU algorithm shows great potential for quantifying RV fiber kinematics, it requires imaging in the plane
parallel to the RV wall (normal to the transmural axis). This demands at least one side of the planar RVFW speci-
men to be free for imaging, which complicates coupled biaxial loading and HFU imaging. Therefore, in the sec-
ond stage of this study structurally-informed nonlinear-heterogenous-anisotropic FE models of the RVFW were
created for an exploratory assessment of biaxial fiber kinematics under different loading scenarios. This will lay
the groundwork for future experimental studies on biaxial RV fiber kinematics, while development of special-
ized loading grippers and improved imaging algorithms for coupled HFU imaging/biaxial loading is in progress.
Model development. The modeling techniques used in this study have been described in detail in our previ-
ous work39,45. Briefly, a custom MATLAB subroutine was used to explicitly create planar fiber networks using
the dominant orientation and fiber spreads (pooled standard deviation of orientation distributions from n = 3
Scientific Reports | (2021) 11:3587 | https://doi.org/10.1038/s41598-021-83154-8 5
Vol.:(0123456789)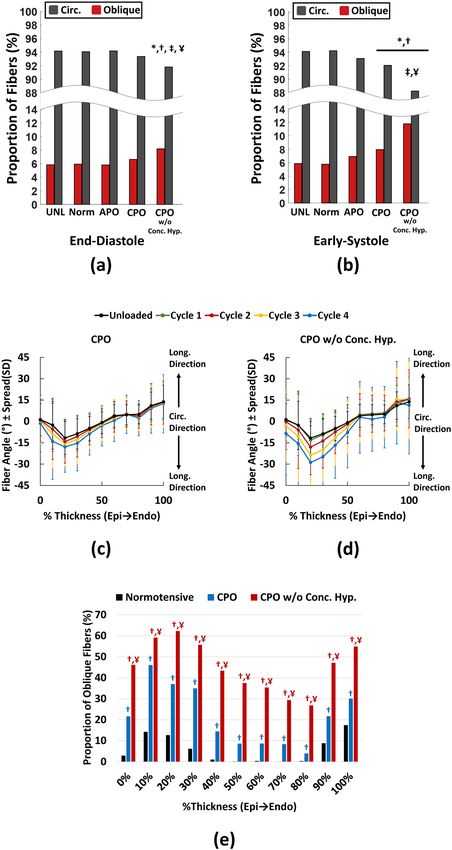
www.nature.com/scientificreports/

          Scientific Reports |   (2021) 11:3587 |   https://doi.org/10.1038/s41598-021-83154-8   6

Vol:.(1234567890)
www.nature.com/scientificreports/
◂Figure 3. The finite element modeling framework used to study biaxial RV fiber kinematics. (a) Loading
and boundary condition calculations. In order to keep the computational burden tractable, simulations were
performed on a representative volume element (RVE; shown in black in dotted box), and effects of the 3D RV
geometry were modeled as loading and boundary conditions based on an extension of the law of Laplace for
ellipsoidal geometries. Measurements were performed on porcine hearts to acquire the geometrical parameters
required for modeling. (b) The RVE in the circumferential-longitudinal and longitudinal-transmural planes,
showing the transmural stack of fibers from epi to endocardium and distribution of myofibers, collagen and
ECM at each transmural section. Transmural fiber architectures (measured via HFU) and porcine RVFW
material properties/volume fractions were used to generate the RVE. The calculated boundary conditions
(σCircumferential and σLongitudinal ) were then applied in the circumferential-longitudinal plane to analyze biaxial
RV fiber kinematics. Following simulations, fiber orientations of the RVE in the deformed state were categorized
into circumferential (|θ| < 25) and oblique (25 ≤ |θ| ≤ 90) fibers. (c) The remodeling algorithm used for
multi-cycle simulations to study the adaptation of RV fibers towards the longitudinal direction in chronic
pressure overload. Deformed fiber orientations were analyzed at the end of each cycle. If loading altered the fiber
proportions in a statistically significant manner, fiber orientations were updated using the described criteria
and simulations were proceeded to the next cycle. In case of no loading-induced alteration in the proportion of
fibers, simulations were aborted. Circ. circumferential, Long. longitudinal, Trans. transmural, RV right ventricle,
LV left ventricle, a radius of the ellipsoid representing the RV, b LV chamber outer radius, w RV wall thickness,
A1 area 1, A2 area 2, Epi epicardium, Endo endocardium, ECM extracellular matrix, HFU high-frequency
ultrasound.
samples) measured via HFU imaging. Myofibers, collagen and the ECM were created with 93%, 4% and 3% vol-
ume fractions28,46–48, respectively, to approximate the tissue-level biaxial p
roperties43 of porcine RV myocardium
(Table 1). The ECM was modeled using an incompressible isotropic hyperelastic constitutive m odel49:
W = α(Ib − 3) + β(Ib − 3)2 (7)
where α and β are constants representing the ECM mechanical properties, I b is the first invariant of the left
Cauchy–Green stretch tensor and W is the strain energy function when J = det(F) = 1 ensures incompressibility
(F represents the deformation gradient tensor). Collagen fibers were modeled with linear elastic properties,
activated after a recruitment stretch39:
0, < r
σ =
Ecol ( − r ), ≥ r (8)
Here σ represents components of the Cauchy stress tensor, Ecol is the stiffness of collagen fibers and λr is the
stretch at which collagen recruitment begins (Table 1). Additionally, myofibers were modeled with a similar
approach without a recruitment threshold (Table 1). To find the appropriate model parameters, simulated biaxial
stress-stretch response of the generated fiber network was regressed against previously reported material proper-
ties of porcine RV m yocardium43, while goodness of fit was determined using the coefficient of determination
(R2). For model verification, an unconfined uniaxial loading scenario (under λ = 1.35) was simulated and com-
pared with experimental HFU imaging measurements of RVFW fiber kinematics.
Loading scenarios, boundary conditions and fiber realignment. Similar to previous work39,45,50, we employed a
two-level modeling approach to keep the computational burden tractable. While simulations were performed
on a representative volume element (RVE; 1 mm × 1 mm × RV thickness) of the RVFW incorporating tissue
level structural organization (Fig. 3), loading and boundary conditions were based on an extension of the law of
Laplace, representing the entire RV approximated by an ellipsoidal g eomtery51,52 (Fig. 3a):
1
2 2 b4 (b − w)4
(9)
p= σCirc. a − (a − w) + σLong. 2 −
2(b − w)2 a (a − w)2
pA1 = σLong. A2 (10)
�
2 2
π� b − w (a − w) − b
(a − w)(b − w) − b2 + arctan b2 −
�
A1 =
2 a−w 2bw − w2
� (11)
2 2 2
(b − w) (a − w) − b
. . . (a − w)(b − w)arctan
(a − w)2 2bw − w2
π
ab − b2 − A1
A2 = (12)
2
Scientific Reports | (2021) 11:3587 | https://doi.org/10.1038/s41598-021-83154-8 7
Vol.:(0123456789)www.nature.com/scientificreports/
RV pressures (mmHg)34
End-diastole Early-systole End-diastolic volume (mL)34 RVFW thickness (mm)33 Collagen volume f raction6,47,48
Normotensive 4.9 31.3 27.7 9.8 4%
Acute pressure overload 14.3 105 27.7 9.8 4%
Chronic pressure overload 14.3 105 34.1 13.4 12%
Chronic pressure overload without concentric
14.3 105 34.1 9.8 12%
hypertrophy
Table 2. RV hemodynamics and remodeling parameters used for FE simulations.
End-diastole Early-systole
σCirc. (kPa) σLong. (kPa) σCirc. (kPa) σLong. (kPa)
Normotensive 0.62 0.37 3.96 2.37
Acute pressure overload 1.81 1.08 13.30 7.94
Chronic pressure overload 0.87 0.66 6.37 4.81
Chronic pressure overload without concentric hypertrophy 1.53 1.58 11.22 11.64
Table 3. Circumferential and longitudinal wall stresses applied to the representative volume element (RVE)
for different loading scenarios.
Here, p is the internal chamber pressure of the RV (diastolic or systolic pressure), σCirc. and σLong are the
RVFW wall stress (afterload) in the circumferential and longitudinal directions, w is the RV wall thickness, a
and b are geometrical measures for biventricular modeling of the left and right ventricles using Laplace-type
calculations (Fig. 3a) and A 1 and A
2 respectively represent the internal RV chamber area and the RVFW area,
when looking at a basal short-axis cross-section of the ventricles (Fig. 3a). Equations 9–12 approximate the
RV geometry with an oblate spheroid (semi-axes: a, a, b) while the left ventricle (LV) is approximated with a
prolate spheroid (semi-axes: b, b, L; when L represents the LV length). Detailed derivation of these equations
have been described e lsewhere51 and employed to estimate RV wall stress under pressure overload. Myofiber
diameter (57.8 ± 28.3 µm) and spacing (35.8 ± 11.2 µm) were acquired form histological measurements (Fig. 2b)
to generate the appropriate number of fibers in the RVE (network of 79,263 fibers generated transmurally).
Measurements were performed on 3 porcine hearts to obtain the required geometrical measures for modeling
(Fig. 3a; a = 64.7 ± 5.8 mm, b = 34.7 ± 2.5 mm, w = 9.8 ± 1.6 mm, and L = 65.0 ± 7.1 mm). Since systolic wall stress
reaches peak values early in s ystole53 with minimal dimension change from end-diastole54, same RV geometries
were assumed to calculate wall stresses at end-diastole and early systole (Tables 2, 3). Calculated wall stresses
were then applied to the developed RVE to study the stretch-induced kinematics of RV fibers (Fig. 3b). First, we
investigated biaxial kinematics under normotensive loading with healthy RV pressures and material properties
and no major remodeling event present in the model (Tables 2, 3). Additionally, an acute pressure overload (APO)
scenario was studied to investigate the effects of acute pressure rise on biaxial fiber kinematics. Likewise, effects
of chronic pressure overload (CPO) on fiber kinematics was studied under PH pressures34 post-remodeling,
while RVFW fibrosis6, eccentric34, and concentric33 hypertrophy (RV dilation and increased wall thickness,
respectively) are present in the model (Tables 2, 3). Since RV fiber realignment in PH is generally viewed as an
end-stage remodeling e vent6,8, this will help analyzing the alterations in fiber kinematics post RV remodeling in
CPO. Furthermore, due to the previously reported associations between aging and diminution of the extent of
concentric RV hypertrophy in response to pressure overload54, as well as lack of increased wall thickness in some
animal models of P H8,55, another case of CPO loading without concentric hypertrophy was simulated to study
the role of increased wall thickness on fiber kinematics in PH (Tables 2, 3). Moreover, a series of simulations were
conducted to analyze the effects of RV fibrosis on PH-induced fiber kinematics by parametrically altering the
collagen content in our model (1.5, 2 and threefold increase; supplementary Fig. S2). This will help decoupling
the observed effects from fibrosis, concentric and eccentric RV hypertrophy under CPO.
Simulations were performed under diastolic and early-systolic pressures for a single cycle of loading, in order
to analyze the direction and rate of fiber reorientation under different scenarios. Since a single cycle of loading
may not result in statistically significant differences in the mean of fiber orientation distributions56, similar to
previous studies34,56, post-deformation fiber orientations were categorized as circumferential (|θ| < 25) and
oblique (25 ≤ |θ| ≤ 90), to facilitate statistical testing of changes in the proportion of fiber orientations (Fig. 3b).
Thresholds for categorizing circumferential/oblique fibers were chosen in a way to include the undeformed
Scientific Reports | (2021) 11:3587 | https://doi.org/10.1038/s41598-021-83154-8 8
Vol:.(1234567890)www.nature.com/scientificreports/
fiber orientations ± at least 1 standard deviation of fiber spreads (dispersion) within the circumferential range
(supplementary Fig. S3). Therefore, an increase in the proportion of oblique fibers indicates fiber reorientation
away from the circumferential direction, as seen in the setting of P H5,6,8,51. In case of no statistically significant
alteration in the proportion of fiber orientations, simulations were aborted after the first cycle (Fig. 3c). Since,
physiologically, fiber remodeling in PH happens over multiple cycles of loading5,6,8, when proportions were sig-
nificantly altered, fiber orientations were updated using the deformation gradient tensor and simulations were
proceeded to the next cycle (Fig. 3c):
fn+1 = Fn fn (13)
Here, fn is the undeformed orientation of any given fiber at the nth cycle, F
n is the deformation gradient ten-
sor for the nth cycle and fn+1 represents the undeformed fiber orientation at the start of the n + 1th cycle. This is
conceptually similar to previously developed models for stretch-induced fiber remodeling in other cardiovas-
cular soft t issues22. In the current exploratory work, simulations were continued up to 4 cycles under CPO for
an exploratory assessment of the trends in fiber realignment in PH. FE model post-processing was performed
using ParaView57 (Sandia National Labs, Kitware Inc, and Los Alamos National Labs).
Statistical analysis. Data is presented with mean ± standard deviation (SD)/standard error of the mean
(SEM), or proportion (%) of fibers post-categorization. A one-way repeated measures ANOVA with Tukey’s
post-hoc was used for pairwise comparison of RV helix slope before and after loading and theoretical predic-
tions of affine reorientation. A R2 measure was used to evaluate the agreement between experimentally measured
uniaxial fiber kinematics and theoretical estimations or FE model predictions. In addition, R2 measures were
also used to evaluate the goodness of fit between experimentally measured biaxial mechanical properties of the
RVFW and FE model predictions.
Chi-squared (χ2) tests were performed to evaluate if fiber proportions were dependent on the loading condi-
tion. Post-hoc Z-tests with Bonferroni correction were utilized to test the differences across different loading sce-
narios. Due to integer overflow issues and limitations of the χ2 test for very large sample sizes, fiber counts were
down sampled by a factor of 10, post categorization. This was chosen as an optimal down sampling rate required
to avoid numerical instabilities when working with very large sample sizes (n = 79,263) from our FE model.
Statistical comparisons were performed using the R software p ackage58 (R Foundation for Statistical Comput-
ing, Vienna, Austria, www.R-project.org). Due to the small sample size in our experimental data and proportion
testing (as opposed to tests of the mean) for FE simulations, a more strict measure was chosen for statistical
comparisons. For all purposes, p < 0.01 (two-sided) was considered statistically significant.
Results
HFU imaging. Transmural RV myofiber orientations measured via HFU imaging and histology are com-
pared in Fig. 2b. HFU imaging showed an acceptable agreement with histological staining of fiber orientations
both in terms of the dominant orientation and spread of myofibers. Unloaded RV fiber orientations in the basal
anterior zone demonstrated an abrupt c hange42 around the sub-epicardial layers (142.4 ± 52.1°; n = 4; 1 speci-
men used for histological validation + 3 specimens for uniaxial loading experiments), followed by a near-linear
change in transmural fiber angles (28.5 ± 9.8°; n = 4). The abrupt sub-epicardial change showed high between-
sample variability, ranging from 64.7 to 175.2° (n = 4).
Uniaxial loading (n = 3) resulted in fiber realignment towards the loading direction (Fig. 4a, b), in agree-
ment with theoretical predictions of affine fiber kinematics ( R2 = 0.92; Fig. 4b). For all kinematics analysis pur-
poses (Figs. 4, 5, 6), fiber orientations are reported in the RV circumferential-longitudinal coordinate system
(Fig. 4b). Assuming a counterclockwise transmural rotation for RV fibers5,6,42, the abrupt epicardial change is
plotted with the shortest map to 0° to better demonstrate fiber realignment towards the loading direction (1.9°
and − 0.8° shown for 0% and 10% thickness in Fig. 4b correspond to 180° + 1.9° = 181.9° and 180°-0.8° = 179.2°,
respectively). Uniaxial loading resulted in significantly reduced RV helix slope (19.3 ± 2.2° vs. 29.0 ± 5.0° per
unit thickness for loaded and unloaded, respectively; p < 0.001), while showing no significant differences with
theoretical predictions of uniaxial affine fiber kinematics (19.0 ± 3.3° per unit thickness; p < 0.001 vs. unloaded
and p = 0.983 vs. loaded).
FE Modeling. The developed structurally-informed FE model matched the mechanical properties of RV
myocardium in both longitudinal and circumferential directions (R2Long. = 0.94, R2Circ. = 0.99, supplementary
Fig. S4), as well as the experimentally measured uniaxial fiber kinematics (R2 = 0.89, supplementary Fig. S4).
Fiber proportions were calculated based on a total of n = 79,263 fibers generated in the FE model. Categorizing
RV fibers in an unloaded state resulted in 94.1% circumferential and 5.9% oblique fibers (proportions calculated
by grouping all transmural sections together). Full statistical results of biaxial fiber kinematics in the first cycle
of loading are presented in supplementary Tables S1–S2. In response to a single cycle of loading, stretch-induced
kinematics under normotensive and APO conditions did not increase the proportion of oblique fibers for either
Scientific Reports | (2021) 11:3587 | https://doi.org/10.1038/s41598-021-83154-8 9
Vol.:(0123456789)www.nature.com/scientificreports/
Figure 4. Uniaxial myofiber kinematics under a stretch ratio of λ = 1.35. (a) Representative transmural
HFU images before and after loading. (b) Quantification of fiber angles using the developed framework.
Uniaxial loading results in fiber reorientation towards the loading direction (0°). Experimental measurements
demonstrate good agreement with theoretical approximations of affine fiber kinematics for an incompressible
transversely isotropic solid ( R2 = 0.92). (c) Effects of loading on RVFW helix slope. Loading results in decreased
RVFW helix slope, which does not show any statistically significant differences with theoretical affine
approximations. Error bars show standard error of the mean (SEM). *Indicates p < 0.01. One-way repeated
measures ANOVA with post-hoc testing performed using Tukey’s test. Epi epicardium, Endo endocardium, US
Probe ultrasound probe, Exp experimental, RV right ventricle, RVFW right ventricular free wall.
end-diastolic (Fig. 5a; 5.9% for Norm, 5.8% for APO) or early-systolic (Fig. 5b; 5.8% for Norm, 6.9% for APO)
pressures. CPO, on the other hand, significantly increased the proportion of oblique fibers under early-systolic
pressures by 35%, while showing no significant effects at end-diastole (Fig. 5a, b; 8.0% for CPO at early-systole
Scientific Reports | (2021) 11:3587 | https://doi.org/10.1038/s41598-021-83154-8 10
Vol:.(1234567890)www.nature.com/scientificreports/
and 6.6% at end-diastole). For CPO with no concentric RV hypertrophy present in the model, proportion of
oblique fibers increased by 101% at early-systole and 40% at end-diastole (Fig. 5a, b; 11.8% for CPO w/o Conc.
Hyp. at early-systole and 8.2% at end-diastole). Following the first cycle of loading, multi-cycle remodeling simu-
lations (Fig. 3c) were performed for the CPO scenarios under early-systolic pressures. Simulations demonstrated
RV fiber realignment towards the longitudinal direction (Fig. 5c, d), with higher remodeling rates for the case
without concentric hypertrophy (Fig. 5d). Categorizing RV fibers at each transmural section after 4 cycles of
remodeling, showed a significant increase in the proportion of oblique fibers for both scenarios (Fig. 5e; p < 0.001
for CPO or CPO w/o Conc. Hyp. compared to Normotensive at all transmural sections). Concentric hypertro-
phy resulted in significantly smaller proportions of oblique fibers throughout the RVFW thickness (p < 0.001 for
CPO vs. CPO w/o Conc. Hyp at all transmural sections). Supplementary Fig. S5 demonstrates a representative
shift in fiber distributions with increased proportion of oblique fibers for each loading scenario.
Fibrosis (Fig. 6a) did not show any significant effects on RV fiber kinematics under end-diastolic (Fig. 6b;
6.6%, 6.6%, 6.6% and 6.6%, respectively for 1-, 1.5-, 2-, and 3-fold increase in collagen content) or early-systolic
pressures (Fig. 6c; 7.6%, 7.8%, 7.8% and 8%, respectively for 1-, 1.5-, 2-, and 3-fold increase in collagen content).
Discussion
In this work, we aimed to evaluate the stretch-induced fiber kinematics of RV myocardium under different
loading scenarios. The primary findings of this study were: (1) HFU imaging demonstrated a strong potential
for quantifying full-thickness transmural orientations of RV myofibers in large animal models; (2) Uniaxial
loading resulted in fiber realignment towards the loading direction, in agreement with theoretical predictions
based on affine fiber kinematics; (3) FE modeling suggested that a combination of chronic pressure overload
with RVFW fibrosis and concentric and eccentric hypertrophy (increased wall thickness and chamber dilation,
respectively), but not solely an acute rise in RV pressures, may result in kinematic shift of RV fibers away from
the circumferential direction; (4) Computational exploratory assessments revealed a potential protective role
for concentric hypertrophy against longitudinal fiber realignment in PH, while demonstrating that eccentric
hypertrophy may stimulate fiber reorientation towards the longitudinal direction.
HFU imaging effectively characterized the transmural orientation distribution (dominant orientation and
fiber spread) of myofibers in porcine RV myocardium (Fig. 2). Difficulties were observed in delineation of the
endocardial surface via HFU imaging, mainly due to the trabeculations at endocardium, as also reported in
previous studies59. This resulted in differences between the HFU and histologically measured fiber spreads at
endocardium, while dominant fiber orientations were accurately characterized (Fig. 2b). As previously reported
in porcine models of RV s tructure42, an abrupt change in fiber angles with high between-sample variability was
observed near the sub-epicardial layers. This was followed by a near-linear change in orientations towards the
endocardium (Fig. 2b). The observed transmural variation in fiber angles (epi → endo) in the basal anterior
zone (28.5 ± 9.8°) was smaller than previously reported values, potentially due to the body size and procurement
source of tissues used in this study (farmed animals with ≈ 80–120 kg body weight) compared to younger animals
used in previous work (≈ 5–20 kg body weight12,16). Decreased transmural variation in fiber orientations with
increased body size has also been reported in prior i nvestigations60.
As expected, uniaxial loading of RV myocardium resulted in realignment of fibers towards the loading direc-
tion with decreased transmural variation (Fig. 4). While not representing a physiological loading experienced by
the RVFW in vivo, uniaxial loading can provide fundamental insights into the kinematic response of RV fibers,
which remains poorly understood. Since fiber reorientation in PH happens over multiple cycles of growth and
remodeling8, as anticipated, we did not observe dramatic changes in fiber angles under a single cycle of pas-
sive uniaxial loading. However, RV myofibers demonstrated a strong agreement with theoretical predictions of
uniaxial affine kinematics (Fig. 4b, c), thus indicating affine assumptions can effectively approximate myofiber
realignment in the RVFW. To the best of our knowledge, this is the first report on quantitative HFU assessment
of full-thickness RV fiber kinematics.
FE simulations revealed the role of stretch-induced deformations on longitudinal kinematics of RV fibers in
PH. In an unloaded state, circumferential fibers dominated the fiber proportions in the RVFW. This is in general
agreement with previous studies on a porcine m odel16, indicating the basal anterior zone of RVFW as one of the
most circumferentially aligned regions. Small, but significant alterations in fiber proportions were noted after a
single cycle of loading under pressure overload conditions. The observed changes in fiber angles in the first cycle
of loading are in general agreement with previously reported v alues17 (Fig. 5a, b). As anticipated, normotensive
loading did not demonstrate any significant effects on the proportions of RV fibers (Fig. 5a, b). Even though an
acute pressure rise imposes the largest wall stresses on the RVFW (Table 3), surprisingly, this did not significantly
alter the proportion of RV fibers. This is potentially due to the importance of the ratio (and not just absolute
values) of the biomechanical stimuli (strain) in fiber reorientation22. While RV stresses are highest during APO,
this may not result in deformed configurations required for stimulating longitudinal fiber kinematics (Sup-
plementary Fig. S1). This is mainly a combined effect from hemodynamic pressures, RV geometry and RVFW
biomechanical properties in APO that lead to deformation states where ratio of longitudinal:circumferential
strains does not stimulate longitudinal fiber reorientation. In contrast, CPO with a combination of remodeling
events (Table 2; increased wall thickness, RV dilation, and fibrosis) significantly increased the proportion of
oblique fibers (Fig. 5), indicating fiber remodeling away from the circumferential direction. This is in agree-
ment with prior studies, identifying fiber realignment as an end-stage event in PH6,8. Elimination of increased
wall thickness from our FE models amplified fiber realignment towards the longitudinal direction (Fig. 5c, e).
This suggests a potential protective role for increased wall thickness against fiber reorientation in PH. Animal
models of PH without concentric h ypertrophy8 have demonstrated similar levels of fiber remodeling under sig-
nificantly lower RV pressures compared to those developing concentric h ypertrophy5,6. A potential explanation
Scientific Reports | (2021) 11:3587 | https://doi.org/10.1038/s41598-021-83154-8 11
Vol.:(0123456789)www.nature.com/scientificreports/
Figure 5. Effects of different loading scenarios on biaxial fiber kinematics of RV myocardium. (a) Effects ▸
of loading on end-diastolic fiber kinematics, indicating increased proportion of oblique fibers only for the
CPO scenario without concentric hypertrophy (single-cycle simulations). (b) Effects of loading on early-
systolic fiber kinematics, demonstrating elevated proportion of oblique fibers under both CPO scenarios with
amplified proportions for CPO without concentric hypertrophy (single-cycle simulations). (c) Multi-cycle
simulations of RV fiber reorientation towards the longitudinal direction (± 90°) under CPO and (d) CPO
without concentric RV hypertrophy. Error bars demonstrate fiber spread (standard deviation of the distribution
of fiber orientations) at each transmural section. (e) Proportion of oblique fibers for the normotensive scenario
compared to CPO with and without concentric hypertrophy. Fiber proportions for the CPO cases are plotted
following 4 cycles of remodeling simulations, while normotensive loading quits the remodeling algorithm
following the first cycle of loading. Both CPO scenarios result in significant increases in the proportion of
oblique fibers compared to normotensive loading at all transmural sections (epi to endocardium). Increased
wall thickness (CPO vs. CPO w/o Conc. Hyp.) decreases the rate of longitudinal realignment, indicating a
potential protective role for concentric hypertrophy against RV fiber reorientation in CPO. *, †, ‡ and Ұ indicate
p < 0.01 compared to UNL (unloaded), Norm (normotensive), APO (acute pressure overload) and CPO (chronic
pressure overload), respectively. Chi-squared tests followed by post-hoc z-tests with Bonferroni corrections.
RV right ventricle, Circ. circumferential, Long. longitudinal, UNL unloaded, Norm normotensive, APO acute
pressure overload, CPO chronic pressure overload, CPO w/o Conc. Hyp. chronic pressure overload without
concentric hypertrophy, Epi epicardium, Endo endocardium.
to be further explored in future studies is simultaneous reduction of RV wall stress and alterations in the ratio
of longitudinal:circumferential strains via increased wall thickness in PH.
Parametric studies on the level of RV fibrosis did not show any effects on fiber proportions under early-systolic
or end-diastolic pressures (Fig. 6). Between the three remodeling events studied here (increased wall thickness,
dilation, and fibrosis), this leaves RV dilation as a potential contributor to the kinematic shift of RV fibers towards
the longitudinal direction in PH. Previous experimental/computational studies have shown fiber realignment in
PH to be accompanied by progressive RV d ilation8,12. Growth and remodeling analysis of RV biomechanics in
PH revealed that longitudinal fiber realignment, accompanied by dilation, may result in impaired RV function
and reduced ejection fractions8. Our computational modeling results suggest another pathway for RV dilation
to modulate longitudinal fiber remodeling via altered RVFW wall stress and stretch ratios, in addition to the
previously addressed dilation-induced fiber kinematics due to volumetric growth8. A potential mechanism to
be investigated in future work is alteration in the biomechanical stimuli (ratio and magnitude of stress/strains)
in the myofiber niche due to progressive RV dilation. It is also worth noting that while our results demonstrate
that RV dilation may induce a “kinematic shift” in myofiber orientations, progression of a kinematic shift to
fiber realignment may require multiple cycles of RVFW growth and remodeling. Further long-term longitudi-
nal growth and remodeling studies, looking at the time course of progression of different remodeling events in
PH, can provide fundamental insights into the cause-consequence relations between myofiber realignment and
various RV remodeling events.
There are limitations to the experimental and FE modeling techniques used in the current work. HFU images
were acquired under uniaxial loading, as it is currently not feasible under biaxial loading due to the requirement
of imaging normal to the transmural axis (parallel to the RVFW) which necessitates at least one side of the RVFW
specimen to be free for imaging. Ongoing work focuses on development of improved algorithms using spatial
coherence maps to facilitate 3D imaging parallel to the RV transmural axis. While demonstrating strong statistics
and minimal variabilities, the small sample size (n = 3) used for our exploratory experimental analysis remains as
a limitation of the current study. Although our theoretical models provide insights into the stretch-induced fiber
kinematics of RV myocardium under biaxial loading, lack of an experimental control group is a limitation of the
current work and future experimental studies are needed to confirm the generated hypotheses via FE modeling.
Moreover, our study focused on analyzing myofiber kinematics in the basal anterior zone of the RVFW, mainly
due to the feasibility of acquiring theoretical wall stress approximations for this region (Eqs. 9–12). Future work
will explore the spatial heterogeneities in RV myofiber kinematics using improved HFU imaging algorithms,
coupled with 3D structurally-informed organ-level FE models for quantification of wall stress in other regions of
the RVFW. Furthermore, as described in Fig. 1, the deformed state of RVFW during early-systole (IVC) includes
a stretch-driven deformation in addition to a myofiber contraction mode. Our FE models did not include the
contraction mode (myofiber shortening), mainly due to the computational complexity of modeling contraction
on an RVE without representing the 3D RV geometry. However, systolic myofiber shortening has been shown to
result in deformations with ratio of longitudinal:circumferential strains close to 1 (ratio of global longitudinal to
circumferential strains ranging from 0.99 to 1.04 for normotensive subjects, as well as subjects with hypertrophic
or dilated cardiomyopathy61). Therefore, while this affects the magnitude of the strains calculated in our models,
it is less likely to affect the ratio of longitudinal:circumferential strains (mainly responsible for stimulating fiber
rotations; supplementary Fig. S1) in a way to obstruct the observed trends in longitudinal realignment of RV
fiber. Additionally, end-stage PH has been shown to reduce systolic myofiber s hortening18, which makes the
contraction mode less likely to mechanistically stimulate transmural fiber reorientation in PH. Our results only
explain a specific stretch-driven aspect of RV fiber realignment and future work will focus on development of
3D organ-level FE simulations to effectively model the fiber kinematics at early-systole considering both defor-
mation modes. Moreover, even though the underlying mechanisms of fiber reorientation in PH remains largely
unexplored, reorientation due to altered fiber kinematics and biomechanical stimuli in the myofiber niche8,21,22
is only one of the several potential mechanisms responsible for this remodeling event. Other mechanisms such
Scientific Reports | (2021) 11:3587 | https://doi.org/10.1038/s41598-021-83154-8 12
Vol:.(1234567890)www.nature.com/scientificreports/
Scientific Reports | (2021) 11:3587 | https://doi.org/10.1038/s41598-021-83154-8 13
Vol.:(0123456789)www.nature.com/scientificreports/
Figure 6. Effects of fibrosis on biaxial RV fiber kinematics under chronic pressure overload with concentric
and eccentric hypertrophy. (a) Parametric increase in RV collagen content. Red: Myofibers, Blue: Collagen. (b)
Effects of fibrosis on end-diastolic and (c) Early-systolic fiber kinematics. RV fibrosis did not demonstrate any
statistically significant alteration in fiber proportions at end-diastole or early-systole. Chi-squared tests. Circ
circumferential, RV right ventricle.
as degradation of circumferentially aligned fibers accompanied by sarcomerogenesis of longitudinal fibers (pref-
erential hypertrophy)8 need to be further investigated in future fiber-level studies.
In conclusion, we employed HFU imaging and structurally-informed computational models for an explora-
tory study on the stretch-induced kinematics of RV fibers under different loading scenarios. The developed
imaging framework provides a noninvasive modality to characterize the transmural fiber kinematics of RV
myocardium. Simulations suggest a potential protective role for concentric RV hypertrophy (increased wall
thickness) against fiber reorientation. On the other hand, accounting for eccentric hypertrophy (RV dilation) in
FE models resulted in kinematic shift of fibers towards the longitudinal direction, due to altered stretch ratios
in the RVFW. While this helps better understanding the role different remodeling events and biomechanical
forces in transmural realignment of RV fibers in PH, future experimentations are warranted to test the model-
generated hypotheses.
Data availability
The data generated/analyzed during this study are available from the corresponding author on reasonable request.
Scientific Reports | (2021) 11:3587 | https://doi.org/10.1038/s41598-021-83154-8 14
Vol:.(1234567890)www.nature.com/scientificreports/
Received: 8 June 2020; Accepted: 22 January 2021
References
1. Voelke, N. F., Natarajan, R., Drake, J. I. & Bogaard, H. J. Right ventricle in pulmonary hypertension. Compr. Physiol. 1, 525–540
(2011).
2. Benza, R. L., Park, M. H., Keogh, A. & Girgis, R. E. Management of pulmonary arterial hypertension with a focus on combination
therapies. J. Hear. Lung Transplant. 26, 437–446 (2007).
3. Humbert, M. et al. Survival in incident and prevalent cohorts of patients with pulmonary arterial hypertension. Eur. Respir. J. 36,
549–555 (2010).
4. Jang, S. et al. Biomechanical and hemodynamic measures of right ventricular diastolic function: translating tissue biomechanics
to clinical relevance. J. Am. Heart Assoc. 6, 1–10 (2017).
5. Sharifi Kia, D. et al. Angiotensin receptor-neprilysin inhibition attenuates right ventricular remodeling in pulmonary hypertension.
J. Am. Heart Assoc. 9, e015708 (2020).
6. Hill, M. R. et al. Structural and mechanical adaptations of right ventricle free wall myocardium to pressure overload. Ann. Biomed.
Eng. 42, 2451–2465 (2014).
7. Carruth, E. D., McCulloch, A. D. & Omens, J. H. Transmural gradients of myocardial structure and mechanics: implications for
fiber stress and strain in pressure overload. Prog. Biophys. Mol. Biol. 122, 215–226 (2016).
8. Avazmohammadi, R. et al. Interactions between structural remodeling and hypertrophy in the right ventricle in response to
pulmonary arterial hypertension. J. Biomech. Eng. 141, 0910161–0910213 (2019).
9. Gomez, A. D. et al. Right ventricular fiber structure as a compensatory mechanism in pressure overload: a computational study.
J. Biomech. Eng. 139, 0810041–0810110 (2017).
10. Sommer, G. et al. Biomechanical properties and microstructure of human ventricular myocardium. Acta Biomater. 24, 172–192
(2015).
11. Ferreira, P. F. et al. In vivo cardiovascular magnetic resonance diffusion tensor imaging shows evidence of abnormal myocardial
laminar orientations and mobility in hypertrophic cardiomyopathy. J. Cardiovasc. Magn. Reson. 16, 87 (2014).
12. Agger, P. et al. Changes in overall ventricular myocardial architecture in the setting of a porcine animal model of right ventricular
dilation. J. Cardiovasc. Magn. Reson. 19, 93 (2017).
13. Tsamis, A. et al. Active contraction of cardiac muscle: In vivo characterization of mechanical activation sequences in the beating
heart. J. Mech. Behav. Biomed. Mater. 4, 1167–1176 (2011).
14. Guntheroth, W. G. Changes in left ventricular wall thickness during the cardiac cycle. J. Appl. Physiol. 36, 308–312 (1974).
15. Streeter, D. D. & Hanna, W. T. Engineering mechanics for successive states in canine left ventricular myocardium. II. Fiber angle
and sarcomere length. Circ. Res. 33, 656–664 (1973).
16. Omann, C. et al. Resolving the natural myocardial remodelling brought upon by cardiac contraction; a porcine ex-vivo cardio-
vascular magnetic resonance study of the left and right ventricle. J. Cardiovasc. Magn. Reson. 21, 35 (2019).
17. Ashikaga, H., van der Spoel, T. I. G., Coppola, B. A. & Omens, J. H. Transmural myocardial mechanics during isovolumic contrac-
tion. JACC Cardiovasc. Imaging 2, 202–211 (2009).
18. Voeller, R. K. et al. Differential modulation of right ventricular strain and right atrial mechanics in mild vs. severe pressure overload.
Am. J. Physiol. Hear. Circ. Physiol. 301, H2362–H2371 (2011).
19. Bovendeerd, P. H. M. et al. Optimization of left ventricular muscle fiber orientation. In Solid mechanics and its applications (eds
Barber, J. R. & Klarbring, A.) 285–296 (Springer, Dordrecht, 1999). https://doi.org/10.1007/0-306-46939-1_25.
20. Kroon, W., Delhaas, T., Bovendeerd, P. & Arts, T. Computational analysis of the myocardial structure: adaptation of cardiac
myofiber orientations through deformation. Med. Image Anal. 13, 346–353 (2009).
21. Wilson, W., Driessen, N. J. B., van Donkelaar, C. C. & Ito, K. Prediction of collagen orientation in articular cartilage by a collagen
remodeling algorithm. Osteoarthr. Cartil. 14, 1196–1202 (2006).
22. Driessen, N. J. B., Cox, M. A. J., Bouten, C. V. C. & Baaijens, F. P. T. Remodelling of the angular collagen fiber distribution in
cardiovascular tissues. Biomech. Model. Mechanobiol. 7, 93–103 (2008).
23. Rouhana, S. et al. Early calcium handling imbalance in pressure overload-induced heart failure with nearly normal left ventricular
ejection fraction. Biochim. Biophys. Acta Mol. Basis Dis. 1865, 230–242 (2019).
24. Komuro, I. et al. Stretching cardiac myocytes stimulates protooncogene expression. J. Biol. Chem. 265, 3595–3598 (1990).
25. Izumo, S., Nadal-Ginard, B. & Mahdavi, V. Protooncogene induction and reprogramming of cardiac gene expression produced
by pressure overload. Proc. Natl. Acad. Sci. USA 85, 339–343 (1988).
26. Schupp, M., Bowry, R. & Tousignant, C. P. Right ventricular tissue doppler parameters in a patient with massive pulmonary
embolus. J. Am. Soc. Echocardiogr. 20(198), e6-198.e10 (2007).
27. Valdez-Jasso, D., Simon, M. A., Champion, H. C. & Sacks, M. S. A murine experimental model for the mechanical behaviour of
viable right-ventricular myocardium. J. Physiol. 590, 4571–4584 (2012).
28. Avazmohammadi, R., Hill, M. R., Simon, M. A., Zhang, W. & Sacks, M. S. A novel constitutive model for passive right ventricular
myocardium: evidence for myofiber–collagen fiber mechanical coupling. Biomech. Model. Mechanobiol. 16, 561–581 (2017).
29. De Jong, A. M. et al. Mechanisms of atrial structural changes caused by stretch occurring before and during early atrial fibrillation.
Cardiovasc. Res. 89, 754–765 (2011).
30. Yoshigi, M., Clark, E. B. & Yost, H. J. Quantification of stretch-induced cytoskeletal remodeling in vascular endothelial cells by
image processing. Cytometry 55A, 109–118 (2003).
31. Nguyen, T. D. et al. Effects of cell seeding and cyclic stretch on the fiber remodeling in an extracellular matrix-derived bioscaffold.
Tissue Eng. A 15, 957–963 (2009).
32. Hoffman, L. M., Jensen, C. C., Chaturvedi, A., Yoshigi, M. & Beckerle, M. C. Stretch-induced actin remodeling requires targeting
of zyxin to stress fibers and recruitment of actin regulators. Mol. Biol. Cell 23, 1846–1859 (2012).
33. Guerreiro, D., Lennox, S. C. & Anderson, R. H. Experimental ventricular hypertrophy in growing pigs. Int. J. Cardiol. 21, 311–322
(1988).
34. Tezuka, F., Hart, W., Lange, P. E. & Nürnberg, J. H. Muscle fiber orientation in the development and regression of right ventricular
hypertrophy in pigs. Pathol. Int. 40, 402–407 (1990).
35. Qin, X. et al. Extracting cardiac myofiber orientations from high frequency ultrasound images. In Medical Imaging 2013: Ultrasonic
Imaging, Tomography, and Therapy8675 (eds Bosch, J. G. & Doyley, M. M.) 867507 (Springer, Bellingham, 2013).
36. Qin, X. & Fei, B. Measuring myofiber orientations from high-frequency ultrasound images using multiscale decompositions. Phys.
Med. Biol. 59, 3907–3924 (2014).
37. Perona, P. & Malik, J. Scale-space and edge detection using anisotropic diffusion. IEEE Trans. Pattern Anal. Mach. Intell. 12, 629–639
(1990).
38. Weickert, J. Coherence-enhancing diffusion filtering. Int. J. Comput. Vis. 31, 111–127 (1999).
39. Thunes, J. R. et al. A structural finite element model for lamellar unit of aortic media indicates heterogeneous stress field after
collagen recruitment. J. Biomech. 49, 1562–1569 (2016).
Scientific Reports | (2021) 11:3587 | https://doi.org/10.1038/s41598-021-83154-8 15
Vol.:(0123456789)You can also read