Neoptile feathers contribute to outline concealment of precocial chicks - Nature
←
→
Page content transcription
If your browser does not render page correctly, please read the page content below

www.nature.com/scientificreports
OPEN Neoptile feathers contribute
to outline concealment of precocial
chicks
Veronika A. Rohr1,2*, Tamara Volkmer3, Dirk Metzler2 & Clemens Küpper1*
Camouflage is a widespread strategy to increase survival. The cryptic plumage colouration of precocial
chicks improves camouflage often through disruptive colouration. Here, we examine whether and
how fringed neoptile feathers conceal the outline of chicks. We first conducted a digital experiment
to test two potential mechanisms for outline concealment through appendages: (1) reduction of
edge intensity and (2) luminance transition. Local Edge Intensity Analysis showed that appendages
decreased edge intensity whereas a mean luminance comparison revealed that the appendages
created an intermediate transition zone to conceal the object’s outline. For edge intensity, the outline
diffusion was strongest for a vision system with low spatial acuity, which is characteristic of many
mammalian chick predators. We then analysed photographs of young snowy plover (Charadrius
nivosus) chicks to examine whether feathers increase outline concealment in a natural setting.
Consistent with better camouflage, the outline of digitally cropped chicks with protruding feathers
showed lower edge intensities than the outline of chicks without those feathers. However, the
observed mean luminance changes did not indicate better concealment. Taken together, our results
suggest that thin skin appendages such as neoptile feathers improve camouflage. As skin appendages
are widespread, this mechanism may apply to many organisms.
Avoiding detection either for protection from predators or to go unnoticed by potential prey is essential for
individual survival. The threat of predation has led to the evolution of various camouflage mechanisms, which
make potential prey more difficult to detect or recognize. The most prominent mechanism is visual camouflage
that includes highly adaptive colouration strategies among a nimals1. One strategy to achieve visual camouflage
is background matching (also termed “crypsis” 2). For background matching, animals try to match colour, lumi-
nance and pattern of their background.
While background matching is one of the most common and frequently studied strategies of visual
camouflage2–6, another important mechanism is concealing the outline of the body. Thayer7 proposed that detect-
ing the outline of their prey is one of the ways predators locate and identify their prey. In general, the detection
of edges is an essential task for object recognition8,9. In this regard, disruptive colouration makes animals less
detectable. It involves a set of markings that creates false edges within the animal hindering the detection or
recognition of its true outline and shape or parts of it1,4,7. Cott4 suggested that structural modifications of the
organism’s outline themselves could contribute to camouflage by creating an ‘irregular marginal form’. This makes
the animal’s true body outline effectively diffused and hence makes it harder to detect4. Recently, support for
the ‘irregular form’ hypothesis was found in an experimental study showing that false holes markings reduce
avian predations10.
Birds with their typically advanced vision and high plumage diversity have been featured prominently in
camouflage research, either as predators or as prey5,6,10–14. When studying camouflage as an anti-predator defence
in birds, much research has examined the clutches/eggs of ground-nesting birds6,15–17. These studies revealed
that ground-nesting birds may increase background matching through adaptive egg colouration that matches
the nest s ite6,13 and some species even improve the background matching of their clutches, by soiling their eggs
to conceal them better18, using egg-matching nest materials19 or covering the clutch with debris or soil when
predators approach20.
However, not only eggs are vulnerable to predation. Chicks are also often targeted by predators. Precocial
chicks leave their nest within a few hours of hatching. Initially, those chicks suffer from high mortality as they
1
Research Group for Behavioural Genetics and Evolutionary Ecology, Max Planck Institute for Ornithology,
Seewiesen, Germany. 2Division of Evolutionary Biology, Faculty of Biology, Ludwig-Maximilians-Universität
München, Planegg‑Martinsried, Germany. 3Department of Migration, Max Planck Institute of Animal Behavior,
Radolfzell, Germany. *email: vrohr@orn.mpg.de; ckuepper@orn.mpg.de
Scientific Reports | (2021) 11:5483 | https://doi.org/10.1038/s41598-021-84227-4 1
Vol.:(0123456789)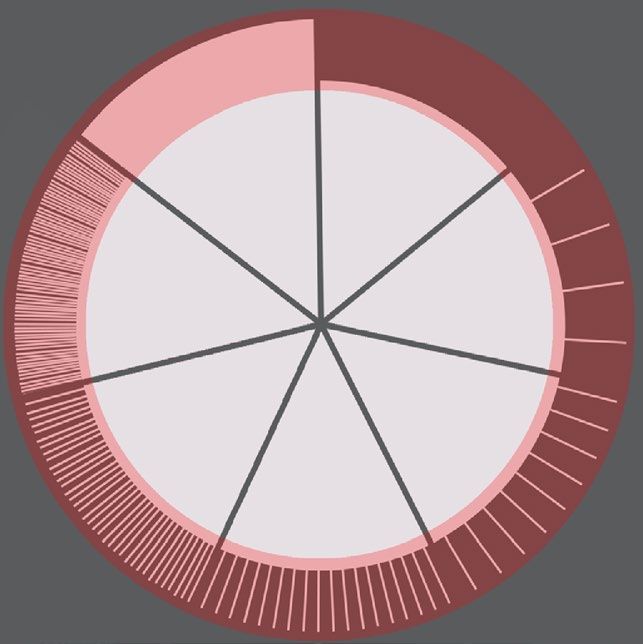
www.nature.com/scientificreports/
are limited in their mobility and hence highly vulnerable to predation21–23. To improve their survival, chicks rely
on camouflage provided by their feathers especially during the first days of their lives. The plumage coloura-
tion of precocial chicks featured prominently in the description of camouflage mechanisms such as disruptive
colouration4,7,24. However, we know surprisingly little about plumage characteristics that improve camouflage in
chicks, which represents an important gap in our knowledge. Precocial chicks hatch fully covered with neoptile
down feathers25. With maturation, the neoptile feathers are shed, and the natal plumage is replaced by the teleop-
tile feathers, which can be categorised into, e.g. flight, contour and down feathers26. One striking feature of neop-
tile feathers is that they are protruding from the chick’s body. The unequal length of the very thin feathers creates
a fringed feather region that may conceal the chick outline and hence make it harder to detect by predators.
In this study, we investigated whether neoptile down feathers improve camouflage through outline diffusion.
Cott4 discussed this strategy of an ‘irregular marginal form’ mainly with examples of masquerade, where the
irregular shapes of animals resemble elements of their environment, e.g. parts of plants. In contrast, we hypoth-
esized that the fringed feathery outline helps the chick to better blend with the background by reducing edge
contrasts and/or creating a transition zone of intermediate luminance.
In a first experiment, we explored the mechanism of outline diffusion by appendages in principle modelling
a circular object with varying protruding appendages. We then used the Local Edge Intensity Analysis (LEIA)27
on the created images to investigate whether appendages decreased the edge contrast of the object’s outline.
Additionally, we investigated how appendage characteristics such as their density, thickness, transparency, and
variation in background complexity and spatial acuity of the predator’s visual system affected edge intensity in
the contour region. With the Mean Luminance Comparison (MLC), we tested whether appendages altered the
luminance of a narrow ‘transition zone’ between object and background as a second mechanism. We hypothesized
that an intermediate mean luminance in the transition zone that reduces the contrast would help to blend the
object better with the background.
In a second experiment, we tested whether the neoptile feathers contribute to the camouflage of precocial
chicks hiding from an approaching human. For this, we analysed images taken from precocial snowy plover
(Charadrius nivosus) chicks in natural habitats. Very young plover chicks rely on their crypsis to evade predation
as they stay motionless on the ground when a threat is approaching21. We digitally cropped all chicks once with
and once without protruding feathers and transferred them on to images of their hiding background taken after
gently removing the chicks. For chicks cropped with their protruding feathers, we predicted the edge intensity
of the chick outline to be reduced and the mean luminance difference of the transitions zone to be closer to
intermediate optimum than for the images of those chicks cropped without their feathers.
Results
Experiment 1: artificial object. All created images of the modelled artificial object in all scenarios showed
multimodal density distributions of pixels’ edge intensities (Fig. 1a). Pixels showing the highest edge intensities
were found at the object outline. These high edge intensity pixels (HEI pixels) showed prominent modal peaks
in all multimodal density distributions (Fig. 1a). For the object without appendages, 1.59% corresponded to
pixels that made up a distinct modal area with a mean edge intensity of 2.7 (Fig. 1a, ‘0’). Consequently, we used
a threshold of 1.59% to define HEI pixels for all images hereafter. Adding appendages reduced the mean edge
intensities of the HEI pixels with the lowest mean edge intensity reached in the image with an intermediate
number of 256 appendages (Fig. 1a,b).
Appendage characteristics. Increasing appendage thickness (Scenario 1) resulted in overall higher mean
edge intensities suggesting higher detectability than in the basic scenario. With thicker appendages, the lowest
mean edge intensity of the HEI pixels was reached already with 128 appendages. Images with more than 128
appendages had higher mean edge intensity values implying a deterioration of camouflage (Fig. 1b). Increas-
ing appendage transparency (Scenario 2) yielded overall slightly higher mean edge intensities than observed
in the basic scenario. The lowest mean edge intensities were reached with more appendages than in the basic
scenario (Fig. 1c) with the minimum mean edge intensity shown for 512 appendages at 25% transparency and
the full circle of appendages at 50% transparency (Fig. 1c). Increasing appendage length heterogeneity (Scenario
3) yielded the same low mean edge intensity values as the basic scenario (Fig. 1d). However, more appendages
were required to reach minimal mean edge intensity values than in the basic scenario. The minimum mean edge
intensity was reached with 512 appendages when half of the appendages had 50% of the length or with the full
circle when half of the appendages had 25% and a quarter had 50% of the length (Fig. 1d).
Background complexity and spatial acuity. Introducing background complexity (Scenario 4) resulted in
similar mean edge intensities of the HEI pixels for 256 appendages as in the basic scenario for large squares. The
region of interest (ROI) on the background with small squares showed slightly higher mean edge intensities for the
HEI pixels than for the background with large squares. More appendages did not lead to such a pronounced increase
of mean edge intensities as in the basic scenario (Fig. 1e). Lowering the spatial acuity of the perceiver (Scenario 5)
decreased the mean edge intensity severely. At a spatial acuity of 10 cpd, the minimum mean edge intensity of the
HEI pixels in the image with 256 appendages was only half of the value obtained in the basic scenario (Fig. 1f).
ROI size. The main analysis focussed on the contour region as the ROI. It contains the area covered by the
appendages and a small part of the adjacent background and object inside. Changing the ROI size and examin-
ing a larger part of background and object (Supplementary Fig. S2) produced qualitatively similar results except
for variation in background complexity (Scenario 4). In that scenario, the number of appendages had no influ-
ence on the mean edge intensity of the HEI pixels (Supplementary Fig. S2) for the enlarged ROI.
Scientific Reports | (2021) 11:5483 | https://doi.org/10.1038/s41598-021-84227-4 2
Vol:.(1234567890)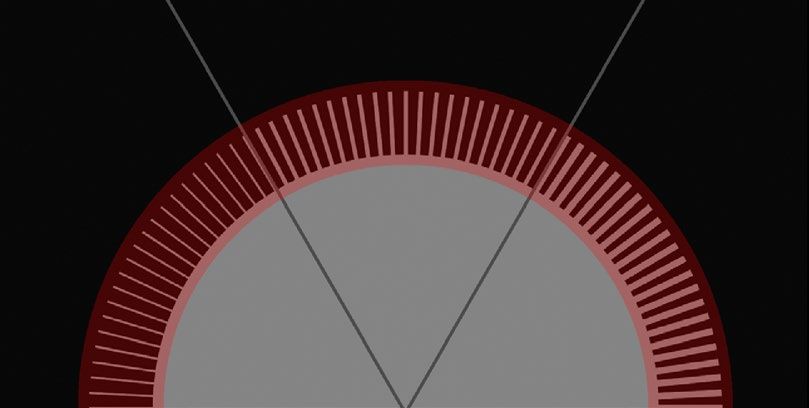
www.nature.com/scientificreports/
(a) (b)
3
Density estimation for each # appendages
full circle
Mean edge intensity of HEI−pixels
512
2
256
HEI−pixels
128
1
64 Appendage thickness
1 Pt − Basic scenario
32 2 Pt
3 Pt
0
0
0.0001 1 2 3 0 32 64 128 256 512 full circle
Edge Intensity Number of appendages
(c) (d)
3 3
Mean edge intensity of HEI−pixels
Mean edge intensity of HEI−pixels
2 2
1 1
Appendage transparency Appendage length heterogeneity
0 % − Basic scenario all 100 % length − Basic scenario
25 % 1/2 at 50 % length
50 % 1/2 at 25 % & 1/4 at 50% length
0 0
0 32 64 128 256 512 full circle 0 32 64 128 256 512 full circle
Number of appendages Number of appendages
(e) (f)
3 3
Mean edge intensity of HEI−pixels
Mean edge intensity of HEI−pixels
2 2
1 1
Background Spatial acuity
Uniformly dark − Basic scenario 72 cpd − Basic scenario
Big squares 30 cpd
Small squares 10 cpd
0 0
0 32 64 128 256 512 full circle 0 32 64 128 256 512 full circle
Number of appendages Number of appendages
Figure 1. Local edge intensity analysis (LEIA) of the contour region in the artificial object experiment. (a)
Ridgeline plots showing the density distribution of the edge intensity according to number of appendages. The
highest 1.59% of the pixels are shaded in grey (high edge intensity pixels, HEI pixels). (b) Scenario 1: variation
in appendage thickness. (c) Scenario 2: variation in appendage transparency. (d) Scenario 3: variation in
appendage length. (e) Scenario 4: variation in background complexity. (f) Scenario 5: variation in spatial acuity.
Scientific Reports | (2021) 11:5483 | https://doi.org/10.1038/s41598-021-84227-4 3
Vol.:(0123456789)
www.nature.com/scientificreports/
Figure 2. (a) A snowy plover chick hiding on the ground from an approaching predator, (b) cropped chick
transferred to image of empty natural background with neoptile contour feathers protruding the outline,
(c) cropped chick transferred without protruding neoptile contour feathers. The contour region (red) as the
region of interest was analysed in the Local Edge Intensity Analysis (LEIA). Areas, where the background was
shaded by the chick in the original image (blue), were excluded from the analysis. (d) Mean edge intensity of
the HEI pixels in the contour region with and without feathers for 15 snowy plover chicks (t = 5.289, df = 14,
p-value < 0.001). Measurements are paired by chick ID. The error bars indicate group mean ± standard error. The
figure was produced using R 28 Adobe Photoshop29and InDesign30.
Mean luminance comparison. The mean luminance of the area covered by appendages (appendage
region) was generally intermediate between the luminance of object and background across all scenarios indi-
cating the formation of a luminance transition zone (Supplementary Fig. S3). For the basic scenario, the optimal
intermediate luminance would have been reached for objects that have between 256 and 512 appendages, when
50% of the appendage region were covered by appendages. With increased appendage thickness, the appendage
region reached the optimum with fewer appendages. With increased appendage transparency and length het-
erogeneity, more appendages were needed to reach the optimum. Background complexity and spatial acuity did
not affect the mean luminance of the appendage region.
Experiment 2: chick photographs. Based on sun position, the chicks shaded the background in a part
of the contour region. Therefore, we excluded shaded areas from the analysis, which caused a reduction of the
ROIs. On average, we were able to analyse on average 72% of the chick’s contour region with LEIA. Across the
ROIs of the 15 chicks, the mean threshold for the HEI pixels was 0.9826 (Supplementary Table S3). Conse-
quently, we compared on average 1.74% of the pixels between photographs of cropped chicks with and without
the protruding neoptile feathers.
For 14 of 15 chicks (93.3%), the mean edge intensities of HEI pixels were lower for the cropped image of each
chick with protruding neoptile feathers than for the corresponding images without protruding neoptile feathers
(Fig. 2b–d). Accordingly, images including the protruding feathers showed lower mean edge intensities of HEI
pixels than those excluding them (Fig. 2d, paired t-test: t = 5.289, df = 14, p-value < 0.001). The mean edge inten-
sity difference of HEI pixels between measurements with and without feathers was 0.192 (95%CI: 0.114, 0.270).
For the MLC, presence of protruding neoptile feathers did not contribute to creating a transition zone between
chick and background, as we did not observe more intermediate mean luminance values in the ROI in compari-
son to ROI of chick pictures without protruding feathers (Supplementary material, Fig. S4).
Discussion
The plumage of newly hatched chicks has several known functions. First, the feathers are important for
thermoregulation31. Second, plumage colour variation is also an important signal that may reveal chick condi-
tion and facilitate individual recognition for parents24,32,33. Third, in precocial chicks, the plumage provides
camouflage through cryptic c olouration4,24. Here we tested whether neoptile feathers help to conceal the outline
of chicks to make them harder to detect for predators. Our results from a proof of principle analysis (experiment
1) and analysis of real chick images in their natural environment (experiment 2) suggest that appendages, such
as protruding neoptile feathers, improve concealment of the object outline, particularly by decreasing the edge
intensity. Weak contrast edges are associated with low conspicuousness34. This enhances diffusion of the outline
and decreases detectability as the shape is an important cue for predators locating and identifying a prey i tem7.
In the artificial setup (experiment 1), appendages both reduced edge intensity and created a transition zone
with an intermediate mean luminance in the appendage region suggesting that both mechanisms help to conceal
the object outline. However, when analysing the impact of neoptile feathers on outline concealment of chicks in
Scientific Reports | (2021) 11:5483 | https://doi.org/10.1038/s41598-021-84227-4 4
Vol:.(1234567890)
www.nature.com/scientificreports/
their natural background (experiment 2), we found that the presence/absence of protruding feathers did only
change edge intensity but not mean luminance of the ROI in the predicted way. ROIs on images where the chick
was cropped including its protruding feathers had lower edge intensity but no consistent change in the interme-
diate luminance was found. This suggests that the lowering of edge intensity is a better mechanism for outline
diffusion than creating a transition zone with intermediate luminance for concealing the outline of precocial
chicks. However, the MLC may be methodologically problematic for these pictures. Measuring mean luminance
across the ROI may not capture the outline diffusion when both object and background are not monochromatic
coloured but consist of a mottled pattern, which is frequently the case for natural habitats.
Altering the characteristics of appendages, background and predator vision had mechanism-specific con-
sequences. As we concluded that reduction of edge intensity is the more likely mechanism, we restrict our
discussion here to the impact of parameter changes on edge intensity. In the artificial setup, we found that an
intermediate number of regular appendages helped to conceal the outline of the monochromatic object best.
Further, we found that appendage thickness, transparency and length heterogeneity influenced outline conceal-
ment. They altered the optimal number of appendages needed and, in some cases, changed also the edge intensity.
Protruding neoptile feathers of precocial chicks are thin, somewhat transparent and vary in the extent to which
they stand out from the outline. Our results show that thicker appendages would lead overall to higher detect-
ability and in that case, fewer appendages would lead to better concealment. In contrast, higher transparency
required more appendages for best concealment. Similarly, we found that with increasing length heterogeneity
more appendages were needed to achieve low edge intensities and reduce detectability. The discrepancy between
optimal characteristics for outline concealment and the true feather characteristics observed in snowy plover
chicks might be partly explained by the multiple functions that feathers provide, as they also are important in
thermoregulation and provide colouration for the cryptic chick plumage.
Variation in spatial acuity is high across visual systems of different predators and had the largest effect on
edge intensity. Intermediate to high appendage numbers reduced the edge intensity of the ROI most, regardless
of spatial acuity of the simulated predator. Yet, mean edge intensities were highest for the simulated system with
the highest spatial acuity. From the same viewing distance, predators with high spatial acuity, such as humans or
birds of prey, perceive a lot more details of an object compared to predators with a lower spatial acuity such as
canids or corvids35. As spatial acuity decreases with viewing distance36, mammalian predators need to approach
feathered chicks closer to detect their outline.
Interestingly, background complexity did not alter the optimal number of appendages nor impact overall edge
intensities dramatically. Background complexity often makes detection of objects harder and therefore contrib-
utes to c amouflage37,38. The multicoloured fringed feathers themselves could contribute to increasing complexity.
Such an effect would have the largest impact on a more uniform background. The mixture of appendages and
background will also create new false edges and increase disruptive c olouration39. Nevertheless, any such effects
by protruding feathers are likely to be small as the feather region is only very narrow and, hence, will only impact
the immediate surrounding of the chick. Hence it is still unclear whether the effects that we detected are biologi-
cally relevant for detection through predators.
One drawback of our study is that we did not test empirically whether the appendages indeed reduce detect-
ability by predators, e.g. through a predation experiment (e.g. similar t o5,11). Measuring the detection time of
objects with and without appendages similar to protruding neoptile feathers would be an important test for the
relevance of this mechanism in nature. Concealing the outline is unlikely to be the main antipredator strategy
of chicks. We rather suggest that it works in concert with the cryptic colouration of the downy plumage, chick
behaviour such as finding optimal hiding places and predator distraction or defence through their parents. Yet
our results regarding the spatial acuity suggest that the fringed feathers could be an important component of a
visual antipredator strategy against mammalian predators. Even if the reduction in detectability is only small,
concealing the outline may enhance survival of precocial chicks during early life when chicks face a very high
predation risk21–23, especially as the costs for having the protruding feathers may not be high.
Appendages that alter the outline are commonly found in nature. Examples of vertebrates with irregular
outlines are known, e.g. from c ephalopods40, fish3, amphibians41 and reptiles42. A striking example is provided
by many insect larvae such as hairy caterpillars which, similar to small chicks, have typically reduced mobility
in comparison with the adult form. Birds have a strong influence on caterpillar m ortality43 and hairy caterpil-
lars are less preferred prey for avian predators than non-hairy c aterpillars44. Concealing the outline might be
one currently underappreciated function of hairy appendages although further research is required to establish
firmly that hairy appendages improve camouflage.
Conclusion
The ‘irregular marginal form’ as a camouflage strategy has inspired early researchers on camouflage4 but evi-
dence for this mechanism so far has been limited. Our results suggest that body appendages such as feathers or
hairs can help to create an ‘irregular marginal form’ that serves to diffuse the object outline. Appendages with
the characteristics of protruding neoptile feathers reduced the edge intensity in a proof of principle analysis
and on images of precocial chicks taken in their natural environment. Appendages also served to reduce mean
luminance differences when both object and background were uniformly coloured but this mechanism failed
to contribute to outline diffusion when we analysed images of chicks in their natural backgrounds. Improved
camouflage through outline diffusion could be an important function of heterogenous integuments which are
found in a variety of organisms.
Scientific Reports | (2021) 11:5483 | https://doi.org/10.1038/s41598-021-84227-4 5
Vol.:(0123456789)
www.nature.com/scientificreports/
(a) Basic (b) Thickness
scenario
Full 0
circle
1a
512 32
Basic 1b
256 64
128
The ROI (i.e., contour region) highlighted in
red was analysed in the LEIA.
(c) Transparency (d) Length heterogeneity
2a 3a
Basic 2b Basic 3b
(e) Background complexity (f) Spatial acuity
5a
4a 4b Basic 5b
Figure 3. (a) Basic Scenario: Seven stages of the artificial chick setup with varying number of thin, non-
transparent appendages having all the same length. (b) Scenario 1: varying appendage thickness applied to
the Basic Scenario. (c) Scenario 2: varying appendage transparency applied to the Basic Scenario. (d) Scenario
3: varying appendage length heterogeneity applied to the Basic Scenario. (e) Scenario 4: varying background
complexity with chessboard backgrounds. (f) Scenario 5: high, medium and low spatial acuity applied to the
Basic Scenario. (a–f) The analysed region of interest (ROI) is highlighted in red for clarification only. The figure
was produced in Adobe P hotoshop29 and InDesign30.
Material and methods
Experiment 1: proof of principle. As a proof of principle, we designed the first experiment to test
whether appendages may help to conceal the outline. We created an image of a uniformly light grey coloured
circular object with a size of 2950 pixels (px)/250.0 mm circumference and 470 px/39.8 mm radius on a dark
grey background using Adobe InDesign CS6 version 8.030. The initial setup started with no appendages added
to the outline (Fig. 3a, ‘0’). We then added object-coloured appendages (i.e. lines of 1 Pt/4 px/0.4 mm thickness
and 118 px/10.0 mm length) with regular intervals resembling protruding neoptile chick feathers orthogonally
to the object outline (‘Basic Scenario’, Fig. 3a). The first image with appendages had 32 appendages added to the
outline (Fig. 3a, ‘32′). We then doubled the number of appendages stepwise creating denser spaced appendages
to the outline until the extended outline was completely filled (Fig. 3a, ‘full circle’). For the vision of a simulated
predator, we used the spatial acuity from humans (Homo sapiens, 72 cycles per degree, cpd)36,45,46 in the basic
scenario. The full details for the parameters are provided in Supplementary Table S1 (a–g).
To further explore the mechanism, we altered appendage characteristics, background and the spatial acuity
of the predator. First, we increased appendage thickness to 2 Pt/8 pixels/ 0.7 mm (Scenario 1a) and 3 Pt/12 pix-
els/1.1 mm (Scenario 1b) resulting in decreased inter-appendage intervals (Fig. 3b and Supplementary Table S1,
h–u). Second, we changed appendage transparency to 25% (Scenario 2a) and 50% transparency (Scenario 2b)
(Fig. 3c and Supplementary Table S1, v to ai). Third, we varied the appendage length heterogeneity; half of the
appendages having 50% of the length (Scenario 3a), and half of the appendages at 25% and one quarter at 50%
of the original appendage length (Scenario 3b) (Fig. 3d and Supplementary Table S1, aj to aw). Fourth, we inves-
tigated the effect of background complexity on the detectability of the outline. As background, we used a chess-
board pattern with large squares (346 pixels/29.3 mm, Scenario 4a) and with small squares (86 pixels/7.3 mm,
Scientific Reports | (2021) 11:5483 | https://doi.org/10.1038/s41598-021-84227-4 6
Vol:.(1234567890)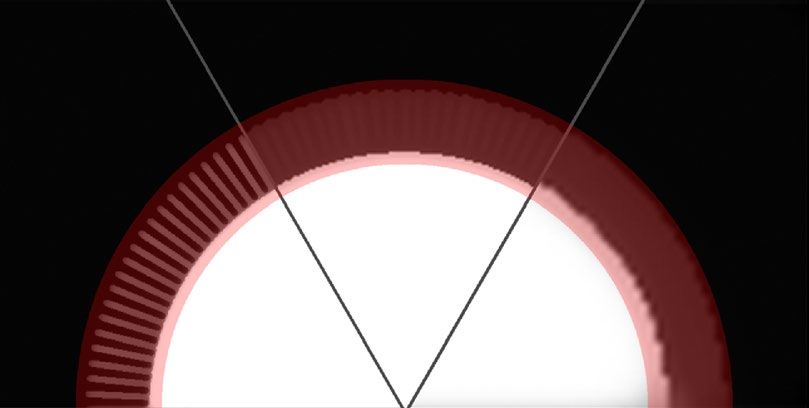
www.nature.com/scientificreports/
Scenario 4b) (Fig. 3e and Supplementary Table S1, ax to bk). Fifth, we altered the spatial acuity to test whether
or how the visual systems of different predators would affect detectability. We simulated the spatial acuity of
a corvid predator (30 cpd, Scenario 5a) and canid predator (10 cpd, Scenario 5b) (Fig. 3f and Supplementary
Table S1, bl to by), the two most common predators of ground-nesting p lovers16,47,48. This range also covered
other potential predators (Supplementary Table S2).
We did not account for differences in colour vision between different predators as the setup mostly consists
of greyscale images that predominantly differ in luminance. Note that in many animals, visual acuity is greater
for achromatic than chromatic s timuli34,49.
We conducted visual modelling and visual analysis using the Quantitative Colour Pattern Analysis (QCPA)
framework27 integrated into the Multispectral Image Analysis and Calibration (MICA) t oolbox50 for ImageJ
version 1.52a51. We converted the generated images into multispectral images containing the red, green and blue
channel in a stack and transformed them further into 32-bits/channel cone-catch images based on the human
visual system, which are required by the framework. To create the luminance channel, we averaged the long and
medium wave channel, which is thought to be representative of human vision52. We modelled the spatial acuity
with Gaussian Acuity Control at a viewing distance of 1300 mm and a minimum resolvable angle (MRA) of
0.01389. To increase biological accuracy, we applied a Receptor Noise Limited (RNL) filter that reduces noise
and reconstructs edges in the image. The RNL filter used the Weber fractions “Human 0.05” provided by the
framework (longwave 0.05, mediumwave 0.07071, shortwave 0.1657), luminance 0.1, 5 iterations, a radius of
5 pixels and a falloff of 3 pixels as specified in van den Berg et al.27 (Supplementary Fig. S1).
To test for the detectability of the outline, we used L EIA27, which is conceptually similar to the boundary
34
strength analysis . Boundary strength analysis requires an image with clearly delineated (clustered) colour and
luminance pattern elements. However, a large degree of subthreshold details, which may be still perceived by
the viewer gets lost in the clustering process. LEIA has the advantage of not requiring such a clustered input and
therefore can be directly applied to RNL filtered images. LEIA measures the edge intensity (i.e. the luminance
contrast) locally at each position in the image. The output image displays ΔS values in a 32-bit stack of four slices,
where each slice shows the values measured in different angles (horizontal, vertical and the two diagonals, for
more details, see van den Berg et al.27).
We ran LEIA on the chosen region of interest (ROI) with the same Weber fractions used for the RNL filter.
The ROI was a 180 pixel-wide band that included the area of the appendages extended by 30 pixels towards the
object inside and towards the outside (Fig. 3a). We log-transformed the ΔS values as recommended for natural
scenes53 to make the results comparable to the natural background images used in Experiment 2 (see below). To
test whether the size of the ROI affected our results, we ran an additional analysis using a 1500 × 1500 pixel-wide
rectangle surrounding the object as the ROI, which included a bigger area of the background and the full object
inside (Supplementary Fig. S2).
We extracted the luminance ΔS values from the four slices of the output image stack in ImageJ and stored
them in separate matrices for further analysis using R version 3.5.328. ImageJ generally assigned values outside
the chosen ROI to zero. Thus, we first discarded all values of zero. We then set all negative values that arose as
artefacts in areas without any edges to zero, in order to make them biologically meaningful. We then identified
the parallel maximum (R function pmax ()) of the four interrelated direction matrices and transferred this value
to a new matrix.
High luminance and colour contrasts imply high c onspicuousness34. Consequently, a lower luminance con-
trast leads to lower conspicuousness and therefore, better camouflage. As the outline is an important cue for
predators locating and identifying a prey item7, we assumed that especially low contrasts in the outline of an
object improve camouflage. Thus, a reduction of edge intensity in the object outline by the appendages indi-
cates a camouflage improvement. To test whether the object outline became less detectable we compared the
edge intensity of the outline pixels in the basic scenario without appendages (Supplementary Table S1, a) with
corresponding pixels from other scenarios. The outline pixels were characterised by high edge intensity and
constituted a prominent peak. They comprised 1.59% of all pixels in the analysis focused on the contour region
(see “Results”, Fig. 1a). For all scenarios, we calculated the mean edge intensity of the high edge intensity pixels
(HEI pixels) and identified the changes with parameter variation. Unless otherwise stated we used R 28 to produce
graphs and panels.
As an alternative mechanism, we tested whether appendages create a transition zone with intermediate
luminance around the object (Mean Luminance Comparison (MLC), Supplementary material). We calculated
the mean luminance of the object inside up to the border (object region), the area covered by appendages
(appendage region) and the background (background region). We predicted that the appendage region would
be characterised by intermediate luminance between object and background and therefore provide a luminance
transition zone to conceal the object outline.
Experiment 2: chick photographs. Using pictures of young snowy plover chicks hiding when approached
by a simulated predator, we tested if protruding neoptile feathers helped to conceal the chicks’ outline and there-
fore improve their camouflage.
We studied snowy plovers in their natural environment at Bahía de Ceuta, Sinaloa, Mexico. Fieldwork per-
mits were granted by the Secretaría de Medio Ambiente y Recursos Naturales (SEMARNAT). All field activities
were performed in accordance with the approved ethical guidelines outlined by SEMARNAT. The breeding site
consists of salt flats that are sparsely vegetated and surrounded by mangroves54. The predators of chicks are not
well described but likely similar to the egg predator community that includes several mammalian predators such
as racoon, opossum, coyote, bob cat, avian predators such as crested caracara Caracara cheriway and reptiles17.
General field methodology is provided e lsewhere55,56. In 2017, we took photographs of young (one to 3 days
Scientific Reports | (2021) 11:5483 | https://doi.org/10.1038/s41598-021-84227-4 7
Vol.:(0123456789)www.nature.com/scientificreports/
old) chicks hiding on the ground, that had already left the nest scrape. To photograph the chicks, two observers
approached free-roaming families with two mobile hides within the period one hour after sunrise and one hour
before sunset. At a distance of 100–200 m, one observer acted as ‘predator’, left the hide and openly approached
the brood while the second observer kept watching the chicks. The chicks responded by crouching to the ground
and staying motionless while the parents were alarming. The second observer directed the ‘predator’ to the
approximate hiding place. When searching for the chicks, we took great care to reduce the number of steps to
avoid modification of the ground through our tracks.
Once the first chick had been found, the second observer joined the ‘predator’ and took the chick photographs.
We used a Nikon D7000 camera converted to full spectrum including the UV range (Optic Makario GmbH,
Germany) and a Nikkor macro 105 mm lens that allows transmission of light at low wavebands. The equipment
was chosen because calibration data were available for this combination50. Each hiding background was pho-
tographed with and without the chick using a UV pass filter for the UV spectrum and a UV/IR blocking filter
(“IR-Neutralisationsfilter NG”, Optic Makario GmbH, Germany) for the visible spectrum. The camera was set
to an aperture of f/8, ISO 400 and the pictures were stored in “RAW” file format. We used exposure bracketing
to produce three images to ensure that at least one picture was not over or underexposed. A 25% reflectance
standard (Zenith Polymer Diffuse Reflectance Standard provided by SPHEREOPTICS, Germany) placed in the
corner of each picture enabled a subsequent standardizing of light conditions.
In total, we took pictures of 32 chicks from 15 families. For 21 chicks we obtained photographs suitable for
further analyses with an unobstructed view to the entire chick and only one chick per photograph. Of these, we
randomly selected pictures of 15 chicks. Unfortunately, it was not possible to obtain proper alignment of visual
and UV pictures in ImageJ as either chick or camera moved slightly in the break between changing filters for
the two settings. Therefore, we restricted our analyses to human colour vision and discarded the UV pictures
for further analysis.
In each picture, we manually selected the chick outline and the feather-boundary as a basis for the ROIs
(Fig. 2a–c). The chick outline included bill, legs, rings and all areas densely covered by feathers without back-
ground shining through. We then marked the feather-boundary, i.e., the smoothened line created by the protrud-
ing neoptile feather tips. In the next step, we transferred images of chicks with or without protruding feathers,
i.e. cropped at feather-boundary or chick outline, respectively, and inserted them into a uniform or the natural
background. First, we cropped the chick without protruding feathers and transferred it into a uniform black
background. Second, we cropped the chick including all feathers and inserted it into exactly the same hiding
spot on the picture of the natural background (Fig. 2b). Third, we cropped the chick excluding the protruding
feathers and transferred it into the natural background (Fig. 2c).
We then proceeded with LEIA following the protocol of experiment 1 with the following changes. Again,
the selected ROI was the contour region ranging from the chick outline extended by 30 pixels towards the chick
inside to the feather-boundary extended by 30 pixels towards the outside. We excluded all areas of the ROI
that showed a shadow of the chick as the chicks’ shadow was missing on the empty natural background images
to which the cropped chicks were transferred to (Fig. 2a–c). We used the images of the cropped chicks on the
black background to determine the threshold of the HEI pixels according to the protocol of experiment 1 for
each chick separately. For each cropped chick that was transferred to the picture with the natural background,
we compared the mean edge intensity of the HEI pixels provided by LEIA with and without protruding feathers
(Fig. 2b,c) using a two-sided paired t-test.
We also calculated mean luminance differences for chick photographs. Details for this MLC are given in the
supplementary material.
Data availability
Raw images, data and scripts are stored in Edmond the Open Research Data Repository of the Max Planck
Society (https://dx.doi.org/10.17617/3.5j).
Received: 3 August 2020; Accepted: 12 February 2021
References
1. Stevens, M. & Merilaita, S. Animal camouflage: Current issues and new perspectives. Philos. Trans. R. Soc. Lond. B Biol. Sci. 364,
423–427 (2009).
2. Endler, J. A. An overview of the relationships between mimicry and crypsis. Biol. J. Linn. Soc. Lond. 16, 25–31 (1981).
3. Allen, J. J., Akkaynak, D., Sugden, A. U. & Hanlon, R. T. Adaptive body patterning, three-dimensional skin morphology and
camouflage measures of the slender filefish Monacanthus tuckeri on a Caribbean coral reef. Biol. J. Linn. Soc. Lond. 116, 377–396
(2015).
4. Cott, H. B. Adaptive Coloration in Animals (Methuen & Co, 1940).
5. Farkas, T. E., Mononen, T., Comeault, A. A., Hanski, I. & Nosil, P. Evolution of camouflage drives rapid ecological change in an
insect community. Curr. Biol. 23, 1835–1843 (2013).
6. Stevens, M., Troscianko, J. T., Wilson-Aggarwal, J. K. & Spottiswoode, C. N. Improvement of individual camouflage through
background choice in ground-nesting birds. Nat. Ecol. Evol. 1, 1325–1333 (2017).
7. Thayer, G. H. Concealing-Coloration in the Animal Kingdom. An Exposition of the Laws of Disguise Through Color and Pattern:
Being a Summary of Abbott H. Thayer’s Discoveries. (Macmillan Company, 1909).
8. Marr, D. Early processing of visual information. Philos. Trans. R. Soc. Lond. B Biol. Sci. 275, 483–519 (1976).
9. Tovée, M. J. An Introduction to the Visual System (Cambridge University Press, Cambridge, 1996).
10. Costello, L. M., Scott-Samuel, N. E., Kjernsmo, K. & Cuthill, I. C. False holes as camouflage. Proc. R. Soc. B 287, 20200126 (2020).
11. Cuthill, I. C. et al. Disruptive coloration and background pattern matching. Nature 434, 72–74 (2005).
12. Skelhorn, J., Rowland, H. M., Speed, M. P. & Ruxton, G. D. Masquerade: Camouflage without crypsis. Science 327, 51 (2010).
Scientific Reports | (2021) 11:5483 | https://doi.org/10.1038/s41598-021-84227-4 8
Vol:.(1234567890)www.nature.com/scientificreports/
13. Lovell, P. G., Ruxton, G. D., Langridge, K. V. & Spencer, K. A. Egg-laying substrate selection for optimal camouflage by quail. Curr.
Biol. 23, 260–264 (2013).
14. Pike, T. W. Quantifying camouflage and conspicuousness using visual salience. Methods Ecol. Evol. 9, 1883–1895 (2018).
15. Stoddard, M. C., Marshall, K. L. & Kilner, R. M. Imperfectly camouflaged avian eggs: Artefact or adaptation?. Avian Biol. Res. 4,
196–213 (2011).
16. Ekanayake, K. B. et al. The bright incubate at night: Sexual dichromatism and adaptive incubation division in an open-nesting
shorebird. Proc. R. Soc. B 282, 20143026 (2015).
17. Stoddard, M. C. et al. Camouflage and clutch survival in plovers and terns. Sci. Rep. 6, 32059 (2016).
18. Mayani-Parás, F., Kilner, R. M., Stoddard, M. C., Rodríguez, C. & Drummond, H. Behaviorally induced camouflage: A new
mechanism of avian egg protection. Am. Nat. 186, E91–E97 (2015).
19. Gómez, J. et al. Individual egg camouflage is influenced by microhabitat selection and use of nest materials in ground-nesting
birds. Behav. Ecol. Sociobiol. 72, 142 (2018).
20. Troscianko, J. T., Wilson-Aggarwal, J. K., Spottiswoode, C. N. & Stevens, M. Nest covering in plovers: How modifying the visual
environment influences egg camouflage. Ecol. Evol. 6, 7536–7545 (2016).
21. Colwell, M. A., Hurley, S. J., Hall, J. N. & Dinsmore, S. J. Age-related survival and behaviour of snowy plover chicks. Condor 109,
638 (2007).
22. Brudney, L. J., Arnold, T. W., Saunders, S. P. & Cuthbert, F. J. Survival of piping plover (Charadrius melodus) chicks in the Great
Lakes region. Auk 130, 150–160 (2013).
23. Eberhart-Phillips, L. J. et al. Demographic causes of adult sex ratio variation and their consequences for parental cooperation. Nat.
Commun. 9, 1651 (2018).
24. Hill, G. E. & McGraw, K. J. (eds.). Bird Coloration. Function and Evolution (Harvard University Press, 2006).
25. Foth, C. The morphology of neoptile feathers: Ancestral state reconstruction and its phylogenetic implications. J. Morphol. 272,
387–403 (2011).
26. Stettenheim, P. (ed.). Structural Adaptations in Feathers (Proceedings of the 16th International Ornithology Congress, 1976).
27. van den Berg, C. P., Troscianko, J. T., Endler, J. A., Marshall, N. J. & Cheney, K. L. Quantitative Colour Pattern Analysis (QCPA): A
Comprehensive Framework for the Analysis of Colour Patterns in Nature. bioRxiv: 592261 (2019).
28. R Core Team. R: A Language and Environment for Statistical Computing. https://www.R-project.org (R Foundation for Statistical
Computing, 2019).
29. Adobe Inc. Adobe Photoshop CS6. Version 13.0 x64. https://www.adobe.com/products/photoshop.html (2012).
30. Adobe Inc. Adobe InDesign CS6. Version 8.0. https://adobe.com/products/indesign.html (2012).
31. Wekstein, D. R. & Zolman, J. F. Cold stress regulation in young chickens. Poult. Sci. 50, 56–61 (1971).
32. Johnsen, A., Delhey, K., Andersson, S. & Kempenaers, B. Plumage colour in nestling blue tits: Sexual dichromatism, condition
dependence and genetic effects. Proc. R. Soc. B 270, 1263–1270 (2003).
33. Lyon, B. E. & Shizuka, D. Extreme offspring ornamentation in American coots is favored by selection within families, not benefits
to conspecific brood parasites. Proc. Natl. Acad. Sci. USA 117, 2056–2064 (2020).
34. Endler, J. A., Cole, G. L. & Kranz, A. M. Boundary strength analysis: Combining colour pattern geometry and coloured patch
visual properties for use in predicting behaviour and fitness. Methods Ecol. Evol. 9, 2334–2348 (2018).
35. Caves, E. M., Brandley, N. C. & Johnsen, S. Visual acuity and the evolution of signals. Trends Ecol. Evol. 33, 358–372 (2018).
36. Caves, E. M. & Johnsen, S. AcuityView: An r package for portraying the effects of visual acuity on scenes observed by an animal.
Methods Ecol. Evol. 9, 793–797 (2018).
37. Dimitrova, M. & Merilaita, S. Prey concealment: Visual background complexity and prey contrast distribution. Behav. Ecol. 21,
176–181 (2010).
38. Xiao, F. & Cuthill, I. C. Background complexity and the detectability of camouflaged targets by birds and humans. Proc. R. Soc. B
283 (2016).
39. Troscianko, J. T., Skelhorn, J. & Stevens, M. Quantifying camouflage: How to predict detectability from appearance. BMC Evol.
Biol. 17, 7 (2017).
40. Panetta, D., Buresch, K. & Hanlon, R. T. Dynamic masquerade with morphing three-dimensional skin in cuttlefish. Biol. Lett. 13
(2017).
41. Rauhaus, A. Q. et al. Larval development, stages and an international comparison of husbandry parameters of the Vietnamese
mossy frog Theloderma corticale (Boulenger, 1903) (Anura: Rhacophoridae). Asian J. Conserv. Biol. 1, 51–66 (2012).
42. Buxton, P. A. Animal Life in Deserts. A Study of the Fauna in Relation to the Environment (E. Arnold & Co, 1923).
43. Campbell, R. W. & Sloan, R. J. Natural regulation of innocuous gypsy moth populations. Environ. Entomol. 6, 315–322 (1977).
44. Whelan, C. J., Holmes, R. T. & Smith, H. R. Bird predation on gypsy moth (Lepidoptera: Lymantriidae). Larvae: An aviary study.
Environ. Entomol. 18, 43–45 (1989).
45. Land, M. F. Optics and vision in invertebrates. Handb. Sens. Physiol. VII/6B, 471–592 (1981).
46. Land, M. F. & Nilsson, D.-E. Animal Eyes (Oxford University Press, Oxford, 2012).
47. Burrell, N. S. & Colwell, M. A. Direct and indirect evidence that productivity of snowy plovers Charadrius nivosus varies with
occurrence of a nest predator. Wildfowl 62, 204–223 (2012).
48. Ellis, K. S., Larsen, R. T. & Koons, D. N. The importance of functional responses among competing predators for avian nesting
success. Funct. Ecol. 34, 252–264 (2020).
49. Giurfa, M., Vorobyev, M., Brandt, R., Posner, B. & Menzel, R. Discrimination of coloured stimuli by honeybees: Alternative use
of achromatic and chromatic signals. J. Comp. Physiol. A 180, 235–243 (1997).
50. Troscianko, J. T. & Stevens, M. Image calibration and analysis toolbox—A free software suite for objectively measuring reflectance,
colour and pattern. Methods Ecol. Evol. 6, 1320–1331 (2015).
51. Schneider, C. A., Rasband, W. S. & Eliceiri, K. W. NIH image to ImageJ: 25 years of image analysis. Nat. Methods 9, 671–675 (2012).
52. Livingstone, M. & Hubel, D. Segregation of form, color, movement, and depth: Anatomy, physiology, and perception. Science 240,
740–749 (1988).
53. Troscianko, J. T. & van den Berg, C. P. Empirical Imaging. Local Edge Intensity Analysis (LEIA). http://www.empiricalimaging.com/
knowledge-base/local-edge-intensity-analysis-leia/. Accessed 12 Feb 2020 (2020).
54. Cruz-López, M. et al. The plight of a plover. Viability of an important snowy plover population with flexible brood care in Mexico.
Biol. Conserv. 209, 440–448 (2017).
55. Eberhart-Phillips, L. J. et al. CeutaOPEN, individual-based field observations of breeding snowy plovers Charadrius nivosus. Sci
Data 7, 149 (2020).
56. Székely, T., Kosztolányi, A. & Küpper, C. Practical guide for investigating breeding ecology of kentish plover (Charadrius alexan-
drinus). in Unpublished Report (University of Bath, 2008).
Acknowledgements
We thank Salvador Del Angel Gómez, Medardo Cruz-López and Ivan Guardado González for help with field-
work. We are grateful to Mary Caswell Stoddard and the members of the research group Behavioural Genetics
and Evolutionary Ecology for discussion of methodology and results.
Scientific Reports | (2021) 11:5483 | https://doi.org/10.1038/s41598-021-84227-4 9
Vol.:(0123456789)www.nature.com/scientificreports/
Author contributions
V.A.R., C.K. and D.M. conceptualised the study. T.V. carried out fieldwork. V.A.R. and C.K. analysed, interpreted
the data and wrote the manuscript. All authors revised the manuscript.
Funding
Open Access funding enabled and organized by Projekt DEAL. This study was funded by the Max Planck Society
to CK. Additional funding for fieldwork was contributed by Tracy Aviary, UT to CK, and University of Graz
(Office of International Relations and Faculty of Natural Sciences) to TV.
Competing interests
The authors declare no competing interests.
Additional information
Supplementary Information The online version contains supplementary material available at https://doi.
org/10.1038/s41598-021-84227-4.
Correspondence and requests for materials should be addressed to V.A.R. or C.K.
Reprints and permissions information is available at www.nature.com/reprints.
Publisher’s note Springer Nature remains neutral with regard to jurisdictional claims in published maps and
institutional affiliations.
Open Access This article is licensed under a Creative Commons Attribution 4.0 International
License, which permits use, sharing, adaptation, distribution and reproduction in any medium or
format, as long as you give appropriate credit to the original author(s) and the source, provide a link to the
Creative Commons licence, and indicate if changes were made. The images or other third party material in this
article are included in the article’s Creative Commons licence, unless indicated otherwise in a credit line to the
material. If material is not included in the article’s Creative Commons licence and your intended use is not
permitted by statutory regulation or exceeds the permitted use, you will need to obtain permission directly from
the copyright holder. To view a copy of this licence, visit http://creativecommons.org/licenses/by/4.0/.
© The Author(s) 2021
Scientific Reports | (2021) 11:5483 | https://doi.org/10.1038/s41598-021-84227-4 10
Vol:.(1234567890)You can also read