General Insurance Stress Test 2015 - Scenario Specification, Guidelines and Instructions
←
→
Page content transcription
If your browser does not render page correctly, please read the page content below
`

General Insurance Stress Test 2015
Scenario Specification, Guidelines and Instructions
1 July 2015

                         1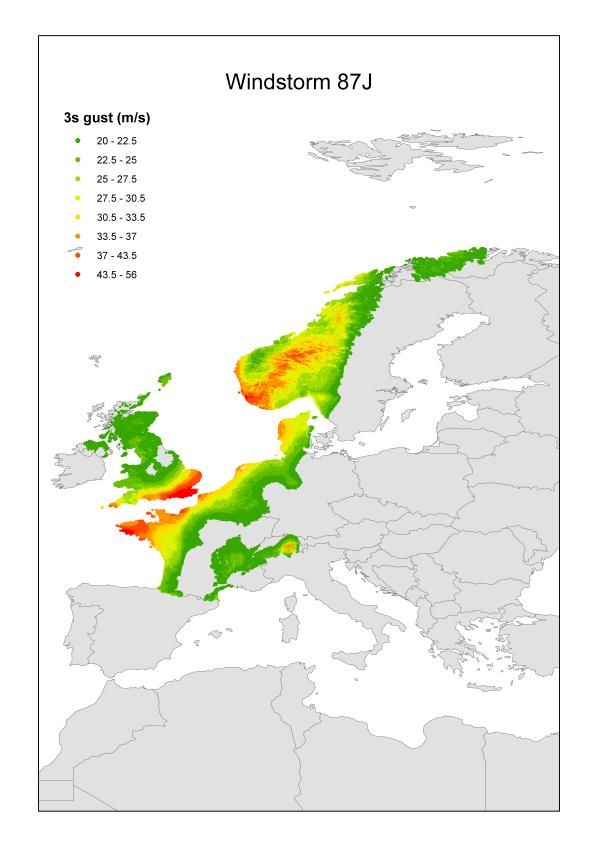
CONTENTS

Introduction.............................................................................................................................................. 3
1.    European Windstorm and flood set of events .................................................................................. 6
2.    US Hurricane set of events ............................................................................................................ 10
3.    Synchronous set of terrorism events ............................................................................................. 13
4.    Motor liability stress test................................................................................................................. 16
5.    Economic shock ............................................................................................................................. 18
6.    Supply Chain disturbance .............................................................................................................. 25
7.    Liability / Rserve stress test ........................................................................................................... 26
8.    Solar Flare / Geomagnetic storms ................................................................................................. 28
9.    Cyber Loss ..................................................................................................................................... 29
10. 1-in-200 insurance loss stress test (insurer specific) ..................................................................... 31
11. Reverse stress test (insurer specific) ............................................................................................. 32
12. Definitions ...................................................................................................................................... 33
13. Further notes for firms with defined pension schemes – only applicable for scenario 5 ............... 36

                                                                             2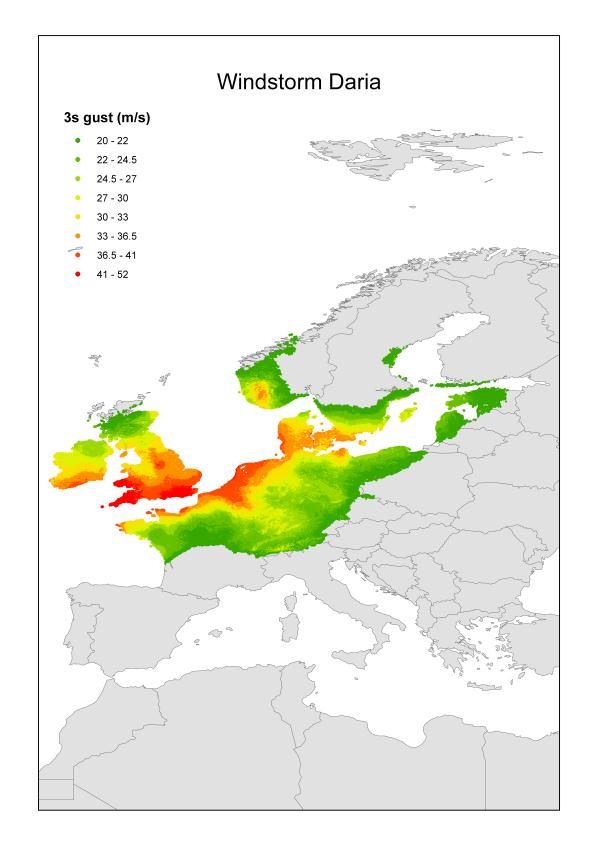
INTRODUCTION
This document provides details of the stress tests to be evaluated by firms that are within the scope of
the PRA’s General Insurance Stress Test exercise in 2015 (’GIST 2015’). This document also
provides notes and instructions as to how to complete the Microsoft Excel workbook “GIST 2015.xls”
which firms have been provided to record the results of each stress test.

Stress tests
The stress tests have been developed to address potential market-wide and firm-specific issues. The
below grouping illustrates the primary purpose for each of the stress tests. Note: stress tests within
Section B do not imply that establishing a market-wide stress would be inappropriate – rather that
these are scenarios which the PRA has not defined in sufficient depth to ensure reasonable
consistency between firms.
A: Understanding how specific events impact the UK insurance industry
(consistency between firms is important)

    1.    European windstorm and flood set of events
    2.    US Hurricane set of events
    3.    Synchronous terrorism set of events
    4.    Motor Liability Stress Test
    5.    Economic shock

B: Understanding the extent to which firms have considered specific potential stresses and
the impact on their Solvency II Balance Sheet

    6.    Supply chain disturbance
    7.    Liability / Reserve stress test
    8.    Solar Flare / Geomagnetic Storms
    9.    Cyber Loss
    10.   Worst case own – 1-in-200 insurance loss stress test (insurer specific)
    11.   Reverse stress test (insurer specific)

In addition, for each stress test firms are required to provide details of the expected reinsurance
recoveries split by reinsurers, and their expectation of the likelihood of such an event.

Firms are not required to recalculate their full Solvency II Balance Sheet after each stress – however,
firms are required to provide the gross and net loss and where appropriate any other mitigating
impacts that would impact the size of the underwriting loss – for instance an allowance for tax (see
subsequent section below: “Allowance for tax after stress event”).

High level notes are provided in this document, and firms are encouraged to apply their own
methodologies to calculate the expected loss under each described scenario, reflecting their specific
risk profile and insurance coverage provided.

                                                    3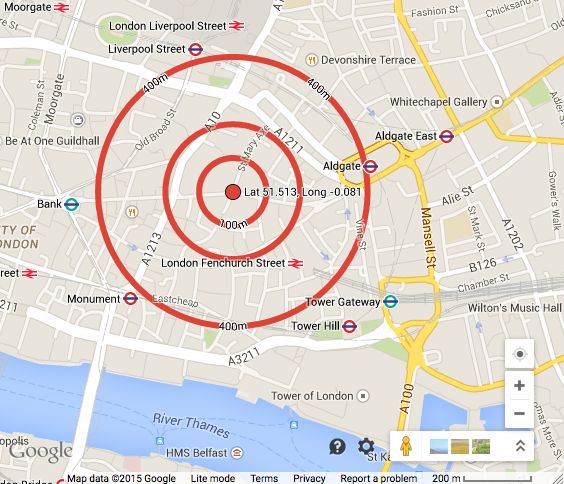
Coverage for the stress test submission
Where firms are submitting an internal model application the stress test submission must be aligned
to that application. For the avoidance of doubt for UK Groups that are applying for a group application
the submission should cover all group-wide operations (including those outside the UK).
For those firms not in the internal model approval process (IMAP) a separate submission will be
required for each legal entity, unless your supervisor has communicated otherwise in the covering
letter for this submission.

Where firms are uncertain as to the scope required please email:
PRA_GIStressTesting2015@bankofengland.gsi.gov.uk

Opening balance sheet: Standard formula vs internal model Solvency
Capital Requirement
Firms are only required to calculate their capital requirements before the stress event.
For firms in IMAP the capital requirement should be provided on both an internal model and standard
formula basis.
Firms not currently in IMAP should at a minimum provide capital requirements using the standard
formula basis, and we encourage firms to provide the internal model results where available.

Materiality
Firms should complete all scenarios unless they can demonstrate that given their specific risk
coverage the impact is immaterial. In this case immateriality is defined as less than 5% of total net
written premium.
Firms should include a breakdown of all reinsurers where expected recoveries are more than 2% of
the total recoverable.

Emergence of risk
In each case the shock is assumed to apply reasonably instantaneously, so firms should not consider
the emergence of risk; it is only the ultimate view of the loss event that should be recorded.

Allowance for tax after the stress event
The aim of the stress test is to understand the quantum of the risks on the insurer’s balance sheet
and in aggregate across the industry. The PRA recognises that each insurer’s tax position will differ;
as a result we require all stresses before any allowance for tax. However, firms may wish to provide
details of the anticipated tax impact for each scenario within the template (under the free-form text
box titled: “What would be the consequences of this scenario, and how would it impact your business
model”). The PRA will take this into consideration when assessing the overall results.

                                                   4
Reporting and sign-off requirements
This exercise is to be carried out only by firms selected by the PRA. Firms who have not received a
request are not required to complete the workbook.
For each stress test firms are required to submit a number of outputs that are standard across
scenarios, as well as additional information specific to each scenario that will allow the PRA to
understand the impact of each stress in greater detail. All parts of the template are required to be
completed.
On submission a senior executive is required to confirm they are satisfied with the completion of the
template for each of the relevant stress tests.

Deadline for submission
Submission of the completed excel template is required by 5pm on 1 October 2015.
The Excel work book should be saved ensuring that Firm Name and FRN number are contained
within the file name and the subject of the email.
Submissions should be sent to PRA_GIStressTesting2015@bankofengland.gsi.gov.uk

Queries
The stress tests have been developed in conjunction with a number of industry participants.
Any queries should be submitted to PRA_GIStressTesting2015@bankofengland.gsi.gov.uk.
Please ensure that the Firm Name and FRN number is included within the subject of the email.

                                                   5
1. EUROPEAN WINDSTORM AND FLOOD SET OF EVENTS
1.1 EVENT DEFINITION
This stress test is for a cluster of two severe European windstorms followed by a severe flood. The
windstorm tracks have been based on the previous two storms that occurred in 1987 and 1990.
Firms are to assume that the events are due to different weather systems and are sufficiently
separated in time to be considered three separate events for the purposes of reinsurance recoveries.

1.2 ASSUMPTIONS
Firms are asked to estimate the size of the loss per event and in aggregate using their natural
catastrophe modelling capabilities.
In estimating the gross loss, firms should allow for storm surge but not demand surge or post loss
amplification. For demand surge or post loss amplification, an uplift of 5% should be applied to all
three events.
Should the firm not have access to suitable modelling capabilities, a set of damage ratios has been
provided by the PRA for each windstorm and the flood event in Annexes 1, 2 and 3 of the GIST
2015.xls workbook. Firms may use these to estimate the loss. However, firms are strongly
encouraged to carry out their own modelling to estimate the size of potential losses.
Firms should consider what management actions including changes to their reinsurance programmes
they may take following the events. These should be described with the estimated associated costs,
if any, disclosed and allowed for post event in the above calculations.
Firms should assume events fall under the same treaty year, that any changes made to the
reinsurance programme do not incept before the events occurred, and should include the impact of
both inwards and outwards reinstatement premiums.

1.2.1   First windstorm
The map below illustrates the footprint for the first windstorm event which is assumed to match the
characteristics of windstorm 1987J with top gust speeds greater than 45m/s.

                                                                                      Loss Amounts
                                                        United Kingdom                4,009,688,681
                                                        France                        1,199,769,711
                                                        Norway                          513,515,946
                                                        Netherlands                     123,222,591
                                                        Belgium                          64,506,803
                                                        Denmark                          61,603,946
                                                        Germany                          29,788,771
                                                        Sweden                           21,032,732
                                                        Switzerland                      16,891,912
                                                        Luxembourg                          828,281
                                                        Ireland                              66,709
                                                        Austria                              54,925
                                                        Europe                        6,040,971,008

Source: AIR

                                                   6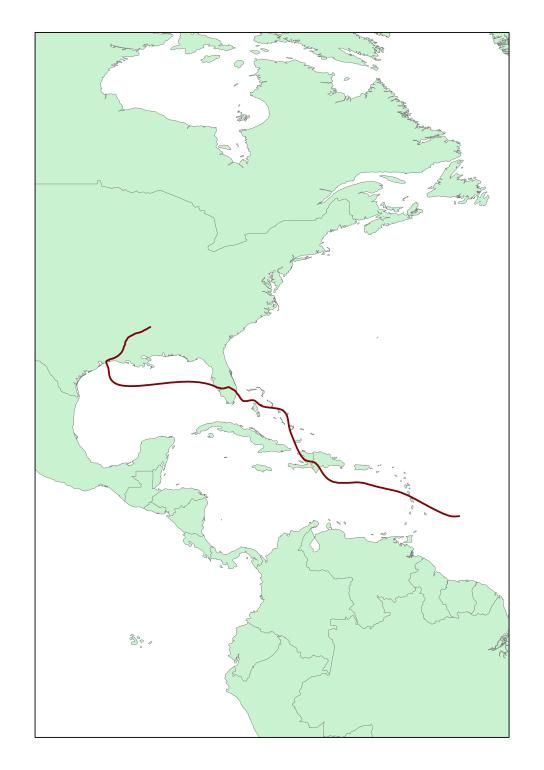
At today’s values, this is estimated to cause GBP 4.0 billion of losses in the UK and GBP 6.0 billion of
                                                 1
losses across Europe, split as in the table above . The matching AIR Event ID would be 410000003
(i.e. event 3 from the European Wind Historical Catalogue) and the matching RMS Event ID would be
2899004 (we are aware that the industry loss estimates between AIR and RMS differ).

1.2.2     Second windstorm
The map below illustrates the footprint for the second windstorm event which is assumed to match the
characteristics of windstorm Daria with top gust speeds greater than 40 m/s.

                                                                                     Loss Amounts
                                                       United Kingdom                5,901,536,317
                                                       Netherlands                   1,387,715,983
                                                       Belgium                         803,632,543
                                                       Germany                         699,549,253
                                                       France                          566,145,010
                                                       Denmark                         268,619,076
                                                       Sweden                          172,152,565
                                                       Ireland                         110,298,135
                                                       Switzerland                      46,195,209
                                                       Norway                           31,766,937
                                                       Luxembourg                       10,329,130
                                                       Poland                            2,051,204
                                                       Austria                           1,279,040
                                                       Czech Republic                    1,033,491
                                                       Estonia                             300,264
                                                       Lithuania                           129,439
                                                       Latvia                              129,125
                                                       Finland                              13,904
                                                       Europe                       10,002,876,625

Source: AIR
At today’s values, this is estimated to cause GBP 5.9 billion of losses in the UK and GBP 10.0 billion
of losses across Europe, split as in the table above. The matching AIR Event ID would be 410000004
(i.e. event 4 from the European Wind Historical Catalogue) and the matching RMS Event ID would be
2899009 (we are aware that the industry loss estimates between AIR and RMS differ).

1
    Industry loss estimates for the events are based on AIR Worldwide’s Industry Exposure Database

                                                   7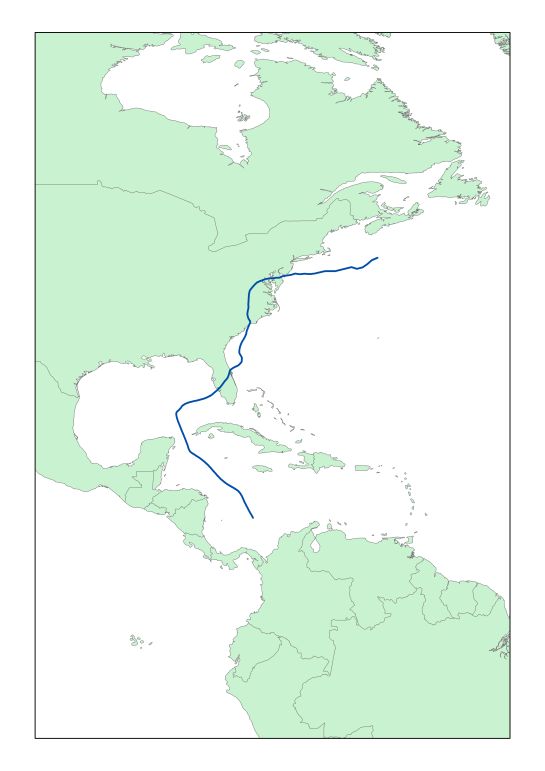
1.2.3   Third event: UK flood
For the third event, firms are to assume precipitation induced flooding in the south of England with the
most impacted areas in decreasing size of loss being London East, Peterborough, Oxford and Bristol.
The map below illustrates the footprint for the third event, with some of the characteristics of the flood
detailed in the table alongside.

                                                                                                 Flood
                                                        Event Duration (hours)                     144
                                                        Average Precipitation Rate (mm/hr)        1.22
                                                        Average Excess Run-off (mm/hr)            0.12
                                                        Average Discharge relative to 2 Year      2.29
                                                        Flow

Source: AIR
The flood event is assumed to result in severe flooding with the event lasting 144 hours across the
south of England leading to an industry loss of GBP 4.8 billion. The closest matching AIR Event ID
would be 920017260.
Alternatively, firms using RMS may model this event using RMS flood event ID 1945288. The PRA is
aware that the footprints are not spatially exactly similar although the main areas impacted are
broadly the same and the industry loss estimates correspond.

Source: RMS

                                                    8
1.3 REPORTING
Firms should provide separate gross estimates for each event, work out how the reinsurance
programmes would respond, and estimate the net loss to the firm.
Data assumptions, where made, should be disclosed including for example:
the allowance made for locations not geo-coded or insufficiently accurately geo-coded,
commercial policy deductibles and sub limits where not recorded, and
data fields such as construction type, occupancy, and others where not recorded.
Firms are also asked to disclose their estimates of the secondary uncertainty around their loss
estimates, the vendor model and version used or whether they have used the PRA supplied factors,
as well as any other assumptions made in the loss estimation.
The gross loss estimate should break down the loss between:
residential property damage losses
commercial property damage losses (including industrial & agricultural)
business interruption losses
contingent business interruption losses
motor losses
marine and energy losses
liability losses and
other type of losses.
92. US HURRICANE SET OF EVENTS
2.1 EVENT DEFINITION
This stress test is for a Katrina, Rita and Wilma (2005) type of scenario where a series of three major
US hurricanes occur in the same year.
2.2 ASSUMPTIONS
As for the European scenario, firms are expected to carry out their own modelling to estimate the
impact of the losses. In estimating the gross loss, firms should allow for storm surge but not demand
surge or post loss amplification. For demand surge or post loss amplification, an uplift of 25% should
be applied.
Should the firm does not have access to suitable modelling capabilities, a set of damage ratios has
been provided by the PRA for each hurricane in Annexes 4, 5 and 6 of the GIST 2015.xls workbook
which firms may use to estimate the loss.
Firms should consider what management actions including changes to their reinsurance programmes
they may take following the events. These should be described with the estimated associated costs,
if any, disclosed and allowed for post event in the above calculations. Firms should assume all three
hurricanes fall under the same reinsurance treaty year and should include the impact of both inwards
and outwards reinstatement premiums.
2.2.1 First hurricane through Florida before making landfall in Texas
The map below illustrates the track of the first hurricane of category 3 on the Saffir-Simpson scale
making landfall in Palm Beach, Florida. The hurricane is assumed to cause losses across the Gulf of
Mexico before making landfall again as a Category 4 hurricane in Chambers, Texas. It will also
create some losses across the Caribbean. The table provides details of the hurricane’s US landfalls.
US Landfall 1 US Landfall 2
Saffir-Simpson Category 3 4
Central Pressure (mbar) 952.2 929.6
Maximum Windspeed (mph) 119.5 139.5
Maximum Radius (miles) 25 23
Speed (mph) 6.5 5.7
Angle (degrees) -35.4 -16.3
Longitude (degrees) -80.089 -94.200
Latitude (degrees) 26.382 29.579
State Florida Texas
County Palm Beach Chambers
Source: AIR
102
The resulting industry loss is assumed to be some USD 56.0 billion , with the AIR Event ID being
270133233 and the closest matching RMS ID being 2864983 (we are aware that the industry loss
estimates between AIR and RMS differ).
2.2.2 Second hurricane hitting the US North East
The map below illustrates the track for the second category 3 hurricane making landfall in New
Jersey, and causing losses across the north-eastern US states of New York, Connecticut,
Pennsylvania and Delaware. Details of the hurricane’s landfall are provided in the table.
US Landfall 1
Saffir-Simpson Category 3
Central Pressure (mbar) 956.3
Maximum Windspeed (mph) 111.1
Maximum Radius (miles) 38.1
Speed (mph) 33
Angle (degrees) -49.2
Longitude (degrees) -74.456
Latitude (degrees) 39.397
State New Jersey
County Atlantic
Source: AIR
The resulting industry loss is assumed to be some USD 24.4 billion, with the AIR Event ID being
270093160 and the closest matching RMS Event ID being 2851343 (we are aware that the industry
loss estimates between AIR and RMS differ).
2
Industry loss estimates for the events are based on AIR Worldwide’s Industry Exposure Database
112.2.3 Third hurricane going through Florida before drifting north
The map below illustrates the track for the third category 4 hurricane making landfall in Lee, Florida
before making landfall again as a category 3 hurricane in South Carolina. Details of the hurricane’s
landfalls are provided in the table.
Landfall 1 Landfall 2
Saffir-Simpson Category 4 3
Central Pressure (mbar) 941.8 953.6
Maximum Windspeed
(mph) 133.7 121.4
Maximum Radius (miles) 25.6 18.3
Speed (mph) 14.1 12.1
Angle (degrees) 48.7 22.9
Longitude (degrees) -82.244 -78.709
Latitude (degrees) 26.626 33.797
South
State Florida Carolina
County Lee Horry
Source: AIR
The resulting industry loss is assumed to be some USD 37.7 billion, with the AIR Event ID being
2700163397 and the closest matching RMS Event ID being 2850375 (we are aware that the industry
loss estimates between AIR and RMS differ).
2.3 REPORTING
Firms should provide separate gross estimates for each event, work out how the reinsurance
programmes would respond, and estimate the net loss to the firm.
Data assumptions, where made, should be disclosed including for example:
the allowance made for locations not geo-coded or insufficiently accurately geo-coded;
commercial policy deductibles and sub limits where not recorded; and
data fields such as construction type, occupancy, and others where not recorded.
Firms are also asked to disclose their estimates of the secondary uncertainty around their loss
estimates, the vendor model and version used or whether they have used the PRA supplied factors,
as well as any other assumptions made in the loss estimation.
Results provided should break down the gross loss estimates at least between:
residential property damage losses
commercial property damage losses (including industrial & agricultural)
business interruption losses
contingent business interruption losses
motor losses
marine and energy losses
liability losses and
other type of losses
123. SYNCHRONOUS SET OF TERRORISM EVENTS
3.1 EVENT DEFINITION
This stress test is for a synchronous set of three terrorism events in London, New York and a third city
of firm’s choice, each using a 2 ton bomb dissimulated in a medium sized box van. The terrorist
attacks are assumed to be coordinated by one terrorist organisation and detonated outside the
entrance or service bay of each target location on a Monday at 3 pm UK time for the London event,
10am EST for the New York event, and peak business hours on the same day for the third event of
firm’s choice.
3.2 ASUMPTIONS
3.2.1 General
Firms should provide separate gross estimates for each terrorism event; estimate the benefit of
recoveries from Pool Re, from the Terrorism Risk Insurance Program Reauthorization Act (TRIPRA)
2015, from any other government or pool provided cover or from any reinsurance purchased if
relevant; and quantify the net loss to the firm. Recoveries from pools should be listed using the same
format to capture expected recoveries from reinsurers.
Firms are encouraged to carry out their own modelling of losses using the methodology or modelling
framework they consider most appropriate. In assessing the potential loss, firms should consider fire
following, business interruption costs and allow for clean-up costs. Firms should consider death and
injuries including total and partial disability.
In the absence of any such modelling, firms may default to the following PRA provided damage,
3
fatality and disability ratios within circular concentric zones centred on the detonation location.
For property damage and business interruption, firms should assume a 60% damage ratio
within a circular zone of 100m radius, a 20% damage ratio beyond 100m up to 200m, and a
5% damage ratio beyond 200m up to 400m.
For fatalities, firms should assume a 10% fatality rate within a circular zone of 100m radius
and a 1% fatality rate ratio beyond 100m up to 200m.
For disabilities, firms should assume a 15% disability rate within a circular zone of 100m
radius, a 5% disability rate ratio beyond 100m up to 200m, and a 1% disability rate beyond
200m to 400m. Firms may assume the disabilities are split equally between total and partial
disabilities.
Firms will also need to consider their own operational risk losses where relevant, including any
retained losses under their own insurance programmes.
Firms should assume events fall under the same treaty year and that no changes are made to the
government covers or reinsurance programmes protecting them at the time of the loss. Firms should
estimate, and disclose, the costs of any management actions including changes to their reinsurance
programmes they would expect to take post the loss.
3
Damage ratios and fatality rates have been set after discussions with RMS’ terrorism practice.
133.2.2 Terrorism event on Lime Street
Assume the first event in the set is a 2 ton bomb dissimulated in a medium sized box van and
detonated on a Monday at 3pm UK time next to the Lloyd’s building as shown on the map below. The
o
polar coordinates of the location of the bomb are assumed to be (latitude 51.513558 , longitude -
o
0.081547 ).
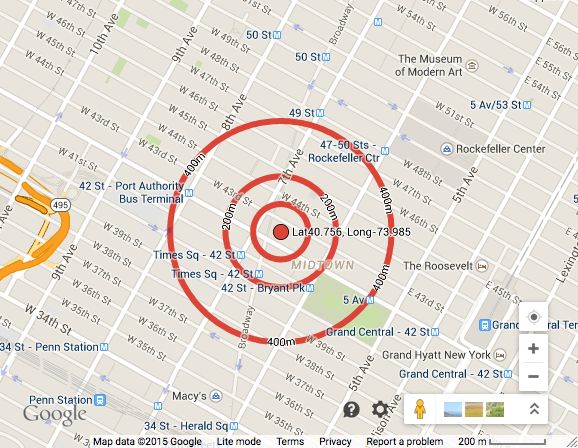
143.2.3 Terrorism event at the Nasdaq Stock Market
Assume the second event in the set is a 2 ton bomb dissimulated in a medium sized box van and
detonated on a Monday at 10am EST at the Nasdaq building in Manhattan as shown on the map
o
below. The polar coordinates of the location of the bomb are assumed to be (latitude 40.756043 ,
o
longitude -73.985804 ).
3.2.4 Terrorism loss
For the third event, firms are to choose a location in Paris, Frankfurt, Hong Kong, Singapore or
Sydney depending on where they feel they have the most significant exposures. Firms should
assume this third event in the set is also for a 2 ton bomb dissimulated in a medium sized box van,
detonated at peak time on the same day as the first two events.
3.3 REPORTING
Results provided should break down the gross loss estimates at least between:
Commercial property damage losses including buildings, contents and business interruption.
If terrorism coverage is excluded, fire following loss should be included to the extent cover is
provided or required by law,
Residential losses,
Personal accident losses,
Employer’s Liability/Workers Compensation losses,
Stand-alone political risk, war or terrorism specific covers provided,
any other insurance class of business, and
own operational risk losses.
154. MOTOR LIABILITY STRESS TEST
4.1 EVENT DEFINITION
This is a two part scenario combining a change in the legal environment surrounding future PPOs
(driving more and bigger PPOs) plus the imposition of a retrospective review, with associated costs.
This scenario is only relevant for insurers who have a material UK Motor insurance portfolio.
4.2 ASSUMPTIONS
4.2.1 Part I
Following a new legal precedent, settling large motor claims as a PPO award becomes the normal
position. Furthermore, settling the lost earnings element of the claim with a PPO, rather than with a
traditional lump sum, also becomes the standard practice.
In assessing the first part of this scenario firms should assume that their own propensity for large
motor claims (excess of £1m) to settle including a PPO award rises to 90%, regardless of experience
to date.
The definition of large claims can be assumed to be based upon that used by the IFOA PPO Working
Party. (£1 million in 2011 values indexed at 7% per settlement year.) The £1m definition applies to
the bodily injury element of the claim only and is per claimant. The element of the claim settled as a
PPO (rather than as a lump sum) is assumed to have been in respect of future care costs only prior to
this scenario occurring.
You should assume that this scenario applies to all unsettled large claims (IBNR as well as known
reported claims), defined as above, as at 31.12.2014, and that the valuation discount rate
assumptions are:
Gross nominal investment return 3.5% per annum;
Average weekly earnings 4.0% per annum;
Constant universal (overall percentiles) rate for ASHE 6115 = 4.5% per annum; and
Real discount rate = 1.045/1.035 – 1 = -0.966% per annum
Unsettled and IBNR claims should be discounted to the assumed future date of settlement. Please
use your usual PPO mortality and longevity assumptions. You should make no allowance for any
additional Reinsurance credit risk.
4.2.2 Part 2
This part of the scenario is intended to evaluate the potential impact of a retrospective legal change,
which even seeks to unpick historical settlements. It is retrospective only and does not apply to future
claims.
The scenario assumes that historically settled motor claims above £1m, settled after Jan 1 2008,
could be “re-opened” and the outstanding liability be settled on the current PPO basis. This
represents 7 years of claims settlements (as at end of 2014).
It quantifies a one off payment with the aim of addressing the economic gap between the lump sum
that a claimant did receive and the economic value that they would have received had the claim
settled as a PPO award (i.e. ensuring the claimant is indemnified for any investment, inflation or
mortality risk), thus including a PPO income stream in respect of the care costs that they claimed for,
instead of the equivalent lump sum that was provided.
To assess the potential retrospective impact of this scenario, firms are required to estimate the
difference between the lump sum that was paid and the economic cost that would have been incurred
if the claim had settled with a PPO.
Definitions of large claims and valuation discount rates should be assumed to be the same as in part
1.
16Firms should assess the difference between the care cost element of the claim that was settled using
a lump sum and the economic value of those future care costs using the economic assumptions set
out above together with your usual PPO mortality and longevity assumptions. The estimate should be
as at the date of settlement and inflated to 31.12.2014 at 7% per annum. Firms should assume that
there are no margins available within any lump sum that was paid that could be used to offset any
element of this scenario and that reinsurance does not respond to this compensation payment,
Please provide impact assessments for Parts 1 and 2 of the scenario separately.
4.3 REPORTING
In addition to the standard Balance Sheet impact from this stress test we require separate gross loss
impacts for each of Part 1 and Part 2.
For Part 1 we also require your expected loss ratio in respect of your motor portfolio for the 2014
4
accident year (on both a gross and net of reinsurance basis), as well as details of the PPO loss ratio
both before and after the stress test. Note we recognise that this will not directly correspond to the
Part 1 stress, as it will only cover PPOs attached to the 2014 accident year.
In the notes for Part 1 please provide details of your normal valuation basis, including mortality and
longevity assumptions. Please also provide details of the split of the gross loss between the IBNR
claims and known claims, and explain your approach to estimating the impact of IBNR claims.
4
PPO loss ratio means the part of the overall Motor Loss Ratio that is in respect of the PPO element
of the large claims
175. ECONOMIC SHOCK
5.1 EVENT DEFINITION
The economic shock scenario is consistent with the 2015 Financial Policy Committee Stress Test of
the UK Banking system. A brief outline of this scenario is provided below:
Globally area stress
Global growth disappoints materially relative to expectations and disinflationary pressures build up.
This triggers a rapid deterioration of market sentiment globally. Risk appetite abruptly diminishes and
market participants attempt to de-risk their portfolios, generating safe-haven capital flows to high-
quality US assets. The dollar appreciates against a wide range of currencies, especially those of
emerging market economies. Liquidity in some markets becomes seriously impaired and credit risk
premia rise sharply. Commodity prices fall further, putting additional downward pressure on global
inflation.
This leads to falls in consumption, investment and property prices. The deterioration of global financial
market sentiment is also evident in the UK. In this scenario, it is assumed that policymakers observe
these developments as a series of unexpected shocks. Additional monetary policy stimulus is
pursued, which has the effect of lowering the yield curve.
Economic output falls across a number of regions including the euro area, emerging market
economies and the UK. The marked reduction in global nominal demand causes a further reduction in
commodity prices. The oil price troughs at US$38 per barrel and remains low throughout the scenario.
Other commodity markets also see price falls and remain very weak throughout the scenario. This
puts additional downward pressure on global inflation.
Falls in commercial property prices are more pronounced, reflecting the larger average overhang of
unsold property in that market. This is associated with sharp falls in real estate investment and
industries associated with construction.
Euro area stress
In the euro area, output growth slows due to a combination of international spillovers and domestic
amplifications. Slower world trade results in materially lower demand for exports, a channel that acts
more strongly for the euro area ‘core’ given the greater trade linkages with Asian economies.
As elsewhere, the weaker economic conditions in the euro area lead to higher risk premia. This risk
aversion causes the euro to depreciate by around 25% against the US dollar and by 15% against
sterling. Within the euro area, risk premia rise most strongly in asset markets for the more highly
indebted sovereigns, households and firms, given the effect that falling nominal GDP has in
increasing the real burden of debt.
In the UK, output growth turns negative as export demand falls sharply and there are spillovers
through confidence effects. Financial linkages provide another channel of transmission. The reduction
in inflationary pressures from the slowing economy and falling commodity prices results in inflation
turning negative during the scenario. This constitutes the largest fall in the price level in the UK for
over 80 years. As elsewhere, additional monetary policy stimulus is pursued and Bank Rate is
reduced to zero. Operating conditions are particularly challenging for UK corporates in this scenario.
If insurers require additional detail and colour around the scenario then refer to the Bank of England
Banking Stress Test 2015.
http://www.bankofengland.co.uk/financialstability/Documents/stresstesting/2015/keyelements.pdf
Insurers are not expected to implement the full banking stress test which considers a 5 year horizon,
nor apply the full economic and asset stress factors required by banks and building societies.
Instead, we provide the relevant factors that insurers need to apply in Section 5.2 below
18Please note it is inevitable that these factors will not capture the breadth of all firms’ assets,
geographies or products. Where this is the case we expect insurers to consider suitable factors and
make their own judgments / assessment that are appropriate and within the spirit of the wider
economic stress illustrated above. When applying expert judgment in relation to the asset shocks we
would expect insurers to consider the worst market moves observed in the historical periods per
region detailed in the table below.
Geographical region of positions Historical period
Asia and Emerging Markets 2008 H2
Europe and the United States 2011 H2 and 2012 H1
The economic assumptions firms should apply under stress are set out in 5.2. Definitions are
available in the spreadsheet used to collect the scenario feedback. Firms should assess the extent to
which this would impact their insurance operations as well as the impact on their investments.
When considering changes in Pension Scheme commitments, for firms with defined benefit schemes,
we expect insurers to assess the impact of the instantaneous asset shock on their pension scheme
investments and report the extent to which this results in a surplus or deficit. We acknowledge that
firms have a number of options in which to manage funding pension schemes under stress and this
will be considered when evaluating the scenario outcome. Further notes as to how firms should apply
the economic scenario to pensions projections are provided in Section 13.
5.2 ASSUMPTIONS
Macroeconomic variables (Base and after Stress)
UK area
Base Stress % Change
UK real GDP 432,814.0 422,690.0 -2.3%
UK nominal GDP 452,391.3 444,767.9 -1.7%
UK CPI (assume same change for RPI) 128.3 127.1 -0.9%
UK unemployment rate 5.7 7.7 35.1%
UK corporate profits 208,952.0 199,767.0 -4.4%
UK household income 313,560.0 316,468.0 0.9%
UK residential property price index 100.0 87.6 -12.4%
UK commercial real estate price index - aggregate 100.0 83.0 -17.0%
UK commercial real estate price index - prime 100.0 80.1 -19.9%
UK commercial real estate price index - secondary 100.0 84.1 -15.9%
UK equity prices 100.0 64.0 -36.0%
Bank Rate 0.5 0.0 -100.0%
Sterling Investment Grade corporate bond spread 141.0 452.0 220.6%
Sterling High Yield corporate bond spread 441.0 1,762.0 299.5%
PPP-weighted World real GDP 100.0 99.3 -0.7%
Oil price 76.1 43.3 -43.1%
Volatility index 16.0 44.9 180.6%
GBP-EUR exchange rate index 100.0 115.2 15.2%
GBP-USD exchange rate index 100.0 88.7 -11.3%
G20 emerging economy dollar exchange rate index 100.0 75.2 -24.8%
19Euro area aggregate (including periphery)
Base Stress % Change
Real GDP 100.0 98.5 -1.5%
Consumer price inflation 0.2 -1.3 -750.0%
Unemployment rate 11.4 12.8 12.3%
ECB policy rate 0.1 0.0 -100.0%
Residential property price index 100.0 88.2 -11.8%
Commercial real estate price index 100.0 89.0 -11.0%
Asset Liquidity
Region Risk Factor
Class Horizon
1y
EURUSD -0.2 (1) The convention of 'Ccy1Ccy2'
GBPUSD -10% represents the number of Ccy2 per Ccy1.
(2) These are relative percentage shifts.
FX Europe USDCHF 5% For example, if USDJPY spot rate on 20-
USDTRY 44% Feb-2015 is 120, the 1d 5% shock will
USDRUB 30% take the spot rate to 120 x (1 + 5%) = 126
FTSE100 INDEX -36% These are relative percentage shifts. If
the FTSE100 index on 20-Feb-2015 is
Equities Europe EUROSTOXX50 -26% 6500, a 1d -5% shock will take the index
MSCI EMU -28% value to 6500 x (1 - 5%) = 6175.
ITRAXX 260% These are relative percentage shifts to the
5yr credit spreads.
Credit Europe ITRAXX XOVER 240% (also to be applied to all Corporate credit
ITRAXX SNR FIN 240% including structured products & loans)
GER GOV 1Y -1600%
GER GOV 5Y -300%
GER GOV 10Y -2300%
EUR SW 1Y 6400%
EUR SW 5Y 1800%
EUR SW 10Y -1200%
EUR PERIPH EX
GR 1Y 19600%
EUR PERIPH EX These are absolute basis points shifts to
GR 5Y 392 the annual interest rate. For example, if
Rates Europe EUR PERIPH EX the 1-year CN government yield is 500
GR 10Y 298 bps, the -20 bps 1d shock will take the
GBP GOV 1Y rate to 480 bps.
-42
GBP GOV 5Y -78
GBP GOV 10Y -87
GBP GOV 20Y -108
GBP SW 1Y -3
GBP SW 5Y -74
GBP SW 10Y -74
GBP SW 20Y -73
20Euro area aggregate (excluding periphery)
Base Stress % Change
Real GDP 100.0 98.9 -1.1%
Consumer price inflation 0.4 -1.2 -400.0%
Unemployment rate 7.3 8.0 9.6%
ECB policy rate 0.1 0.0 -100.0%
Residential property price index 100.0 87.6 -12.4%
Commercial real estate price index 100.0 88.9 -11.1%
Euro area periphery
Base Stress % Change
Real GDP 100.0 97.6 -2.4%
Consumer price inflation -0.3 -1.4 366.7%
Unemployment rate 18.0 20.5 13.9%
ECB policy rate 0.1 0.0 -100.0%
Residential property price index 100.0 89.5 -10.5%
Commercial real estate price index 100.0 89.5 -10.5%
US
Base Stress % Change
US real GDP 100.0 99.8 -0.2%
US unemployment rate 5.7 7.1 24.6%
US equity prices 100.0 78.4 -21.6%
US policy rate 0.3 0.3 0.0%
US residential property price index 100.0 93.9 -6.1%
US commercial real estate price index 100.0 90.1 -9.9%
US dollar IG corporate bond spread 133.0 261.0 96.2%
US dollar HY corporate bond spread 468.0 1,208.0 158.1%
21Asset Liquidity
Region Risk Factor
Class Horizon
1y
These are relative percentage shifts. If
the FTSE100 index on 20-Feb-2015 is
Equities US S&P 500 -0.2
6500, a 1d -5% shock will take the
index value to 6500 x (1 - 5%) = 6175.
CDX HY 130% These are relative percentage shifts to
Credit US
CDX IG 100% the 5yr credit spreads.
USD GOV 1Y -3500%
-
USD GOV 5Y
11900% These are absolute basis points shifts
- to the annual interest rate. For
USD GOV 10Y
Rates US 10600% example, if the 1-year CN government
USD SW 1Y 2200% yield is 500 bps, the -20 bps 1d shock
- will take the rate to 480 bps.
USD SW 5Y
10200%
USD SW 10Y -9500%
22Asia
Liquidity
Region Risk Factor Horizons
1y
USDJPY 0.2
USDCNY 10%
USDCNH 10%
USDHKD 0% (1) The convention of 'Ccy1Ccy2'
USDINR 21% represents the number of Ccy2 per Ccy1.
(2) These are relative percentage shifts.
FX Asia USDKRW 44%
For example, if USDJPY spot rate on 20-
USDMYR 15% Feb-2015 is 120, the 1d 5% shock will
USDIDR 31% take the spot rate to 120 x (1 + 5%) = 126
USDTWD 12%
USDSGD 13%
AUDUSD -35%
NIKKEI225 -38%
HANG SENG These are relative percentage shifts. If
-65% the FTSE100 index on 20-Feb-2015 is
Equities Asia INDEX
6500, a 1d -5% shock will take the index
SENSEX -53%
value to 6500 x (1 - 5%) = 6175.
KOSPI -55%
ITRAXX JAPAN 227%
ITRAXX EX These are relative percentage shifts to the
Credit Asia 400%
JAPAN IG 5yr credit spreads.
ITRAXX EX
750%
JAPAN HY
SG GOV 1Y 100
SG GOV 3Y 100
HK GOV 1Y 100
HK GOV 3Y 110
CN GOV 1Y -100
CN GOV 3Y -100
TRY GOV 1Y 500 These are absolute basis points shifts to
TRY GOV 3Y 500 the annual interest rate. For example, if
Rates Asia the 1-year CN government yield is 500
SG SW 1Y 130 bps, the -20 bps 1d shock will take the
SGSW 3Y 112 rate to 480 bps.
HK SW 1Y 180
HK SW 3Y 120
CN SW 1Y 0
CN SW 3Y 0
TRY SW 1Y 400
TRY SW 3Y 400
23A copy of these assumptions is provided in the Annex of the GIST 2015.xls workbook.
5.3 REPORTING
Firms should assess the impact on both their investments and their underwriting activities.
Consideration should be given to lines of business such as credit insurance that are directly related to
economic conditions, but firms should also consider other lines of business that could be indirectly
impacted by the wider economic climate described above.
Note: Within the template for this particular stress test Gross and Net aggregate loss should reflect
the total loss arising from both investment and underwriting activities.
246. SUPPLY CHAIN DISTURBANCE
6.1 EVENT DEFINITION
The earthquake & tsunami in Japan followed by the floods in Thailand in 2011 resulted in a significant
portion of the world’s suppliers of hard drives to be out of business for several months. The knock-on
impact to PC manufacturers around the world illustrated the interconnectivity risk that can arise from
supply chain disturbances, as well as the complexities in identifying concentrations and aggregations
of risk.
In recognising that insurers are assisting industry to mitigate this risk, this stress test is aimed at
understanding the ability of insurers to identify the potential for aggregations in terms of the contingent
business interruption across different insureds.
6.2 ASSUMPTIONS
A supply chain loss could arise if a leading Supplier of a key product with few substitutes suffers a risk
or catastrophic loss leading to a significant disruption of supply. Given the complexity of global supply
chains, the varied nature of different commercial portfolios and differences in coverage provided by
insurers, we have not identified or named a Supplier or defined a loss scenario.
Instead, firms are asked to identify the five suppliers to whom they have the largest exposures under
the Contingent Business Interruption (CBI) cover included in their commercial policies.
For the stress test scenario, firms are to assume a Gross Loss corresponding to their largest
exposure i.e. full limit losses arising from the Supplier where they have the largest exposure being
inoperative indefinitely.
Firms should consider not only Suppliers named in their commercial policies but should also make
some allowance for exposures which might arise under Unnamed Suppliers CBI coverage provided.
6.3 REPORTING
Firms are required to provide details of the top 5 CBI exposures, noting that only the largest exposure
will be included for the purposes of the stress test.
Firms should disclose any additional exposures they may have to these Suppliers from other policies
they write e.g. if they also participate on the Supplier’s commercial insurances.
Firms are also required to state the method used to identify their top 5 suppliers.
257. LIABILITY / RESERVE STRESS TEST
7.1 EVENT DEFINITION
The intention of this stress test is to capture the potential for systemic losses arising from product or
process activity (for instance a product recall loss impacting an industry) or from professional / service
work (for instance professional negligence claims arising following falls in asset values).
These claims often take long to settle, can span more than one underwriting year, result in
accumulations across different sectors, and typically impact insurers through reserve deteriorations.
Currently, the most common methods for capturing such events are via techniques that exploit past
claim payment and reserve development. This stress test is intended to move beyond consideration
of pure historic events, and to leverage exposure information.
As a result, we have not prescribed an event definition, instead, we require firms to provide details of
their largest sector exposures and to apply specific “damage ratios” to determine the gross aggregate
loss following the stress.
Firms have the ability to provide feedback on the plausibility of the loss calculated under this event (by
providing the return period for such an event), as well as a description of the event that could give rise
to such a loss.
7.2 ASSUMPTIONS
In discussion with some insurers it is clear that historic exposure data may not be readily available for
older underwriting years – as a result we have currently restricted this stress to events impacting the
2014 underwriting year only.
Firms are required to identify their Total Exposed Aggregate Limit (TEAL) for each of their largest
sectors for which they provide liability insurance cover. Whilst firms are free to decide on the
appropriate sector groupings, we expect these would generally follow some standardised groupings
such as those provided by the traditional SIC groupings.
Our preferred method is to use the Companies House Standard Industrial Classification (SIC) of
Economic Activities (2007). For example, Manufacture of Electrical Equipment [Section C Division
27], Civil Engineering [F42], or Real Estate Activities [L68] would be acceptable sectors to use. We do
5
not expect sectors to be further sub-divided into more granular areas (for instance,
Manufacture of wiring and wiring devices [C27.3]).
We will accept other groupings that adhere to the same principles of grouping common exposures as
per the linked SIC document. Firms using alternative groupings should explain how they have decided
on these sectorial groupings.
In establishing the groupings it is important that this is linked to the firm’s view of emerging risks –
examples may be nanotechnology.
5
As we are targeting firms’ Casualty accounts, firms should not use ‘Motor Liability’ as a sector,
unless this is the primary source of exposure from sectors such as Manufacture, Sale, Repair (etc.) of
Motor Vehicles.
26The aggregate gross loss should be calculated as:
1) 3% of TEAL for your top 2 sectors combined (as defined above); less
2) Current estimate ultimate claims relating to these policies (to avoid double counting)
In deriving the net losses firms will need to consider the events that will cause the implied stress
events and how their specific reinsurance will correspond.
7.3 REPORTING
In addition to the standard scenario information, which will allow firms to feedback on the likelihood of
this scenario, we require firms to provide information in relation to their top 3 sectors as defined by the
6
TEAL . Further, and in order for us to understand the way in which firms view their liability exposures,
we require firms to state what proportion of their liability exposures are coded as ‘Miscellaneous’ (or
‘Other’).
Firms are encouraged to provide descriptive information on the plausibility of an event that would
result in the aggregate loss as determined using these assumptions set out in this stress test.
Firms are required to provide the methodology and rationale for their selected groupings.
6
We acknowledge that for the purposes of the gross aggregate loss only the top 2 sectors are
required.
278. SOLAR FLARE / GEOMAGNETIC STORMS
8.1 EVENT DEFINITION
The purpose of this stress scenario is to assess the extent to which insurers have considered or can
readily assess the impact of an earth directed solar storm that damages satellites and causes
geomagnetic storms on earth that result in power outages & loss of certain communication systems.
The scenario should also consider the potential vulnerability of space weather on the financial
services sector. Elements of this sector’s operations depend on accurate timing (using space based
technologies) which are space-weather-event-exposed.
We acknowledge that the event description and the assumptions detailed below are broad, and as a
result, we also expect a wide variation in the level of depth and information that firms provide, that will
inevitably reflect the extent to which the firm has already considered a stress event of this nature.
8.2 ASSUMPTIONS
Given the potential complexity of this scenario we have kept the definition relatively free-form and are
relying on insurers to provide the details needed to translate this into a loss event. However, to
ensure some consistency in the level of severity that insurers use we provide the following notes:
Assume that the solar flare impacts multiple infrastructures (including telecommunications,
transport and power grids) simultaneously in the US (along the Atlantic corridor between
Washington DC and New York City) and the UK.
Assume that a sufficient number of power transformers (i.e. those using alternating current
power transmitting high voltage and with low loss) are knocked out such that power outage
occurs and that power can only be restored once enough damaged equipment has been
repaired or replaced. In this event the length of repairs or replacement should be at least 1
month and linked to particular regional areas in the US and the UK.
It is at a firm’s discretion which area of the US and UK to select for outage purposes. In the
UK, the main electric power plants are widely spread across England, Wales, Scotland, and
Northern Ireland. However, we suggest that firms stress those regions where they have the
highest exposures.
In deciding which power grids are assumed to fail firms can use their own knowledge of the
vulnerabilities / age of the power grids to which an insurance claim could occur.
Where relevant firms should also consider the impacts on space-borne technology and the
extent to which satellites in orbit can be damaged or the extent to which other covers could be
impacted – such as satellite launches, and breakdown in communication systems with knock-
on consequences on the financial sector.
The extent to which consideration and credit is taken for multilateral and international
collaboration response to cope with this extreme event this should be set out in the
spreadsheet under Management Actions.
289. CYBER LOSS
9.1 EVENT DEFINITION
A series of simultaneous cyber-attacks are launched on large multinational organisations and
discovered across the Retail sector (SIC code 47 – including all sub codes) with the intention of
causing major disruption and financial loss to organisations. During the attacks, customer data (e.g.
IP, credit card/bank details and/or other highly confidential information) is taken without authorisation.
The attacks target vulnerabilities in the operating systems, web applications and/or software used by
these organisations. For the purposes of this exercise it is assumed that multiple systems and/or
multiple organisations using the same systems/software are affected.
The hacking attacks are likely to take the form of a virus but equally could take an alternative vector of
attack. Similarly for the purposes of this exercise it is assumed that multiple organisations across the
world in the Retail sector come under attack at the same time (i.e. a macro event).
As a result of the breach, customer management and trading systems, networks and supply chains
are disrupted at these organisations for a minimum duration of 24 hours.
The organisations affected have adopted reasonable network security processes, including anti-virus
software and patching.
9.2 ASSUMPTIONS
The assumption is that your fifteen largest clients (within the Retail sector – SIC code 47, including all
sub codes) worldwide - based on exposure to policies (including, but not limited to, cyber liability), are
targeted.
Assume that all client data at these Retail organisations is lost (i.e. assume losses are a minimum of
90% of relevant policy limits for the top fifteen companies). Assume that class actions are pursued
and you will face third party liability claims.
For reinsurance purposes please calculate separately on the basis that these attacks are deemed
both as one event and as fifteen separate events, returning whichever causes the largest net loss.
Where an Electronic Data Exclusion or a Cyber Attack Exclusion clause has been consistently applied
to a non-cyber specific (Other) policy, a zero gross loss incurred may be assumed for that line of
business. If however such clauses have NOT been consistently applied across that line of business, a
minimum 90% limit loss must be assumed.
299.3 REPORTING
The estimated losses should consider and report the breakdown of the loss into the following lines of
business:
CYBER POLICY LOSSES
o First party loss notification, associated costs and breach management costs,
including crisis management
o Business Interruption (excluding physical damage)
o Contingent business interruption
o Third party liability losses
o Regulatory defence, legal fees and fines covered amounts
o Other losses
OTHER POLICY LOSSES
o Crime
o E&O policies with cyber endorsements
o Technology E&O
o D&O
o GL / failure to supply
o Other policies that may respond
Firms are required to identify the cumulative gross loss incurred from the fifteen clients for each of the
sections/heads of policy coverage above, as well as the anticipated reinsurance recoverable also split
by the same policy section/head of coverage.
3010. 1-IN-200 INSURANCE LOSS STRESS TEST (INSURER SPECIFIC)
10.1 EVENT DEFINITION
This stress test is unique to each firm. As a result, no event definition is provided. Instead you are
required to provide a scenario that corresponds to an estimated 1-in-200 year net aggregate
7
insurance loss over a one year period. We are aiming to gauge the types of events that are most
relevant to your firm around this level of likelihood. Where the internal model is used as an input for
this stress test, please provide commentary explaining how these events could arise and how these
would impact your firm’s business.
10.2 ASSUMPTIONS
You should report details of an extreme underwriting, reserving or a combined underwriting/reserving
based scenario, not listed elsewhere in this exercise, which represents your net insurance losses with
a probability of around 0.5% over the next 12 months.
10.3 REPORTING
A detailed scenario description should be provided that corresponds to real world events. For
instance it is not sufficient to state losses that will increase by £Xm under this event. Instead a
description of the scenario is required – for instance under this scenario claims inflation is assumed to
increase by 2% per annum above the best estimate; or claims deteriorate due to a major product
recall by a pharmaceutical company after the discovery of harmful side-effects.
In addition, please provide a breakdown of the increase in the gross and net technical provisions and
the associated return period for the change in net technical provisions using the Solvency II lines of
business classifications. For the avoidance of doubt the return period per line of business will not
necessarily be 1-in-200; rather the net aggregate of all the losses will represent the 1-in-200 loss
scenario.
7
(i.e. both underwriting and reserving)
3111. REVERSE STRESS TEST (INSURER SPECIFIC)
11.1 EVENT DEFINITION
Reverse stress tests are stress tests that require a firm to assess scenarios and circumstances that
would render its business model unviable, thereby identifying potential business vulnerabilities.
Reverse stress testing starts from an outcome of business failure and identifies circumstances where
this might occur. This is different to general stress and scenario testing which tests for outcomes
arising from changes in circumstances.
Note: a firm's business model is described as being unviable at the point when crystallising risks,
including loss of key staff or infrastructure or counterparty, cause the market to lose confidence in the
firm. A consequence of this would be that counterparties and other stakeholders would be unwilling to
transact with or provide capital to the firm and, where relevant, existing counterparties may seek to
terminate their contracts. Such a point could be reached well before a firm's regulatory capital is
exhausted.
11.2 ASSUMPTIONS
For this scenario, you should use the event identified that is most likely to crystallise, drawing as
8
appropriate on any work already carried out as part of the SYSC 20.2 requirements.
11.3 REPORTING
In addition to the standard stress test information we require completion of a number of questions
specific to reverse testing that are aimed at enabling us to understand
your assessment of what constitutes business model failure;
how this assessment feeds into your risk appetite and risk mitigation actions in place;
the limitations of your assessment and sensitivities; and
the governance arrangements you have in place.
8
https://fshandbook.info/FS/html/handbook/SYSC/20/2
3212. DEFINITIONS
VARIABLE NAME DEFINITION SOURCES FOR HISTORICAL DATA
Bank estimates of past gross domestic product (chained volume
UK real GDP [1] ONS and Bank calculations.
measure, seasonally adjusted, £m).
Gross domestic product (current prices, seasonally adjusted, £m).
UK nominal GDP [1] ONS.
ONS code: YBHA.
UK Consumer price index (All items index, non-seasonally
UK CPI ONS.
adjusted, indexed to 2014Q4 = 100). ONS code: D7BT.
UK unemployment UK unemployment rate (LFS definition, all, aged 16 and over,
ONS.
rate seasonally adjusted, %). ONS code: MGSX.
UK corporate nominal profits (Nominal GDP minus pre-tax labour
UK corporate profits income, includes self-employment income, £m). Derived from ONS and Bank calculations.
ONS codes YBHA, ROYJ, ROYH and ROYK.
UK household nominal income (Nominal disposable income,
UK household income ONS.
adjusted for pensions contributions, £m). ONS code: RPQK.
UK residential Quarterly average of Halifax and Nationwide measures (indexed to Halifax, Nationwide and Bank
property price index 2014 Q4 = 100). calculations.
UK commercial real Quarterly average of UK commercial property price index from the
Investment Property Databank
estate price index - Investment Property Databank (the average of all UK properties in
(IPD UK) and Bank calculations.
aggregate the IPD sample, indexed to 2014 Q4 = 100).
IPD series for prime CRE (representing all properties in the lowest
yielding quartile of its sample, indexed to 2014 Q4 = 100). Prime
UK commercial real CRE is generally considered to refer to larger properties often
Investment Property Databank
estate price index - located in London or other large cities, often with strong leases
(IPD UK) and Bank calculations.
prime that create an investment similar to a bond. The IPD series for
prime represents all properties in the lowest yielding quartile of its
sample.
IPD series for secondary CRE (representing all properties in the
UK commercial real
highest yielding quartile of its sample, indexed to 2014 Q4 = 100). Investment Property Databank
estate price index -
Secondary property refers to all commercial real estate property (IPD UK) and Bank calculations.
secondary
that is not prime.
Quarterly average of FTSE all-share price index (indexed to 2014
UK equity prices Thompson Reuters Datastream.
Q4 = 100).
Bank Rate Quarterly average of official Bank Rate (%). Bank of England.
Quarterly average option adjusted spread over maturity-matched
Sterling IG corporate government spot curve on GBP denominated investment grade BofA Merrill Lynch Global
bond spread corporate and securitized debt publicly issued in the eurobond or Research and Bank calculations.
UK domestic market (basis points).
Quarterly average option adjusted spread over maturity-matched
Sterling HY corporate government spot curve on GBP denominated below investment BofA Merrill Lynch Global
bond spread grade corporate debt publicly issued in the eurobond or UK Research and Bank calculations.
domestic market (basis points).
PPP-weighted world PPP-weighted world real GDP, based on IMF World Economic IMF World Economic Outlook and
[3]
real GDP Outlook data (indexed to 2014 Q4 = 100). Bank calculations.
Oil price Crude Oil-Brent Dated FOB USD per barrel. Thompson Reuters Datastream.
33You can also read