Dynamic mechanical analysis in materials science: The Novice's Tale
←
→
Page content transcription
If your browser does not render page correctly, please read the page content below
Oxford Open Materials Science, 2021, 1(1): itaa001

                                                                             doi: 10.1093/oxfmat/itaa001
                                                                             Advance Access Publication Date: 7 October 2020
                                                                             Review Article

REVIEW ARTICLE

Dynamic mechanical analysis in materials science:
The Novice’s Tale

                                                                                                                                                         Downloaded from https://academic.oup.com/ooms/article/1/1/itaa001/5918362 by guest on 03 November 2021
Sudeshna Patra1,*, Pulickel M. Ajayan2 and Tharangattu N. Narayanan1,*
1
 Tata Institute of Fundamental Research - Hyderabad, Sy. No. 36/P Serilingampally Mandal, Gopanapally
Village, Hyderabad, India and 2Department of Materials Science and Nanoengineering, Rice University,
Houston, TX 77005, USA
*Correspondence address. sudeshnap@tifrh.res.in (S.P.) and tnn@tifrh.res.in or tn_narayanan@yahoo.com (T.N.N.)

ABSTRACT
There are a few useful textbooks and online materials available on dynamic mechanical analysis (DMA) but no short and
succinct article that will be useful for a beginner. Here we are providing a brief introductory overview of DMA, followed by
details of the different types of measurements possible with a typical DMA instrument. Some of the important measures
needing to be taken in these analyses are also summarized, along with the possibilities of designing new experiments with
the help of a DMA instrument. Oscillatory stress/strain-assisted studies of two different types of membranes—a polymer
membrane and a membrane which consists of assembled ultra-thin oxidized graphene flakes—are discussed at the end.
These studies show the vast possibilities of DMA in understanding the different aspects of solids, such as their phase transi-
tions, microstructure, damping, complex interactions in the composite matrix, and also about the mechanical modulus of
the solid membrane. Hence this article discusses the new avenues for DMA in different fields and takes the reader from the
fundamentals to its advanced applicability.

Key Words: dynamic mechanical analysis; graphene oxide; micro-structure; polymers; solid electrolyte, complex modulus.

INTRODUCTION                                                                 deformation per unit length of the material), Compressive modu-
                                                                             lus (measure of the contraction of the material upon a compres-
Dynamic mechanical analysis (DMA) has become an important                    sive force normal to the cross-sectional surface), Shear modulus
materials characterization tool which can unveil the complex                 (the modulus calculated with a force vector parallel to material’s
elastic modulus of solids and thus becomes an inseparable com-               cross section), etc. Understanding the response of solids to dy-
ponent of any materials science laboratory to correlate the struc-           namic stimulus is important in different fields such as paint in-
ture and property of solids [1, 2]. Elastic modulus or modulus of            dustry, adhesive development, plastic hip joints and dental
elasticity is a measure of material’s resistance or response to-             fillings, contact lenses, heart valves, mechanical dampers, air-
wards external stress, where stress is defined as the applied force          bags, etc., to name a few, where the frequency-dependent modu-
per unit cross-sectional area. Elastic modulus is defined as the             lus variations is an important measure. The importance of
slope of the stress–strain curve in the linear response region               frequency-dependent modulus calculations in some of these
(elastic) of the plot. There are different modulus based on the              fields will be clear from the later discussions.
type of deformation, such as Tensile modulus (uniaxial deforma-                   Static force-assisted mechanical studies cannot unravel the
tion normal to the cross-sectional surface of the material, where            complex modulus of a material, though those can give insight
the strain is measured as the change in length due to the                    about the yielding strain (stress) and linear stress–strain

Submitted: 20 June 2020; Revised: 14 September 2020; Accepted: 15 September 2020
C The Author(s) 2020. Published by Oxford University Press.
V
This is an Open Access article distributed under the terms of the Creative Commons Attribution Non-Commercial License (http://creativecommons.org/
licenses/by-nc/4.0/), which permits non-commercial re-use, distribution, and reproduction in any medium, provided the original work is properly cited.
For commercial re-use, please contact journals.permissions@oup.com

                                                                                                                                                1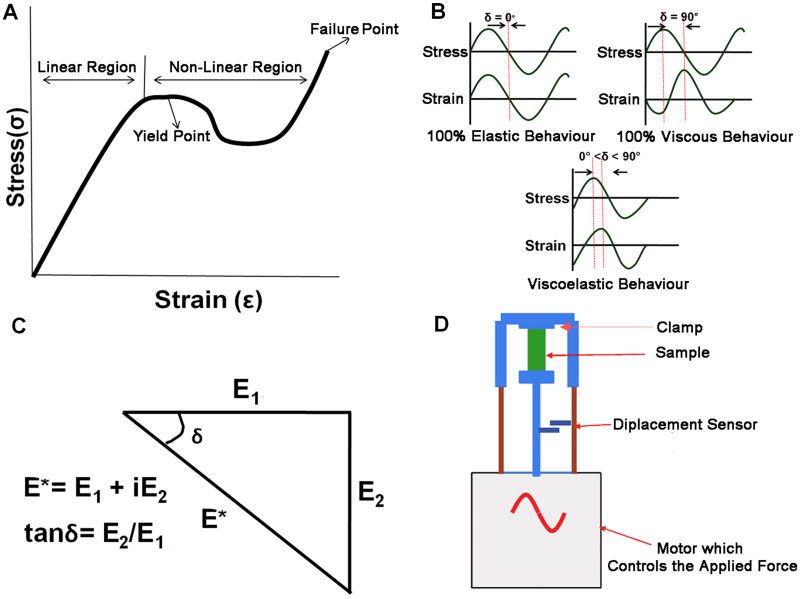
2   | Oxford Open Materials Science, 2021, Vol. 1, No. 1

response of the material. The complex modulus of a material             as DMA from hereafter). DMA-assisted analyses on two differ-
contains both storage (recoverable energy, elastic) and loss            ent materials are shown here: a polymer membrane [polyethyl-
(thermally dissipated, viscous) parts and hence it is a complex         ene oxide (PEO)] which is highly explored as a solid electrolyte
quantity [1]. Evaluation of complex modulus is important to un-         for lithium (Liþ) transportation and a graphene oxide (GO) mem-
ravel the viscoelastic properties of a solid, where no material is      brane, a highly researched macroscopic structure of oxidized
ideally elastic (ideal solid) or viscous (ideal liquid) in nature. As   graphene sheets. Evaluation of the melting temperature (Tm) of
the applied frequency becomes higher, the material becomes              the semi-crystalline PEO membrane is very much essential to
more like a solid (higher storage modulus) and at lower frequen-        find its use as a solid electrolyte and the details of such studies
cies liquid-like (lower storage modulus) behaviour will domi-           using DMA are discussed here. GO membranes have high poten-
nate. Hence the modulus response to the variations in                   tial in various fields, from solid electrolytes to water desalina-
frequencies is an important measure to find the applications of         tion [6, 7], and the intercalated small molecules decide the
solids in different fields. But, the temperature dependency of          mechanical robustness of the film [8]. This article discusses
modulus in contrast, at higher temperatures behaves like a liq-         how DMA is used in understanding the role of intercalated mol-

                                                                                                                                              Downloaded from https://academic.oup.com/ooms/article/1/1/itaa001/5918362 by guest on 03 November 2021
uid. Further, it can also give information about the major and          ecules in mesoscopic membranes such as GO, and explores the
minor (secondary and tertiary) phase transitions in materials           possibilities in designing some novel experiments with different
such as polymers. Such transitions are occurring due to their           modes of a DMA to understand the microscopic structure of GO
inter-molecular rearrangements as a response to the applied             membranes. The advancements in the design and sensitivity of
frequency or temperature. Those minor transitions are quite             the DMA over the last several years are also helpful to explore
difficult to probe with other methods such as differential scan-        its potential in unexplored territories of material’s characteriza-
ning calorimetry (DSC) [3]. Though DMA and DSC reveal quite             tion, and some of such milestones in DMA are briefed in the be-
similar information, both vary significantly depending on the           low section.
analysis, sample preparation, sensitivity, and applied stimulus.            Rheology is the study of deformation and flow of materials,
It is known that mechanical changes are more pronounced than            and its scientific history starts from Poynting’s first attempt to
changes in the heat capacity. DMA can detect the short-range            measure the elasticity of a material using oscillatory experi-
motion more efficiently and the onset of chain motion implies           ments, dated back in 1909 [9]. Such interests gradually trans-
temperature transition. Studies on those phase transitions are          lated in making commercial instruments to measure the
discussed in the later part of this article. But such phase transi-     ‘normal force’ and the Weissenberg rheogoniometer was one
tions of materials with frequency are important to be studied in        such initial attempt in this venture [10]. Moreover, such devel-
fields they are being used. For example, airbag works at ex-            opments in the instrumentation of mechanical properties using
tremely high frequencies (10,000 Hz) and the material made of          oscillatory forces had helped to develop theories on polymer
such airbags should have a glass transition frequency higher            viscoelasticity. Among sporadic efforts in the instrumentation,
than this operational range. In such cases, studies such as di-         the modern age of DMA has been started in the year of 1966
electric relaxation spectroscopy (DRS) will be highly useful. In        when J. Gilhams first developed the Torsional Braid Analyzer
case of paints, the coating should be able to withstand the same        [11]. It was DuPont and Perkin-Elmer credited for the develop-
level of deformation its substrate is undergoing without peeling        ment of a controlled stress analysers in the early 1980s [1].
off or crack. Hence viscoelastic studies on paints are also essen-      Current DMA technology has been evolved to measure the
tial to obtain the optimum paint formulations.                          strain of as small as 1 nm with a load (force) range of 0.0001N–
     DMA can also be used to study composites and mixtures,             18 N in a wide temperature range (say 150 C–600 C), in
and the complex interactions among their constituents. Though           different humid conditions, and can mimic the mechanical
most of the materials respond elastically or inelastically to the       relaxations of solids in different environments [12]. Hence the
applied stress, repeated loading can lead to the mechanical fa-         present DMA based experiments can simulate the real-time per-
tigue. For example, biological systems such as bones and tissues        formance of materials [13]. For example, an advanced tool
get stiffen with recurring elastic stress [4]. Though most of the       in DMA has the ability to conduct dynamic mechanical studies
synthetic materials do not have this property, certain compo-           in liquid environment. They can be used to study or simulate
sites matrices such as poly(dimethylsiloxane) impregnated to            the performance of biological membranes in actual physiologi-
vertically aligned carbon nanotubes show such self-                     cal conditions. Here the use of such methods in identifying the
strengthening under cyclic loading [4]. This has been proven as         microscopic structure GO membrane is discussed towards the
a result of complex interactions between matrix materials and           end.
nanostructures. Such active materials can lead to the develop-
ment of adaptable structural materials and artificial biological
tissues and bones, and DMA is an efficient method to unravel            EXPERIMENTAL
stress or strain hardening or softening due to cyclic loading
                                                                        Basic working principles
[4, 5]. Hence DMA is highly resourceful in different fields where
materials properties are assessed in terms of operational tem-          The viscoelastic behaviour of a material needs to be evaluated
perature, load, frequency, other external parameters, and inter-        as a function of time, temperature, and frequency [14]. In a
material interactions.                                                  DMA, typically a sinusoidal oscillatory force is applied to the
     This article discusses some of the essential knowledge one         material and the resulting deformation or strain is measured in
has to start dealing with DMA and introducing different modes           response to the applied stress in the linear viscoelastic region of
of operation and methods available in a DMA instrument. The             the material. Hence it is important to note that the linear re-
methods and principles discussed here are common to any                 sponse of the material has to be evaluated before advancing to
DMA instrument make, though some of the photographs shown               the dynamic force (strain) based experiments. Further, the am-
in the later sessions are taken from that of TA Q800. Last part of      plitude of the dynamic perturbation should be so small that it
the article includes some of the interesting experiments                should not go beyond the linear Hookean region of the material.
designed with this analyser (DMA, the instrument is also named          Hooke’s law states that strain in a material is proportional to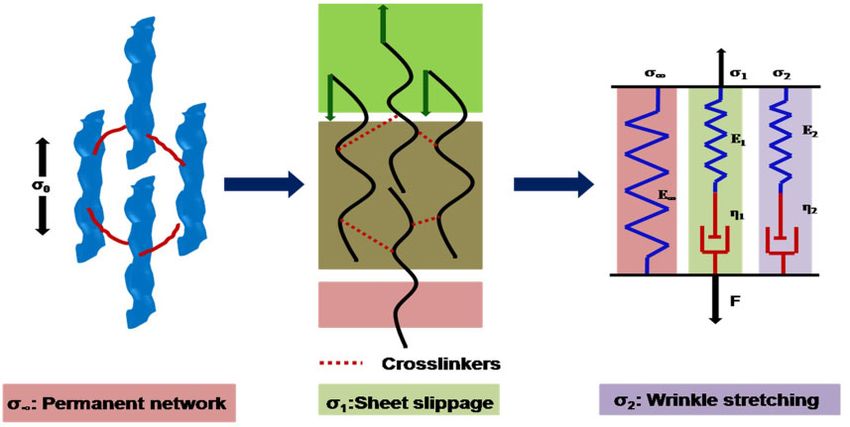
Patra et al.   |   3

the applied stress within the elastic limit of the material. This                           Here the stress component r0 cos d is in phase with strain
has been schematized in Fig. 1A. This is analogues to other                             while stress component r0 sin d is out of phase with the strain
types of dynamic measurements such as DRS or linear electro-                            by a phase angle of p/2 rad. Hence the dynamic modulus which
chemical impedance spectroscopy (EIS), where the applied al-                            is in phase with the strain is,
ternating voltage should lie within the linear current–voltage
                                                                                                                               cos d
characteristics of the material [15]. DRS studies are important in                                                   E1 ¼ r0         . . . :ð4Þ
                                                                                                                                e0
characterizing the materials phase transitions in large fre-
quency windows where DMA has limitations, as stated before.                                 It is called storage modulus and it measures the stored en-
EIS is a potential tool in electrochemistry to quantify different                       ergy and represents the elastic portion.
parameters namely ionic conductivity, corrosion, catalytic                                  Dynamic modulus which is p/2 rad out of phase with the
charge transfer efficacy, etc.                                                          strain is,
    The response of the material to the dynamic stimulus will
                                                                                                                               sin d
not be in-phase with the stimulus in case of a viscoelastic mate-                                                    E2 ¼ r0         . . . :ð5Þ
                                                                                                                                e0

                                                                                                                                                                             Downloaded from https://academic.oup.com/ooms/article/1/1/itaa001/5918362 by guest on 03 November 2021
rial. The phase difference is 0 for a perfectly elastic material,
90 for a pure viscous material, and intermediate for a viscoelas-                         It is called loss modulus and it measures the energy dissi-
tic material, as shown in Fig. 1B. Hence by evaluating the phase                        pated as heat, represents the viscous portion.
lag (d), one can calculate the material’s properties such as the                           Hence Equation (3) can be written as,
ability to flow (viscosity) and the stiffness (modulus) from
                                                                                                          r ¼ e0 E1 sin ðxtÞ þ e0 E2 cos ðxtÞ . . . :ð6Þ
recovery.
    Let us assume that the strain lags by a phase angle d. In gen-
                                                                                        and loss factor tan d is defined as (which is depicted in Fig. 1C):
eral, for a viscoelastic material, strain is defined as,
                                                                                                                                E2
                                                                                                                      tan d ¼      . . . :ð7Þ
                             e ¼ e0 sin xt . . . :ð1Þ                                                                           E1

where x ¼ angular frequency, (rad/s), 2pf Then, stress                                       The complex modulus is defined as,

                                                                                                                     E ¼ E1 þ iE2 . . . :ð8Þ
                          r ¼ r0 sin ðxt þ dÞ . . . :ð2Þ

                                                                                        or
or
                                                                                                                     r0
                                                                                                                E¼      ð cos d þ isindÞ . . . :ð9Þ
              r ¼ r0 cos d sin ðxtÞ þ r0 sin d cos ðxtÞ . . . :ð3Þ                                                   e0

Figure 1: (A) A typical stress–strain curve of a polymer obtained via controlled force mode, (B) the dynamic stress–strain curves of different materials namely, elastic,
viscous, and viscoelastic [1]. (C) Representation of complex modulus: real (E1) and imaginary (E2) parts of modulus and loss tangent [1]. A simple block diagram of a typ-
ical DMA is shown in (D). The displacement sensor will be either a linear variable differential transformer-based detector or an optical encoder having high-precision
displacement measurements over a large range.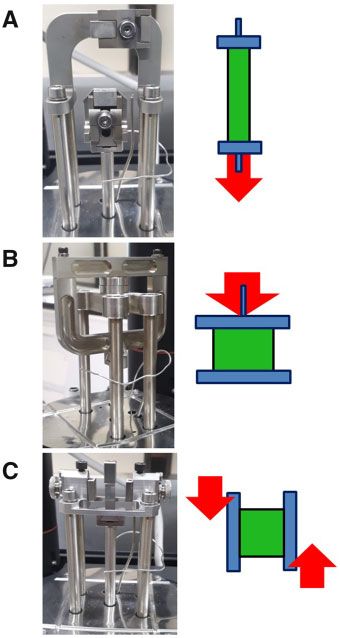
4   | Oxford Open Materials Science, 2021, Vol. 1, No. 1

    A block diagram of a typical DMA is shown in Fig. 1D. The
sample placed in a holder (clamp) is shown in green and the dy-
namic force is applied using a force motor. The displacements
are measured using linear variable differential transformer or
optical encoders having high-precision in measuring linear dis-
placements over a wide range. Details of different types of
modes and methods available are discussed in the following
sections.
    With this background, the different modes of DMA can be
discussed now, where the mode of operation will decide the un-
veiled component of the modulus (E/E1/E2 or tan d). It has to be
noted that temperature is an important parameter in deciding
the mechanical properties of materials, particularly soft materi-

                                                                                                                                                         Downloaded from https://academic.oup.com/ooms/article/1/1/itaa001/5918362 by guest on 03 November 2021
als such as polymers, and hence the sample (chamber) needs to
be kept at a constant temperature (if not it is a temperature
sweep experiment) before conducting the different modes dis-
                                                                    Figure 2: Schematics of (A) multi-frequency stimulus and (B) multi-stress/strain
cussed below. The failure in ensuring the temperature stability
                                                                    modes stimulus, to evaluate the complex modulus of a material to be tested
can cause large deviations in the frequency-dependent me-           [12]. (C) The schematic of the dynamic response of a material in the linear visco-
chanical measurements since temperature is another control          elastic region. The hysteresis is evident from the loading-unloading study per-
parameter in deciding the elastic modulus of the material, as       formed unlike that is seen in Fig. 1A that represents only loading.
discussed before. The temperature ramp rate is also important
in temperature sweep experiments. The temperature ramp is           affect the phase transition temperatures in a broad range.
an important parameter in deciding the curing behaviour of          Normally such experiments are conducted in 1 Hz. The fre-
thermosetting resin where the minimum viscosity obtained can        quency range of DMA Q800 is 0.1–200 Hz and hence it can probe
be varied with the temperature history and ramp. Increasing         the three decades variation in properties of a material and most
the rate of temperature decreases the minimum viscosity             of the applications of materials lie in this range, except cases
attained and the resin gets softer faster. But it can also make     such as airbag operation [1]. Resonance of a material with the
the curing faster and the degree of flow depends on the type of     instrument is another issue with frequency-based experiments
mould used and the amount of pressure applied. Hence temper-        where it can affect the modulus calculations. Such issues are
ature ramp rate needs to be optimized depending upon the use        discussed in detail elsewhere [1], and hence not elaborating
of the material concerned and a typical temperature ramp used       here.
is 10 degrees/minute. There will be two thermocouples associ-
ated with DMA, where one measures the chamber temperature
                                                                    Multi-stress/strain.
and the other measures the samples. The alignment of these
                                                                    In this mode, frequency and temperature are held constant. The
thermocouples prior to the experiment is very important in the
                                                                    stress/strain is assessed with varying strain/stress (Fig. 2B). The
measurement procedure. Furthermore, the mechanical proper-
                                                                    linear viscoelastic (Hookean) region can be predominantly iden-
ties can also get affected by other external parameters such as
                                                                    tified using this mode.
humidity (if not it is a humidity-controlled experiment where it
has to be monitored systematically) and hence a closed cham-
ber experiment is always recommended to get reproducible            Controlled force/strain rate.
modulus parameters and phase transition temperature.                In this mode, stress or strain is ramped at a constant rate while
Humidity controlled experiments are particularly important          temperature is held constant. This mode is utilized to explore
while dealing with hygroscopic samples such as PEO and GO,          stress/strain plot to obtain absolute modulus values (as shown
two materials discussed in the last part of the article.            in Fig. 1A). Alternatively, stress can also be held constant while
                                                                    strain is monitored with a temperature ramp.
                                                                        The Young’s modulus is calculated from the initial linear
Modes of operation                                                  portion of the curve. After that, it is entering the plastic region
DMA can be operated in different modes with different control       until failure. The integrated area under the curve is the energy
parameters.                                                         needed to break the material and is designated as toughness of
                                                                    the material [16].
Multi-frequency.
The multi-frequency mode (Fig. 2A) can evaluate stress/strain       Iso-strain mode.
variations as a function of frequency while oscillation ampli-      In this mode, strain is held constant during a temperature
tude is kept constant.                                              ramp. Iso-strain can be used to evaluate shrinkage force in films
   These tests can be run at single or multiple frequencies in      and fibres [12].
temperature ramp, time sweep or temperature step/hold
experiments. It helps to determine glass transition (Tg) and        Creep–recovery.
melting temperatures (Tm) of a polymer material [12]. But it has    Creep recovery test is one of the most rudimentary tests to
to be noted that in single-frequency temperature scan experi-       study the relaxations of materials such as polymers [17]. Creep
ments to find the phase transition temperatures, the selection      testing is performed by applying a constant stress to the sample
of frequency is an important parameter. As stated before, at        and the deformation is monitored as a function of time (Fig. 4A).
higher frequencies, the material becomes more solid-like and at     After the removal of stress, the material is allowed to relax,
lower frequencies liquid-like behaviour will be dominating.         which is called a recovery test. These two tests are often exe-
Hence, a large scale variation in the operational frequency may     cuted sequentially. The ratio of the time-varying strain and the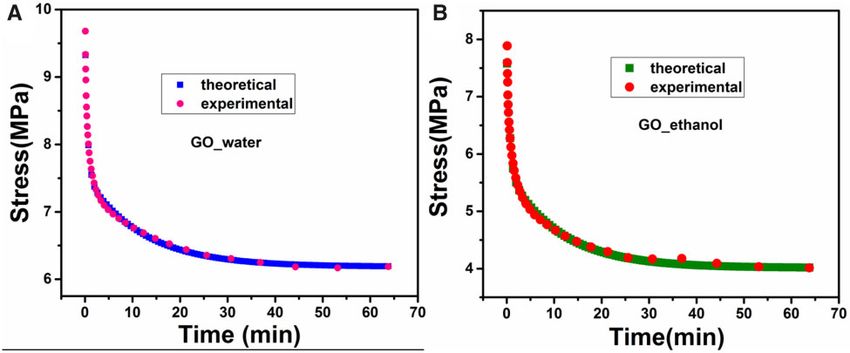
Patra et al. | 5
Downloaded from https://academic.oup.com/ooms/article/1/1/itaa001/5918362 by guest on 03 November 2021
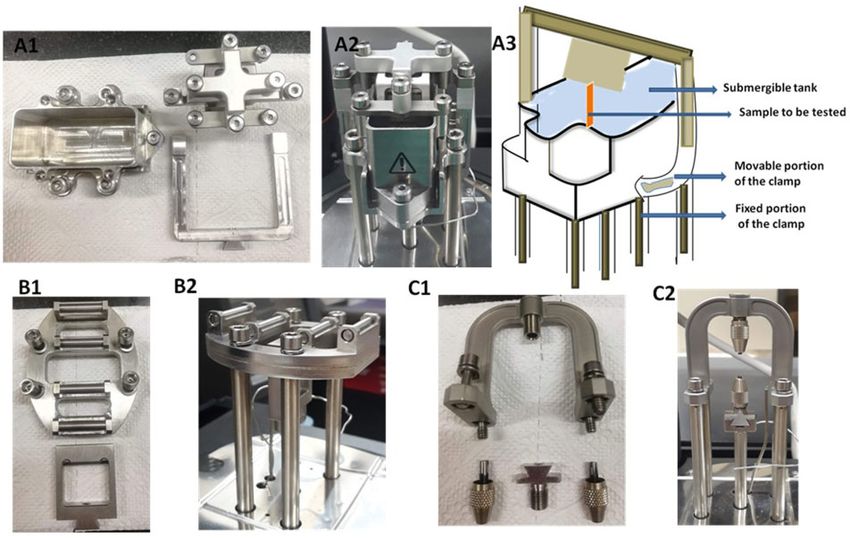
Figure 3: (A) The applied stress curve and resulting strain curve in a typical creep recovery test. The strain curve shows distinct regions of behaviour. Creep–recovery
experiments allow the determination of properties at equilibrium like modulus and viscosity. These values allow the prediction of material behaviour under conditions
that mimic real-life applications. (B) The applied strain and the resultant stress curve in a typical stress–relaxation experiment [1].
constant stress is called the creep compliance (inverse of
stiffness):
eðt Þ
Ccreep ðtÞ ¼ . . . :ð10Þ
r0
An ideal creep–recovery curve (Fig. 3A) manifests four dis-
tinct region: (i) initial deformation, (ii) a transition zone,
(iii) equilibrium region and (iv) the recovery region. Multiple
creep–recovery cycles are also performed to check whether the
properties of the sample deteriorate over cycles or not.
The creep–recovery cycle has the advantage to simulate the
real-life circumstances with utmost accuracy because of two
reasons:
i. Creep–recovery cycle can be repeated multiple times.
ii. The variation in temperature is independent of stress.
Creep experiments can be executed over a variety of sam-
ples, where the deformation mode can be chosen based on its
modulus and viscosity. Here the sample geometry is not at all a
constraint. In general, the total strain is the summation of three
distinct parts [18], namely:
i. the immediate elastic deformation e1
ii. the delayed elastic deformation e2
and
iii. the Newtonian flow e3 similar to the deformation of a vis-
cous liquid which obeys Newton’s law of viscosity.
The magnitudes of applied strain e1 , e2 , and e3 are directly
proportional to the magnitudes of the applied stress. So a creep
Figure 4: Photographs of some of the test modes (clamps) in DMA such as (A) ex- compliance can be designated as [18],
tension (tension), (B) compression, and (C) shear. Schematics of the functioning
of respective clamps are shown in their right. Here the green part represents the
eðtÞ
sample needs to be tested. The top part represents the stationary clamp in ten- JðtÞ ¼ ¼ J1 þ J2 þ J3 . . . :ð11Þ
r
sion clamp and the bottom one is the moving clamp. In this compression clamp,
top part is the moving part of the clamp. In the shear sandwich clamp, the mid-
dle portion in the photograph (C) is the moving part. where, J1 , J2 , and J3 are parallel with, e1 , e2 , and e3 .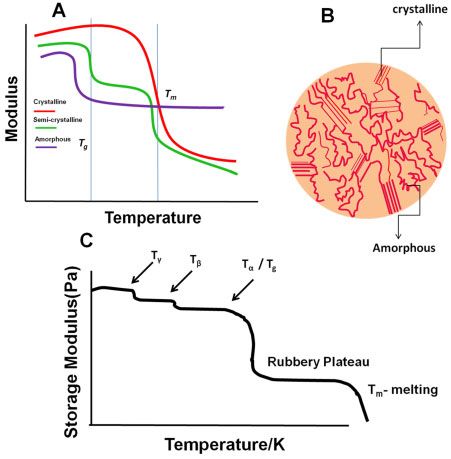
6   | Oxford Open Materials Science, 2021, Vol. 1, No. 1

Stress relaxation                                                      moveable plate (Fig. 4F). This mode is suitable for gels, high vis-
Stress relaxation is conceptually the reverse of creep recovery        cosity resins, adhesives, and highly damped materials.
test. Here the strain is held constant and the stress is recorded
as a function of time (Fig. 3B). Stress relaxation modulus is de-      Submersible clamps. This mode enables samples to be analysed
fined as [1],                                                          in a submersible clamp equipped with a liquid environment,
                                                                       where the measurements can be conducted in different temper-
                                   rðtÞ                                atures up to the evaporation temperature of the liquid being
                          GðtÞ ¼        . . . :ð12Þ
                                    e                                  used (Fig. 5 A1, A2 and A3). The presence of surrounding fluid
                                                                       medium can affect the mechanical properties of membranes
    In the absence of viscous flow, the stress decays to a finite      (biological membranes to solid electrolytes) and this clamp will
value. The area under the stress–relaxation curve plotted as E(t)      help to understand such properties in in vitro conditions. One
versus t is the viscosity, where E(t) is the stress–relaxation mod-    such study is discussed in the later part.
ulus. At very low strain, the viscosity of a colloid can be mea-           There are other modes associated with DMA such as dual/
sured without ruining its structure. This is one of the

                                                                                                                                             Downloaded from https://academic.oup.com/ooms/article/1/1/itaa001/5918362 by guest on 03 November 2021
                                                                       single cantilever (for the measurement of thermoplastics and
compelling implications of the stress–relaxation experiment.           highly damped materials), three-point bend modes (for study-
Creep and stress relaxation data are complimentary, and can be         ing stiff and flexible samples), etc. It has to be noted that the
related as [1],                                                        choice of a clamp is very crucial in the measurement. Thin sam-
                                                                   ples can be tested in tension mode with great accuracy. More
                 et          r0                                        than 1 mm thicker samples prefer to be measured in bending
                                                . . . :ð13Þ
                 e0 creep    rt stressrelaxation                       mode, while gels and weak elastomers are perfect for compres-
                                                                       sion clamp.
    The relaxation studies also help to understand the molecu-             The clamps need to be properly calibrated before each exper-
lar structure of the solid and hence will be helpful in molecular      iment. There are different calibrations needed to be performed
modelling. One such study with GO membranes is shown in the            for different clamps (it may vary depending on the clamp, and
later part of the article.                                             details will be available with the concerned make’s DMA instru-
    Different types of clamps are available in DMA and the na-         ment operation manual) and this includes mass, position, etc.
ture of the clamp decides the nature of modulus exploring.             of the concerned clamp. Successful calibration should be en-
Such different clamps available and the sample requirements            sured prior to the experimental procedure in order to ensure the
(type and dimensions of the sample) are discussed below.               reliability of the data. Further, the dimensions of the sample
                                                                       need to be accurately measured prior to the experiment and
                                                                       should be clamped with the proper tightening.

Different methods in DMA experiment
There are different types of experimental modes in DMA
                                                                       DISCUSSIONS
depending upon the type (dimension and geometry) of sample             DMA-based studies can be conducted to monitor strain/stress
and modulus (Young’s modulus, Shear Modulus, Bulk modulus,             variations in solids with different control parameters such as
etc.) needs to be determined. These different modes use differ-        stress/strain, frequency, temperature, humidity, etc. Table 1
ent types of clamps for mounting the samples. Schematic of             summarizes some of the important DMA test modes, the ex-
those clamps and their functioning are shown in Fig. 4. One end        tractable parameters from these modes, and the physical signif-
of the clamp (blue parts in the figure) is fixed and the other end     icance of the results. The basic principles behind each of these
moves according to the programmed methodology of the mea-              modes are already given in the experimental section. Some of
surement. It has to be noted that the modulus determination            these modes and their analyses are discussed with specific
needs the dimensions of the sample and hence properly shaped           examples briefed in the following sections.
samples are important in all the different clamps. Different
clamps and their functions are briefed below.
                                                                       DMA analyses of membranes
Tension. Thin films are normally tested with this clamp where          Now we will be discussing the DMA-assisted studies on two dif-
Young’s (complex modulus having real and imaginary parts)              ferent types of samples: (i) a semi-crystalline polymer–PEO thin
modulus can be unravelled. In this clamp, the sample is kept in        film and (ii) GO membranes developed via vacuum-assisted as-
tension (with a small preload to make sure the absence of any          sembly process from the GO dispersions. The detailed synthesis
wrinkles/folding/air gaps) between a fixed (top part) and mov-         will be discussed later [19].
able clamp (top, Fig. 4D). Solid electrolyte membranes, GO mem-            Polymers undergo different types of transition, depending
branes, polymer membranes, etc. can be studied using this              on the nature of the polymer, extent of cross-linking, and mo-
clamp. Fibres can also be tested with this particular clamp,           lecular assembly. Crystalline polymers show latent heat in-
though a separate fibre holding clamp is also available.               volved transition at their melting (melting temperature, Tm) and
                                                                       the melting drastically lowers the storage modulus of the mate-
Compression. This clamp is useful for compressive modulus              rial. Hence DMA can be used to identify this phase transition in
studies with thicker samples. In this mode, the sample (a cylin-       polymers, either via temperature sweep (Fig. 6) or frequency
drical) is placed on a fixed flat surface and force is applied by an   sweep. Amorphous polymers will have a lower modulus value
oscillating plate (Fig. 4E). Compression mode is applicable for        (than crystalline ones) and they undergo a glass transition (Tg)
low to medium modulus materials.                                       from their glassy to rubbery nature with a subsequent decrease
                                                                       in the modulus (Fig. 6). It can be considered as a second-order
Shear sandwich. In shear-sandwich mode, two identical pieces of        phase transition while the melting transition is first order.
the same sample of equal size are sheared between a fixed and          Semi-crystalline polymers have both crystalline and amorphous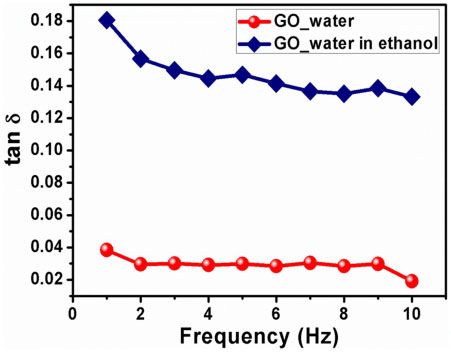
Patra et al.    |   7

                                                                                                                                                                     Downloaded from https://academic.oup.com/ooms/article/1/1/itaa001/5918362 by guest on 03 November 2021
Figure 5: Photographs of (A1 and A2) submersible tensile clamp. (A3) Schematic of a submersible clamp showing different regions. Photographs of (B1 and B2) three-
point bending and (C1 and C2) fibre tension clamp (from left to right), respectively, in DMA Q800.

Table 1: Summary of different test methods available in a DMA and the deducible information

Test                                                                      Result                                               What does it convey

Static stress–strain (Fig. 1A)                  Slope                                                               Young’s modulus
                                                Yield point                                                         Strength before distortion
                                                Yield strength                                                      Load capacity
                                                Proportional limit                                                  End of linear region
                                                Ultimate strength                                                   Strength at breaking point
                                                Elongation at break                                                 Ductility
                                                Area under curve                                                    Toughness
Dynamic stress–strain (Fig. 2)                  Dynamic proportional limit                                          End of linear region
                                                Storage/loss modulus                                                Stiffness as a function of load
                                                Complex viscosity                                                   Flow under dynamic load
                                                Tan d                                                               Damping
Creep recovery (Fig. 3A)                        Equilibrium compliance modulus                                      Long-term behaviour
                                                Creep compliance                                                    Effect of load
                                                Creep rupture                                                       Strength
                                                Relaxation spectra                                                  Molecular modelling
Stress relaxation (Fig. 3B)                     Compliance and modulus                                              Long-term behaviour, molecular weight,
                                                                                                                       cross-links, and entanglements
Dynamic temperature scan                        Storage and loss modulus                                            Change in stiffness
                                                Complex viscosity                                                   Change in flow
                                                Tan d                                                               Damping
                                                Temperature of transitions as drop of peaks (Fig. 6)                Tm, Tg, Tb, Tc

regions (as schematized in Fig. 6B) with intermediate modulus                           bending, stretching (localized bond movements), and side-
values, and hence have both the transitions. High-molecular                             chain movements. This corresponds to the Tc transition. The Tb
weight PEO (600 kDa in the present case) is a semi-crystalline                          to the movement of whole side chains and localized groups
polymer.                                                                                comprised four to eight backbone atoms. With the continual
   More precisely, the modulus variation with the secondary                             heating, the amorphous region starts to develop large-scale co-
transitions (c and b) is shown in Fig. 6C. As the material is                           ordinated motion. It represents a major transition in polymer as
heated, the free volume increases, resulting in the initiation of                       the material enters into a rubbery state from a hard glassy state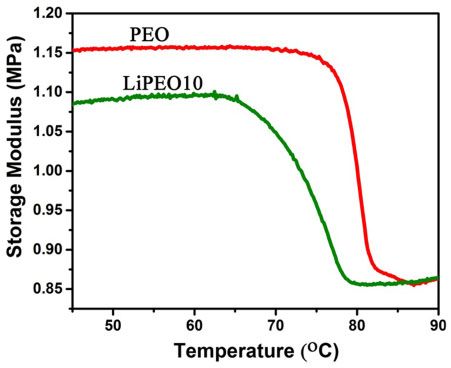
8   | Oxford Open Materials Science, 2021, Vol. 1, No. 1

                                                                                                                                                                      Downloaded from https://academic.oup.com/ooms/article/1/1/itaa001/5918362 by guest on 03 November 2021
                                                                                    Figure 7: Shift of crystalline melting temperature of PEO with the inclusion of
                                                                                    LiClO4 salt (monitored through DMA) [22]. This experiment is conducted with
                                                                                    the experimental mode (dynamic temperature scan) given in Table 1.

Figure 6: (A) Schematic representation of phase transitions in different types of   DMA studies on PEO membranes
polymers. Some of the polymers show initial enhancement in modulus followed         Details of the PEO membrane preparation can be seen else-
by a plateau. Further enhancement in temperature will drastically decrease the      where [20]. PEO films of thickness 0.01 mm, length 6 mm,
storage modulus at their corresponding transition temperature. (B) Schematic        and width 5.3 mm are made via proper cutting from a larger
drawing of a semi-crystalline polymer depicting different regions. (C) Various
                                                                                    film. The storage modulus variations in pure PEO (at a fre-
molecular transitions of a semi-crystalline polymer in a temperature scan [1].
                                                                                    quency of 1 Hz) with temperature (ramp 2 C) are shown in Fig. 7
                                                                                    (dynamic temperature scan mode from Table 1 is used here). It
                                                                                    can be concluded that the transition temperature is  74 C
with a drastic change in modulus (Tg). One has to keep in mind                      (found from the storage modulus drop in accordance with the
that glass transition only happens in amorphous material while                      discussion in the previous section) and it matches well with the
a 100% crystalline material will never give a Tg. As discussed be-                  reported values [21]. One of the important applications of PEO is
fore, the frequency has a high influence on the Tg measure-                         as a solid electrolyte for lithium (Li) ion transport. We have de-
ments as it has a contrary influence on the viscous and                             veloped a solid electrolyte of PEO and Li salt having a low con-
elasticity parts of the material [1].                                               tent of Li ions [20]. The inclusion of Li salt in this high dielectric
    Frequency scan in DMA has limitations of small range and                        constant PEO matrix solvate the Li ions and this shifts the Tm of
hence measurements beyond the range of instrument become                            the PEO, as shown in Fig. 7 (LiPEO10) [22]. The microstructure
difficult as mentioned in case of air bag’s characterization. One                   imaging of the membrane [one such Li incorporated membrane
of the ways is to adopt other similar phase transition study                        (LiPEO10)] using scanning electron microscope (SEM) is shown
tools (say DRS) or there are methods available in DMA itself to                     in Fig. 8A, where the details of the experiment are described
address such issues. One such method is time-temperature su-                        later [23]. The spherulitic parts represent the crystalline por-
perposition (TTS) which is being extensively used to overcome                       tions and it can be seen that the PEO has large number of spher-
such difficulties associated with DMA [1]. TTS principle is used                    ulites with a very small separation among them. The same film
to evaluate temperature-dependent mechanical attributes of                          is then subjected to a tensile stress beyond its yielding point (in
linear viscoelastic materials from already known properties at a                    the necking region, the non-linear region in stress–strain curve
reference temperature. The complex viscosity curve is collected                     before the film failure) and further imaging of the same film is
from a series of frequency scans at different temperatures and                      shown in Fig. 8B, details are published elsewhere [23]. It can be
then added together to obtain a master curve. It is known that,                     seen that spherulitic parts got separated and an intermediate
in general, the elastic modulus of a material, say an amorphous                     amorphous region has been developed.
polymer, increases with loading rate (frequency) while it                               This microstructural deformation has after-effects in ionic
decreases with temperature. The plots of instantaneous elastic                      (Li) conductivity of the PEO based solid electrolytes [20], but here
modulus as a function of time will not change the shape (nature                     we want to emphasize that the external stress can affect the mi-
of change) but appears only to shift left or right depending on                     crostructure of soft materials such as polymers and hence can
whether the temperature is lower or higher. Hence a master                          affect their physical properties. The stress within the linear
curve at a given temperature can be used as the reference to                        stress–strain region will not affect the crystallite spherulitic
predict curves at various temperatures by applying a shift oper-                    arrangements. In other words, the polymer relaxes to the origi-
ation and this is the underlying principle in TTS. Various mod-                     nal structure soon after the removal of external stress and
els have been developed to calculate this shift, though the                         hence is found to be not affecting the ionic conductivity of the
superposition also may not work in all materials in a broad                         film [23]. The dynamic modulus of the film, as discussed before
range [1]. Still, TTS is being considered as one of the potential                   for Tm measurements, is measured with an oscillatory stress
tools to extend the range of DMA measurements and exten-                            value of 0.01 MPa and the pre-load applied was 0.001 N.
sively being used in polymer science, and more details can be                           The in situ variations in the ionic conductivity with dynamic
seen elsewhere [1].                                                                 external stress can give further insight in to the microstructural
Patra et al. | 9
Downloaded from https://academic.oup.com/ooms/article/1/1/itaa001/5918362 by guest on 03 November 2021
Figure 8: SEM images of lithiated PEO (LiPEO10) (A) before and (B) after tensile stretching [23]. The semi-crystalline spherulites in Fig. 8A have displaced due to the ten-
sile stretching (Fig. 8B).
variations in the membrane, and such experiments can be
designed with DMA along with the coupling of optical spectros-
copy or Raman scattering. Such in situ electrochemical and
mechano-optical studies will be highly useful not only in study-
ing the materials properties but also in the bulk characteriza-
tion of the membranes for their applications, but not many
studies have undergone in these aspects.
Mechanical analyses on GO membranes
GO membranes are large-scale structures of ultra-thin GO flakes
of several nanometre lateral width and they form randomly
arranged macro-scale structures while assembling them via
flow-assisted membrane-based vacuum filtration [24]. Their
mechanical strength is mainly governed by the inter-flake hy-
drogen bonding interactions and also due to the hydrogen
bonding with other intercalated molecules such as water [25].
Such membranes are found to be viscoelastic in nature [26], and Figure 9: The tan d variation of the GO_water measured in a submersible clamp
their viscoelasticity can be largely tuned by the intercalated of DMA, with and without ethanol [19]. These data are conducted with the ex-
molecules [19]. In one such study, we had shown that removal perimental mode (dynamic stress–strain) explained in Table 1.
of water from GO membrane was achieved using a solvent dry-
ing technique and the intercalated ethanol used for the water
removal has enhanced the viscoelasticity of the membrane sev- in deciding the net viscoelastic properties of the membranes.
eral times [19]. Apart from the dynamic studies of individual Such studies are important in studying the mechanical proper-
membranes [GO_water (original membrane) and GO_ethanol ties of biological membranes too where they have to expose in
(after the removal of loosely bound water inside the GO_water to different physiological fluids of different surface tension [27].
membrane)], we have carried out in situ measurements of sol- Their properties can be simulated with these of in vitro
vent extraction and the resultant enhancement in the visco- experiments.
elasticity (tan d value) using a submersible clamp-assisted Another advantage of DMA is the possibility of molecular
experiment. Schematic of the experiment and the result are structure modelling of solids using relaxation studies. Here we
shown in Figs 5 A3 and 9. are reporting such an interesting study on two different mem-
In the experimental procedure, frequency sweep with branes: GO_water and GO_ethanol, which helped to develop a
GO_water in air is conducted with the submersible tensile molecular model of those macroscopic GO membranes.
clamps and the tan d variation is monitored. Further, the tank is As discussed before, stress relaxation of a solid is an essen-
filled with ethanol (99.9%) without disturbing the GO_water at- tial characteristic of any structural material where it governs
tached to the tension clamp. A frequency sweep is conducted the dynamic load bearing capacity [28, 29]. It is the time-
again after equilibrating the system at 29 C for 5 min [19]. It has dependent decrease in stress in response to a constant strain. It
been observed that GO_water in ethanol has a higher tan d than has been shown that the stress relaxation behaviour of
that of its original values in all the sweep frequencies and these graphene-based membranes fits well with a modified Maxwell–
values match with those of GO_ethanol, where the GO_ethanol Wiechert model where the interlayer cross-linking is mainly re-
is synthesized by flow-assisted filtration of ethanol sonicated sponsible for the stress relaxation phenomenon [28]. A polymer
GO followed by diethyl ether washing [19]. These experiments viscoelasticity can be depicted by a simple Maxwell–Wiechert
show that loosening the hydrogen bonding network inside GO model where a dashpot and a spring are combined to model the
membranes by controlling the water content has a critical role viscous and elastic portion of the material, respectively, as10 | Oxford Open Materials Science, 2021, Vol. 1, No. 1
shown in Fig. 10. The stress–relaxation behaviour according to the stress was found to be relaxed to 63% of its initial value and
Maxwell–Wiechert model can be illustrated as [28], this relaxation retention for GO_water is found to be signifi-
cantly higher than that of GO_ethanol (stress retention is
50%), which indicates higher cross-linking in GO_water
rðtÞ ¼ r0 et=s . . . :ð14Þ
(Fig. 11). Further fitting this relaxation behaviour with Maxwell’s
model helps to find the different parameters namely, A1 ,A2 , A1 ,
where r0 is the initial applied stress at the beginning of relaxa-
etc., in which the model is found to be exact with the observed
tion and s is the characteristic relaxation time.
relaxations behaviours of the membranes. The fitting shows
The GO membrane has a multilevel lamellar structural
that that A1 and A2 term for GO_water is lower than the
framework, similar to other reported graphene membranes [28],
GO_ethanol whereas A1 is higher for GO_water indicating
hence a ternary Maxwell–Wiechert model has been proposed
stronger cross-linking in GO_water (the data are summarized in
instead of simple model. It is the combination of a spring paral-
Table 2). Hence this stress relaxation also provides enough evi-
lel with two Maxwell series units, as shown in Fig. 10. This mod-
dence for higher viscoelasticity of GO_ethanol, as observed by
ified model describes stress relaxation by the following
Downloaded from https://academic.oup.com/ooms/article/1/1/itaa001/5918362 by guest on 03 November 2021
other dynamics studies reported elsewhere, but along with the
equation,
molecular (micro) structure of the GO membranes. Hence DMA
brings a plethora of opportunities in studying the properties of
rðtÞ ¼ r1 þ r1 et=s1 þ r2 et=s2 . . . :ð15Þ
solids with different modes, methodologies, and clamps.
where r1 is the residual stress for the spring. r1; r2 and s1, s2 are
initial stresses and characteristic relaxation times of each CONCLUSIONS
Maxwell unit, respectively. When the Equation (15) is divided by
This article discusses the basics of DMA, where it is identified as
r0 , one can get the following equation,
an unavoidable materials characterization tool to explore
structure-property analyses. The basics of DMA are discussed in
AðtÞ ¼ A1 þ A1 et=s1 þ A2 et=s2 . . . :ð16Þ the initial part, followed by different types of static and dynamic
measurements possible with a DMA instrument in depth.
where, Samples of different dimensions and shapes can also be tested
A1 ; A1 ; A2 represent r1 =r0 100%, r1 =r0 100%; r2 =r0 using DMA, where different types of clamps and modules of a
100%, respectively. typical DMA instrument are discussed with their detailed
Each term has its characteristic significance: A1 the term usages. Nowadays most of the dynamic mechanical analysers
depicts the graphene piled network with sufficiently high are computer-guided, and procedures and precautions, such as
strength which acts as the opposing force against slippage and temperature and humidity control, preload force, amplitude of
relaxation. The A1 corresponds to the laminates which are easy dynamic stimulus, etc., taken during the measurements, can
to flow. The A2 denotes the stretchable wrinkles in the graphite highly affect the results. Finally, two types of membranes are
network. So, it is quite obvious that the A1 and A2 parts must be discussed for studies using DMA. First, it is a semi-crystalline
immobilized by escalating the interlayer attraction. Thus the polymer (PEO) membrane, where the melting temperature is
viscous flow between adjacent nanosheets of the graphene ma- shown to be extractable from the dynamic measurements. The
trix regulates the stress relaxation. The increased interlayer at- effect of introducing lithium salt into this PEO is shown further,
traction decelerates sheet slippage and hence restrains the which affects the melting transition, where it can be traced us-
stress relaxation. The stress relaxation study has been con- ing a DMA. Further, the effect of mechanical deformation in PEO
ducted on GO_water and GO_ethanol membranes and the like soft matrix is the change in their microstructure, which has
results are shown in Fig. 11. It has been found that in GO_water, been shown with the help of an optical microscope. Secondly,
Figure 10: The structural projection of the ternary Maxwell–Wiechert model of GO membrane structure [28].Patra et al. | 11
Downloaded from https://academic.oup.com/ooms/article/1/1/itaa001/5918362 by guest on 03 November 2021
Figure 11: Stress relaxation curves of (A) GO_water and (B) GO_ethanol which is fitted to Maxwell–Wiechert model. The experimental data are obtained using the
stress–relaxation mode given in Table 1.
Table 2: The stress relaxation of fitting parameters to modified 2. Neilsen LE. Mechanical Propeties of Polymers and Composites. Vol.
Maxwell–Wiechert Model 1. New York: Marcel Dekker, 1974. ISBN: 0824761839.
3. Chartoff R, Weissman P, Sircar A. The application of dynamic
Material A1 (%) A1 (%) A2 (%) s1 (s) s2 (s)
mechanical methods to Tg determination in polymers: an
GO_water 63 13 22 714 31.2 overview. In: R Seyler (ed.), Assignment of the Glass Transition.
GO_ethanol 50 22 27 670.2 37.9 ASTM International, 1994, 88–107.
4. Carey BJ, Patra PK, Ci L et al. Observation of dynamic strain
Here s1 and s2 represent the characteristic relaxation times. hardening in polymer nanocomposites. ACS Nano 2011;5:
271522.
5. Agarwal A, Chipara AC, Shamoo Y et al. Dynamic self-
macroscopic structures of graphene flakes—GO membranes—are stiffening in liquid crystal elastomers. Nat Commun 2013;4:
studied using DMA and have shown that the effects of interca- 16.
lated molecules and removal of water are traceable with DMA- 6. Abraham J, Vasu KS, Williams CD et al. Tunable sieving of
based measurements, and relaxation studies such as stress–re- ions using graphene oxide membranes. Nat Nanotechnol 2017;
laxation can help to model the microstructure of such macro- 12:54650.
scale structures. In a nutshell, we discussed DMA not only as a 7. Cao L, Wu H, Yang P et al. Graphene oxide-based solid electro-
fundamental tool for materials characterization but also as a po- lytes with 3D prepercolating pathways for efficient proton
tential platform for exploring the microstructure, other environ- transport. Adv Funct Mater 2018;28:1804944.
mental effects, phase transitions including secondary and 8. Compton OC, Cranford SW, Putz KW et al. Tuning the me-
tertiary transitions, etc. of different types of membranes ranging chanical properties of graphene oxide paper and its associ-
from biological membranes to synthetic ones. ated polymer nanocomposites by controlling cooperative
intersheet hydrogen bonding. ACS Nano 2012;6:200819.
ACKNOWLEDGEMENTS 9. Poynting JH. The wave motion of a revolving shaft, and a sug-
gestion as to the angular momentum in a beam of circularly
T.N.N. and S.P. thank the intramural grants at the TIFR, polarised light. Proc R Soc A 1909;82:560–7.
Hyderabad from DAE, India. Authors also thank Dr Neethu 10. Dealy J. Rheometers for Molten Plastics. New York: Van Nostrand
Krishna for helping to correct the draft. Authors acknowl- Reinhold, 1992, 136–7, 234–6.
edge Mr Satyabrata Bandyopadhyay for helping in the theo- 11. Gilham J, Enns J. On the cure and properties of thermosetting
retical calculation for Fig. 11. polymers using torsional braid analysis. Trends Polym Sci 1994;
2:406.
12. DMA Q800- TA Instruments manual. http://www.tainstru
AUTHORS’ CONTRIBUTIONS ments.com/wp-content/uploads/dma.pdf
S.P. has conducted the DMA experiments and T.N.N. super- 13. Menard KP, Menard NR. Dynamic Mechanical Analysis in the
vised the work. S.P. and T.N.N. analysed the data and wrote Analysis of Polymers and Rubbers Encyclopedia of Polymer Science
the first draft. P.M.A. has vetted the manuscript and P.M.A., and Technology. Hoboken, New Jersey: John Wiley & Sons, Inc,
S.P. and T.N.N. jointly finalized the manuscript. 2015.
14. Ferry JD. Viscoelastic Properties of Polymers. 3rd edn. New York:
Wiley, 1980. ISBN: 0-471-04894-1.
REFERENCES 15. Barsoukov E, Macdonald JR. Impedance Spectroscopy Theory,
1. Menard KP. Dynamic Mechanical Analysis. 2nd edn. Florida: Experiment, and Applications. 2nd edn. John Wiley & Sons, Inc.,
CRC Press, 2008. ISBN: 9781420053128. 2005. ISBN: 0471716227.12 | Oxford Open Materials Science, 2021, Vol. 1, No. 1
16. Roylance D. Engineering Viscoelasticity, 2001, 1–37. containing solid polymer electrolytes. Macro Chem Phys 2019;
17. Andrew W. The Effect of Creep and Other Time Related Factors on 220:1–9.
Plastics and Elastomers. Vols. 1 and 2. New York: Plastic Design 24. Dikin DA, Stankovich S, Zimney EJ et al. Preparation and
Library, 1991. characterization of graphene oxide paper. Nature 2007;448:
18. Ward IM, Sweeney J. Mechanical Properties of Solid Polymers. 3rd 457–60.
edn. Hoboken, New Jersey: John Wiley & Sons, 2012. ISBN: 25. Medhekar NV, Ramasubramaniam A, Ruoff RS et al. Hydrogen
9781119967125. bond networks in graphene oxide composite paper: structure
19. Patra S, Vineesh TV, Narayanan TN. Enhanced viscoelastic and mechanical properties. ACS Nano 2010;4:2300–6.
properties of graphene oxide membranes. Carbon 2017;124: 26. Su Y, Wei H, Gao R et al. Exceptional negative thermal expan-
576–83. sion and viscoelastic properties of graphene oxide paper.
20. Puthirath AB, Patra S, Pal S et al. Transparent flexible lithium Carbon 2012;50:28049.
ion conducting solid polymer electrolyte. J Mater Chem A 2017; 27. Zimberlin JA, McManus JJ, Crosby AJ. Cavitation rheology of
5:1115262. the vitreous: mechanical properties of biological tissue. Soft
Downloaded from https://academic.oup.com/ooms/article/1/1/itaa001/5918362 by guest on 03 November 2021
21. Money BK, Swenson J. Dynamics of poly(ethylene oxide) Matter 2010;6:3632–5.
around its melting temperature. Macromolecules 2013;46: 28. Yang M, Xu Z, Li P et al. Interlayer crosslinking to conquer the
694954. stress relaxation of graphene laminated materials. Mater
22. Thakur PS, Soman B, Puthirath AB et al. Mechanistic insight Horiz 2018;5:11129.
in to the improved Li ion conductivity of solid polymer elec- 29. Kothari VK, Rajkhowa R, Gupta VB. Stress relaxation and in-
trolytes. RSC Adv 2019;9:38646–57. verse stress relaxation in silk fibers. J Appl Polym Sci 2001;82:
23. Patra S, Yeddala M, Daga P et al. Anisotropic mechanical 1147–54.
responses of poly(ethylene oxide) based lithium ionsYou can also read