Creep Testing of Thermoplastic Fiber-Reinforced Polymer Composite Tubular Coupons
←
→
Page content transcription
If your browser does not render page correctly, please read the page content below
materials
Article
Creep Testing of Thermoplastic Fiber-Reinforced
Polymer Composite Tubular Coupons
Hai Giang Minh Doan and Pierre Mertiny *
 Department of Mechanical Engineering, University of Alberta, 9211-116 St., Edmonton, AB T6G 1H9, Canada;
 hdoan@ualberta.ca
 * Correspondence: pmertiny@ualberta.ca

 Received: 17 September 2020; Accepted: 15 October 2020; Published: 17 October 2020

 Abstract: Thermoplastic fiber-reinforced polymer composites (TP-FRPC) are gaining popularity
 in industry owing to characteristics such as fast part fabrication, ductile material properties and
 high resistance to environmental degradation. However, TP-FRPC are prone to time-dependent
 deformation effects like creep under sustained loading, which can lead to significant dimensional
 changes and affect the safe operation of structures. Previous research in this context has focused,
 mainly, on testing of flat coupons. In this study, a creep testing method for TP-FRPC tubular coupons
 was developed. Specimens were fabricated using tape winding and subjected to well-defined loading
 conditions, i.e., pure hoop tensile and pure axial compressive stress. Strain gauges and digital image
 correlation were both employed for strain measurements and were found to be in good agreement.
 The evolution of strain rate, Poisson’s ratio and creep compliance were investigated. The prediction
 of experimental data by the Burgers model and the Findley’s power law model were explored.
 The research findings suggest that the developed experimental and analysis approach provides
 valuable information for the design of material systems and structures.

 Keywords: thermoplastic fiber-reinforced polymers composites; time-dependent behavior; creep testing

1. Introduction
      Fiber-reinforced polymer composite (FRPC) structures are increasingly being adopted by industry,
including FRPC pressure piping [1]. Compared to comparable steel structures, FRPC pressure
components can provide improvements in terms of safety, cost and environmental performance.
For example, fluids transported in pipes can be corrosive [2], and failure of corroded pipes can have
major safety and environmental impacts. Pipeline corrosion had an estimated annual cost of USD
7 billion in the USA alone (based on a 2001 NACE study) [3]. Corrosion concerns can be alleviated
using FRPC materials which have superior corrosion resistance compared to steel [1]. FRPC pipes
also possess a higher strength-to-weight ratio and greater flexibility; these characteristics help reduce
installation and transportation costs [4]. The combination of weight reduction and corrosion resistance
have made FRPC piping especially advantageous in deep-sea oil and gas applications [5]. Subsea oil
fields are being developed at depths up to 3000 m [6]; the use of FRPC reduces the weight of both the
pipe and supporting structures resulting in substantial cost savings [5]. Not limited to the oil and
gas industry, FRPC pipes are also used in water distribution [7], sewage [8], and geothermal heating
systems [9]. FRPC piping has traditionally been based on thermoset polymers, with thermoplastic (TP)
matrix materials emerging as an alternative in recent years, owing to even lower material costs for some
material systems such as glass fiber reinforced high density polyethylene (GFR-HDPE), fast composite
fabrication, and ductile material properties.
      However, FRPC structures, and especially those having a TP matrix, are susceptible to
time-dependent deformation effects, such as polymer creep and fiber realignment. Creep is the

Materials 2020, 13, 4637; doi:10.3390/ma13204637                             www.mdpi.com/journal/materials
Materials 2020, 13, 4637                                                                                                 2 of 17
Materials 2020, 13, x FOR PEER REVIEW                                                                                    2 of 17

continuous deformation of a material subjected to sustained loading [10], while fiber realignment is
deformation of a material subjected to sustained loading [10], while fiber realignment is the
the reorientation of a fiber reinforcement phase under the applied load [11]. Both phenomena can
reorientation of a fiber reinforcement phase under the applied load [11]. Both phenomena can affect
affect the safety and reliability of the structure over time. Understanding the long-term behavior of
the safety and reliability of the structure over time. Understanding the long-term behavior of the
the material under sustained loading is a necessary part of designing FRPC structures for long-term
material under sustained loading is a necessary part of designing FRPC structures for long-term
operation. The expected lifetime of certain FRPC piping systems is 20 years [12]; therefore, they may
operation. The expected lifetime of certain FRPC piping systems is 20 years [12]; therefore, they may
experience significant deformation due to creep during this time.
experience significant deformation due to creep during this time.
      There are three phases of creep in polymeric materials, i.e., primary, secondary and tertiary
      There are three phases of creep in polymeric materials, i.e., primary, secondary and tertiary creep
creep [13], as indicated in Figure 1. Upon applying load, an initial elastic strain is caused by the
[13], as indicated in Figure 1. Upon applying load, an initial elastic strain is caused by the changing
changing bond distances and angles of the polymer chains [14]. The initial strain is followed by the
bond distances and angles of the polymer chains [14]. The initial strain is followed by the primary
primary and secondary—also called steady-state—creep phases. The continued application of stress
and secondary—also called steady-state—creep phases. The continued application of stress causes
causes the polymer chains to untangle and rearrange resulting in greater alignment of the chains [13,14].
the polymer chains to untangle and rearrange resulting in greater alignment of the chains [13,14]. The
The strain rate increases during tertiary creep and can eventually lead to failure [15].
strain rate increases during tertiary creep and can eventually lead to failure [15].

                                Figure 1.
                                Figure    Threestages
                                       1. Three stagesof
                                                      ofcreep
                                                         creep (reproduced
                                                                (reproduced from
                                                                            from [16]).
                                                                                 [16]).

      Long-term creep
      Long-term      creep tests
                             tests lasting
                                    lasting upup to
                                                  to 10,000
                                                     10,000 hh [17,18]
                                                                 [17,18] have
                                                                          have been
                                                                                 been conducted
                                                                                         conducted to to quantify
                                                                                                         quantify thethe effect
                                                                                                                          effect
 of creep   on  failure   strength     and  lifetime    of  pipe   structures.   However,      long-term
of creep on failure strength and lifetime of pipe structures. However, long-term creep testing is            creep   testing  is
 resource  intensive   and,   therefore,   models    have  been   developed,     based
resource intensive and, therefore, models have been developed, based on short-term creep  on short-term   creep  experiments,
 to predict theto
experiments,      long-term
                    predict the  creep  behavior
                                    long-term        of the
                                                  creep      material
                                                          behavior    of[19].  The Burgers
                                                                          the material     [19].model   (BM) and
                                                                                                 The Burgers         Findley’s
                                                                                                                 model    (BM)
power    law  model     (FPLM)     have   been    proposed     to  predict   material    viscoelastic
and Findley’s power law model (FPLM) have been proposed to predict material viscoelastic behavior      behavior     [13,20–22].
The BM, which
[13,20–22].  The is   only
                    BM,     validis
                          which     foronly
                                        linear  viscoelastic
                                             valid  for linear behavior,    combines
                                                                  viscoelastic           the Maxwell
                                                                                 behavior,    combines and   Kelvin
                                                                                                           the        elements
                                                                                                                Maxwell    and
 in series [23]  as shown      in Figure   2.  It does  not  consider    inertial   effects.  The strain-time
Kelvin elements in series [23] as shown in Figure 2. It does not consider inertial effects. The strain-           relationship
 under
time    a constant under
      relationship     stress for   the BMstress
                                a constant    is shown     in Equation
                                                      for the  BM is shown (1). in
                                                                                 The    FPLM, expressed
                                                                                     Equation   (1). The FPLM,in Equation
                                                                                                                    expressed(2),
 can
in   represent
    Equation     nonlinear
               (2),             viscoelastic
                    can represent             behavior.
                                       nonlinear           It was empirically
                                                    viscoelastic    behavior. It derived      and found
                                                                                    was empirically        to model
                                                                                                        derived    andcreep
                                                                                                                         foundin
 unreinforced    plastics  but   several  researchers     have   applied   it to polymer     composites
to model creep in unreinforced plastics but several researchers have applied it to polymer composites      as  well with  good
 agreement
as  well with[23,24].
               good agreement [23,24].
                                                       σ0     σ0      σ0          E t
                                                                                      !
                                                                                − η2
                                            ε(t) =        + t+             1−e 2                                             (1)
                                                       E1     η1      E2
where ε(t) is the strain at given time t; E1 , E2 , η1 and η2 are material-dependent parameters
(i.e., the Maxwell and Kelvin-Voigt spring moduli, and the Maxwell and Kelvin-Voigt dashpot
viscosities, respectively), which can be found by curve fitting creep test data.

                                                     ε(t) = ε0 + ε+ tn                                                       (2)

where ε0 is the initial elastic strain; ε+ is a function of temperature, material and load; and n is a material
     Figure 2.
dependent      Representation of the Burgers model using Maxwell and Kelvin-Voigt elements.
            parameter.
     Researchers have used experimental and modelling approaches to study creep in engineering
materials. However, there is comparatively limited research on thermoplastic FRPC (TP-FRPC)
                                               =     +      +    1                                         (1)
since it is a less mature technology. TP-FRPC provide better ductility and impact performance,
a long polymer phase storage life, lower material costs for some material systems, fast part fabrication,
where        is the strain at given time t; E1, E2, η1 and η2 are material-dependent parameters (i.e., the
Maxwell and Kelvin-Voigt spring moduli, and the Maxwell and Kelvin-Voigt dashpot viscosities,
respectively), which can be found by curve fitting creep test data.
Figure 1. Three stages of creep (reproduced from [16]).

      Long-term
Materials             creep
          2020, 13, 4637   tests lasting up to 10,000 h [17,18] have been conducted to quantify the 3effect            of 17
of creep on failure strength and lifetime of pipe structures. However, long-term creep testing is
resource intensive and, therefore, models have been developed, based on short-term creep
and  more available
experiments,             repair
                 to predict   theoptions   compared
                                   long-term               to their thermoset
                                                creep behavior                   counterparts
                                                                    of the material    [19]. The[25].   A review
                                                                                                  Burgers     modelof(BM)
                                                                                                                        the
technical  literature   on  TP-FRPC     research    revealed    several  studies   for testing  of
and Findley’s power law model (FPLM) have been proposed to predict material viscoelastic behavior  flat coupons    [26,27]
which  can result
[13,20–22].         in stress
              The BM,    which concentrations
                                  is only validatforthelinear
                                                          edges,viscoelastic
                                                                 known as free-edge
                                                                              behavior,effects   [28]. the
                                                                                          combines     It isMaxwell
                                                                                                             questionable
                                                                                                                       and
for such testing   to be representative   of  the stresses   experienced   in  the bulk  material.
Kelvin elements in series [23] as shown in Figure 2. It does not consider inertial effects. The     There   are standards
                                                                                                                    strain-
for
timelong-term    material
      relationship    undertesting   of FRPC,
                              a constant   stresse.g.,
                                                    forISO
                                                         the899
                                                              BM[29]  relatesin
                                                                  is shown     toEquation
                                                                                  flexural creep   in dumbbell-shaped
                                                                                            (1). The   FPLM, expressed
specimens,
in EquationISO (2), 7509  [30] is concerned
                    can represent     nonlinearwith      the long-term
                                                   viscoelastic           time-to-failure
                                                                  behavior.                  of thermoset
                                                                              It was empirically     derivedFRPC      pipe
                                                                                                               and found
subjected  to  internal  pressure,   and  ISO   7684   [31]  deals with  the creep   of pipes subjected
to model creep in unreinforced plastics but several researchers have applied it to polymer composites      to an  external
compressive     force. agreement
as well with good       Yet, no standards
                                     [23,24]. were found that directly relate to creep in TP-FRPC piping and
tubular components under biaxial stress and internal pressure loading.

           Figure
      Figure      2. Representation
             2. Representation of theof the Burgers
                                      Burgers modelmodel
                                                    usingusing Maxwell
                                                          Maxwell      and Kelvin-Voigt
                                                                  and Kelvin-Voigt      elements.
                                                                                   elements.

     The work in the present study is part of a larger research project in which university and industry
partners collaborate to address the issue of = time-dependent
                                                      +       +      1deformation in TP-FRPC piping structures.   (1)
To aid in continuous improvement efforts and design of new products, modelling techniques are being
developed
where       that  are strain
              is the  capableatof considering
                                given time t; Ethe
                                                1, Ecombined
                                                     2, η1 and η2effects of polymer creep and
                                                                  are material-dependent       fiber realignment.
                                                                                            parameters    (i.e., the
Essential
Maxwell forandthese   efforts arespring
                 Kelvin-Voigt     experimental
                                        moduli,dataand to   calibrate
                                                          the Maxwell  and  validate
                                                                          and        the models.
                                                                              Kelvin-Voigt        To achieve
                                                                                             dashpot            this
                                                                                                       viscosities,
objective, tubular
respectively),  whichcoupons
                         can bemade
                                foundfrom  GFR-HDPE
                                       by curve             were manufactured
                                                   fitting creep   test data.      using a custom tape winding
setup. Using tubular coupons eliminates undesirable free-edge effects, yet, fabrication and testing
of such samples is technologically involved. Microstructure analysis, bond uniformity tests and
dimensional measurements were used to verify specimen quality. Using specialized testing equipment,
the tubular specimens were subjected to creep testing under pure hoop tensile stress and then pure axial
compressive loading conditions to investigate their time-dependent performance. Two independent
measurement techniques, strain gauges and digital image correlation (DIC), were used to verify the
accuracy of strain measurements. Changes in strain rate, Poisson’s ratio and creep compliance were
investigated. The BM and FPLM were used to fit the experimental data. Test and model predictions
were contrasted to identify suitable techniques for the engineering design of TP-FRPC pressure piping.

2. Materials and Methods

2.1. Fabrication of TP-FRPC Tubular Coupons
     Unidirectional GFR-HDPE tape (Taizhou Jiadebao Technology Co., Ltd., Taizhou, China)
with thickness of 0.33 mm and width of 49 mm was used to fabricate the tubular coupons.
The fiber-to-matrix weight fraction of the tape was verified by resin burnout tests to be within
manufacturer specifications of 60 ± 2%, with a composite material density 1.56 g/cm3 . A filament
winding machine (WMS-4 Axis, McClean-Anderson, Schofield, WI, USA) was modified to enable
fabrication by tape winding. Specifically, additional equipment for holding a tape creel, guiding and
heating the tape, and consolidating tape on the fabricated part was added to the existing machine.
The prototyping setup is schematically depicted in Figure 3. From the tape creel, the tape is directed
by a guide roller. Tape tension was applied mechanically via atfriction brake. A hot-air blower
(Hotwind Premium, Leister Technologies AG, Kaegiswil, Switzerland) was used to heat the tape as it
approaches an air-cooled aluminum compaction roller. The compaction roller applies pressure to the
tape as it is wound around the rotating winding tool to build up the composite tubular part layer by
layer. The compaction force applied by the compaction roller is spring-controlled. For the present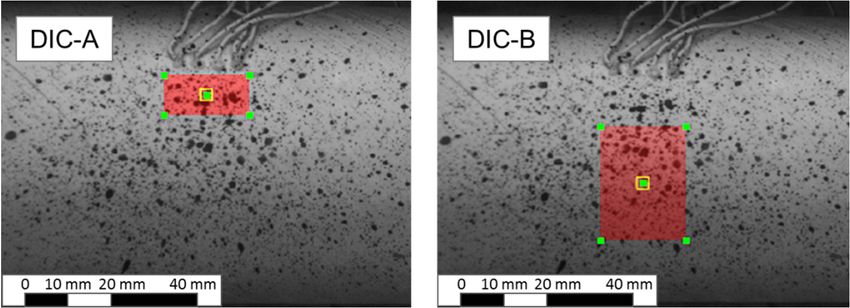
Materials 2020, 13, 4637                                                                             4 of 17

study, the winding angle for tubular coupons was chosen to be −45◦ /+45◦ . Considering both the
Materials
tube  hoop2020,
             and13, axial
                    x FOR directions,
                          PEER REVIEW                                                               4 of
                                      this winding angle produces matrix-dominant properties [27] and the17

lowest Young’s modulus as compared to other angle-ply configuration [32]. As such, it was expected
Young’s modulus as compared to other angle-ply configuration [32]. As such, it was expected that,
that, for this winding angle, the material creep response, which is highly dependent on the matrix
for this winding angle, the material creep response, which is highly dependent on the matrix
properties, would be most pronounced when applying pure hoop and pure axial loading conditions
properties, would be most pronounced when applying pure hoop and pure axial loading conditions
during testing.
during testing.

                                Figure 3. Schematic
                                Figure 3. Schematic of
                                                    of tape
                                                       tape winding
                                                            winding setup.
                                                                    setup.

     Tubular coupons were fabricated on an HDPE liner tube covering an aluminum winding tool.
      Tubular coupons were fabricated on an HDPE liner tube covering an aluminum winding tool.
The use of a low thermal conductivity liner reduced the amount of heat conducted away from the
The use of a low thermal conductivity liner reduced the amount of heat conducted away from the
tape as it was placed on the winding tool. As it was not desired for the tape to bond to the liner,
tape as it was placed on the winding tool. As it was not desired for the tape to bond to the liner,
aluminum foil coated with a release agent (MAC-860, McLube, Aston, PA, USA) covered the liner
aluminum foil coated with a release agent (MAC-860, McLube, Aston, PA, USA) covered the liner
tube. The winding speed for the initial tape layer was significantly higher than for subsequent layers,
tube. The winding speed for the initial tape layer was significantly higher than for subsequent layers,
with heating just sufficient to allow the tape to conform to the tubular shape without any buckling.
with heating just sufficient to allow the tape to conform to the tubular shape without any buckling.
Given the 49 mm tape width, three passes were required to complete one layer. For subsequent
Given the 49 mm tape width, three passes were required to complete one layer. For subsequent layers,
layers, the winding speed was reduced to allow the tape surface to reach its melting temperature of
the winding speed was reduced to allow the tape surface to reach its melting temperature of
approximately 130 ◦ C prior to tape placement. The tape was visually monitored during winding to
approximately 130 °C prior to tape placement. The tape was visually monitored during winding to
check for adequate melting. Note that a thermal imaging camera was employed in initial winding trials
check for adequate melting. Note that a thermal imaging camera was employed in initial winding
(FLIR E60, FLIR Systems, Wilsonville, OR, USA), providing accurate tape temperature measurements,
trials (FLIR E60, FLIR Systems, Wilsonville, OR, USA), providing accurate tape temperature
in order to adjust appropriate heater and winding machine settings. The tape deposition process
measurements, in order to adjust appropriate heater and winding machine settings. The tape
continued until 10 tape layers were placed. Two batches of tubular coupons were produced as per the
deposition process continued until 10 tape layers were placed. Two batches of tubular coupons were
processing parameters listed in Table 1, i.e., heating was raised with sequent sets of deposited layers.
produced as per the processing parameters listed in Table 1, i.e., heating was raised with sequent sets
Upon reaching the desired tube thickness, additional passes of the compaction roller were completed
of deposited layers. Upon reaching the desired tube thickness, additional passes of the compaction
applying heat and pressure to promote part compaction and create a smooth tube surface.
roller were completed applying heat and pressure to promote part compaction and create a smooth
     After tape winding, the winding tool was removed, and tubular coupons were cut from the
tube surface.
fabricated part to a length of 203.2 mm (8”). After cutting, the HDPE liner tube and aluminum foil
      After tape winding, the winding tool was removed, and tubular coupons were cut from the
could be removed easily. Short ring sections with length of 12.7 mm (0.5”) were also cut adjacent
fabricated part to a length of 203.2 mm (8”). After cutting, the HDPE liner tube and aluminum foil
to each tubular coupon. The ring samples were used to verify inter-layer bond quality and tape
could be removed easily. Short ring sections with length of 12.7 mm (0.5”) were also cut adjacent to
consolidation, which was accomplished by crushing the rings in a vise and verifying the absence of
each tubular coupon. The ring samples were used to verify inter-layer bond quality and tape
composite delamination.
consolidation, which was accomplished by crushing the rings in a vise and verifying the absence of
composite delamination.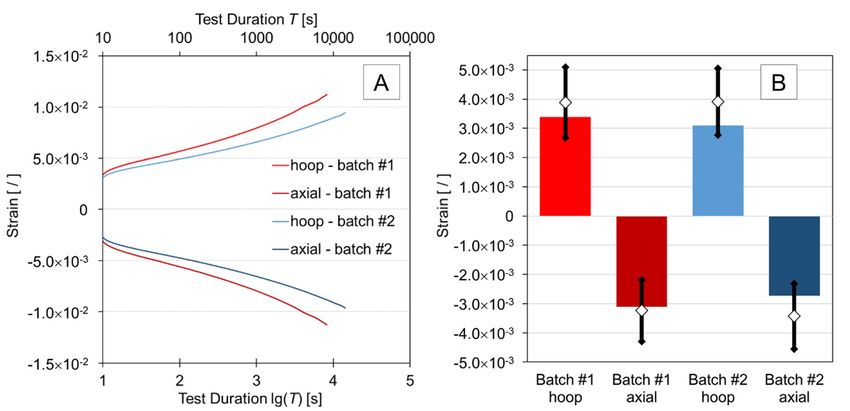
Materials 2020, 13, x FOR PEER REVIEW 5 of 17
Materials 2020, 13, 4637 5 of 17
Table 1. Heating setting for tape winding two batches of thermoplastic fiber-reinforced polymer
composites (TP-FRPC) tubular coupons.
Table 1. Heating setting for tape winding two batches of thermoplastic fiber-reinforced polymer
composites (TP-FRPC) tubular coupons. Layers
Air Temperature * (Heater Setting)
Batch #1 Batch #2
Layers
Air Temperature * (Heater
400Setting)
°C (9) 1 1
Batch #1 Batch #2
400 °C (9) 2 to 7 2 to 4
400 ◦ C (9) 420 °C (9.5) 1 8 to 10 5 to 8 1
400 ◦ C (9) 2 to 7 2 to 4
420 ◦ C (9.5) 440 °C (10) 8 to 10 - 9 to 105 to 8
440 ◦ C (10) * at a nozzle airflow of 410- L/min. 9 to 10
The average inner diameter of* attubular
a nozzle coupons
airflow of 410
wasL/min.
61.81 and 61.88 mm with a standard
deviation of 0.06 and 0.05 mm for Batch #1 and #2, respectively; the average wall thickness was
The average 3.65
correspondingly inneranddiameter
3.61 mm,of tubular
both with coupons
a standardwas 61.81 and 61.88
deviation mm
of 0.03 mm.with a standard
Based deviation
on a two-mean,
of 0.06 and 0.05 mm for Batch #1 and #2, respectively; the average wall
unequal variance t-test, the difference between average inner diameter and wall thickness between thickness was correspondingly
3.65
Batchand
#1 3.61
and mm,
#2 wasboth with a standard
statistically deviation
insignificant forofa 0.03
95% mm. Based on
confidence a two-mean,
interval. unequal variance
It is interesting to note
t-test, the difference between average inner diameter and wall
that the thickness of the 10-layer tubes (approximately 3.6 mm) was greater than the thickness between Batch #1 cumulative
and #2 was
statistically
thickness forinsignificant
10 layers offor a 95% confidence
unprocessed tape (3.3 interval.
mm), which It is interesting to notebythat
is likely caused the thickness
a variation of
in tape
the 10-layer
thickness tubes (approximately
introduced during tensioning3.6 mm) andwas greaterasthan
heating welltheascumulative
lateral tapethickness
compaction for 10 layersthe
during of
unprocessed tape (3.3 mm), which is likely caused by a variation in
winding process. The tape was placed in a “lag” winding mode, meaning the tape from subsequent tape thickness introduced during
tensioning
passes wasand heating
placed as well
against as laterallaid
previously tapetape.
compaction
Increased during the winding
thickness of finalprocess.
productThe tape was
dimensions
placed
caused in bya the
“lag” winding mode,
manufacturing meaning
process has the
been tape from subsequent
observed previouslypassesin otherwastapeplaced against
placement
previously laid
applications [33]. tape. Increased thickness of final product dimensions caused by the manufacturing
process has been
Scanning observed
electron previously
microscopy was inused
othertotape placement
inspect applications of
the microstructure [33].
the final product using
an EVO LS15 EP-SEM instrument (Zeiss, Oberkochen, Germany) operated inthe
Scanning electron microscopy was used to inspect the microstructure of final product
backscatter mode using
at a
an EVO LS15 EP-SEM instrument (Zeiss, Oberkochen, Germany) operated
voltage of 20 kV. Composite samples were cast in cold-cure epoxy and polished to create microscopy in backscatter mode at
aspecimens.
voltage of The
20 kV. Composite
latter samples were cast
were carbon-coated (EMinSCD005,
cold-cureLeica epoxy and polished Wetzlar,
Microsystems, to create microscopy
Germany).
specimens.
Figure 4 shows representative microstructures for Batch #1 and #2, where theWetzlar,
The latter were carbon-coated (EM SCD005, Leica Microsystems, Germany).
fibers, matrix and
Figure
encasing epoxy appear in as white, dark grey and light grey areas, respectively. The analysesand
4 shows representative microstructures for Batch #1 and #2, where the fibers, matrix of
encasing epoxy appear in as white, dark grey and light grey areas,
microscope images revealed negligible void content in the final product. The 10 tape layers are respectively. The analyses of
microscope
recognizableimages
in Figure revealed negligible void content
4, with matrix-dominant in the final product.
and fiber-dominant The 10 tapethroughout
regions interspersed layers are
recognizable
the structure.in InFigure
certain4,areas,
with the
matrix-dominant
tape layers blend andtogether
fiber-dominant
resembling regions interspersed throughout
the microstructure observed
the structure. In certain areas, the tape layers blend together resembling
by Mazumdar and Hoa [34]. Blending of layers may be the result of the applied processing the microstructure observed by
Mazumdar and Hoa [34]. Blending of layers may be the result of the
temperature and compaction pressure, causing viscous or melted HDPE to be displaced as tape is applied processing temperature
and
beingcompaction
placed. This pressure, causing
supposition viscous or by
is supported melted HDPE to be that
the observation displaced as tapeare
fiber layers is being
more placed.
closely
This supposition is supported by the observation that fiber layers
compacted for the Batch #2 sample where higher processing temperatures were applied compared are more closely compacted for the
to
Batch #2 sample
the Batch where higher processing temperatures were applied compared to the Batch #1 sample.
#1 sample.
Figure 4. Representative microstructures of fabricated tubular coupons.
Figure 4. Representative microstructures of fabricated tubular coupons.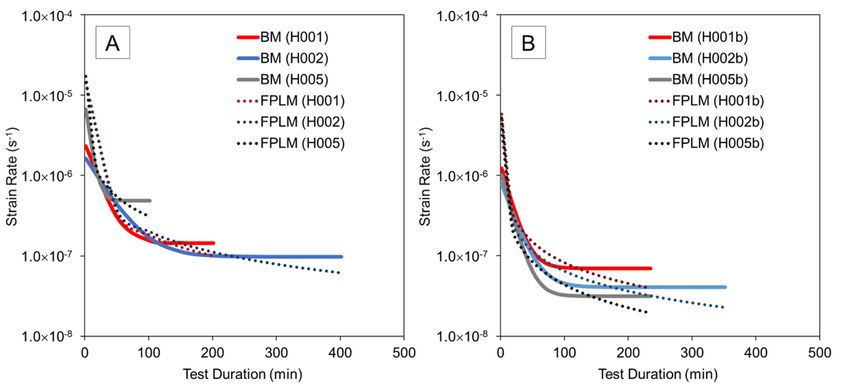
Materials 2020, 13, 4637 6 of 17
Materials 2020, 13, x FOR PEER REVIEW 6 of 17
2.2. Preparation of Tubular Coupons
2.2. Preparation of Tubular Coupons
To mount a tubular coupon into the testing apparatus, custom steel end fittings were adhesively
To mount a tubular coupon into the testing apparatus, custom steel end fittings were adhesively
bonded to the coupon extremities using a two-part adhesive (DP460, 3 M, Maplewood, MN, USA).
bonded to the coupon extremities using a two-part adhesive (DP460, 3M, Maplewood, MN, USA).
Mating surfaces were cleaned with abrasive pads and acetone, followed by a flame treatment
Mating surfaces were cleaned with abrasive pads and acetone, followed by a flame treatment
(propane gas) to activate the polymer and promote bonding before applying adhesive and insertion
(propane gas) to activate the polymer and promote bonding before applying adhesive and insertion
into the end fitting assembly. A fillet was allowed to form to reduce the stress concentration at the
into the end fitting assembly. A fillet was allowed to form to reduce the stress concentration at the
transition from end fitting to coupon.
transition from end fitting to coupon.
A tee-rosette strain gauge (CEA-06-250UT-350, Micro-Measurements, Raleigh, NC, USA) was
A tee-rosette strain gauge (CEA-06-250UT-350, Micro-Measurements, Raleigh, NC, USA) was
attached to the middle of the coupon and aligned to simultaneously measure hoop and axial strains.
attached to the middle of the coupon and aligned to simultaneously measure hoop and axial strains.
A speckle pattern, required for the DIC strain measurement, was applied using white and black spray
A speckle pattern, required for the DIC strain measurement, was applied using white and black spray
paint. Figure 5 shows a representative specimen prior to creep testing.
paint. Figure 5 shows a representative specimen prior to creep testing.
Figure
Figure 5. Tubular
Tubular coupon mounted into testing apparatus prior to testing.
2.3. Testing
2.3. TestingProcedure
Procedureand
andData
DataAcquisition
Acquisition
A multi-axial
A multi-axial testing
testing apparatus
apparatus connected
connected to to an
an analogue
analogue micro-controller
micro-controller (Model (Model 458.10
458.10
MicroConsole, MTS
MicroConsole, MTS Systems,
Systems, EdenEden Prairie,
Prairie, MN,
MN, USA)
USA) was
was used
used to
to apply
apply the
the test
test loading
loadingconditions.
conditions.
The servo-hydraulic testing apparatus can apply axial force and internal pressure in a controlled
The servo-hydraulic testing apparatus can apply axial force and internal pressure in a controlled
manner. Hydraulic
manner. Hydraulicoiloil
is the
is medium
the medium for pressurization. All testsAll
for pressurization. were conducted
tests at room temperature.
were conducted at room
The first test condition for the tubular specimens was applying pure hoop
temperature. The first test condition for the tubular specimens was applying pure hoop tensile tensile stress. For this
stress.
purpose the specimen is deemed a closed-ended pressure vessel, and hence, axial
For this purpose the specimen is deemed a closed-ended pressure vessel, and hence, axial forces are forces are induced
in the specimen
induced during pressurization.
in the specimen A pure hoop
during pressurization. loading
A pure hoopcondition was achieved
loading condition by applying
was achieved by
an internal pressure, P , while the axial actuator applied a compressive axial force,
applying an internal pressure, , while the axial actuator applied a compressive axial force, , to
i F A , to compensate
for the pressure-induced
compensate axial force. The
for the pressure-induced axialhoop and
force. Theaxial
hoop stresses, as well
and axial the magnitude
stresses, as well the of the axial
magnitude
force
of thethat
axialwas applied
force by the
that was actuator,
applied were
by the determined
actuator, based on Equations
were determined based on(3) and (4). (3) and (4).
Equations
P d − Po do (3)
σhoop == i i (3)
do − di
4
=(P πd2 − P πd2 ) (4)
i i o o 4
σaxial = − FA (4)
π(d2o − d2i )
where and are the hoop and axial stress; πandd2o − d2i are the tube inner and outer
diameter,
where σhoop respectively. The
and σaxial are gage
the hooppressure
and axialof stress;
the testing equipment
di and do are the was tubeused
innerfor ; therefore,
and outer the
diameter,
outer pressure,
respectively. , waspressure
The gage considered to testing
of the be zero.equipment was used for Pi ; therefore, the outer pressure,
In this study, the purpose
Po , was considered to be zero. for the experiments is to provide creep data as input to calibrate and
verifyInnumerical
this study, the purpose for the experimentsloads
models. Therefore, well-defined is to that induce
provide creep
creep datainasthe material
input need toand
to calibrate be
imposed upon the
verify numerical tubularTherefore,
models. coupons. well-defined
HDPE has been loadsdemonstrated
that induce creepto creep at stresses
in the materialasneed
lowtoasbe2
MPa at room temperature [35]. It was expected that GFR-HDPE would experience creep at
comparative low stress levels as well, assuming the loading direction deviates sufficiently from the
directions of the fiber reinforcement, since creep behavior is predominantly determined by the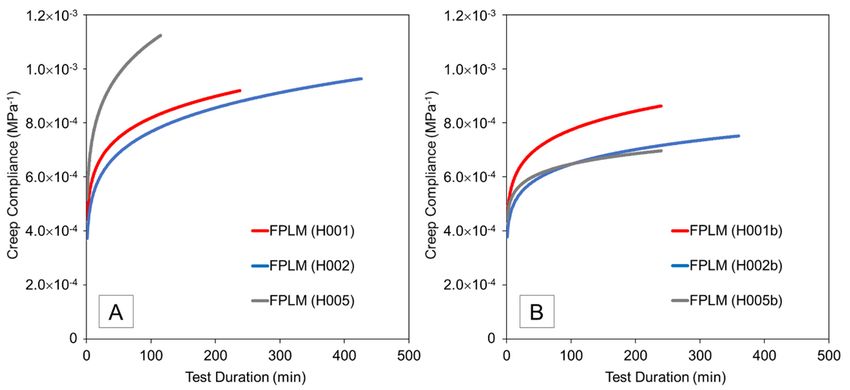
Materials 2020, 13, 4637                                                                             7 of 17

imposed upon the tubular coupons. HDPE has been demonstrated to creep at stresses as low as 2 MPa
at room temperature [35]. It was expected that GFR-HDPE would experience creep at comparative
low stress levels as well, assuming the loading direction deviates sufficiently from the directions of
the fiber reinforcement, since creep behavior is predominantly determined by the properties of the
matrix material. Nevertheless, stress values suitable for pure HDPE were deemed too low, given that
the polymer phase was reinforced with continuous fibers at a considerable volume fraction (i.e., 60%).
Also, stress values below a certain level pose challenges in terms of the operating range of the testing
equipment. Therefore, a stress value of 10 MPa was chosen.
       Each creep tests had a 10-s ramp-up period. Three samples from Batch #2 (H001, H002 and (H003)
and two specimens from Batch #1 (H004 and H005) were tested. (Note that for clarity, not all test data
are plotted as part of subsequent analyses.) Tests with different durations were conducted: short-term
(approximately 2 h), intermediate (4 h) and longer-term (7 h). Virgin specimens were used for the pure
hoop tests. Specimens were then re-used for pure axial compression testing after allowing the specimen
to rest in the testing apparatus overnight. A total of three pure axial compression tests were conducted,
i.e., one specimen each from short-term, intermediate and longer-term pure hoop testing. For the pure
axial compression tests, specimens were not pressurized; only a compressive axial load, equivalent to
5 MPa stress, was applied. Table 2 shows the test matrix for the creep experiments. Tests with the suffix
“b” denote pure axial compression tests. Test durations for the pure axial tests were either 4 h or 6 h.

                                  Table 2. Test matrix for creep experiments.

      Test Name            Specimen Inner      Specimen Wall         Internal Pressure   Axial Force (N)
                           Diameter (mm)       Thickness (mm)             (MPa)
         H001                                                              1.176             −3829
                               61.92                 3.64
         H001b                                                             N/A               −3829
         H002                                                              1.178             −3548
                               69.14                 3.65
         H002b                                                             N/A               −3757
          H003                 69.14                 3.59                  1.168             −3516
          H004                 69.20                 3.65                  1.181             −3553
         H005                                                              1.165             −3495
                               69.01                 3.60
         H005b                                                             N/A               −3699

     As mentioned above, strain gauges and DIC were used to measure hoop and axial strains
experienced by the specimens, with a sampling frequency of 1 and 0.1 Hz, respectively. The specimen
strain gauge was connected in series to a dummy gauge and signal conditioner to form a Wheatstone
quarter-bridge arrangement with temperature compensation. The dummy gauge was the same type as
the specimen gauge and applied to a strip of unprocessed GFR-HDPE tape; the gauge was further
orientated 45◦ to the fibers so it would have the same orientation with respect to the fibers as the one
on the test specimen.
     The components of the DIC system consisted of two camera lenses (28–85 mm, Nikon, Tokyo,
Japan) each attached to CCD cameras (Pike F-421, Allied Vision Technologies GmbH, Stadtroda,
Germany) and two LED lights. The distance between the cameras and specimen was approximately
0.8 m. The focal length and aperture of the lenses were set to 50 mm and f3.5, respectively. The camera
components were placed on a tripod. For safety reasons, the tests were conducted with a polycarbonate
shield surrounding the specimen. The placement of the shield between the cameras and specimen
resulted in higher calibration error but was still within acceptable limits as stipulated by the DIC
system manufacturer.
     DIC data acquisition and post-processing was performed using the VIC-3D system (Correlated
Solutions, Inc., Irmo, SC, USA). The use of the DIC technique allowed strain measurements in multiple
areas of varying sizes on the specimen surface as opposed to the comparatively small area covered by
the strain gauge. Measurement from the limited strain gauge area can be affected by irregularities
Materials 2020, 13, 4637                                                                                      8 of 17

Materials 2020, 13, x FOR PEER REVIEW                                                                         8 of 17

in the tube or the tube surface, whereas DIC allows for a much larger measurement area and is thus
remainder of this paper. The second area, called DIC-B and shown in Figure 6B, was selected to be
less affected by local irregularities. For this study, two areas of interest were selected for DIC analysis.
10 pixels below the DIC-A area and was 150 pixels wide and 210 pixels tall. Note all strain
An area covering the strain gauge area was selected to allow a direct comparison with strain gauge
measurements were made in the middle of the specimen to minimize any end effects.
measurements as shown in Figure 6A. This area viewed within the analysis software was 150 pixels
      In addition to strain measurements, initial elastic strain predictions were made based on micro-
wide and 70 pixels tall. Measurements from this area are referred to as DIC-A for the remainder of this
mechanical analysis and classical lamination theory [36], and predictions were compared with strain
paper. The second area, called DIC-B and shown in Figure 6B, was selected to be 10 pixels below the
measurements. The elastic properties for the fiber reinforcement and HDPE matrix phase were not
DIC-A area and was 150 pixels wide and 210 pixels tall. Note all strain measurements were made in
available from the tape manufacturer and, hence, the technical literature was perused to set
the middle of the specimen to minimize any end effects.
reasonable ranges of maximum and minimum properties (as listed in Table 3) for the predictions.

                                (A)                                              (B)
             6. Sample
      Figure 6.  Sample photographs
                        photographs ofof speckle
                                         speckle pattern
                                                  pattern used for digital image correlation (DIC) strain
                                                                                                      strain
      measurements: DIC-A
      measurements:   DIC-Acoinciding
                            coincidingwith
                                       withstrain
                                             straingauge
                                                    gaugelocation
                                                           location (A),
                                                                  (A),   and
                                                                       and    large
                                                                           large    strain
                                                                                 strain    measurement
                                                                                        measurement areaarea
                                                                                                         for
      for DIC-B
      DIC-B (B). (B).

     In Table
        addition   to strain
              3. Elastic       measurements,
                         properties              initial elastic
                                    of composite material         strain
                                                          constituents   predictions
                                                                       used              werepredictions.
                                                                            for initial strain made based on
micro-mechanical analysis and classical lamination theory [36], and predictions were compared
                                      Property                Glass Fiber HDPE
with strain measurements. The elastic properties for the fiber reinforcement and HDPE matrix phase
were not available fromYoung’s
                           the tapemodulus    range and,
                                     manufacturer    (GPa)hence,68.9–85.0     0.7–1.34
                                                                  the technical  literature was perused to set
                                   Poisson’s ratio                 0.20
reasonable ranges of maximum and minimum properties (as listed in Table          0.463) for the predictions.

     The  longer-term
        Table            effect of the
              3. Elastic properties     applied loads
                                    of composite      on constituents
                                                 material strain rate, Poisson’s  ratio,
                                                                       used for initial    andpredictions.
                                                                                        strain creep compliance
for the tubular coupons was investigated. Strain rate, , at a certain time, , was calculate using a
                                     Property as per Equation
symmetric difference quotient approach                       Glass
                                                                (5).Fiber       HDPE
                           Young’s modulus range (GPa)           68.9–85.0       0.7–1.34
                                  Poisson’s ratio =                 0.20           0.46                          (5)

where              and          , and        and           are the strain and the time values at 100 s after and
     The longer-term effect of the applied loads on strain rate, Poisson’s ratio, and creep compliance
100 s before time , respectively.                                    .
for the tubular coupons was investigated. Strain rate, εi , at a certain time, ti , was calculate using
      Poisson’s ratio data was determined according to Equation (6). The initial Poisson’s ratio was
a symmetric difference quotient approach as per Equation (5).
predicted based the classical lamination theory [36] as shown in Equation (7). The derivation of this
equation assumes a symmetric laminate, i.e.,       .    εi+100
                                                       the     − εi−100stiffness matrix [B] is zero. However, even
                                                           coupling
                                                  εi =                                                           (5)
though the present laminate is not symmetric,            bending   moments are considered negligible given the
                                                        ti+100 − ti−100
axisymmetric structure configuration (tube).
where   εi+100 and
      Finally,   creepεi−100 , and ti+100 and, is
                        compliance,            ti−100
                                                  the are the strain between
                                                      relationship     and the time   values at 100
                                                                                  the strain,       s after
                                                                                                 , and  theand 100 s
                                                                                                            constant
before
stress, time  ti , respectively.
           , experienced      by the material as shown in Equation (8).
     Poisson’s ratio data was determined according to Equation (6). The initial Poisson’s ratio was
predicted based the classical lamination theory=[36] as shown in Equation (7). The derivation (6)                  of
this equation assumes a symmetric laminate, i.e., the coupling     ∗         stiffness matrix [B] is zero. However,
even though the present laminate is not symmetric,=bending         ∗     moments are considered negligible given  (7)
the axisymmetric structure configuration (tube).
                                                              =                                                   (8)
Materials 2020, 13, 4637 9 of 17
Finally, creep compliance, D(t), is the relationship between the strain, ε(t), and the constant stress,
σ0 , experienced by the material as shown in Equation (8).
εtrans
ν=− (6)
εlong
A∗12
νxy = − (7)
A∗11
ε(t)
Materials 2020, 13, x FOR PEER REVIEW D(t) = 9 of (8)
17
σ0
where εtrans andand
where εlong are correspondingly
are correspondingly the strain
the strain perpendicular
perpendicular and in-line
and in-line with
with the the applied
applied loading
direction; and A∗11 and
loading direction; andA∗ ∗ are
and ∗
terms are terms
from the from theofinverse
inverse the of the extensional
extensional stiffnessstiffness
matrix matrix
[A] used[A]
in
12
used in classical lamination
classical lamination theory. theory.
3. 3. Results
Results andDiscussion
and Discussion
3.1. Creep
3.1. Strain
Creep Results
Strain Results
Results
Resultsobtained
obtained from
from strain gauge
strain gauge measurements
measurements forfor
thethe
10 10
MPaMPapure hoop
pure stress
hoop creep
stress tests
creep are
tests
depicted in Figure
are depicted 7A. For7A.
in Figure clarity,
For only data
clarity, for data
only one specimen per batchper
for one specimen is shown.
batch is Inshown.
general,Inspecimens
general,
specimens
within within
the same theexperienced
batch same batch experienced
similar levels similar levels
of strain of strain
during theseduring
tests. these
Note tests. Notestrain
that final that
final differed
values strain values
for thediffered
various fortests
the various
given thattests given
test that testwere
durations durations were notTherefore,
not identical. identical. Therefore,
a reference
a reference
time of 100 mintime of 100
was usedmin was usedrecorded
to compare to compare recorded
creep strainscreep strains
at that at that The
test stage. test stage. The axial
axial strain and
strain
hoop and measured
strain hoop strainatmeasured
100 min at for100 min for specimens
specimens H001, H002 H001,
andH002
H003 and H003
were were 7%
within within
and7% 10%andof
10% of each other, respectively. The measured axial and hoop strain for H004
each other, respectively. The measured axial and hoop strain for H004 and H005 were both within and H005 were both
7%within
of each7%other.
of each other.
It was It was concluded
concluded that repeatable
that repeatable creepvalues
creep strain strain values were observed
were observed for eachforbatch.
each
batch. Moreover,
Moreover, despite the despite the approximations
approximations made formade for the prediction
the prediction of initial of initialand
strains, strains,
using and using
methods
methods assuming ideal conditions (micro-mechanical analysis and classical lamination
assuming ideal conditions (micro-mechanical analysis and classical lamination theory), one can observe theory), one
can observe in Figure 7B that measured and predicted values
in Figure 7B that measured and predicted values are in reasonable agreement. are in reasonable agreement.
(A) (B)
Figure
Figure 7. 7. Strain
Strain from
from pure
pure hoophoop tensile
tensile teststests for representative
for representative samples
samples fromfrom
BatchBatch #1 (H004)
#1 (H004) and
and Batch
#2 Batch #2 (H001):
(H001): (A) creep (A)strain
creepmeasured
strain measured
by strainby gauges;
strain gauges; (B) initial
(B) initial strainstrain
from from
strainstrain gauges
gauges (solid(solid
bars)
andbars) and predicted
predicted values
values based onbased onTable
data in data in Table
3 with 3 with maximums
maximums and minimums
and minimums (error
(error bars) andbars) and
averages
averagessymbols).
(diamond (diamond symbols).
As shown in Reference [35], various grades of HDPE (but not necessarily a material identical to
the composite matrix used in the present study) subjected to 10 MPa tensile stress, at room
temperature, experienced over 0.02 mm/mm strain at the 1-h mark of creep testing. In comparison,
hoop strains measured in the present study are in the order of 0.008 mm/mm after the same time
period. This difference demonstrates the significant improvement in creep resistance that is imparted
by the reinforced polymer as compared to the pure polymer.
Materials 2020, 13, 4637 10 of 17
As shown in Reference [35], various grades of HDPE (but not necessarily a material identical
to the composite matrix used in the present study) subjected to 10 MPa tensile stress, at room
temperature, experienced over 0.02 mm/mm strain at the 1-h mark of creep testing. In comparison,
hoop strains measured in the present study are in the order of 0.008 mm/mm after the same time period.
This difference demonstrates the significant improvement in creep resistance that is imparted by the
reinforced polymer as compared to the pure polymer.
As depicted in Figure 7A, specimens from Batch #1 (H004 and H005) experienced higher
levels of initial elastic strain and final creep strain than those from Batch #2 (H001, H002, and H003).
While dimensions, fiber volume fraction and void content of specimens in the two batches are practically
identical, the13,differences
Materials 2020, x FOR PEERin strain may be explained by differences in crystallinity. Agarwal et al.
REVIEW 10 [37],
of 17
as well as Mazumdar and Hoa [34], attributed changes in crystallinity of the polymer matrix to the
annealing experienced
annealing experienced by by the
the tape
tape as as it
it is
is heated
heated and and reheated
reheated during
during thethe tape
tape winding
winding process.
process.
Agarwal et
Agarwal et al.
al.observed
observed higher
higher heatheatinput during
input duringwinding of carbon
winding fiber fiber
of carbon reinforced polyether
reinforced ether
polyether
ketone tape resulted in a higher percentage of crystallinity in the finished
ether ketone tape resulted in a higher percentage of crystallinity in the finished product. Polyether product. Polyether ether
ketoneketone
ether and HDPE
and HDPE are are
bothbothsemi-crystalline
semi-crystalline thermoplastic
thermoplastic polymers.
polymers.Additionally,
Additionally,itit has been
has been
demonstratedthat
demonstrated thatdifferent
differentcooling
coolingrates
rates ofof melted
melted HDPE
HDPE resulted
resulted in different
in different crystalline
crystalline structures
structures [38].
In this study, the GFR-HDPE tape received different heat inputs during the winding of eachofbatch
[38]. In this study, the GFR-HDPE tape received different heat inputs during the winding each
batchwas
and and was allowed
allowed to cool toto room
cool to room temperature.
temperature. It is plausible
It is plausible to conclude to that
conclude that this
this process process
resulted in
resulted in different degrees of crystallization in the finished product. A greater
different degrees of crystallization in the finished product. A greater level of crystallinity corresponds level of crystallinity
corresponds
to to a greater
a greater number number ofvalence
of secondary secondary bondsvalence
betweenbonds between[14],
molecules molecules [14], which
which explains theexplains
greater
resistance to creep [27]. While differential scanning calorimetry (DSC) tests were not conductednot
the greater resistance to creep [27]. While differential scanning calorimetry (DSC) tests were to
conducted
verify to verify theofcrystallinity
the crystallinity the specimens, of the specimens,
since this was since this was not
not considered to considered
be within scope to beof within scope
the project,
of theanalysis
DSC project,could
DSC analysis could on
be conducted be specimens
conducted as onpart
specimens
of future aswork.
part of future work.
Figure 88 shows
Figure shows examples
examples of of strain
strain versus
versus time
time curves
curves for
for measurements
measurements obtained obtained from from strain
strain
gauges and DIC. While DIC measurements exhibited significant
gauges and DIC. While DIC measurements exhibited significant noise, the qualitative agreement noise, the qualitative agreement
between the
between different measurement
the different measurement techniques
techniques provides
provides confidence
confidence in in the
the strain
strain gauge
gauge readings.
readings.
Data obtained from DIC-A and strain gauge measurements were
Data obtained from DIC-A and strain gauge measurements were found to be generally also in found to be generally also in good
good
agreement quantitatively, while in some tests, data from DIC-B deviated
agreement quantitatively, while in some tests, data from DIC-B deviated from the other readings. from the other readings.
Differences in
Differences in DIC-B
DIC-B data,
data, asas well
well asas noise
noise inin DIC
DIC data,
data, was
was attributed
attributed to to optical
optical distortions
distortions caused
caused
by the polycarbonate shield. Hence, strain gauge readings were deemed
by the polycarbonate shield. Hence, strain gauge readings were deemed more reliable, and further more reliable, and further
analyses were
analyses were based
based onon corresponding
corresponding data. data. It
It is
is worth
worth pointing
pointing outout that
that first stage and
first stage and second
second stage
stage
creep can
creep can be be observed
observed from
from the
the graphs
graphs plotted
plotted in in Figure
Figure 8;8; none
none of of the
the specimens
specimens experienced
experienced tertiary
tertiary
creep, supposedly due to the low loading
creep, supposedly due to the low loading conditions. conditions.
(A) (B)
Figure 8. Comparison
Comparison of
ofDIC
DICand
andstrain
straingauge
gauge(SG)
(SG)measurements
measurementsforfor pure
pure hoop
hoop tensile
tensile creep
creep teststests
for
for representative samples from Batch #1 (A) and Batch #2
representative samples from Batch #1 (A) and Batch #2 (B). (B).
3.2. Creep Strain Modelling
Using the BM and FPLM, the data from pure hoop tensile and pure axial compression creep tests
were studied further. The model parameters were obtained by curve fitting experimental data using
MATLAB’s built-in “Curve Fitting” app (MathWorks, Natick, MA, USA). The error sum of squaresMaterials 2020, 13, 4637 11 of 17
3.2. Creep Strain Modelling
Using the BM and FPLM, the data from pure hoop tensile and pure axial compression creep tests
were studied further. The model parameters were obtained by curve fitting experimental data using
MATLAB’s built-in “Curve Fitting” app (MathWorks, Natick, MA, USA). The error sum of squares
and root mean square error values were close to zero while the adjusted R2 values were close to
unity (ranging between 0.8773 and 0.9887, and 0.9873 and 0.9992 for the BM and FPLM, respectively),
which confirms that the models are a good fit for the collected data. Figure 9 depicts the agreement
between the models and the experimental results for the pure hoop tensile and pure axial compression
tests. For clarity, only one specimen each from short-term, intermediate and longer-term creep tests
is shown in the graphs. It should be noted that the strains computed by the BM and FPLM show
comparatively
Materials 2020, 13, xhigh deviations
FOR PEER REVIEWfrom the experimental strain values during the initial 10-s ramp-up 11 of 17
period. After the ramp-up period the BM initially produces higher deviations from experimental values
values
than thethan
FPLM the(see
FPLM (see
insets in insets
Figure in9);Figure 9); both
however, however,
modelsboth models
predict predict
strains strains
within 10% ofwithin 10% of
experimental
experimental
results as the results as the testsOverall,
tests progressed. progressed. Overall, of
the average thethe
average
absoluteof the absolute
percent percent
difference difference
between the
between the experimental results for both models from after ramp-up to the
experimental results for both models from after ramp-up to the end of hold period with constantend of hold period with
constant stress is1%.
stress is under under 1%.
Both Both models
models demonstrate
demonstrate good agreement
good agreement with experimental
with experimental results
results for
for both
both tensile
tensile and compression
and compression loading.loading. These findings
These findings were expected
were expected since both since bothhave
models modelsbeenhave
shown beento
shown to perform well for fitting creep data of fiber-reinforced HDPE composite
perform well for fitting creep data of fiber-reinforced HDPE composite materials [39–41]. On average, materials [39–41].
On average,
the FPLM the FPLM
provides dataprovides data that
that are closer areexperimental
to the closer to theresults
experimental results
of this study of this study
as compared as
to the
compared to the BM. Wang et al. [41] also observed FPLM to fit test data better than
BM. Wang et al. [41] also observed FPLM to fit test data better than the BM in their comparison of the the BM in their
comparison
models for curveof thefitting
models for curve
creep data offitting creep data ofHDPE
a fiber-reinforced a fiber-reinforced
material. HDPE material.
(A) (B)
Figure
Figure 9. Comparison
Comparison of of the
the model
model data
data and
and experimental
experimentalresults
resultsfor
for(A)
(A) pure
pure hoop
hoop tensile
tensile and
and (B)
(B)
pure axial compression
compressiontests
tests(BM:
(BM:Burgers
Burgersmodel;
model; FPLM:
FPLM: Findley’s
Findley’s power
power lawlaw model).
model). Insets
Insets showshow
the
initial
the 2 min
initial of testing.
2 min of testing.
3.3. Strain
3.3. Strain Rates
Rates
Calculating strain
Calculating strain rates
rates from
fromexperimental
experimentaldata
dataisisgreatly affected
greatly byby
affected noise. Since
noise. thethe
Since BMBMandand
the
FPLM
the provided
FPLM providedstrainstrain
data that
dataclosely matches
that closely the experimental
matches results, results,
the experimental it is expedient to compute
it is expedient to
strain rates using the data obtained from these models. Figure 10 compares
compute strain rates using the data obtained from these models. Figure 10 compares the strainthe strain rate data
rate
computed
data usingusing
computed the BMtheand
BM FPLM for the
and FPLM forcreep tests tests
the creep under pure pure
under hoophoop
tensile loading
tensile and pure
loading axial
and pure
axial compression. A phase of decreasing strain rate is initially observed which corresponds to the
primary creep stage [42]. It is further shown that the pure hoop tensile tests, having a higher applied
stress of 10 MPa, resulted in higher strain rates than the axial compression tests, which had a stress
level of 5 MPa. The computed strain rates are lower than the steady-state strain rate for pure HDPE
of 2.22 × 10⁻⁶ s−1 observed by Pereira et al. [43]. In their study the creep experiments were conductedMaterials 2020, 13, 4637 12 of 17
compression. A phase of decreasing strain rate is initially observed which corresponds to the primary
creep stage [42]. It is further shown that the pure hoop tensile tests, having a higher applied stress
of 10 MPa, resulted in higher strain rates than the axial compression tests, which had a stress level
of 5 MPa. The computed strain rates are lower than the steady-state strain rate for pure HDPE of
2.22 × 10⁻⁶ s−1 observed by Pereira et al. [43]. In their study the creep experiments were conducted at
3Materials
MPa stress for only 10 min, nevertheless, the data provide indication that the GFR-HDPE material
2020, 13, x FOR PEER REVIEW 12 of 17
has a reduced strain rate compared to the pure polymer.
(A) (B)
Figure 10.Strain
Figure10. Strainrate
ratecomputed
computedusing Burgers
using Burgersmodel (BM)
model (BM)andand
Findley’s power
Findley’s lawlaw
power model (FPLM)
model for
(FPLM)
(A)
forpure hoophoop
(A) pure tensile and (B)
tensile andpure axialaxial
(B) pure compression tests.tests.
compression
3.4. As shownRatio
Poisson’s in Figure 10, the BM computed strain rates eventually level off to a constant value
regardless of test duration. However, the experimental data show that the strain rates for short-term
Figure
tests are still11 shows Poisson’s
decreasing steeplyratios
and dothat were
not computed
reach usingcreep.
steady-state the FPLM
The for
FPLMthe computed
pure hoop strain
tensile
rates continue to decrease gradually. It was therefore concluded that the FPLM better representslimit
creep tests and axial compression tests. The Poisson’s ratio for isotropic materials has an upper the
of 0.5. However,
behavior this restriction
of the material, which isdoes not apply
supported to fact
by the anisotropic
that the materials
data from[44]. In comparison,
the FPLM had a lowerthe
Poisson’s ratio
percentage errorcalculated from classical
from the experimental lamination
results theory
compared ranges
to the BM.from 0.83 to 0.88,
Consequently, corresponding
remaining analysesto
higher and lower Young’s moduli for both
in this study were conducted employing the FPLM. the glass fiber and HDPE, respectively (as listed in Table
3). All specimens exhibited an increase in Poisson ratio as the creep tests proceeded. The Poisson’s
ratio
3.4. eventually
Poisson’s Ratioincreases above unity, indicating that axial strain is higher than the hoop strain
despite the loading conditions being predominantly in the hoop direction. This counterintuitive
Figure 11 shows Poisson’s ratios that were computed using the FPLM for the pure hoop tensile
behavior has been observed before in ±45° pipes pressurized in pure hoop [45], as well as ±45°
creep tests and axial compression tests. The Poisson’s ratio for isotropic materials has an upper limit of
laminates loaded in pure tension [46]. In both of these studies, the highest strains before failure were
0.5. However, this restriction does not apply to anisotropic materials [44]. In comparison, the Poisson’s
in the direction perpendicular to the applied load which supports the results captured in the current
ratio calculated from classical lamination theory ranges from 0.83 to 0.88, corresponding to higher
study. It is presumed that changes in Poisson’s ratio are strongly influenced by fiber realignment
and lower Young’s moduli for both the glass fiber and HDPE, respectively (as listed in Table 3).
effects in the specimens, which is consistent with classical lamination theory predictions that yield an
All specimens exhibited an increase in Poisson ratio as the creep tests proceeded. The Poisson’s ratio
increasing Poisson’s ratio as the angle between the fibers and the loading direction decreases from
eventually increases above unity, indicating that axial strain is higher than the hoop strain despite
45° for angle-ply laminates [44].
the loading conditions being predominantly in the hoop direction. This counterintuitive behavior
has been observed before in ±45◦ pipes pressurized in pure hoop [45], as well as ±45◦ laminates
loaded in pure tension [46]. In both of these studies, the highest strains before failure were in the
direction perpendicular to the applied load which supports the results captured in the current study.
It is presumed that changes in Poisson’s ratio are strongly influenced by fiber realignment effects in the
specimens, which is consistent with classical lamination theory predictions that yield an increasingYou can also read