Heat Maps: Perfect Maps for Quick Reading? Comparing Usability of Heat Maps with Different Levels of Generalization
←
→
Page content transcription
If your browser does not render page correctly, please read the page content below
International Journal of
              Geo-Information

Article
Heat Maps: Perfect Maps for Quick Reading? Comparing
Usability of Heat Maps with Different Levels of Generalization
Katarzyna Słomska-Przech * , Tomasz Panecki                         and Wojciech Pokojski

                                          Department of Geoinformatics, Cartography and Remote Sensing, Faculty of Geography and Regional Studies,
                                          University of Warsaw, Krakowskie Przedmiescie 30, 00-927 Warsaw, Poland; tpanecki@uw.edu.pl (T.P.);
                                          wpokojski@uw.edu.pl (W.P.)
                                          * Correspondence: k.slomska@uw.edu.pl

                                          Abstract: Recently, due to Web 2.0 and neocartography, heat maps have become a popular map type
                                          for quick reading. Heat maps are graphical representations of geographic data density in the form
                                          of raster maps, elaborated by applying kernel density estimation with a given radius on point- or
                                          linear-input data. The aim of this study was to compare the usability of heat maps with different
                                          levels of generalization (defined by radii of 10, 20, 30, and 40 pixels) for basic map user tasks. A user
                                          study with 412 participants (16–20 years old, high school students) was carried out in order to
                                          compare heat maps that showed the same input data. The study was conducted in schools during
                                          geography or IT lessons. Objective (the correctness of the answer, response times) and subjective
                                          (response time self-assessment, task difficulty, preferences) metrics were measured. The results show
                                          that the smaller radius resulted in the higher correctness of the answers. A larger radius did not
                                result in faster response times. The participants perceived the more generalized maps as easier to

                                          use, although this result did not match the performance metrics. Overall, we believe that heat maps,
Citation: Słomska-Przech, K.;             in given circumstances and appropriate design settings, can be considered an efficient method for
Panecki, T.; Pokojski, W. Heat Maps:      spatial data presentation.
Perfect Maps for Quick Reading?
Comparing Usability of Heat Maps          Keywords: heat map; thematic map; user study; generalization
with Different Levels of
Generalization. ISPRS Int. J. Geo-Inf.
2021, 10, 562. https://doi.org/
10.3390/ijgi10080562
                                          1. Introduction
Academic Editor: Wolfgang Kainz                The world of small-scale mapping on the web is constantly evolving. The main
                                          aim of such cartographic representations is often to quickly and quite effectively present
Received: 6 July 2021                     geographical relations of both qualitative and quantitative character. For the latter, different
Accepted: 15 August 2021                  thematic map types are used, including those already well established, such as diagrams,
Published: 18 August 2021                 choropleth maps, dot maps, or isolines. In the age of neocartography and Web 2.0 [1,2],
                                          new map types have emerged, such as heat maps that allow point data density based on
Publisher’s Note: MDPI stays neutral      point-to-area estimation to be visualized [3–5]. From the point of view of the classification
with regard to jurisdictional claims in   of data presentation methods by MacEachren and DiBiase [6], heat maps can be classified
published maps and institutional affil-   as continuous and smooth maps. The growing popularity of heat maps comes from their
iations.                                  attractiveness and ease of creation, using various mapping libraries [5]. Despite being
                                          commonly applied, it has not been evaluated whether they are an effective solution as
                                          maps for quick reading in a web environment. Similarly, it has not been verified to what
                                          extent their level of detail (generalization) is a key issue.
Copyright: © 2021 by the authors.              Heat maps were imported into cartography from data visualization techniques, similar
Licensee MDPI, Basel, Switzerland.        to other map types already well established in cartography, such as diagrams, charts, dots or
This article is an open access article    choropleths [7]. Heat maps are visualizations for the graphical representation of the density
distributed under the terms and           of spatial phenomena, usually measured in points. De Boer [3] highlights the fact that
conditions of the Creative Commons        the term itself is not unambiguous; it can denote both the density map (regardless of
Attribution (CC BY) license (https://     the method used) and the process of estimation of point-to-surface data (point density
creativecommons.org/licenses/by/          estimation). Heat maps are not necessarily connected strictly to geography [8]. They are
4.0/).

ISPRS Int. J. Geo-Inf. 2021, 10, 562. https://doi.org/10.3390/ijgi10080562                                    https://www.mdpi.com/journal/ijgi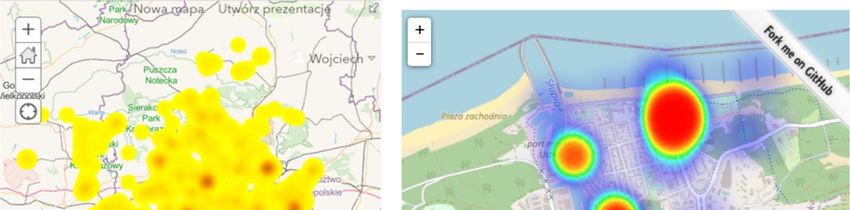
ISPRS Int. J. Geo-Inf. 2021, 10, 562 2 of 24
ISPRS Int. J. Geo-Inf. 2021, 10, x FOR PEER REVIEW 2 of 25
used in medicine [9], chemistry [10], biology and ecology [11], the social sciences for non-
used in medicine [9], chemistry [10], biology and ecology [11], the social sciences for non-
spatial data [12], and eye-tracker analysis [13]. In cartography, heat maps can be found in
spatial data [12], and eye-tracker analysis [13]. In cartography, heat maps can be found in
studies related to the spatial distribution of social issues [14–16], the visualization of routes
studies related to the spatial distribution of social issues [14–16], the visualization of
for runners and cyclists [17,18], and the analysis of road accidents [19,20]. The popularity
routes for runners and cyclists [17,18], and the analysis of road accidents [19,20]. The pop-
of heat maps is growing in the age of big data, as is the need for fast and attractive
ularity of heat maps is growing in the age of big data, as is the need for fast and attractive
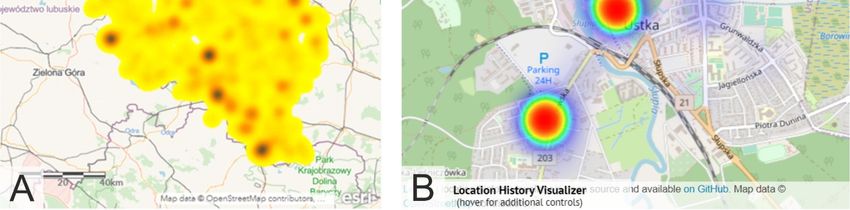
visualizations [5,21,22] (Figure 1).
visualizations [5,21,22] (Figure 1).
Figure1.1.Selected
Figure Selectedexamples
examplesofofa heat
a heat maps
maps with
with Open
Open Street
Street Map
Map base
base maps
maps ((A)
((A) heat
heat mapmap prepared
prepared in ArcGIS
in ArcGIS Online
Online [22],
[22], (B) Location History Visualizer [21]).
(B) Location History Visualizer [21]).
The design
The design of of heat
heat maps
maps in in cartography
cartographycan canbe beconsidered
consideredfrom fromvarious
variousperspectives:
perspectives:
mapped data, estimation methods, base map, color scheme, legend, and—last
mapped data, estimation methods, base map, color scheme, legend, and—lastbut butnotnot
least—generalization. Input data are usually referred to points, and
least—generalization. Input data are usually referred to points, and less frequently to lines. less frequently to
lines. Methods
Methods of transition
of transition from source
from source data todata to surfaces
surfaces is doneisby done by estimation,
estimation, usuallyusually
Kernel
Density Estimation or Point/Line Density Estimation [17,23,24]. Most often,often,
Kernel Density Estimation or Point/Line Density Estimation [17,23,24]. Most heat
heat maps
maps come with spectral or hypsometric scales, but single colors are
come with spectral or hypsometric scales, but single colors are used as well [4]. As the maps used as well [4]. As
the maps are created for quick reading, they are not always supplemented
are created for quick reading, they are not always supplemented by a legend, and the colors by a legend,
andself-evident
are the colors are (redself-evident
= more, green (red==less,
more, green
etc.). = less, can
Legends etc.). Legends
also can also be ordi-
be ordinal/interval and
refer to “low-to-high” values. The base maps used for heat maps vary fromheat
nal/interval and refer to “low-to-high” values. The base maps used for maps vary
OpenStreetMap
from
or OpenStreetMap
Google, via satelliteor Google,tovia
imagery satellite
highly imagery topographic
generalized to highly generalized
content—for topographic
example,
content—for example, streets—especially
streets—especially in printed maps [14]. in printed maps [14].
Generalization plays
Generalization plays anan important
important rolerole in
in every
everymap,
map,including
includingthematic
thematicmaps maps[25].[25].
The detailedness of heat maps is reflected by the radius of
The detailedness of heat maps is reflected by the radius of the kernel estimationthe kernel estimation function:
func-
the higher
tion: the radius,
the higher the more
the radius, thegeneralized the map,
more generalized and
the map,the “hot
and the spots”
“hot are more are
spots” blurred.
more
Generalization is crucial, especially in non-interactive maps, which
blurred. Generalization is crucial, especially in non-interactive maps, which cannot be cannot be dynamically
rescaled; thisrescaled;
dynamically factor influences
this factor theinfluences
effectiveness of web maps.ofThere
the effectiveness can be There
web maps. no effective
can be
no effective thematic map without simplifying input data and cartographically Raposo
thematic map without simplifying input data and cartographically refining them. refining
et al. [26]
them. underline
Raposo the underline
et al. [26] role of generalization in thematic mapping
the role of generalization in thematicby stating
mapping thatby “gener-
stating
alization is ubiquitous and critical in all cartography, and by
that “generalization is ubiquitous and critical in all cartography, and by corollary corollary that it is an im-
that
itportant aspect of the
is an important highly
aspect popular
of the highly thematic
popular mapping
thematiccurrently
mapping capturing
currentlypublic and
capturing
otherwise
public and non-cartographer attention”. The
otherwise non-cartographer authorsThe
attention”. alsoauthors
appliedalso the typology
applied the of general-
typology
of generalization operators (for content, geometry, symbol and label) proposed Brewer,
ization operators (for content, geometry, symbol and label) proposed by Roth, by Roth,
and Stryker
Brewer, and [27].
StrykerA set of the
[27]. A setmost prominent
of the thematic maps
most prominent thematicwasmapstagged using
was theseusing
tagged op-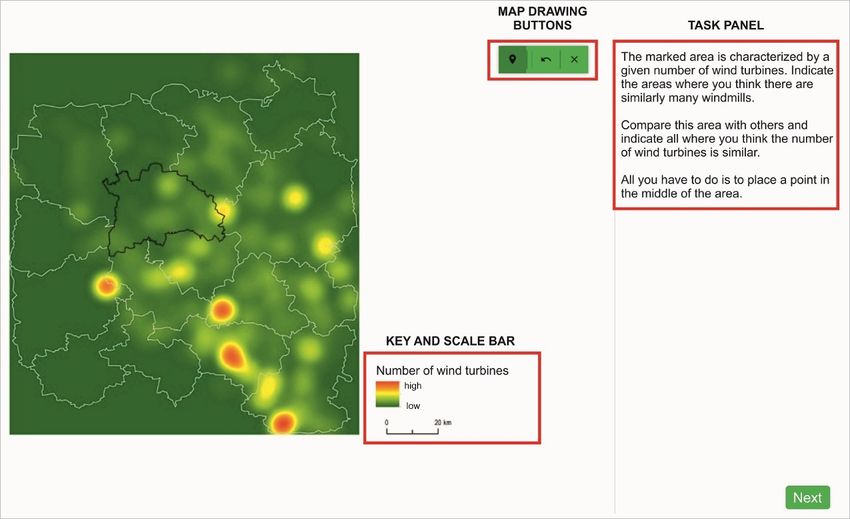
ISPRS Int. J. Geo-Inf. 2021, 10, 562                                                                                            3 of 24

                                       these operators, which were also distinguished as critical and incidental. The most com-
                                       mon operators are reclassification, aggregation, merging and simplification for thematic
                                       content, and elimination for base maps. Based on these rules, we can say that for heat
                                       maps, one should consider the following: reclassify for content, aggregate, merge, simplify,
                                       smooth for geometry, and adjust color, enhance, adjust pattern, adjust transparency for
                                       symbols. When elaborating a heat map, data are aggregated and merged by applying
                                       kernel density estimation; therefore, the surfaces are smoothed and simplified. The den-
                                       sity map is given an appropriate symbology (color scale) and, when the base map is
                                       present, transparency.
                                            Empirical verification of usability does not always keep pace with technological
                                       development. Often, science focuses on technical aspects, and only after the solutions
                                       are fully formed are they tested. This is likely the case with heat maps for which there
                                       is very little empirical research. Most of the previous studies on heat maps focused on
                                       software testing (performance, capabilities, etc.) [5,28] or involved heat maps as map types
                                       used for data visualization [29]. The generalization of heat maps can also be studied in
                                       terms of their usability, understood here as the efficiency of providing correct geographic
                                       information as quickly as possible. Therefore, in this study, we compared four heat maps
                                       with different levels of generalization—that is, a different kernel radius. The aforesaid level
                                       of generalization is crucial for thematic maps [25,26]; hence, we wanted to provide empirical
                                       evidence of if, and how, it differs in terms of usability metrics. We investigated whether heat
                                       maps are a good solution for making small-scale maps for quick reading, and if they allow
                                       young users to retrieve quantitative values quickly and correctly. Due to the increasing
                                       popularity of heat maps [5], we also wanted to analyze how they are judged from the
                                       perspective of users’ subjective metrics. We posed the following research questions:
                                       •    RQ1: How does heat map’s generalization, defined by the size of the kernel radius,
                                            influence its effectiveness?
                                       •    RQ2: What are the discrepancies between differently generalized heat maps in the
                                            context of efficiency and perceived efficiency?
                                       •    RQ3: How do users perceive heat map difficulty depending on a generalization level?
                                            In order to answer the research questions, we conducted a user study with 412 high
                                       school students (16–20 years old) during geography or IT lessons. The research group
                                       consisted of adolescents who have similar experiences with maps due to school education.
                                       We wanted to observe how different levels of heat map generalization—namely, different
                                       kernel radii—impact map usability.

                                       2. Background
                                       2.1. Heat Maps and Generalization in Cartography
                                             Comparing and evaluating design solutions within thematic map types is a common
                                       aim in empirical research in cartography [30–33]. Yet, heat maps have rarely been used as
                                       study material in empirical cartographic user-centered research. Map types with smooth
                                       presentation of data are often the subject of color scheme studies [34–37]. So far, in terms
                                       of the usability of heat maps, only studies of the subjective metrics and scenario-based
                                       design methods have been conducted. Netek et al. [4] analyzed preferences and heat
                                       map readability in relation to the cartographic education of users (42 experts, 27 novices).
                                       The authors examined user preferences and the legibility of maps presenting traffic-accident
                                       (point) data by using a questionnaire and a think-aloud interview. The questions given to
                                       the participants concerned color scales, the transparency of the heat maps in relation to the
                                       base map, and the generalization level. They analyzed four radius values: 10, 20, 30, and
                                       40 pixels, regardless of the map scale. The participants usually indicated their preference
                                       for lower values (10, 20 pixels)—namely, a less generalized map with visible “hot spots”.
                                       Radii of 10 and 20 pixels were also indicated as the most readable. Interestingly, novices
                                       more often indicated a 10-pixel radius, and experts a 20-pixel radius. Higher radii (30,
                                       40 pixels) were not preferred, as they provide more complex maps that require skills for
                                       correct interpretation, as many graphical overlaps occur. Netek et al. [4] recommended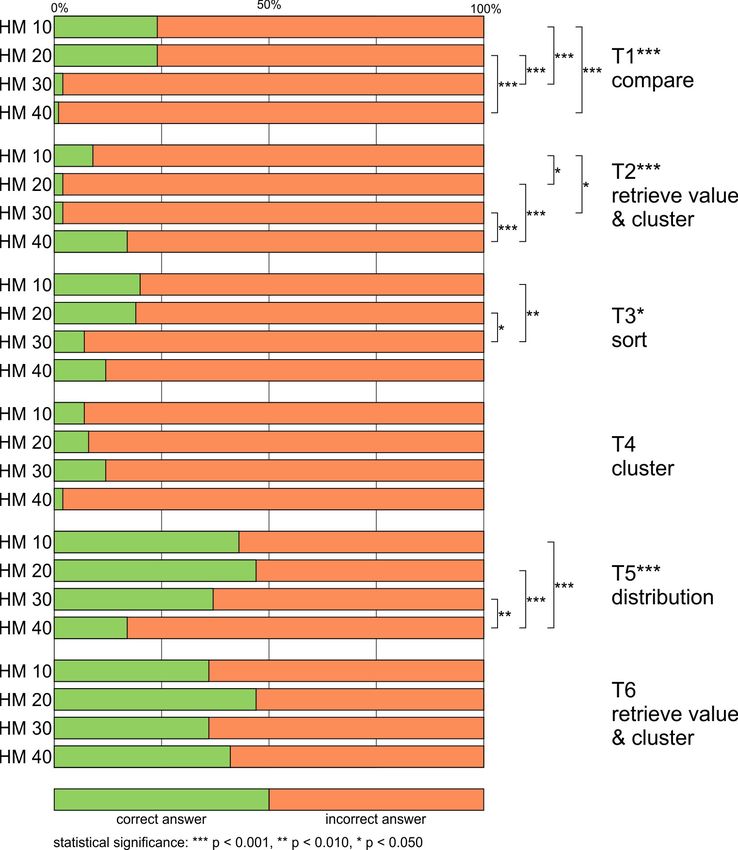
ISPRS Int. J. Geo-Inf. 2021, 10, 562                                                                                            4 of 24

                                       a heat map for the fast preview of data, identifying hot spots, but they advised against
                                       using it for reading exact values from the map. However, it should be noted that the
                                       research concerned only preferences, and not effectiveness—understood as the degree of
                                       effectiveness of the transmission of geographical information. What is more, the study did
                                       not include statistical analysis and the statistical significance of differences between the
                                       groups, or dependencies between the variables.
                                             Linear data could also be used to create heat maps. Nelson and MacEachren [38]
                                       studied Metro DataView—an interactive map that depicts data on bike traffic for urban
                                       planning purposes—using a raster-to-vector heat map. The authors presented the process
                                       of tool development, using scenario-based design techniques. Participants of the study
                                       assessed the heat maps as being easy to use and responsive. They also appreciated that
                                       this kind of visualization does not require a computationally expensive aggregation pro-
                                       cess. However, participants pointed out that it was not possible to obtain individual or
                                       aggregated data from the map. They also described it as “visually noisy”.
                                             As generalization is substantial for thematic mapping [25,26], a significant amount of
                                       research on this subject could be expected. However, most papers on the topic of general-
                                       ization incorporate theory or describe self-analysis by the authors [39,40]. The differences
                                       between multiscale thematic maps were analyzed by Roth et al. [41,42]. They took four map
                                       types into account: choropleth (continuous and abrupt), dot density (discrete and smooth),
                                       proportional symbol (discrete and abrupt), and tinted isoline, also referred to as a heat map
                                       (continuous and smooth); they examined these at two levels of resolution—25 square U.S.
                                       counties (overview) and 625 square U.S. townships (detailed view). In this task-based study,
                                       171 participants took part. In their preliminary results, the authors reported that participants
                                       were more comfortable with continuous than discrete thematic maps, as they reported better
                                       results on metrics of confidence and difficulty for these map types. What is more, tasks solved
                                       with tinted isoline maps had a low error rate, as around 90% of responses were correct;
                                       in the case of proportional symbols, approximately 84% were correct; for the choropleth map,
                                       approximately 70%; and for the dot density map, approximately 54%. The results indicate
                                       that it is worth developing and using widely continuous mapping techniques.
                                             To sum up, the studies described above have identified a range of issues that should
                                       be investigated in more detail with regard to heat maps. The preferences of the respondents
                                       require confirmation through analyses, taking statistical testing into account, and require
                                       consideration of the variables of effectiveness and efficiency.

                                       2.2. Objective and Subjective Metrics
                                            Subjective metrics are as substantial in usability studies as objective metrics [43,44].
                                       They include not only preferences [4,30,45,46], but also an assessment of the difficulty of
                                       the task [32,41,42], the confidence of the response [41,42], a response time assessment and
                                       the users’ comfort level [47].
                                            In studies conducted on interactive thematic maps, Andrienko and Andrienko [47]
                                       reported that user satisfaction corresponds to user performance (namely, accuracy of
                                       response). Similarly, in the Roth et al. study [41,42], participants using discrete mapping
                                       techniques had good results in terms of the error rate and, at the same time, assessed
                                       these maps well in terms of response confidence and difficulty. However, studies that take
                                       visualization complexity into consideration report that users prefer more complex maps,
                                       even when they do not perform better while using them [48,49]. In summary, the results
                                       for consistency of objective and subjective metrics are not always coherent.

                                       3. User Study
                                            The aim of the study was to fill the gap in user studies on heat maps of various kernel
                                       radii. We decided to take up this topic because there are many papers on the technological
                                       aspects of heat maps, and what is more, this type of thematic map is used more and more
                                       often as a means of quick visualization—for example, in internet portals—yet heat maps
                                       have not been empirically tested thoroughly. We chose to compare heat maps with various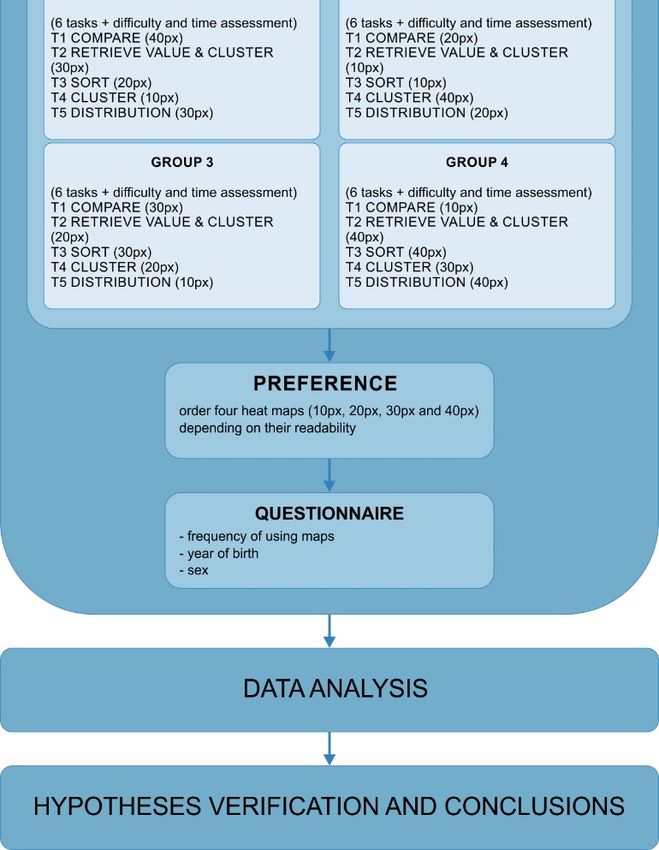
ISPRS Int. J. Geo-Inf. 2021, 10, x FOR PEER REVIEW 5 of 25
ISPRS Int. J. Geo-Inf. 2021, 10, 562
aspects of heat maps, and what is more, this type of thematic map is used more and more 5 of 24
often as a means of quick visualization—for example, in internet portals—yet heat maps
have not been empirically tested thoroughly. We chose to compare heat maps with vari-
ous degrees of generalization in terms of effectiveness (correctness of response), efficiency
degrees
(time of generalization
of response), in terms
perceived of effectiveness
response (correctness
time, task difficulty, andofuser
response), efficiency (time
preferences.
of response),
We formulatedperceived
threeresponse
hypothesestime, task difficulty,
addressing and user
the research preferences.
questions presented in the
We formulated three hypotheses addressing the research questions presented in
introduction:
the introduction:
Hypothesis 1 (H1). Lower levels of generalization result in higher correctness of answers by heat
mapHypothesis
users. 1 (H1). Lower levels of generalization result in higher correctness of answers by heat
map users.
Hypothesis 2 (H2). Higher levels of generalization result in faster responses and a higher per-
Hypothesis
ceived efficiency2by heatHigher
(H2). levels of generalization result in faster responses and a higher perceived
map users.
efficiency by heat map users.
Hypothesis 3 (H3). Heat map users perceive less generalized maps as easier.
Hypothesis 3 (H3). Heat map users perceive less generalized maps as easier.
As the level of generalization is considered important for thematic maps, we as-
sumedAs thatthe level ofthe
it affects generalization is considered
usability of heat maps. Weimportant
expect thatforprecise
thematic maps, we assumed
information, which
is a consequence of the lower level of generalization, results in higher accuracy ofwhich
that it affects the usability of heat maps. We expect that precise information, is a
the an-
consequence of the lower level of generalization, results in higher accuracy
swers given by the map users. Moreover, we expect that map users perceive less general- of the answers
given
ized mapsby as
theeasier,
map users.
as the Moreover,
information weisexpect that map users
more explicit—as perceive
studied less generalized
by Netek et al. [4].
maps as
Finally, easier,
when as the information
it comes to the time ofis more explicit—as
the response and studied
perceived by time
Netekofetresponse,
al. [4]. Finally,
we
when that
believe it comes to thelevel
a higher timeofofgeneralization
the response and perceived
provokes timeanswers
faster of response, we believe
and the that a
impression
higher level of generalization provokes faster answers and the impression of a faster reply,
of a faster reply, as the map is less visually complex.
as the map is less visually complex.
3.1. Study
3.1. StudyMaterial
Material
InIn
the
the study,we
study, wedecided
decidedtotocompare
comparefour fourheat
heatmaps
maps(later
(laterreferred
referredtotoasasHM)
HM)with
with
different
differentlevels
levels of generalization(Table
of generalization (Table1). 1).
ForForthis this reason,
reason, 24 maps24 onmaps on ofa 1:1,000,000
a scale scale of
1:1,000,000
were createdwereand
created
servedandasserved as the stimuli
the stimuli to be usedto bewhen
used solving
when solving different
different tasks tasks
by the
byusers
the users (Figure S1). The thematic content used to prepare the heat
(Figure S1). The thematic content used to prepare the heat maps were wind turbines maps were wind
turbines (point
(point data) data)
from the from the beginning
beginning of the 19th of the 19th
century, century,
derived derived
from the from the
Gaul/Raczy ński
Gaul/Raczyński database [50]. As base maps, 16 Polish districts with
database [50]. As base maps, 16 Polish districts with their borders slightly changed their borders slightly
were
changed
chosen.were chosen. We
We obtained theobtained the base
data for the data map
for the base
from map
the fromPolish
official the official
State Polish
database State
[51].
database
The maps [51]. Theprepared
were maps were prepared
in ArcGIS 10.3inwith
ArcGIS 10.3 with
the Kernel the Kernel
Density Density
tool, and tool,radius
the kernel and
the
waskernel radius
chosen was
based onchosen
previous based on previous
research [4]. research [4].
TableTable
1. Comparison of heat
1. Comparison of maps elaborated
heat maps for the
elaborated forstudy.
the study.
The
TheSearch
SearchRadius
Radius (px)
(px) TheSearch
The Search Radius
Radius (Meters)
(Meters) Stimuli
Stimuli Code
Code Map
Map Preview
Preview
10
10 2640
2640 HM10
HM10
ISPRS Int. J. Geo-Inf. 2021, 10, x FOR PEER REVIEW 6 of 25
20
20 5290
5290 HM20
HM20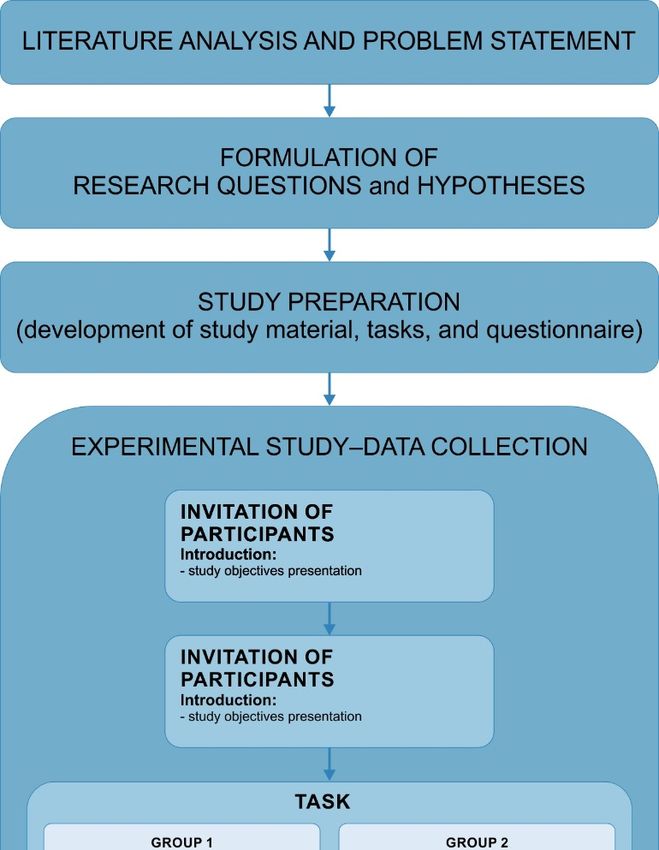
20 5290 HM20
ISPRS Int. J. Geo-Inf. 2021, 10, 562 6 of 24
20 5290 HM20
Table 1. Cont.
The Search Radius (px) The Search Radius (Meters) Stimuli Code Map Preview
30 7930 HM30
30
30 7930
7930 HM30
HM30
40
40 10,580
10,580 HM40
HM40
40 10,580 HM40
3.2.
3.2. Participants
Participants
InIn total,
3.2. Participants
total, 412412 high
high school
school students
students took
took partpart
ininthethe study,
study, voluntarily.Approximately
voluntarily. Approximately
half (51%)
half (51%) of
of thethe respondents declared that they use maps once a month or less frequently.
In total, 412respondents declared took
high school students that they
part use maps
in the oncevoluntarily.
study, a month or Approximately
less frequently.
Only
Only(51%) 34%
34% of the of respondents
respondents claimed
claimed that
thatthat they
they use
useuse maps
maps once
once a week
a week or
or moremore often. Some
half respondents declared they maps once a month or lessoften. Some
frequently.
15% claimed
15% claimed not to use maps at all. Participants were aged between 16 and 20 (M = 17.49,
Only 34% of not to use maps
respondents at all.that
claimed Participants
they usewere mapsaged oncebetween
a week 16 or and
more20often.
(M = 17.49,
Some
SD = 0.83). In the study group, the participants were 59% women and 41% men.
SD =claimed
15% 0.83). Innot the tostudy group,atthe
use maps all.participants
Participantswere were59% agedwomenbetween and1641%andmen.
20 (M = 17.49,
SD3.3.
= 0.83). In the study
Tasks and Procedures group, the participants were 59% women and 41% men.
3.3. Tasks and Procedures
To define the tasks for heat maps analysis (maps for quick reading), we used a
3.3. Tasks and Procedures
To define theobjective-based
tasks for heat maps analysis
compilation of taxonomies by(maps for quick
Roth [52]. We had reading),
six tasks weasking
used ausers
com-to
pilation
compare, of
To defineobjective-based
sort,the taxonomies
tasks analyze
cluster, by
for heat distribution, Roth
maps analysis [52].
and(maps We had
for value
retrieve six
quick andtasks asking
reading),
clusterwe users to com-
used (Table
(twice) a 2).
pare, sort,
pilation
In three cluster,
oftasks (T1,analyze
objective-basedT5, T6)distribution,
taxonomies
respondentsby andRoth
had retrieve
[52]. We
to indicate value
ahad andsixcluster
correct tasks
answer (twice)
asking (Table
fromusers
the to 2).
com-
options: InA,
three
pare, tasks
B, C,sort, (T1,
D. InT5,
andcluster, T6)
analyze
T1, respondents
distribution,
a particular hadand
district to indicate
was retrieve
expected avalue
correct
to beand answer
clusterfrom
indicated; (twice)
in T5,theproportions
options:
(Table 2). A,
Inof
B,two
C, and
three tasks D. In
(T1, T1,
T5, a particular
T6) district
respondents had wasto expected
indicate a to be
correctindicated;
answer
areas were divided by a line; and in T6, an estimation of the number of wind turbines in
fromT5, proportions
the options: of
A,
two
B, C, areas
and were
D. In divided
T1, a by
particulara line; and
district in
wasT6, an estimation
expected to be of the number
indicated;
was made. Two further tasks (T2, T3) were open questions, and the users were asked to in of
T5, wind turbines
proportions of
was
two made.were
areas
estimate Two
the furtherofby
divided
number tasks (T2,
a line;
wind T3)in
and
turbines were open
T6, an
(T2) and questions,
estimation
sort and
of the
districts the users
in number
descending were
orderasked
of wind basedtoon
turbines
estimate
was
themade.
numberthe number
Two further
of wind of wind turbines
tasks (T2,
turbines (T3).T3)
The(T2)
were and
last opensort
type of districts
questions, in
task (T4) and descending
the users
involved order based
were asked
indicating on
to
(marking)
the number
estimate theof
a particular wind turbines
number
district of
onwind (T3). The(T2)
turbines
the map, based last
ontype
and of task
sort
a comparison (T4)with
districts involved
in descending
another indicating
order(marking)
district. based on
a particular
the number
The studydistrict
of wind wason the
turbines map,
conveyed based
(T3). The
in on atype
last
Poland comparison
of task
using a web with
(T4) anotherindicating
involved
application district. (marking)
during high school
a particular district on the map, based on a comparison with another
geography or IT lessons (Figure 2, link to the application with the study: https://emprek- district.
Table 2. Content of tasks, type of tasks, and answer types.
ca39f.firebaseapp.com/badania/heat-map-v3, accessed on 6 July 2021). The participants
Table 2. Content of
were divided tasks,
into type
four, of tasks,
almost and answer
parallel, groupstypes.with approximately 100 people in each.
Each participant solved one of the four possible tests, which were randomly selected when
the application started. The tests differed in generalization levels (4) and area variants (2) of
the heat maps in order to avoid a learning effect. These areas, although different, were of a
similar degree of difficulty, so the results are comparable.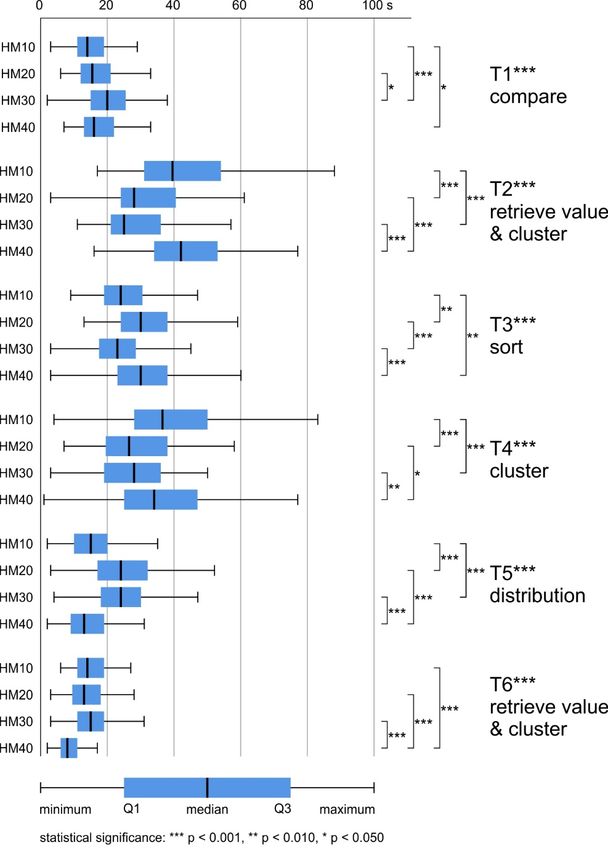
T2 retrieve
In the marked areas, there is a given number of wind turbines. Estimate how Open ques-
value and
ISPRS Int. J. Geo-Inf. 2021, 10, 562 many turbines are in the highlighted area. tion 7 of 24
cluster
Order the areas, starting with the one where the number of wind turbines is Open ques-
T3 sort
the smallest. tion
Table 2. Content of tasks, type of tasks, and answer types.
The marked area is characterized by a given number of wind turbines. Indi-
T4 cluster Mark on map
Task Numbercate the areas where you think there is aTask similar number of wind turbines. Answer Type
There are a different number
Identify the of wind
area where you turbines in thenumber
see the highest area divided
of wind by the line.
turbine
T1 compare A, B, C
T5 distribution Estimate the proportions in which the whole
sites (among three area was divided in terms of
marked). A, B, C, D
In the marked areas,their number.
there is a given number of wind turbines.
T2 retrieve value and cluster Open question
T6 retrieve Estimate how many turbines are in the highlighted area.
Estimate how many wind turbines are in the marked area. A, B, C, D
value & cluster Order the areas, starting with the one where the number of wind
T3 sort Open question
turbines is the smallest.
The
Thestudy
marked wasarea
conveyed in Poland
is characterized by ausing a web application
given number of wind during high school ge-
T4 cluster ography or IT lessons (Figure 2, link to the application
turbines. Indicate the areas where you think there is a similar with the study: https://emprek-
Mark on map
number of wind turbines.
ca39f.firebaseapp.com/badania/heat-map-v3, accessed on 6 July 2021). The participants
were There
divided
are ainto four,number
different almost ofparallel, groupsinwith
wind turbines approximately
the area divided 100 people in each.
T5 distribution Each by
participant solved one
the line. Estimate of the four in
the proportions possible tests,
which the which
whole areawere
was randomly A,selected
B, C, D when
the application started. divided
Theintests
terms of their in
differed number.
generalization levels (4) and area variants (2)
T6 retrieve value & cluster of the heat maps how
Estimate in order
manytowind
avoid a learning
turbines are in effect. These
the marked areas, althoughA,different,
area. B, C, D were
of a similar degree of difficulty, so the results are comparable.
Figure 2.
Figure 2. Example
Example of
of the
the main
main window
window of
of the
the web
web application
application for
for participants:
participants: the
the map
map is
is on
on the
the left
left side
side of
of the
the window;
window;
the key, and scale bar are on the right side at the bottom; and the buttons with tools for drawing points are in the upper
the key, and scale bar are on the right side at the bottom; and the buttons with tools for drawing points are in the upper
right corner. On the right is a task panel, in which the participants provide their answers.
right corner. On the right is a task panel, in which the participants provide their answers.
The
The study
study began
began with
with anan introduction
introduction to to the
the research,
research, during
during which
which its
its purpose,
purpose,
aims, and goals were explained. When starting the study, the application
aims, and goals were explained. When starting the study, the application randomized randomized the
test. In the test, users had to answer every question before moving on.
the test. In the test, users had to answer every question before moving on. After each After each task, the
participant answered questions on the difficulty assessment and time assessment,
task, the participant answered questions on the difficulty assessment and time assessment, both on
aboth
5-point
on aLikert
5-point scale, from
Likert (1) from
scale, very (1)
easy/fast to (5) very
very easy/fast todifficult/slow. The time The
(5) very difficult/slow. was time
con-
trolled
was during the
controlled test, the
during so ittest,
could becould
so it possible to compare
be possible the timethe
to compare assessment and the and
time assessment real
time spent on solving the tasks. At the end of the test, participants were asked
the real time spent on solving the tasks. At the end of the test, participants were asked about their
about their preferences, and had to order four heat maps (10 px, 20 px, 30 px and 40 px)
based on their readability. Finally, they filled in the personal questionnaire with questions
about the year of birth, sex, and frequency of using maps (Figure 3).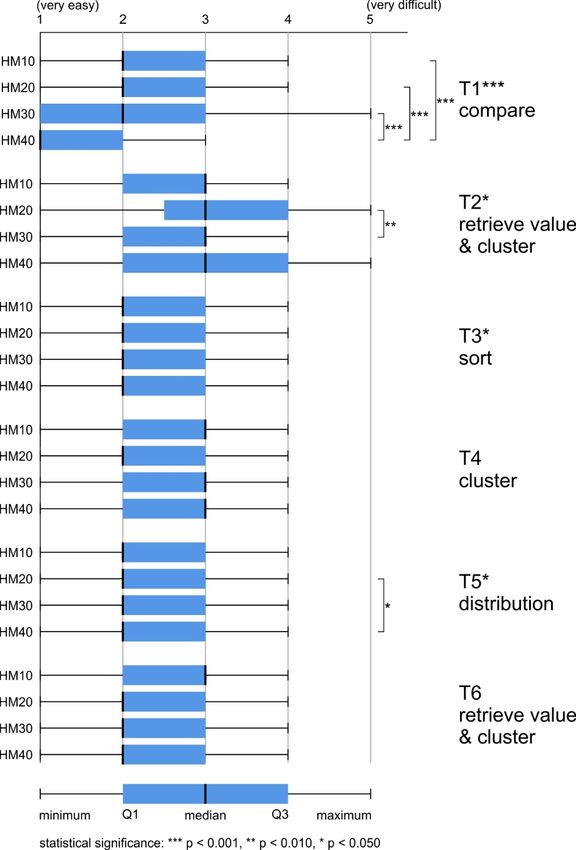
ISPRS Int. J. Geo-Inf. 2021, 10, 562                            8 of 24
ISPRS Int. J. Geo-Inf. 2021, 10, x FOR PEER REVIEW              9 of 25

                                   Figure
                                   Figure 3.
                                          3. Study
                                             Study procedure.
                                                   procedure.

                                   3.4. Data Analysis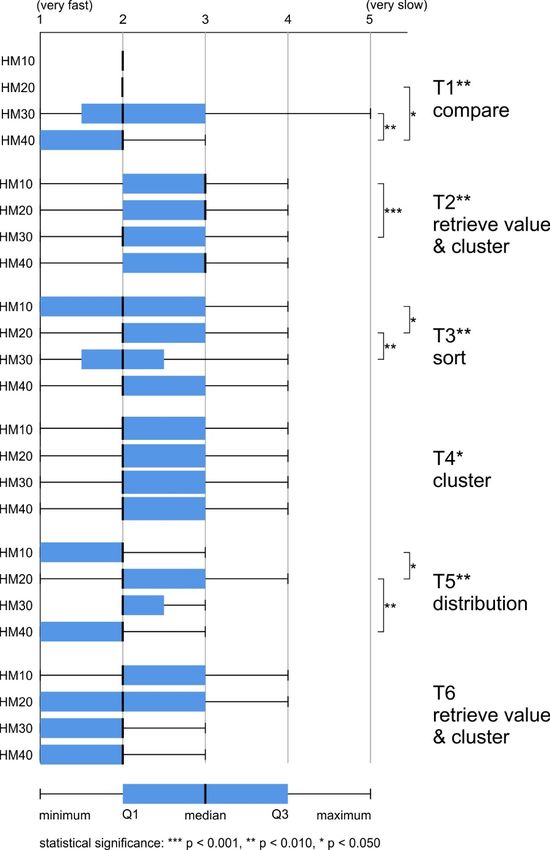
ISPRS Int. J. Geo-Inf. 2021, 10, 562                                                                                           9 of 24

                                       3.4. Data Analysis
                                             Data were statistically analyzed in SPSS Statistics software. The chi-square test,
                                       which allows the dependence between variables to be verified, was applied for correctness
                                       of the response. Additionally, Cramér’s V was used to indicate the degree of association
                                       between the two variables. It is an extension of the chi-square test for tables larger than
                                       2 × 2 [53]. Concerning the time metrics, the data did not follow the normal distribution
                                       according to the Kolmogorov–Smirnov test; therefore, the Kruskal–Wallis test was applied.
                                       The Kruskal–Wallis test is a non-parametric test that can be performed on ranked data.
                                       The Kruskal–Wallis test allows for the verification of a significant difference between at
                                       least two groups in terms of the medians in the set of all analyzed medians [53]. For the
                                       last two variables—time assessment and task difficulty—data were collected on the ordinal
                                       Likert scale; thus, the Kruskal–Wallis test was used.

                                       4. Results
                                       4.1. Answer Correctness
                                             The participants answered 20% of all tasks correctly. The highest rate of correct
                                       answers was measured while using HM20 (25%) and HM10 (24%). While using more gen-
                                       eralized maps, participants achieved a lower score (HM30 16%; HM40 15%). The accuracy
                                       of answers was dependent on the level of heat map generalization: X2 (3, N = 2454) = 29.145,
                                       p < 0.001, Cramér’s V = 0.109, p < 0.001. Moreover, pairwise comparisons showed that the
                                       relation between variables occurred in four cases when comparing less generalized maps
                                       (HM10, HM20) with more generalized (HM30, HM40):
                                       •    HM10-HM20 X2 ns (the abbreviation ‘ns’ stands for ‘not statistically significant’);
                                       •    HM10-HM30 X2 (1, N = 1238) = 11.483, p < 0.001, Cramér’s V = 0.096, p < 0.001 (with
                                            better results for participants working with HM10);
                                       •    HM10-HM40 X2 (1, N = 1217) = 13.859, p < 0.001, Cramér’s V = 0.107, p < 0.001 (with
                                            better results for participants working with HM10);
                                       •    HM20-HM30 X2 (1, N = 1237) = 17.962, p < 0.001, Cramér’s V = 0.110, p < 0.001 (with
                                            better results for participants working with HM20);
                                       •    HM20-HM40 X2 (1, N = 1216) = 17.600, p < 0.001, Cramér’s V = 0.120, p < 0.001 (with
                                            better results for participants working with HM20);
                                       •    HM30-HM40 ns.
                                            The highest rate of correct answers was obtained for T6 retrieve value and cluster
                                       (40%). Slightly fewer respondents answered correctly for T5 distribution (37%). In both
                                       cases, the highest percentage of correct answers was achieved in the HM20 group (47%).
                                       The lowest rate of correct answers was obtained for two tasks—T2 retrieve value and
                                       cluster, and T4 cluster (7%). In the case of these questions, in some groups, only 1 or 2% of
                                       the respondents chose the right answer (e.g., HM30, HM40, Figure 4).
                                            When it comes to inferential analysis, the statistical significance of the association
                                       between the mapping type and the correctness of the answers was found for four out
                                       of the six tasks: T1 compare, T2 retrieve value and cluster, T3 sort, and T5 distribution
                                       (Table 3). In one case, the association was moderate (T1), and in the remaining three cases,
                                       the dependence was weak (T2, T3, T5).
                                            In T1 compare, the best result (24%) was achieved for HM10 and HM20, and the
                                       outcome of the statistical tests was significant when the results were compared to the results
                                       recorded with HM30 and HM40, which performed very poorly (HM30 2%, HM40 1%)
                                       (HM10-HM30 p < 0.001; HM10-HM40 p < 0.001; HM20-HM30 p < 0.001; HM20-HM40
                                       p < 0.001). A similar situation was found for T3. In that case, the pairwise comparisons
                                       showed that the dependence of the correctness of the answer on the level of generalization
                                       was significant only when comparing the results of HM10 (20%) and HM20 (19%) with
                                       the results of HM30 (7%), but not with those of HM40 (12%) (HM10-HM30 p < 0.010;
                                       HM20-HM30 p < 0.050).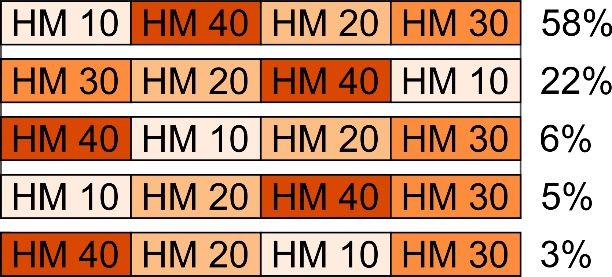
ISPRS Int. J. Geo-Inf. 2021, 10, 562 10 of 24
ISPRS Int. J. Geo-Inf. 2021, 10, x FOR PEER REVIEW 11 of 25
Figure 4. Differences in answer accuracy between participants using the four tested heat maps.
Figure 4. Differences in answer accuracy between participants using the four tested heat maps.
When
In the itT5comes to inferential
distribution, the bestanalysis, the obtained
results were statisticalfor
significance
HM20 (47%), of with
the association
slightly
between the mapping
worse results for HM10 type andand
(43%) the HM30
correctness
(37%).ofThe
the dependence
answers wasoffound for four out
the correctness of of
the
thesix tasks:on
answer T1 the
compare,
level ofT2
mapretrieve value andwas
generalization cluster, T3 sort,when
significant and T5 distribution
comparing each(Table
of
these
3). maps
In one to HM40,
case, for which was
the association respondents
moderate obtained the in
(T1), and worst
the rate of correct
remaining answers—
three cases, the
17% (HM10-HM40
dependence was weakp < (T2,
0.001;T3,
HM20-HM40
T5). p < 0.001; HM30-HM40 p < 0.010). A different
situation was discovered in the case of T2 retrieve value and cluster, in which HM40
provided
Table the most
3. Inferential correctfor
statistics answers
answer(17%), HM10
accuracy provided
between fewer (9%),
participants using and the least
the four testedwas
heat
provided by HM20 and HM30 (2% each). Statistically significant results were found when
maps.
comparing two better maps to two worse maps (HM10-HM20 p < 0.050; HM10-HM30
p < 0.050; HM20-HM40 Pairwisep < 0.001).
p < 0.001; HM30-HM40
Cramer’s Cra-
Task chi2 p P
Compari- chi-Square p p
V mér’s V
son
HM10- X2 (1, N = 201) =
ns -
HM20 0.014
V = 0.337
X2 (3, N = 402) = p< HM10- X2 (1, N = 198) = p < V= p<
T1 compare p < 0.001 (MODER-
45.547 0.001 HM30 21.429 0.001 0.329 0.001
ATE)
HM10- X2 (1, N = 201) = p < V= p<
HM40 24.962 0.001 0.352 0.001ISPRS Int. J. Geo-Inf. 2021, 10, 562 11 of 24
Table 3. Inferential statistics for answer accuracy between participants using the four tested heat maps.
Pairwise
Task chi2 p Cramer’s V p chi-Square p Cramér’s V p
Comparison
HM10-HM20 X2 (1, N = 201) = 0.014 ns -
HM10-HM30 X2 (1, N = 198) = 21.429 p < 0.001 V = 0.329 p < 0.001
V = 0.337 HM10-HM40 X2 (1, N = 201) = 24.962 p < 0.001 V = 0.352 p < 0.001
T1 compare X2 (3, N = 402) = 45.547 p < 0.001 p < 0.001
(MODERATE) HM20-HM30 X2 (1, N = 201) = 20.638 p < 0.001 V = 0.320 p < 0.001
HM20-HM40 X2 (1, N = 204) = 24.115 p < 0.001 V = 0.344 p < 0.001
HM30-HM40 X2 (1, N = 201) = 0.369 ns -
HM10-HM20 X2 (1, N = 201) = 4.495 p < 0.050 V = 0.150 p < 0.050
HM10-HM30 X2 (1, N = 204) = 4.708 p < 0.050 V = 0.152 p < 0.050
V = 0.235 HM10-HM40 X2 (1, N = 202) = 3.010 ns -
T2 retrieve value and cluster X2 (3, N = 403) = 22.213 p < 0.001 p < 0.001
(WEAK) HM20-HM30 X2 (1, N = 201) = 0.001 ns -
HM20-HM40 X2 (1, N = 199) = 12.926 p < 0.001 V = 0.255 p < 0.001
HM30-HM40 X2 (1, N = 202) = 13.403 p < 0.001 V = 0.258 p < 0.001
HM10-HM20 X2 (1, N = 200) = 0.062 ns -
HM10-HM30 X2 (1, N = 210) = 7.647 p < 0.010 V = 0.191 p < 0.010
V = 0.152 HM10-HM40 X2 (1, N = 210) = 2.848 ns
T3 sort X2 (3, N = 422) = 9.699 p < 0.050 p < 0.050
(WEAK) HM20-HM30 X2 (1, N = 212) = 6.408 p < 0.050 V = 0.174 p < 0.050
HM20-HM40 X2 (1, N = 212) = 2.080 ns -
HM30-HM40 X2 (1, N = 222) = 1.315 ns -
T4 cluster X2 (3, N = 411) = 7.300 ns -
HM10-HM20 X2 (1, N = 222) = 0.291 nsns
HM10-HM30 X2 (1, N = 211) = 0.852 nsns
V = 0.235 HM10-HM40 X2 (1, N = 210) = 16.643 p < 0.001 V = 0.282 p < 0.001
T5 distribution X2 (3, N = 421) = 23.250 p < 0.001 p < 0.001
(WEAK) HM20-HM30 X2 (1, N = 211) = 2.091 ns -
HM20-HM40 X2 (1, N = 210) = 20.888 p < 0.001 V = 0.315 p < 0.001
HM30-HM40 X2 (1, N = 199) = 9.892 p < 0.010 V = 0.223 p < 0.010
T6 retrieve value and cluster X2 (3, N = 400) = 3.063 ns -ISPRS Int. J. Geo-Inf. 2021, 10, 562 12 of 24
4.2. Response Time
The mean response time for all maps was similar (HM10 M = 26.5 s, SD = 0.767; HM20
M = 25.3 s, SD = 0.558; HM30 M = 24.6, SD = 0.543; HM40 M = 26.4, SD = 0.782). The differ-
ences in response time while using heat maps with different levels of generalization were
not significant: H (3) = 1.898, ns.
The average task-solving time varied by up to 24 s. The task, which on average was an-
swered the slowest, was the T2 retrieve value and cluster (M = 38.6 s, SD = 0.958). The low-
est mean response time was achieved for the T6 retrieve value and cluster (M = 14.0 s,
SD = 0.385). For T1 compare and T5 distribution, the difference was less than two seconds
(T1 M = 18.6 s, SD = 0.509; T5 M = 20.5 s, SD = 0.584). For T3 sort and T4 cluster, the average
response
ISPRS Int. J. Geo-Inf. 2021, 10, timeREVIEW
x FOR PEER was around 30 s (T3 M = 28.8 s, SD = 0.637; T3 M = 33.5 s, SD = 0.940) 14
(Figure 5).
Figure 5. Differences
Figure in in
5. Differences answer time
answer timebetween
betweenparticipants
participants using the four
using the four tested
testedheat
heatmaps.
maps.
The differences in response time between the maps were statistically significan
all tasks, and post hoc (Bonferroni) tests were conducted in order to identify signifi
intergroup differences (Table 4).
Table 4. Inferential statistics between participants using the four tested heat maps.ISPRS Int. J. Geo-Inf. 2021, 10, 562 13 of 24
The differences in response time between the maps were statistically significant for
all tasks, and post hoc (Bonferroni) tests were conducted in order to identify significant
intergroup differences (Table 4).
Table 4. Inferential statistics between participants using the four tested heat maps.
Task Kruskal–Wallis H p Method M (s) SD Post Hoc Groups p
HM10 15.7 0.741 HM10-HM20 ns
HM20 17.4 0.757 HM10-HM30 p < 0.001
HM30 21.7 1.187 HM10-HM40 p < 0.050
T1 compare X2 (3, N = 402) = 23.783 p < 0.001
HM40 19.7 1.203 HM20-HM30 p < 0.050
HM20-HM40 ns
HM30-HM40 ns
HM10 45.4 2.301 HM10-HM20 p < 0.001
HM20 33.7 1.346 HM10-HM30 p < 0.001
T2 retrieve HM30 31.0 1.699 HM10-HM40 ns
value & X2 (3, N = 403) = 76.113 p < 0.001
cluster HM40 45.1 1.693 HM20-HM30 ns
HM20-HM40 p < 0.001
HM30-HM40 p < 0.001
HM10 26.7 1.230 HM10-HM20 p < 0.010
HM20 31.9 1.219 HM10-HM30 ns
HM30 24.4 1.004 HM10-HM40 p < 0.010
T3 sort X2 (3, N = 422) = 37.750 p < 0.001
HM40 32.3 1.434 HM20-HM30 p < 0.001
HM20-HM40 ns
HM30-HM40 p < 0.001
HM10 39.8 2.071 HM10-HM20 p < 0.001
HM20 30.1 1.619 HM10-HM30 p < 0.001
HM30 28.0 1.181 HM10-HM40 ns
T4 cluster X2 (3, N = 411) = 29.231 p < 0.001
HM40 36.7 2.344 HM20-HM30 ns
HM20-HM40 p < 0.050
HM30-HM40 p < 0.010
HM10 16.5 0.843 HM10-HM20 p < 0.001
HM20 25.4 1.165 HM10-HM30 p < 0.001
T5 HM30 25.6 1.412 HM10-HM40 ns
X2 (3, N = 421) = 97.307 p < 0.001
distribution HM40 14.3 0.671 HM20-HM30 ns
HM20-HM40 p < 0.001
HM30-HM40 p < 0.001
HM10 15.1 0.562 HM10-HM20 ns
HM20 14.5 0.749 HM10-HM30 ns
T6 retrieve HM30 16.9 0.989 HM10-HM40 p < 0.001
value & X2 (3, N = 400) = 91.527 p < 0.001
cluster HM40 8.7 0.364 HM20-HM30 ns
HM20-HM40 p < 0.001
HM30-HM40 p < 0.001ISPRS Int. J. Geo-Inf. 2021, 10, 562 14 of 24
In T1 compare, respondents using HM10 answered significantly faster than those
using HM30 or HM40 (HM10-HM30 p < 0.001, HM10-HM40 p < 0.050). What is more,
participants who solved this task using HM20 answered faster than those using HM30
(HM20-HM30 p < 0.050).
In T2 retrieve value, T3 sort, and T4 cluster, respondents using HM30 responded the
fastest. In T3 sort, respondents using HM10 answered slightly slower than those using
HM30. Statistically significant differences occurred between HM10-HM20 (p < 0.010),
HM10-HM40 (p < 0.010), HM20-HM30 (p < 0.001) and HM30-HM40 (p < 0.001). In T2
retrieve value and cluster, and T4 cluster, respondents using HM20 and HM30 answered
questions significantly faster than those using HM10 and HM40 (T2 HM10-HM20 p < 0.001,
HM10-HM30 p < 0.001, HM20-HM40 p < 0.001, HM30-HM40 p < 0.00; T4 HM10-HM20
p < 0.001, HM10-HM30 p < 0.001, HM20-HM40 p < 0.050, HM30-HM40 p < 0.010).
The last two tasks (T5 distribution, T6 retrieve value and cluster) were solved most
quickly by respondents using HM40 (T5 M = 14.3 s, SD = 0.671; T6 M = 8.7 s, SD = 0.364).
In T5 distribution, respondents using HM10 responded slightly slower than those using
HM40. Statistically significant differences occurred between maps with extreme generaliza-
tion values (HM10, HM40—fastest) and those with average generalization values (HM20,
HM30—slowest): HM10-HM20 p < 0.001; HM10-HM30 p < 0.001; HM20-HM40 p < 0.001;
HM30-HM40 p < 0.001. In the case of T6 retrieve value and cluster, significant differences
occurred between HM40 and the other maps that took, on average, almost twice as long to
solve the task (HM10-HM40 p < 0.001; HM20-HM40 p < 0.001; HM30-HM40 p < 0.001).
4.3. Response Time Assessment
Most of the tasks were assessed as being resolved very quickly (20%), or quickly
(48%). The answer “hard to say” was indicated in 25% of all tasks. Negative assessments
of difficulties appeared less frequently (“slow” 6%, “very slow” 1%).
For each of the analyzed maps, the median was 2 (“fast”). However, while using more
generalized maps (HM30, HM40), respondents assessed their completion of tasks as slightly
faster (over 70% of responses were from categories “very fast” or “fast”). When using less
generalized maps (HM10, HM20), these assessments accounted for 65% of the responses.
The differences in response time assessment while using heat maps with different levels of
generalization were significant: H (3) = 13.434, p < 0.010. Post hoc comparisons indicated
that the maps that differed significantly from one another (in favor of more generalized
maps) were HM20 and HM40 (p < 0.050) (Figure 6).
The differences in the assessment of time between the maps and post hoc (Bonferroni)
tests were statistically significant for four of the six tasks: T1 compare, T2 retrieve value
and cluster, T3 sort, and T5 distribution (Table 5). For eight cases of intergroup differences,
six were in favor of more generalized maps.
In T1 compare, the participants using HM40 assessed the response time as faster
than respondents using HM20 (p < 0.050) or HM30 (p < 0.010). In turn, in T2 HM30 was
assessed as significantly faster than HM10 (p < 0.001). Interestingly, in both T3 sort and T5
distribution, two significant intergroup differences were detected—one in favor of a less
generalized map (T3 HM10-HM20 p < 0.050; T5 HM10-HM20 p < 0.050), and the other in
favor of a more generalized map (T3 HM20-HM30 p < 0.010; T5 HM20-HM40 p < 0.010).more generalized maps (HM30, HM40), respondents assessed their completion of tasks as
slightly faster (over 70% of responses were from categories “very fast” or “fast”). When
using less generalized maps (HM10, HM20), these assessments accounted for 65% of the
responses. The differences in response time assessment while using heat maps with dif-
ISPRS Int. J. Geo-Inf. 2021, 10, 562 ferent levels of generalization were significant: H (3) = 13.434, p < 0.010. Post hoc
15 ofcompar-
24
isons indicated that the maps that differed significantly from one another (in favor of more
generalized maps) were HM20 and HM40 (p < 0.050) (Figure 6).
Figure 6. Differences in the response time assessment between participants using the four tested
Figure 6. Differences in the response time assessment between participants using the four tested
heat maps.
heat maps.
Thestatistics
Table 5. Inferential differences in the
between assessment
participants ofthe
using time between
four themaps.
tested heat maps and post hoc (Bonferroni)
tests were statistically significant for four of the six tasks: T1 compare, T2 retrieve value
Task Kruskal–Wallis H p Post Hoc Groups p
HM10-HM20 ns
HM10-HM30 ns
HM10-HM40 ns
T1 compare X2 (3, N = 402) = 12.871 p < 0.010
HM20-HM30 ns
HM20-HM40 p < 0.050
HM30-HM40 p < 0.010ISPRS Int. J. Geo-Inf. 2021, 10, 562 16 of 24
Table 5. Cont.
Task Kruskal–Wallis H p Post Hoc Groups p
HM10-HM20 ns
HM10-HM30 p < 0.001
HM10-HM40 ns
T2 retrieve value and cluster X2 (3, N = 403) = 14.858 p < 0.010
HM20-HM30 ns
HM20-HM40 ns
HM30-HM40 ns
HM10-HM20 p < 0.050
HM10-HM30 ns
HM10-HM40 ns
T3 sort X2 (3, N = 422) = 13.273 p < 0.010
HM20-HM30 p < 0.010
HM20-HM40 ns
HM30-HM40 ns
HM10-HM20 ns
HM10-HM30 ns
HM10-HM40 ns
T4 cluster X2 (3, N = 411) = 8.442 p < 0.050
HM20-HM30 ns
HM20-HM40 ns
HM30-HM40 ns
HM10-HM20 p < 0.050
HM10-HM30 ns
HM10-HM40 ns
T5 distribution X2 (3, N = 421) = 13.660 p < 0.010
HM20-HM30 ns
HM20-HM40 p < 0.010
HM30-HM40 ns
T6 retrieve value and cluster X2 (3, N = 400) = 5.853, ns ns -
4.4. Difficulty of the Task
Most of the tasks were assessed positively (“easy” 37%, “very easy” 27%). The answer
“hard to say” was indicated in as many as 33% of all tasks. Negative assessments of
difficulties appeared less frequently (“difficult” 10%, “very difficult” 3%).
For each of the analyzed maps, the median was 2 (“easy”). However, while using
more generalized maps (HM30, HM40), respondents assessed the tasks as slightly easier
(around 55% of responses were from categories “very easy” or “easy”), whereas, when us-
ing less generalized maps (HM10, HM20), these assessments accounted for 50% of the
responses. The differences in difficulty assessment between heat maps with different levels
of generalization were significant: H (3) = 28.242, p < 0.001. Post hoc comparisons indicated
that the maps which differed significantly from one another were HM10-HM40 (p < 0.001)
and HM20-HM40 (p < 0.001) (Figure 7).
The differences in task difficulty between the groups were statistically significant for
three of the six tasks: T1 compare, T2 retrieve value and cluster, T3 sort, and T5 distribution
(Table 6). Post hoc (Bonferroni) tests showed that in each of the three cases, the more
generalized maps were rated as easier, and in the case of T3 sort, no differences at the
intergroup level were found.
The highest number of intergroup differences was found for T1 compare. Statistically
significant differences in the assessment of the difficulty of tasks occurred between HM40ISPRS Int. J. Geo-Inf. 2021, 10, x FOR PEER REVIEW 18 of 25
ISPRS Int. J. Geo-Inf. 2021, 10, 562 17 of 24
For each of the analyzed maps, the median was 2 (“easy”). However, while using
more generalized maps (HM30, HM40), respondents assessed the tasks as slightly easier
(around 55% of responses were from categories “very easy” or “easy”), whereas, when
and the other
using maps (HM10-HM40
less generalized p < 0.001,
maps (HM10, HM20-HM40
HM20), p < 0.001, HM30-HM40
these assessments accountedpfor
< 0.001).
50% of the
Inresponses.
the remaining two tasks, there was only one significant difference between the maps. lev-
The differences in difficulty assessment between heat maps with different
For T2 retrieve value and cluster, it concerned HM30-HM20 (p < 0.010); in T5 distribution,
els of generalization were significant: H (3) = 28.242, p < 0.001. Post hoc comparisons indi-
it concerned HM40-HM20 (p < 0.050). In each case, the difference was in favor of the most
cated that the maps which differed significantly from one another were HM10-HM40 (p
generalized map.
< 0.001) and HM20-HM40 (p < 0.001) (Figure 7).
Figure7.7.Differences
Figure Differencesininthe
therating
ratingofoftask
taskdifficulty
difficultybetween
betweenparticipants
participantsusing
usingthe
thefour
fourtested
tested heat
maps.
heat maps.
The differences in task difficulty between the groups were statistically significant for
three of the six tasks: T1 compare, T2 retrieve value and cluster, T3 sort, and T5 distribu-
tion (Table 6). Post hoc (Bonferroni) tests showed that in each of the three cases, the more
generalized maps were rated as easier, and in the case of T3 sort, no differences at the
intergroup level were found.ISPRS Int. J. Geo-Inf. 2021, 10, 562 18 of 24
Table 6. Inferential statistics between participants using the four tested heat maps.
Task Kruskal–Wallis H P Post Hoc Groups p
HM10-HM20 ns
HM10-HM30 ns
HM10-HM40 p < 0.001
T1 compare X2 (3, N = 402) = 46.843 p < 0.001
HM20-HM30 ns
HM20-HM40 p < 0.001
HM30-HM40 p < 0.001
HM10-HM20 ns
HM10-HM30 ns
HM10-HM40 ns
T2 retrieve value and cluster X2 (3, N = 403) = 9.953 p < 0.050
HM20-HM30 p < 0.010
HM20-HM40 ns
HM30-HM40 ns
HM10-HM20 ns
HM10-HM30 ns
HM10-HM40 ns
T3 sort X2 (3, N = 422) = 7.836 p < 0.050
HM20-HM30 ns
HM20-HM40 ns
HM30-HM40 ns
T4 cluster X2 (3, N = 411) = 6.695, ns ns -
HM10-HM20 ns
HM10-HM30 ns
HM10-HM40 ns
T5 distribution X2 (3, N = 421) = 10.614 p < 0.050
HM20-HM30 ns
HM20-HM40 p < 0.050
HM30-HM40 ns
T6 retrieve value and cluster X2 (3, N = 400) = 5.210 ns -
4.5. Preferences
The participants were asked to rank maps according to those that best represented
the spatial diversity of the phenomenon. The responses of 22 participants were considered
invalid (e.g., they repeatedly indicated the same map) and were not taken into account
during the analysis. In over half of the answers (57%), HM10 was chosen as the most
suitable. HM30 was indicated more than two times less frequently (26%). The lowest
percentage concerning the most adequate solution was recorded for HM40 (11%) and
HM20 (5%).
The sequence analyses took responses that occurred ten times or more into account.
The most frequently indicated sequence was HM10, HM40, HM20, HM30 (48%) (Figure 8).
Interestingly, as many as 22% selected the reverse order. However, in the next most
frequently repeated sequences, HM30 was indicated as the map that least favorably repre-
sented the spatial diversity of the phenomenon (Figure 8).ISPRS Int. J. Geo-Inf. 2021, 10, 562 19 of 24
ISPRS Int. J. Geo-Inf. 2021, 10, x FOR PEER REVIEW 20 of 25
Figure8.8.Most
Figure Mostfrequently
frequentlyindicated
indicatedsequences.
sequences.
5.5.Discussion
Discussion
The
Theaim
aimofofthe
thestudy
studywas wastoto
compare
compare heat maps
heat mapsin terms
in termsof four levels
of four of generalization
levels of generaliza-
(radius of 10 px,
tion (radius of 10 20 px, 30 px, and 40 px) with respect to objective and subjective
20 px, 30 px, and 40 px) with respect to objective and subjective usability
metrics.
usabilityInmetrics.
terms ofInobjective metrics, we
terms of objective took we
metrics, intotook
account the timethe
into account and accuracy
time of the
and accuracy
response; in relation
of the response; to subjective
in relation metrics, we
to subjective took into
metrics, account
we took intothe assessment
account of response
the assessment of
time, assessment
response of difficulty,
time, assessment ofand users’ preferences.
difficulty, On this basis,
and users’ preferences. Onwe wanted
this basis,towecompare
wanted
the effectiveness
to compare and difficulty
the effectiveness of difficulty
and using heatofmaps
usingwith
heat different
maps with levels of generalization,
different levels of gen-
as well as confront their efficiency with their perceived efficiency.
eralization, as well as confront their efficiency with their perceived efficiency.
•• RQ1.RQ1. How does the heat map’s
the heat map’sgeneralization,
generalization,defined
definedbybythe thesize
size
of of
thethe kernel
kernel ra-
radius, influenceits
dius, influence itseffectiveness?
effectiveness?
•• H1. H1. Lower
Lower levels
levels of of generalization
generalization result
result in
inhigher
highercorrectness
correctnessof ofanswers
answersby byheat
heat
map
mapusers.
users.
The
Theaverage
averagecorrectness
correctness score
scorewaswaslow. Tasks
low. usedused
Tasks in the
inreported
the reportedstudystudy
included data
included
retrieval or number estimation. Thus, the very low overall correctness
data retrieval or number estimation. Thus, the very low overall correctness rate obtained rate obtained in the
study
in the(20%)
study confirmed the observations
(20%) confirmed of Netek et al.of[4]Netek
the observations and Nelson
et al. and
[4] MacEachren
and Nelson [38] and
about heat maps
MacEachren [38]not being
about suitable
heat maps for notreading accuratefor
being suitable values fromaccurate
reading maps. Yet, while
values lo-
from
cating
maps.theYet,“hot
whilespots” in T1the
locating compare, or T3in
“hot spots” sort,
T1 participants
compare, or did not obtain
T3 sort, better results,
participants did not
although heat results,
obtain better maps are recommended
although heat maps for are
such visual analyses
recommended for[4].
such visual analyses [4].
When
When it comes to the general results, the best metrics on the correctness
it comes to the general results, the best metrics on the correctness of of the
the an-
an-
swers were obtained by the participants working with more
swers were obtained by the participants working with more detailed heat maps (HM10 detailed heat maps (HM10
and
andHM20)
HM20)than thanthose
thosewith
withmoremoregeneralized
generalizedones ones(HM30
(HM30and andHM40).
HM40). Pairwise
Pairwise compar-
compar-
isons
isons determined that the relation between variables occurred when comparingtwo
determined that the relation between variables occurred when comparing twomoremore
detailed
detailedmaps
mapswith withtwotwomore
moregeneralized
generalizedones. ones.
While
Whileanalyzing
analyzingthe theresults
resultsof ofeach
eachtask
taskcarefully,
carefully,statistically
statisticallysignificant
significantresults
resultswere
were
obtained
obtained for four out of the six tasks. In two cases (T1 compare, T3 sort), thebest
for four out of the six tasks. In two cases (T1 compare, T3 sort), the bestandand
simultaneously
simultaneouslysimilar similarresults
resultswerewere obtained
obtained bybyparticipants using
participants HM10
using HM10andandHM20.
HM20. In T5
In
distribution,
T5 distribution, participants
participants using HM20
using HM20had had
the best
the results, whilewhile
best results, thosethose
usingusing
HM10HM10 and
HM30
and HM30werewereslightly worse;
slightly worse;however,
however, in each case
in each of of
case pairwise
pairwisecomparison
comparisonwith withHM40,
HM40,
they were statistically significant. The dependence of variables was
they were statistically significant. The dependence of variables was especially evident especially evident in T1
in
compare,
T1 compare,andand slightly less less
slightly visible for T3
visible forsort andand
T3 sort T5 distribution,
T5 distribution,which involved
which analysis
involved anal-
of spatial distribution. Interestingly, in the case of T2 retrieve value and cluster, the best
ysis of spatial distribution. Interestingly, in the case of T2 retrieve value and cluster, the
results were obtained by people using heat maps with extreme radius values (HM40 or
best results were obtained by people using heat maps with extreme radius values (HM40
HM10) for this task. Thus, the maps which presented already grouped or most detailed
or HM10) for this task. Thus, the maps which presented already grouped or most detailed
data were more effective than those with a mean radius (HM20, HM30).
data were more effective than those with a mean radius (HM20, HM30).
To sum up, the obtained results confirm the observations made by Netek et al. [4] that
To sum up, the obtained results confirm the observations made by Netek et al. [4]
lower radii present data more clearly. This indicates better readability of heat maps with a
that lower radii present data more clearly. This indicates better readability of heat maps
low level of generalization. We thus accept Hypothesis 1, which states that lower levels of
with a low level of generalization. We thus accept Hypothesis 1, which states that lower
generalization result in higher correctness of answers by heat map users. However, unlike
levels of generalization result in higher correctness of answers by heat map users. How-
the research by Roth et al. [41,42], we noted a much lower accuracy of response while
ever, unlike the research by Roth et al. [41,42], we noted a much lower accuracy of re-
participants were using heat maps. The preliminary results of Roth et al. [41,42] reported
sponse while participants were using heat maps. The preliminary results of Roth et al.
the percentage of correct answers at around 90%, which probably results from the use of
[41,42] reported
interactivity thestudy.
in their percentage
To sum of up,
correct answers atofaround
a comparison 90%,obtained
the results which probably results
in both studies
from the use of interactivity in their study. To sum up, a comparison
suggests that heat maps should be used in interactive environments and not as static maps. of the results ob-
tained in both studies suggests that heat maps should be used in interactive
The availability of interactive tools that have zoom or data retrieval functions could result environments
and not as static maps. The availability of interactive tools that have zoom or data retrievalYou can also read