Can a Support Vector Machine identify poor performance of dyslectic children playing a serious game? - Diva-Portal.org
←
→
Page content transcription
If your browser does not render page correctly, please read the page content below

EXAMENSARBETE INOM TEKNIKOMRÅDET
MEDIETEKNIK
OCH HUVUDOMRÅDET
DATALOGI OCH DATATEKNIK,
AVANCERAD NIVÅ, 30 HP
STOCKHOLM, SVERIGE 2021

Can a Support Vector Machine
identify poor performance of
dyslectic children playing a
serious game?

VIKTOR LEMON

KTH
SKOLAN FÖR ELEKTROTEKNIK OCH DATAVETENSKAP
SAMMANFATTNING
Den här uppsatsen har varit en del i utvecklingen av det seriösa spelet Kunna, ett webbaserat spel för barn
diagnostiserade med dyslexi. Spelet består av fem olika övningar som syftar till att öva och utveckla barnens läs- och
skrivförmåga. Då Kunna kan användas var som helst behövs verktyg för att förstå varje individs kapaciteter och
svårigheter. Därför syftar den här uppsatsen till att presentera hur ett seriöst spel och stödvektormaskiner (eng.
support vector machine) kan användas för att identifiera de användare som inte uppnådde prestationskraven. På grund
av den uppblossande coronapandemin kunde dock Kunna enbart testas på barn som inte var diagnostiserade med
dyslexi och därför bör den här uppsatsen ses som en pilotstudie. Inledningsvis identifierades flera variabler för att mäta
prestandan hos barn med dyslexi. Därefter implementerades variablerna i Kunna och testades på 16 spansktalande
barn där resultaten analyserades i syfte att identifiera samband kopplade till svaga prestationer. Slutligen delades
deltagarnas data upp i två grupper, varav en grupp innehöll deltagare med klart högre värden i tid och antal fel.
Uppdelningen gjordes för att träna och utvärdera om en stödvektormaskin kan separera de två grupperna och därav
identifiera de deltagare som inte uppnådde prestationskraven. De slutliga resultaten indikerar dock att en
stödvektormaskin inte är det effektivaste valet för detta ändamål. Istället föreslås att framtida arbeten bör överväga
multiklassificeringsalgoritmer.
Can a Support Vector Machine identify poor performance of
              dyslectic children playing a serious game?
                                                           Viktor Lemón
                                                  KTH Royal Institute of Technology
                                                       Stockholm, Sweden
                                                         vlemon@kth.se

ABSTRACT                                                              word recognition problems, word pronouncing, and reading
                                                                      fluently [2]. Early detection combined with effective preven-
This paper has been a part of developing the serious game             tive practices can minimize the difficulties associated with
Kunna, a web-based game with exercises targeting children             dyslexia [3,10,22]. Beyond traditional treatment-tools, seri-
diagnosed with dyslexia. This game currently consists of five         ous games are commonly recognized as games used for pur-
different exercises aiming to practice reading and writing            poses other than pure entertainment and have the potential
without a therapist or neuropsychologist present. As Kunna            to reach anyone in need. These games exist in several fields
can be used anywhere, tools are needed to understand each             such as education, health, manufacturing, military, and medi-
individual's capacities and difficulties. Hence, this paper aims      cine [6]. Furthermore, serious games have been used to esti-
to present how a serious game and a support vector machine            mate the risk of dyslexia, and several studies [4,5,7,10,12,14]
were used to identify children that performed poorly in               have combined web-based games and machine learning to of-
Kunna’s exercises. Though, due to the current corona pan-             fer screening tests online.
demic, Kunna could only be tested on children not diagnosed
with dyslexia. Therefore, this paper should be seen as a proof        The challenges of dyslexia are highly individual [26], and dig-
of concept. As an initial step, several variables were identified     ital interventions should therefore be personally adapted.
to measure the performance of dyslectic children. Secondly,           Software has the potential to support neuropsychologists and
the variables were implemented into Kunna and tested on 16            therapist’s overall comprehension of a patient, as serious
Spanish-speaking children. The results were analyzed to               games can be used without their presence. As a first step to-
identify how poor performance could be recognized using the           wards this ambition, this study presents how a web-tool was
identified variables. As a final step, the data was divided into      constructed and evaluated in order to identify children strug-
two groups for each exercise, of which one group contained            gling with exercises in a serious game. This by training a sup-
participants who appear to perform poorly. These were par-            port vector machine (SVM), a classifying algorithm that has
ticipants with clearly outlying values in the number of errors        shown promising results in categorizing and differentiating
and duration. Thus, to train and evaluate if a Support Vector         dyslexic from non-dyslexic populations [4,7,10,12,20]. Hence,
Machine (SVM) can separate the two groups and thereby iden-           the hypothesizes is that SVM can identify poor performance
tify the participants who performed poorly. From the discus-          by being trained with two groups of participants. One group
sion followed that the SVM is not the most efficient choice for       who exposes difficulties and one group that performs well
this aim. Instead, it is suggested that future work should con-       within an exercise.
sider multiclassification algorithms.
                                                                      The study was done in collaboration with the Swedish web
CCS CONCEPTS                                                          agency Prototyp and the Spanish mental health clinic Neu-
• Human-centered computing → Field studies; User studies;             rotalentum. These companies have developed the applica-
Empirical studies in accessibility.
                                                                      tion Kunna which exercises aim to practice and measure skills
                                                                      needed to handle cognitive challenges of dyslexia. However,
KEYWORDS                                                              the current circumstances of covid-19 made it only possible
Serious games, Dyslexia, Identifying, Performance, Support            to test the game Kunna on 16 participants without dyslexia.
Vector Machines
                                                                      Reading guide
INTRODUCTION                                                          This paper consists of three steps: 1. Find relevant variables
Dyslexia is a reading disability disorder diagnosed in child-         to measure the performance of children diagnosed with dys-
hood, with a prevalence of 5 to 10 percent globally                   lexia. 2. Evaluate how these variables can indicate poor per-
[1,4,7,10,12]. It is characterized by poor spelling abilities,        formance in the context of Kunna’s exercises. 3. Evaluate if the
SVM can identify participants that appear to be struggling Find the syllable
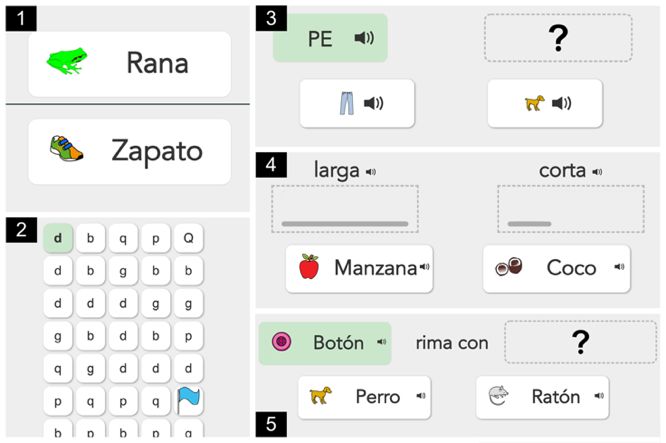
with an exercise. Thus, three methods (Finding variables, Like the rhyming exercise, the user is instructed to drag a
Characteristics of poor performance and Testing the support word containing the target syllable. However, each card only
vector machine) are presented with corresponding results. showed an image, and the user must listen to each card to
identify the syllable. The user could here listen to the sentence
Research Question “Which word contains the syllable …?”. The target syllable is
How can a Support Vector Machine identify poor performance presented in the green box in the upper right corner. See im-
of dyslectic children playing a serious game? age 3 in figure 1.
PRESENTATION OF THE EXERCISES Game Design
Each exercise began with a tutorial and instructions were
given in text read by an auto-played voice. The participants
had to complete a simplified version of the game to enter the
exercise to ensure they understood the instructions. Each ex-
ercise has several levels, and the content was varying depend-
ing on the exercise and the difficulty level. A level was com-
pleted when the participant provided a correct answer, indi-
cated by a cheerful message.
Exercise Capacities Interaction Audio Levels
Name tested type
Syllable Syllabic and pho- Drag-and- Yes 6
nological aware- drop
ness
Figure 1. Showing the five different exercises in the web-
Sort Visual discrimi- Drag-and- Yes 6
application Kunna. The CPT exercise (1) is not covered in
nation and cate- drop
this paper. gorization
Exercises Rhyme Phonological Drag-and- Yes 8
awareness drop
Kunna currently has five exercises: one Continuous perfor-
mance test (CPT) targeting ADHD (not covered in this paper) Labyrinth Visual search Click No 4
and four exercises targeting dyslexia. The four dyslexia tar- Table 1. The exercises studied in Kunna
geting exercises were invented and designed by Neurotal-
entum and are presented below and summarized in table 1. THEORY
Dyslexia
Labyrinth
In the Diagnostic and statistical manual of mental disorders
In this task, the user must find a path from the starting letter
(DSM -5), dyslexia is defined as “an alternative term used to
or word to reach the flag, by clicking on cells. These cells ei-
refer to a pattern of learning difficulties characterized by prob-
ther contained the target word/letter or a non-target. See im-
lems with accurate or fluent word recognition, poor decoding
age 2 in figure 1.
and poor spelling abilities.” [2]. Several studies agree that dys-
lexia results in an impaired phonological processing capabil-
Sort long words from short words
ity [1, 3, 16, 22, 23], which causes difficulties in processing
The user is given two or three words and instructed to “drag”
sounds in a language. For example, distinguish phonemes of a
short and long words to two different fields. Additionally, the
word and judge whether two sounds rhyme [16]. Further-
user was able to listen to the words by clicking on the card. A
more, Dyslectic children have shown to perform slower dur-
level was completed when both targets were correctly sorted.
ing visual search tasks [11, 18] and maintain attention for a
See image 4 in figure 1.
shorter period [18, 19]. Children training their phonological
awareness are more likely to improve their reading and
Find the rhyme
spelling [9,19].
This exercise is about dragging a card containing a word that
rhymes with a target word presented in a green box in the left
Support Vector Machines
corner. The user could either read or listen to the sentence
Support Vector Machine is a machine learning classifying al-
“Which word rhymes with …?” See image 5 in figure 1.
gorithm used by several screening studies [4,7,10,12]. The bi-
nary version aims to select a hyperplane that maximizes the
distance between the classes. A test sample is then classifieddepending on which side of the hyperplane the sample is. SVM game aimed to differentiate children with and without dys-
supports high dimensional spaces and thus several features. lexia and found five significant indicators. These were: total
According to Mark Hall [14], features should not be depend- clicks, time to the first click, hits (number of correct answers),
ent on other features. They should further be correlated with accuracy, efficiency (time of the last click/ hits). This study
the class yet uncorrelated with each other. Cross-validation is was later followed up by implementing machine learning (us-
a common technique that splits the data into several sets. One ing SVM) to detect dyslexic children [10]. The SVM was
set is used for testing and the rest for training. This is used to trained using the number of clicks per item, number of correct
avoid overfitting – a situation occurring when the boundaries answers, number of incorrect answers, scores (the sum of
between the classes are closely fitted to the training set, which correct answers for each stage's problem type), accuracy (the
will not perform well when classifying new samples [13]. number of hits divided by the number of clicks) and miss rate.
267 children and adults participated, and the results showed
an accuracy of 84.62 percent [10]. Recently, Luz Rello et al. [5]
conducted a more extensive study of the independent game
where 313 children participated. The features: total clicks,
first click, hits, efficiency, duration, fourth click, and average
click time was significantly different for Spanish speaking
children. This time was Random Forest used which resulted
in an accuracy of 69 percent for Spanish speaking children
and 75 percent for German.
Figure 2. Showing a plane differentiating the white and
black samples with maximized margin. Variable Definition Study
Number of clicks 4, 5*, 6, 7
Several kernels can create a hyperplane that differentiates the Correct answers 4, 5*, 6, 7*, 10
samples. Depending on the dataset, the efficiency of achieving Incorrect answers 4, 6, 8*, 10, 11
a high classification accuracy varies among the kernels. The Accuracy Correct answers/ 3, 4, 7, 10
kernels used within this study are some of the kernels pro- number of clicks
Miss rate The number of 4, 8*
vided by the Python package Scipy [28].
misses divided by
the number of clicks
RELATED WORK Time to the first 5*, 7*
A few studies [3, 4, 5, 7, 10, 12] have measured the perfor- click
mance in serious games using machine-data interaction Efficiency Time of the last 5*, 7*
methods. In this paper, these are defined as tools available by click/ correct an-
swers
software technologies to measure interactions. A study in It-
Number of clicks 7*, 10
aly [3] developed six games to predict the risk of dyslexia in per item
preschoolers. The dependent variables were response times, Score The sum of correct 10
scores, and accuracy. However, due to a small population and answers all levels
minor application errors, no significant difference between Duration The time to complete 5*, 7*, 8*, 11, 18
the variables could be reported. Furthermore, data from an an exercise
earlier phonological testing study was used to detect dyslexia N:th click The time to a specific 5*, 7*
using machine learning [20]. The test had four tasks with 56 click
Average click time 5*
children participating and reached an accuracy of 89 percent
using decision trees. However, the study does not mention Table 2. All identified features measured in similar
any of the used features. Rello Luz et al. [4,5,7,10] conducted studies. Variables reported with a significant difference
several experiments intending to predict the risk of dyslexia are noted with a star*.
using machine learning. They first developed a linguistic web-
game to detect dyslexia using SVM. The game consisted of 17 OVERALL METHOD
exercises and 32 levels and was tested on 243 children and Since there are no standards for measuring performance
adults (95 diagnosed with dyslexia). Performance was meas- within these exercises, a combination of research, interviews,
ured by counting the number of clicks, correct answers, incor- testing, and statistical analysis were used to address the re-
rect answers, accuracy (hits/ number of clicks), and miss rate search question. As no similar studies were found using these
(the number of misses divided by the number of clicks). How- exercises, these following questions should first be answered:
ever, no statistical analysis of the variables was presented.
Later on, a language-independent web game (no reading was - How can performance be measured in Kunna?
required) was built with visual and audial-based tasks [7]. To- - How are these variables related to poor performance?
tally 178 children with and without dyslexia participated. TheQuestion one was answered by studying related work to iden- INTERVIEW RESULTS
tify the state of art of web-based measurements for dyslexia. Looking at the variables in table 2, are these relevant to esti-
Furthermore, one interview was held to include a neuropsy- mate cognitive capacities of children with dyslexia?
chologist’s perspectives and validate the relevance of the var-
iables in the context of these exercises. To answer the second - “During this concept testing phase are all these vari-
question, the identified variables were first implemented and ables relevant. Especially the number of mistakes. But
tested on a few participants. The results were analyzed to the completion time and “Time to the first response”
evaluate the variables' applicability and effectivity as a foun- are interesting since it tells the time it took for them
dation for identifying participants with difficulties. Since to finish and understand a task. The number of audio
these exercises are designed to be challenging for children plays may not tell you anything about dyslexia, but it
with dyslexia, poor performance is defined as a high number may tell you something about the comprehension ca-
of mistakes in relation to a protruding time duration. This pacity which is a variable not too far away from dys-
since slow time response and errors are related to difficulties lexia. […]. The benefit of having computers is that they
in search tasks, reading, and writing [11,16,18,21]. However, can measure variables that are hard for a human to
this doesn’t exclude that poor performance can be explained keep track of. But they must be compared with the test
by other variables. Therefore, correlation to time and errors group and the control group and compared within
were calculated. To finally answer the research question, the age groups”.
participants were divided into two group based on the test re-
sults. This to train and evaluate the SVM. Are there any variables missing?
- “It would be interesting to see if a child is guessing
To summarize the overall method, the following steps were while doing these exercises. Some participants could
applied: e.g., be slow in completing the exercise but have a
- Find dependent variables within similar exercises higher number of mistakes. But can guesses be seen in
that are feasible to implement. any other way?”
- Interview with a therapist of Neurotalentum.
- Develop and implement the variables. This question generated the variables Response Frequency
- Evaluate the results of each variable to find charac- and Fast Responses. Response Frequency measure the time be-
teristics of poor performance. tween each response and Fast Responses counts the number
- Train and evaluate the SVM. of times a response was given in less than one second.
With respect to these variables. How do you expect a child with
As this overall approach contains several steps, these are di- or without dyslexia to perform during these exercises?
vided into three methods with a corresponding result sec- - “Theoretically, these tools should put the children into
tion. test, and we believe that these exercises should be able
to differentiate these two groups. But the outcome
FINDING VARIABLES can be spread. Some children with a diagnose might
The first question was addressed by researching related stud- perform similar to the control group. This can and
ies that has used machine learning and serious games to will probably happen. To interpret the performance,
measure the performance of dyslexia. Furthermore, a semi- we need to look at all the variables being measured to
structured interview was held with one of the neurophysiol- estimate the capacities of the child. “
ogists at Neurotalentum. Thus, to validate and identify
measures that they were interested in and further understand How can these variables help to identify individuals having dif-
how these variables can identify children with difficulties. The ficulties with an exercise?
interviews were audio-recorded in Google Meet and the fol-
lowing questions were asked: - First off, every kid is different. Because dyslexia is a
word for making a summary of all the problems a kid
- Looking at the variables in table 2, are these relevant has with reading and writing comprehension. Inside
to estimate cognitive capacities of children with dys- reading and writing comprehension, there are several
lexia? parameters we need to measure, and we need to focus
- Are there any variables missing? on the parameters that a kid has a problem with. […]
- With respect to these variables. How do you expect a The challenge is to tell this program if a value is okey.
child with or without dyslexia to perform during these One way is to measure the number of mistakes and
exercises? then see if they are above or below average compared
- How can these variables help to identify individuals to their age group.
having difficulties with an exercise?Type Dependent measures Description Syllable Sort Rhyme Labyrinth
Time Duration [seconds] The total time to complete a level X X X X
Time to first response [sec- X X X X
onds]
Response frequency [seconds] The time between responses X X X X
Longest pause The maximum value of the response X X X X
frequency
Scores Number of incorrect answers X X X X
Events Number of responses The number of clicks or drag and X X X X
drops
Number of regrets The user has regretted a response X X
Number of audio plays The user clicked to hear an audio file. X X X
Number of fast responses A response given in 1 second or less X X X X
Quotients Response speed [re- Number of responses divided by the X X X X
sponses/second] duration
Error rate Number of wrong answers divided by X X X X
the minimum number of required re-
sponses
Table 3. All the measurements implemented
Incorrect answers
- Secondly, we can look at the time and the other mea-
Within the labyrinth, the user can only select a neighbor to the
surements. The next step is to combine the result of all last selected cell. E.g., a user cannot click on the final cell di-
exercises in order to estimate the capacities of the kid. rectly. Therefore, the coordinates of a clicked cell were con-
Such as reading comprehension and attention capac-
trolled in X and Y -direction. This was accomplished by stor-
ity.
ing the previously selected cells' x and y coordinates. Since a
The interview indicates the importance of comparing the val- user can either move in a horizontal or vertical direction, the
ues between the two groups with the corresponding age
direction must be validated. For a click to be valid in the ver-
group. It also highlights that outcomes of dyslexia are unique,
tical or horizontal direction, the absolute difference between
which underlines the importance of forming a system that can the previous and current coordinates must be equal to one. A
interpret individual differences. wrong answer was returned if these conditions were false,
and the cell showed a red flashing animation. The cell changed
How can performance be measured in Kunna?
to a green background if the answer was correct. To validate
Together with the two requested variables from the interview a response, every cell was configured with the JavaScript at-
and the research results, the variables presented in Table 3 tribute onclick. Similarly, the JavaScript attribute on-
were implemented into the exercises. These variables were
change was used within the "drag and drop" exercises to com-
selected to fit the given design. The number of correct answers pare the value-attribute of a given card with the correct an-
was not included since all exercises require a correct answer swer. Within the syllable and rhyming exercise, an incorrect
to pass. Similarly, accuracy and efficiency were not qualified
card was automatically removed to the initial area.
using the definition in Table 2. Furthermore, the variables
were adapted to fit the exercises. E.g., did several of the re- Time
lated studies use clicks as a primary interaction type [4, 5, 7, Currently, JavaScript provides the two inbuilt methods per-
10]. As noted in Table 1, either clicks or drag-and-drops are formance.now and Date.now to measure a time interval. Per-
used in Kunna. A more detailed explanation of each variable formance.now was selected since it runs independent of the
is described in the implementation section. code and is not dependent on JavaScript event loops [15]. The
method's accuracy is estimated to five microseconds [15].
IMPLEMENTATION Therefore, performance.now appears to be accurate enough.
This section will cover how the exercises were built and how A time interval is measured by calling the method twice. A
the variables were implemented and measured. variable t0 stores the time when an event is initialized, and a
variable t1 stores the current time when the event is finished.
Application Setup The time interval is the difference between t1 and t0 but when
The application was built using the Model View Controller should these two variables be initialized? Vue.js includes the
(MVC) framework Sails.js [29] and was connected to a Post- function this.$nextTick, which is called when the entire view
gres database. The front-end was built using the JavaScript is rendered. Hence, the time variable t0 is initialized to ensure
framework Vue.js [30]. The website's images, sounds and the time clock starts when the content is fully displayed. The
texts were stored using the Content Service Manager (CSM) duration was calculated immediately after the last cell was
Contentful.clicked or when a card was dropped by calculating the differ- strength of the relationship between two variables by return-
ence between t0 and t1. ing one value within the range of -1 to 1. To interpret the co-
efficient is r = 0.1 told to indicate a small correlation, 0.30 me-
Response frequency dium and 0.5 a strong correlation [25]. As duration and errors
Response frequency is defined as the time between each re- are considered as the most vital variable, these two variables
sponse. This was calculated by taking the time difference be- are compared to the others in table 3. To support the correla-
tween the previous and the current response. The value was tions and interpret the spread of the data, box plots are pre-
stored in a list. The purpose of this variable is to see whether
sented - A recommended approach to visualize non-paramet-
the user generally responded slowly or fast during a level. The
final value is the mean of the stored values. ric data [25]. The box of a boxplot shows 50 percent of the
data fall; the horizontal line indicates the median and the X
Time to the first response the mean value. The whisker marks the maximum and mini-
The time to each response from the initial time was calculated mum value and outliers (values greater than three standard
and stored in a list. Time to first response is the first value in deviations of the mean) are marked with a ring [25]. The box-
this list. plots were created in Excel.
Longest pause Ethics and Recruitment
The longest pause is the maximum value in response fre- The participants were recruited by Prototyp. The parents re-
quency list. If this value is very high, e.g., a minute or more, it ceived a consent form to confirm their permission. The con-
may indicate that the user is not paying attention to the exer- sent form specified the scientific use of the data collection and
cise. It could also indicate that the user is struggling or being made clear that the children were allowed to quit at any time.
more thoughtful about the next move. The parents received an email with instructions specifically
telling the parents not to help solve the exercises. The partic-
Fast responses ipants were anonymized by a randomized email address and
A fast response is defined as a value in the response frequency a password to access the website. 16 Spanish-speaking chil-
list that is equal to or less than one second. The purpose of dren (8 boys and 8 girls) without a diagnose participated in
this variable is to estimate the sureness of the user. Compared testing Kunna’s exercises. The participants were between 7-8
with the other variables could, e.g., a high number of re- years old and recruited by Prototyp. They were further re-
sponses and a high number of errors, indicate a guessing ap- quested to use the web browser Chrome (version 80 or later).
proach. Likewise, a combination of a high number of fast re- The estimated time to complete all four exercises (excluding
sponse and a low number of errors could indicate certainty. tutorials) was approximately five minutes.
Quotients
Miss rate [errors/response] is defined as the number of incor-
TEST RESULTS
rect answers divided by the total number of responses. Speed TIME
[responses/second] is calculated as the number of responses 300
divided by the total time.
250 Labyrinth
Database 200
Syllable
seconds
The measures from each exercise are saved in separate Post- 150
gres tables. The results are sent directly after a level is fin- Rhyme
100
ished to make sure every completed level is stored. Besides
the other measurement, all the user’s answers are stored in a 50 Sort
list together with the time until each response. For example, 0
this might tell which target is most often mixed up.
Figure 3. The total time to complete an exercise
Automated Tests The mean total time to complete Labyrinth was 133 seconds
To verify that all the measures were implemented correctly, (sd = 61), the corresponding for Syllable was 69 seconds (sd
automated tests were executed using Mocha.js. The automatic = 32), Rhyming 73 seconds (sd = 49) and Sort 55 seconds (sd
test consisted of two parts: validate the database storage (by = 27). It appears as the labyrinth was more spread and gener-
returning a 200 response) and test if the validation functions ally took the longest time. Compared to the other exercises,
returned the correct values. were no images or sounds implemented. Thus, can the laby-
rinth be assumed to be trickier as these children recently have
CHARACTERISTICS OF POOR PERFORMANCE learned to read. Looking at the correlations in table 4, errors
To find characteristics of poor performance, Pearson's corre- and duration has a medium to strong correlation for all the
lation coefficients were calculated using Excel version 16.45. exercises.
The aim was to find correlations between errors and time in
relation to the other variables. The coefficient measures theExercise Duration TTFR Errors RF FR AP LP
Labyrinth Duration - 0,712 0,693 0,844 -0,659 - 0,808
Errors 0,693 0,504 - 0,288 -0,173 - 0,359
Syllable Duration - 0,981 0,411 0,377 - 0,764 0,351
Errors 0,411 0,252 - 0,851 - 0,275 0,902
Rhyme Duration - 0,990 0,623 0,699 - 0,763 0,428
Errors 0,623 0,550 - 0,774 - 0,457 0,725
Sort Duration - 0,947 0,381 0,661 0,319 0,759 0,034
Errors 0,381 0,252 - 0,042 0,942 -0,054 0,005
Table 4. Pearson correlation coefficient for duration, errors and the other variables.
MEAN TIME TO FIRST RESPONSE (TTFR) LONGEST PAUSE (LP)
30 18
25 Labyrinth 16
14 Labyrinth
20 12
seconds
Syllable
Syllable
seconds
15 10
Rhyme 8
10 Rhyme
6
5 Sort 4 Sort
0 2
0
Figure 4. The mean time to the first response for all levels
Syllable resulted in the slowest Time to first response with a Figure 6. The mean longest pause
mean time of 10.92 seconds (sd = 4.98). The time for the lab- The mean longest pause within the labyrinth was 5.9 seconds
yrinth was 9.16 (sd = 4.74) and 8.37 seconds for Rhyme (sd = (sd = 4.59). The corresponding for Syllable was 0.66 (sd
8.38) and 5.83 for Sort (sd = 3.36). Looking at the correlations =2.15), Rhyme 0.73 (sd = 2.70) and Sort 2.98 seconds (sd =
in table 4, errors and TTFR has a medium to strong correla- 2.31). Similar to the response frequency, the longest pause is
tion for all the exercises. non-zero for the phonological testing exercises if a mistake
was made. This is indicated by the strong correlation between
MEAN RESPONSE FREQUENCY (RF) the longest pause and the number of errors. This variable in-
dicates that no user was absent for a longer time as the high-
6
est value is approximately 25 seconds.
5 Labyrinth
4 Scores
seconds
Syllable
3 TOTAL INCORRECT ANSWERS
Rhyme
2 30
1 Sort 25 Labyrinth
0 20
Syllable
Figure 5 The mean response frequency 15
Rhyme
The labyrinth and Sort resulted in the highest RF with 2.6 sec- 10
onds (sd = 1,2) respectively 2.64 seconds (sd = 1,2). Syllable 5 Sort
resulted in 0.58 (sd = 0.95) and Rhyme 0.75 (sd = 1.08) sec- 0
onds. The RF was generally higher within the labyrinth and
Sort. However, RF is calculated after the first given response. Figure 7. The total number of incorrect answers
Since Syllable and Rhyming require a minimum of one answer The participants made in average 5.6 incorrect answers (sd =
to complete, RF is zero if a correct answer is given. This indi- 6.5) in Labyrinth, Syllable resulted in 0.625 errors (sd = 0.88),
cates why error and RF are highly correlated for these two ex- Rhyme 1.0 (sd = 1.67) and Sort 0.937 (sd = 1.06). The laby-
ercises and the strong correlation between LP and the num- rinth resulted in a higher number of errors, which was ex-
ber of errors in Rhyme and Syllable. Thus, RF is mainly work- pected as the design allows for more mistakes (e.g., by acci-
ing within the Labyrinth. dently pressing a cell). Furthermore, the number of errorswere slightly higher within Sort, which is expected as the par- were not required to listen in Rhyme, audio plays could indi-
ticipants were required to give two answers per level com- cate poor performance.
pared to Rhyme and Syllable. But the correlation between the
errors and duration are less strong in Sort and Syllable com- How are these variables related to poor performance?
pared to the other exercises. First, we can see obvious correlations between duration,
TTFR and longest pause. Regarding the central findings:
FAST RESPONSES (FR)
• In Labyrinth: errors were strongly correlated with du-
25 ration and TTFR. The duration was strongly nega-
20 Labyrinth tively correlated with fast responses and response fre-
quency.
15 Syllable • In Syllable: errors were strongly correlated with re-
10 Rhyme sponse frequency and longest pause. However, these
are invalid due to the dependency with errors. Dura-
5 Sort tion was correlated with response frequency and au-
0 dio plays.
• In Rhyme: errors were strongly correlated with dura-
Figure 8. The total number of fast responses tion, TTFR, response frequency and longest pause.
The labyrinth's mean fast response was 8.06 (sd = 7.1) but Similarly, to Syllable, RF and LP are also dependent on
gave no results for the syllable and the rhyme. Sort resulted the errors. The duration was correlated with audio
in 0.5 (sd = 0.63). The purpose of this variable was to count plays.
spontaneous answers. However, the results indicate that this • In Sort: errors were strongly correlated with fast re-
measure can be interpreted differently for click-based and sponses. The duration was strongly correlated with
drag-based exercises. There is a strong negative correlation audio plays.
with time within the labyrinth but a small correlation be-
tween errors, indicating a rapid but accurate response. This is Duration and Errors were strongly correlated with TTFR in
the opposite of Sort, which shows that a fast response is Labyrinth and Rhyme and with Audio plays in Rhyme. How-
strongly correlated with errors and not with response fre- ever, the audio boxplot shows an outlier which could be ar-
quency. This indicates that the users corrected a wrong an- gued to affect the correlation. Furthermore, TTFR and Dura-
swer quite fast. However, the number of total fast response tion appear to be the same value in the drag-and-drop-based
and errors were quite a few within Sort and thus is such a con- exercise, as the correlation between these two is approxi-
clusion too weak to be seen as a general rule. mately one. Duration and Audio plays were strongly corre-
lated for all of the drag-and-drop-based exercises but were
TOTAL AUDIO PLAYS (AP) medium to non-correlated with Errors. Audio plays could be
30 assumed to indicate poor performance in Syllable and Rhyme.
Though, the correlation with Duration could partly be ex-
25 Labyrinth
plained by the time it takes to listen to the audio file. Further-
20 more, the longest pause has a medium correlation with errors.
Syllable
15 But the boxplots indicate an outlier in incorrect answers. To
Rhyme summarize, these results could be argued as too weak to es-
10
5 Sort tablish a general conclusion. Therefore, the conclusion is that
these results cannot prove strong relationships that indicate
0
poor performance.
Figure 9. The total number of audio plays
The mean number of audio plays was in Syllable totally 6.18
TESTING THE SUPPORT VECTOR MACHINE
(sd = 4.95) plays. Corresponding for Rhyme was 5.06 (sd = Dividing participants into two groups
7.41) Sort and 1.68 (sd = 2.67). (The labyrinth had no audio) As a proof of concept, two groups (G1 and G2) were hand-
Rhyme and Syllable had a higher number of audio plays, picked to see whether the system could identify them. The
which was expected as the design required the users to listen. correlation analysis could not indicate any strong relation-
Time was strongly correlated with the number of audio plays ships for poor performance characteristics. Hence, the selec-
for all three exercises. However, the correlation between au- tion was accomplished by looking at the individual perfor-
dio and errors was stronger within Rhyme but medium cor- mances. Participants with clearly outlying values in duration
related in Syllable and non-correlated in Sort. Since the users and errors were placed in group 2 (G2). As Mark Hall [14] sug-
gests, good features for machine learning should preferably
not be dependent on other features, which is the case forGroup N Duration TTFR Errors RF FR AP Miss rate Speed
110,4 8,1 1,7 9,5 9,1 0,1 1,7
G1 9 -
(58,6) (5,1) (2,5) (5,7) (8.6) (0.2) (0.8)
Labyrinth
162,2 10,5 10,7 11,3 6,7 0,8 1,3
G2 7 -
(56,1) (4,5) (6,7) (3,1) (5,2) (0,4) (0,3)
60,4 9,9 0,1 0,7 0,0 5,1 0,0 0,9
Syllable G1 11
(28,9) (4,9) (0,3) (2,3) (0) (4,7) (0.2) (0.4)
89,6 13,1 1,8 9,7 0,0 8,6 0,8 0,7
G2 5
(32,1) (5,0) (0,4) (6,2) (0) (5,2) (0,2) (0,2)
55,2 6,7 0,3 2,0 0,0 2,5 0,2 1,6
Rhyme G1 12
(25,3) (2,9) (0,5) (4,0) (0) (3,4) (0,2) (0,6)
126,4 13,5 3,0 18,0 0,0 12,8 1,5 0,9
G2 4
(70,6) (8,5) (2,4) (8,6) (0) (10,4) (1,2) (0,4)
48,0 5,0 0,6 15,4 0,3 1,3 0,1 2,0
Sort G1 13
(17,0) (1,7) (0,9) (7,8) (0,5) (1,6) (0,2) (0,7)
85,3 9,4 2,3 18,0 1,3 3,3 0,5 1,5
G2 3
(47,3) (7,8) (0,6) (5,1) (0,6) (5,8) (0,1) (0,5)
Table 5. The table is showing how the SVM categorized the dataset into two groups using the linear kernel. The mean values
and the standard deviations (in parenthesis) are presented.
Linear Rbf Polynomial
response frequency and the longest pause within the drag- Mean accuracy 80% 74% 79%
and-drop-based exercises. Therefore, these features were not N agreements 52 49 45
used. The classification was done using Python and the SciPy N disagreements 12 15 19
p-value 0.629 0.010 0.0524
SVM-package. The linear, polynomial and the Rbf kernel were
Statistic 7.0 5.0 6.0
tested. Leave-one-out cross-validation was used due to the
small data set, meaning that 15 participants were used for Table 7. The mean accuracy, disagreements and p-value
training and one for classification. This was repeated for for all exercises and kernel.
every participant and exercise.
Table 5 shows how the SVM classified the dataset into two
Evaluating the classification performance groups. The mean errors and duration are slightly higher in
A McNemar test was used to test if the system significantly group 2 and more audio plays can be seen in Rhyme and Sort.
disagrees between the predicated and the pre-selected partic- Thus, in this minimized version, the system gives a small indi-
ipants for all exercises. This was accomplished by counting cation to be working as intended. Though, the standard devi-
the number of true positives (TP), false positives (FP), true ation indicates an overlapping spread between several varia-
negatives (TN), and false negatives (FN) in all exercises for bles. According to the classification results in table 6 and 7,
each kernel. Accuracy and F1-scores indicate the efficiency of the linear kernel was most effective in identifying the selected
the SVM. Accuracy is defined as the number of correct classi- participants with a mean accuracy of 80 percent. The F1-
fications divided by the total number of classifications. scores signals that the Rbf and the polynomial kernel under-
(TP+TN/TP+TN+FP+FN) F1 score is a harmonic mean of pre- performed in identifying true positives. i.e., the participants in
cision (TP/TP+TN) and recall (TP/TP+FN) ranging from zero group 2. The mean accuracy for the Rbf was 74 percent, but
to one. A higher value indicates a higher classification perfor- the kernel underperformed in classifying the correct targets
mance [27]. as the F1 score was zero in three of the exercises. The polyno-
mial kernel performed slightly better but also showed prob-
CLASSIFICATION RESULTS lems with classifying the true positives in Syllable. The p-val-
N* Linear Rbf Polynomial ues for the polynomial and the Rbf also indicate a general dis-
Labyrinth 6 81% 69% 69% agreement between the selections and the predictions. I.e.,
(0.77) (0.54) (0.28) the true positives and false negatives were not the same.
Syllable 4 69% 62% 75% However, the linear kernel failed to reject the null hypothesis,
(0.28) (0) (0) I.e., that the disagreements are not significant. Still, 20 percent
Rhyme 4 88% 75% 87%
of the participants were misclassified, which could be argued
(0.66) (0) (0.66)
Sort 3 81% 81% 87% as insufficient.
(0.4) (0) (0.5)
Table 6. Accuracy and F1-score for the exercises and the DISCUSSION
kernels *The number of participants selected in group 2 THE VARIABLES APPLICABILITY TO THE GAME DESIGN
who had a higher number of errors and duration. This study aimed to see if a support vector machine could
identify dyslectic children who performed poorly within a se-
rious game. Several variables were implemented to get acomprehensive picture of how the participants interacted machine learning to define clusters, which could support in
with the game and to find poor performance characteristics. distinguish groups with different behaviors. A second ap-
The variables appeared to be diverse and dependent on the proach to solve the misclassifications (as mentioned in the in-
exercise, making it complicated to define general rules for dif- terview) would be to decide thresholds for the variables. This
ficulty characteristics. E.g., Syllable requires the user to listen would not result in any misclassifications of true positives
to a sentence and thereby TTFR cannot be directly compared and allows neurophysiologists total control of the system.
to the other exercises. Syllable and Rhyme (which required a This approach could also be argued as less time-consuming as
minimum of one answer per level) did not result in longest no selections are required. However, a higher level of com-
pause or response frequency if the user's first answer was cor- plexity will be added if several variables are being used.
rect. The Labyrinth required several solutions, which resulted
in more responses per level which benefit the use of fast re- FUTURE WORK
sponses, response frequency and longest pause. Thus, in terms As this was a simplified case, the game should be tested on
of maximizing these variables' applicability, a game design re- children within the targeting group. Thus, to compare the
quiring more than one answer is recommended. measurements by testing for significant differences and vali-
date that the exercises are challenging. Conducting the tests
METHOD CRITIQUE in a controlled environment would benefit the reliability and
The linear kernel resulted in an accuracy of 80 percent, which the applicability of these variables to estimate poor perfor-
could be argued as insufficient and vague since a considerable mance. Furthermore, the variables that correspond to each
portion is misclassified. The selection was based on the defi- classification group should be statistically compared. As the
nition that outlying values in errors and time mainly charac- parameters can be assumed to be non-parametric, a Mann-
terize poor performance. This assumption was based on stud- Whitney U test would be a reasonable choice [25]. From the
ies reporting that these two variables appear to differentiate discussion followed that this approach of identifying strug-
people with dyslexia from non-dyslectics. Though, the aim gling is not covering the spectra of different kinds of problem-
was to broaden this definition in the context of Kunna's exer- solving approaches. However, this paper only used Support
cises using correlation analysis. Of course, such an approach Vector Machines, and other machine learning techniques like
is limited by not comparing and analyzing the target group. Random Forest, K-neighbors, or Neural Networks could be
However, the correlation analysis may not be sufficient to find tested to receive a greater accuracy. Also, these multiclassifi-
poor performance characteristics as the cause and effect are cation algorithms may also be used to divide the spectra of
not certain. Thus, two variables can be correlated but still be different problem-solving behaviors.
unrelated. A comparison with the target group and a con-
trolled observing test could complement the correlation anal- CONCLUSION
ysis to understand better how the users interact with these This paper aimed to see if a support vector machine could
games. identify dyslectic children who performed poorly within a se-
rious game. Eleven variables were used to measure the per-
INTERPRETING POOR PERFORMANCE formance of 16 Spanish-speaking children. Four measures not
The definition of poor and well performance is floating, and a found in similar studies were: response frequency, longest
line must be drawn somewhere, and the purpose of Support pause, fast responses, and audio plays. However, the game de-
Vectors Machines is to find this optimal line. The benefit and sign limited the applicability of these variables. Therefore, a
perhaps a disadvantage of this approach is that no strict game design requiring more than one answer that allows sev-
thresholds need to be decided for each variable. However, this eral independent variables is suggested. However, there was
binary classification causes a diverse mix of problem-solving not enough evidence to prove poor performance characteris-
behaviors separated into two groups. Of which one group tics between these variables. Though, the analysis was done
contains participants with outlying values. This causes a bi- on children not diagnosed with dyslexia, and the game should
ased selection and could result in a non-desirable outcome, therefore be tested and statistically compared with the target
which emphasizes well-founded selections. But as mentioned group. Even though the game could never be thoroughly eval-
in the interview, every child is different. E.g., one user may uated, the highest accuracy received was 80 percent using a
have many errors but a short completion time, another may linear kernel. However, from the discussion followed that the
have a long duration but a few errors, and a third may have Support Vector Machine may not be the most efficient choice
many errors and a long duration etc. Thus, the binary SVM re- for identifying poor performance as the binary SVM merges
quires a selection process that merges the spectra of various different problem-solving behaviors. Therefore, this paper
problem-solving behaviors. This is going against Mark Hall's suggests that future work should consider multiclassification
[14] definition of good features as various results reduces the algorithms.
correlations to the class, which could reduce the classification
performance. Another approach would be unsupervisedACKNOWLEDGMENTS [13] William S. Noble. 2006. What is a support vector machine?. Nature biotech-
nology 24.12 (2006): 1565-1567.
I want to thank Pontus Österberg for his support and the em- [14] Mark Andrew Hall. 1999. Correlation-based feature selection for machine
ployees at Prototyp for helping with technical issues. I would learning.
also like to thank the people at Neurotalentum and my super- [15] Michael Schwarz, Clémentine Maurice, Daniel Gruss, Stefan Mangard.
2017. Fantastic timers and where to find them: High-resolution microarchitec-
visor Patric Dalhqvist. tural attacks in javascript. International Conference on Financial Cryptography
and Data Security. Springer, Cham.
REFERENCES [16] Anthony Jason and David Francis. 2005. Development of phonological
[1] Eva Germanò, Antonella Gagliano and Paolo Curatolo. 2010 Comorbidity of awareness. Current directions in psychological Science 14.5 (2005): 255-259.
ADHD and dyslexia. Developmental neuropsychology 35, no. 5 (2010): 475- DOI:https://doi.org/10.1111/j.0963-7214.2005.00376.x
493. [17] Claudia Maehler and Kirsten Schuchardt. 2016. Working memory in chil-
[2] American Psychiatric Association. 2013. Diagnostic and statistical manual dren with specific learning disorders and/or attention deficits. Learning and
of mental disorders (DSM-5®). American Psychiatric Pub. Individual Differences 49 (2016): 341-347.
[3] Ombretta Gaggi, Claudio Enrico Palazzi, Matteo Ciman, Giorgia Galiazzo, [18] Andrea Facoetti, Pierluigi Paganoni, Massimo Turatto. Valentina Marzola
Sandro Franceschini, Milena Ruffino, Simone Gori, and Andrea Facoetti. 2017. and Gian Gastone Mascetti. 2000. Visual-spatial attention in developmental dys-
Serious Games for Early Identification of Developmental Dyslexia. Comput. En- lexia." Cortex 36.1 (2000): 109-123. DOI:https://doi.org/10.1016/S0010-
tertain. 15, 2, Article 4 (Summer 2017), 24 pages. 9452(08)70840-2
DOI:https://doi.org/10.1145/2629558 [19] Lynette Bradley and Peter E. Bryant. 1983. Categorizing sounds and learn-
[4] Luz Rello, Miguel Ballesteros, Abdullah Ali, Miquel Serra, Daniela Alarcón ing to read—a causal connection. Nature 301.5899 (1983): 419-421.
Sánchez, Jeffrey P. Bigham. 2016. Dytective: diagnosing risk of dyslexia with a [20] Alexandra Poole, Farhana Zulkernine, and Catherine Aylward. 2017. Lexa:
game. In PervasiveHealth (pp. 89-96). A tool for detecting dyslexia through auditory processing. IEEE Symposium Se-
[5] Maria Rauschenberger, Ricardo Baeza-Yates, and Luz Rello. 2020. Screening ries on Computational Intelligence (SSCI). IEEE,
risk of dyslexia through a web-game using language-independent content and [21] Christopher Sterling, Marion Farmer, Barbara Riddick, Steven Morgan,
machine learning. In Proceedings of the 17th International Web for All Confer- Catherine Matthews.1998. Adult dyslexic writing. Dyslexia, 4(1), 1-15.
ence (W4A '20). Association for Computing Machinery, New York, NY, USA, Ar- [22]. Heikki Lyytinen, Miia Ronimus, Anne Alanko, Anna-Maija Poikkeus & Ma-
ticle 13, 1–12. DOI:https://doi.org/10.1145/3371300.3383342 ria Taanila. 2007. Early identification of dyslexia and the use of computer game-
[6] Voravika Wattanasoontorn, Imma Boada, Rubén García, Mateu Sbert. 2013. based practice to support reading acquisition, Nordic Psychology, 59:2, 109-
Serious games for health. Entertainment Computing 4.4 231-247. 126, DOI: 10.1027/1901-2276.59.2.109
[7] Maria Rauschenberger, Luz Rello, Ricardo Baeza-Yates, and Jeffrey P. [23] Swan, Denise, and Usha Goswami. 1997. Phonological awareness deficits
Bigham. 2018. Towards Language Independent Detection of Dyslexia with a in developmental dyslexia and the phonological representations hypothe-
Web-based Game. In Proceedings of the Internet of Accessible Things (W4A sis." Journal of experimental child psychology 66.1 (1997): 18-41.
'18). Association for Computing Machinery, New York, NY, USA, Article 17, 1– [24] Richard Boada, Erik G. Willcutt, and Bruce F. Pennington. 2012. Under-
10. DOI:https://doi.org/10.1145/3192714.3192816 standing the comorbidity between dyslexia and attention-deficit/hyperactivity
[8] Serrano, Francisca and Sylvia Defior. 2008. Dyslexia speed problems in a disorder. Topics in Language Disorders 32.3 (2012): 264-284.
transparent orthography. Annals of dyslexia 58.1 (2008): 81. [25] Andy Field and Graham Hole. 2003. How to design and report experiments.
[9] Kast, Monika, et al. Computer-based learning of spelling skills in children SAGE Publications, London, 2003.
with and without dyslexia. Annals of dyslexia 61.2 (2011): 177-200. [26] Johannes C. Ziegler, Caroline Castel, Catherine Pech-Georgel, Florence
[10] Luz Rello, Enrique Romero, Maria Rauschenberger, Abdullah Ali, Kristin George, F-Xavier Alario and Conrad Perry. 2008. Developmental dyslexia and
Williams, Jeffrey P. Bigham, and Nancy Cushen White. 2018. Screening Dyslexia the dual route model of reading: Simulating individual differences and sub-
for English Using HCI Measures and Machine Learning. In Proceedings of the types. Cognition 107.1 (2008): 151-178.
2018 International Conference on Digital Health (DH '18). Association for Com- [27] Zachary C Lipton, Charles Elkan, and Balakrishnan Naryanaswamy. 2014.
puting Machinery, New York, NY, USA, 80–84. Optimal thresholding of classifiers to maximize F1 measure. Joint European
DOI:https://doi.org/10.1145/3194658.3194675 Conference on Machine Learning and Knowledge Discovery in Databases.
[11] Iles Jo, Vincent Walsh, and Alex Richardson. 2000. Visual search perfor- Springer, Berlin, Heidelberg.
mance in dyslexia. Dyslexia 6.3 (2000): 163-177. [28] Scikit, 2021, Sklearn.svm.SVC. Retrieved from https://scikit-
learn.org/stable/modules/generated/sklearn.svm.SVC.html#sklearn.svm.SVC
[12] Aleksandar Tenev, Silvana Markovska-Simoska, Ljupco Kocarev, Jordan
[29] Sails.js, 2021, Retrieved from: https://sailsjs.com/
Pop-Jordanov, Andreas MüllerGian and Candrian Tenev. 2014. Machine learn-
[30] Vue.js, 2021, Retrieved from: https://vuejs.org/
ing approach for classification of ADHD adults. International Journal of Psycho-
physiology 93.1. 162-166.TRITA-EECS-EX-2021:116 www.kth.se
You can also read